Embed Size (px)
Citation preview

Proudly supported by Kantar, the Leader in Mobile Marketing Research
January 30-31, 2013
Kuala Lumpur, Malaysia
Asia-Pacific Edition 2013 WWW.MRMW.NET
Organized by
TM
Thank you to our sponsors!
Title Sponsor Platinum Sponsor Gold Sponsors
Silver Sponsor Exhibitor Networking Evening Sponsor Networking Break Sponsor
Association Partners
Media Partners
Adrian Tan K L30th January 2013
ACTIVATING APPS IN MARKET RESEARCHTO GROW BRANDS & BUSINESSES
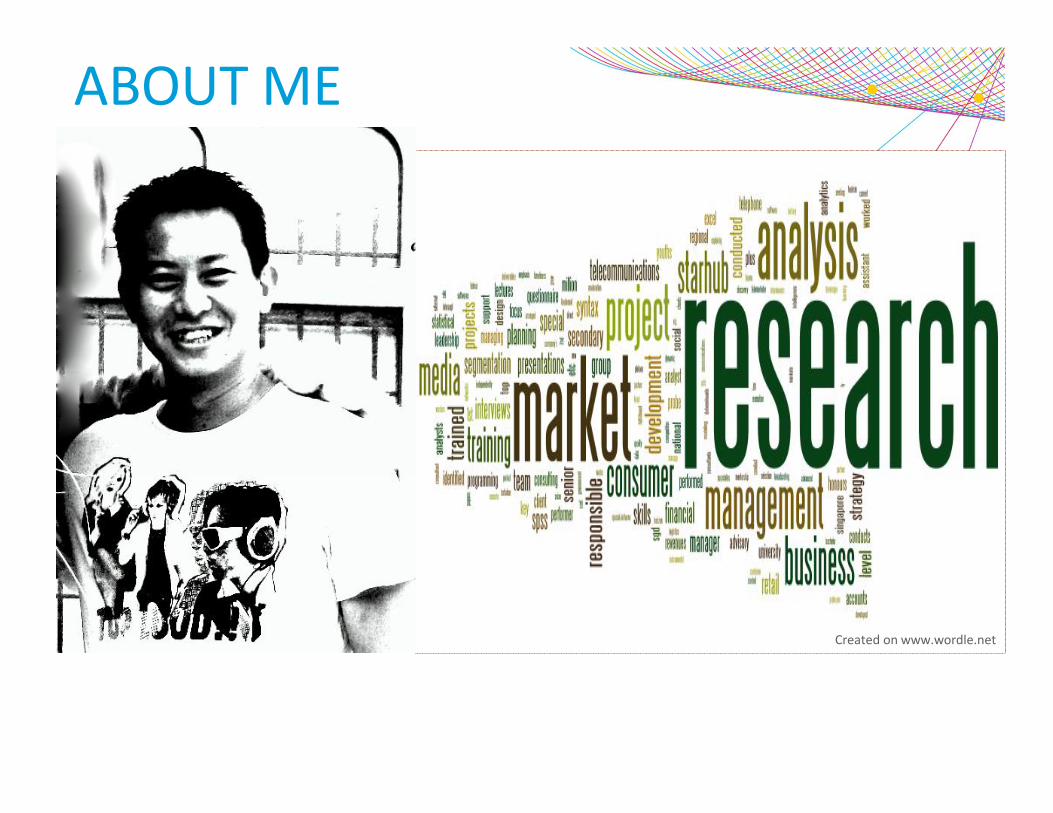
ABOUT ME
Created on www.wordle.net
Copy
right
©20
12 T
he N
iels
en C
ompa
ny. C
onfid
entia
l and
pro
prie
tary
.
3
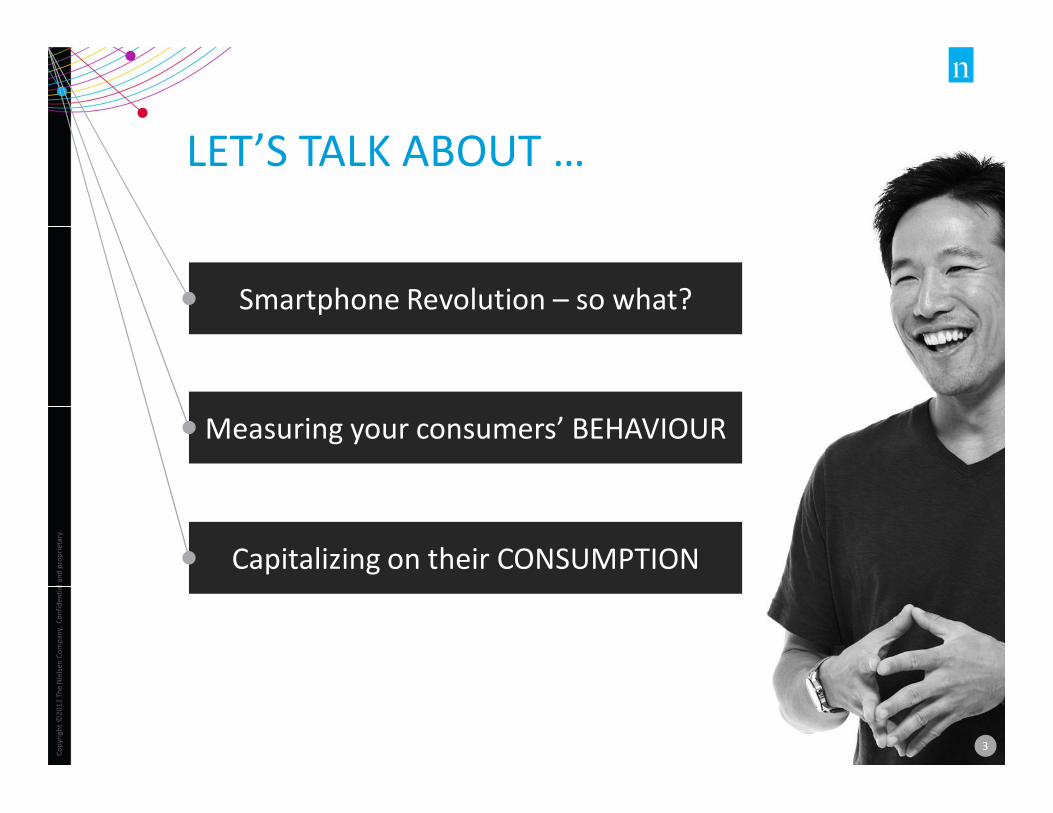
LET’S TALK ABOUT …
Smartphone Revolution – so what?
Measuring your consumers’ BEHAVIOUR
Capitalizing on their CONSUMPTION
3
Copy
right
©20
13 T
he N
iels
en C
ompa
ny. C
onfid
entia
l and
pro
prie
tary
.
4
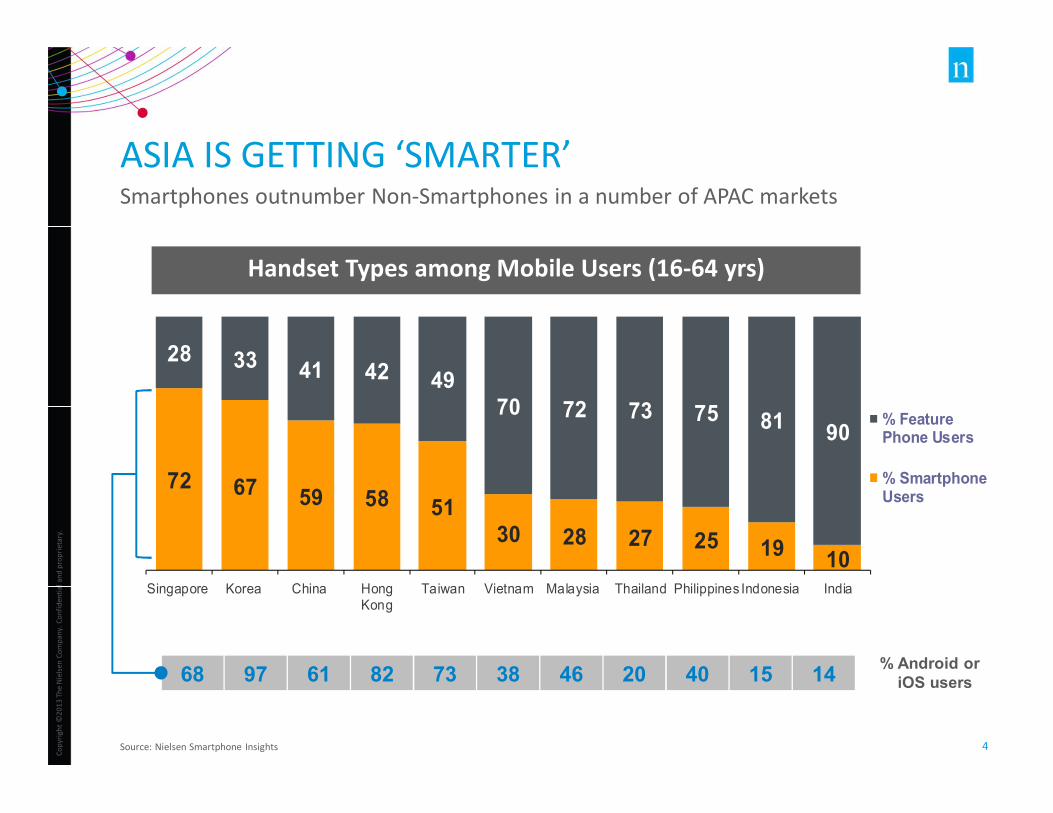
ASIA IS GETTING ‘SMARTER’Smartphones outnumber Non-Smartphones in a number of APAC markets
Source: Nielsen Smartphone Insights
72 67 59 58 5130 28 27 25 19 10
28 33 41 42 4970 72 73 75 81 90
Singapore Korea China HongKong
Taiwan Vietnam Malaysia Thailand Philippines Indonesia India
% FeaturePhone Users
% SmartphoneUsers
68 97 61 82 73 38 46 20 40 15 14 % Android or iOS users
Handset Types among Mobile Users (16-64 yrs)
Copy
right
©20
13 T
he N
iels
en C
ompa
ny. C
onfid
entia
l and
pro
prie
tary
.
5
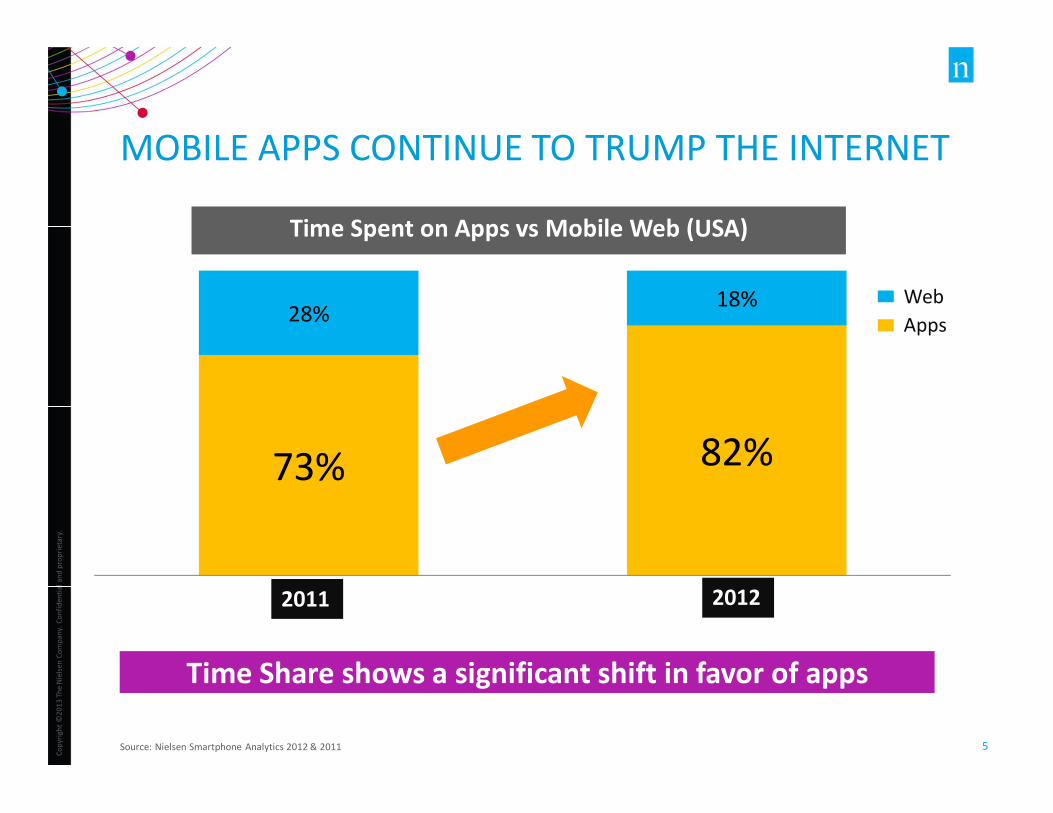
MOBILE APPS CONTINUE TO TRUMP THE INTERNET
Source: Nielsen Smartphone Analytics 2012 & 2011Source: Nielsen Smartphone Analytics
Time Share shows a significant shift in favor of apps
73% 82%
28% 18%
June 11 June 1220122011
Time Spent on Apps vs Mobile Web (USA)
WebApps
Copy
right
©20
13 T
he N
iels
en C
ompa
ny. C
onfid
entia
l and
pro
prie
tary
.
6
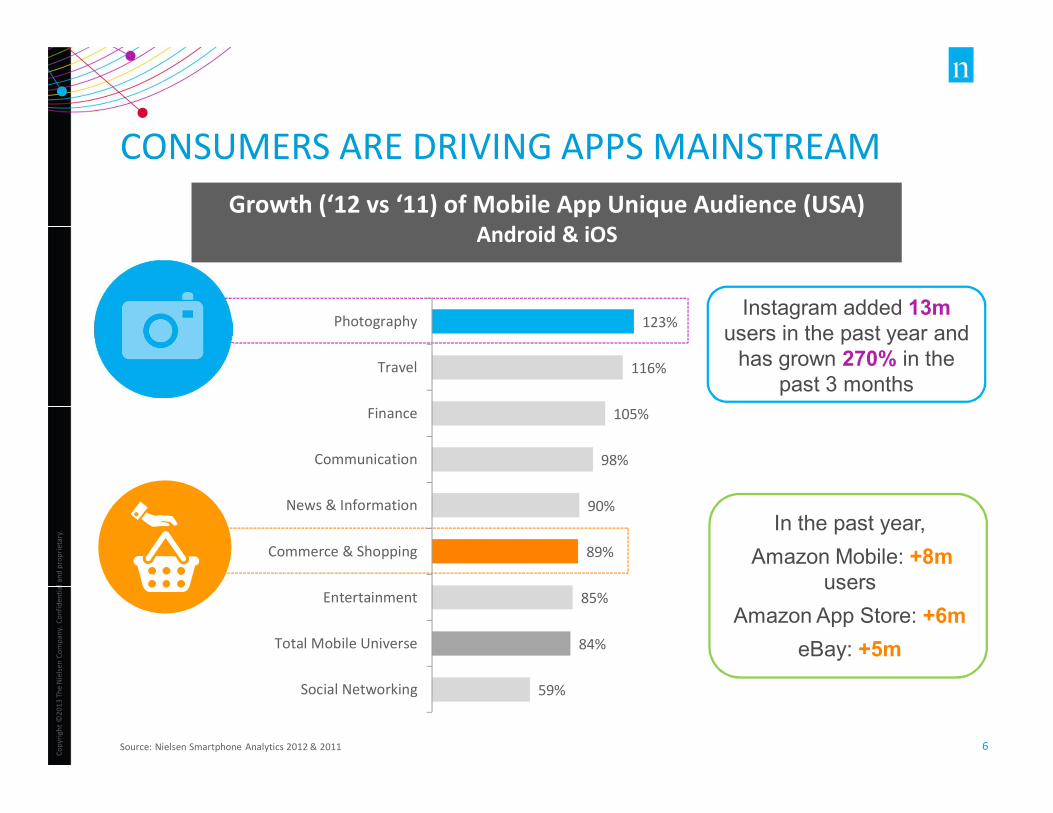
CONSUMERS ARE DRIVING APPS MAINSTREAM
Source: Nielsen Smartphone Analytics 2012 & 2011
Instagram added 13musers in the past year and
has grown 270% in the past 3 months
In the past year,Amazon Mobile: +8m
users Amazon App Store: +6m
eBay: +5m
59%
84%
85%
89%
90%
98%
105%
116%
123%
Social Networking
Total Mobile Universe
Entertainment
Commerce & Shopping
News & Information
Communication
Finance
Travel
Photography
Source: Nielsen Smartphone Analytics
Growth (‘12 vs ‘11) of Mobile App Unique Audience (USA)Android & iOS
Copy
right
©20
13 T
he N
iels
en C
ompa
ny. C
onfid
entia
l and
pro
prie
tary
.
7
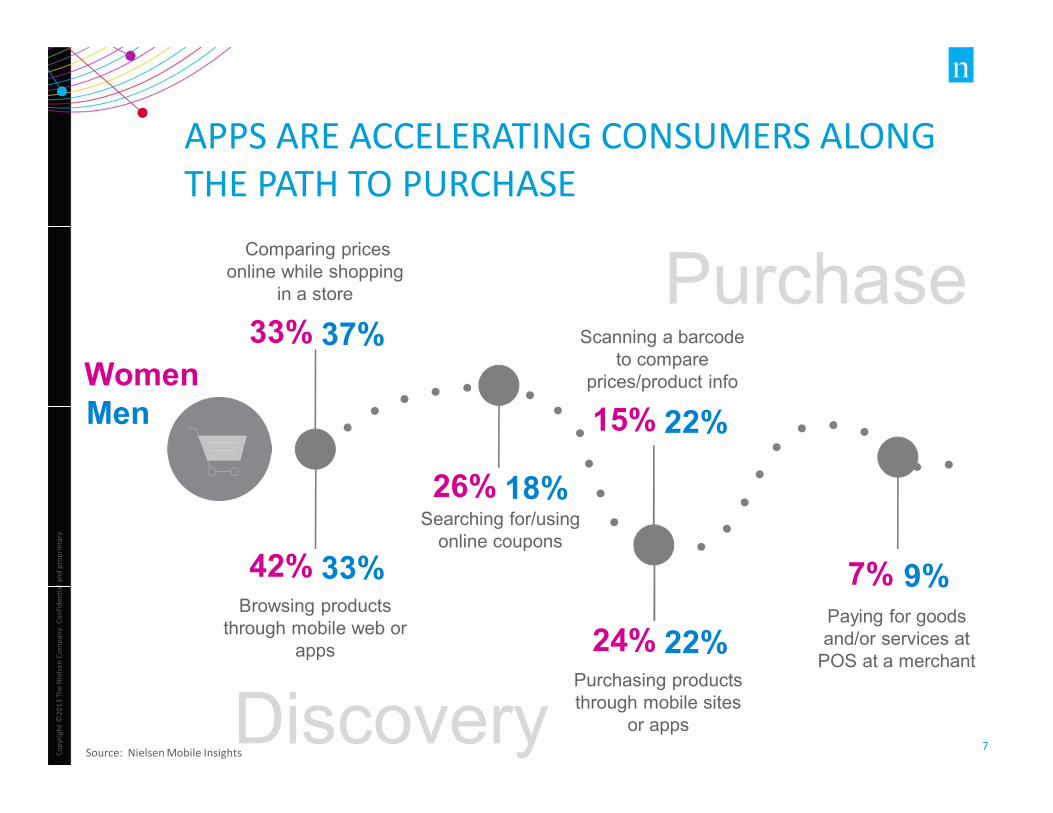
APPS ARE ACCELERATING CONSUMERS ALONG THE PATH TO PURCHASE
Searching for/using online coupons
Comparing prices online while shopping
in a store
Scanning a barcode to compare
prices/product info
Paying for goods and/or services at
POS at a merchant
Discovery
Purchase 33% 37%
Browsing products through mobile web or
apps
42% 33%
26% 18%
15% 22%
7% 9%
Purchasing products through mobile sites
or apps
24% 22%
WomenMen
Source: Nielsen Mobile Insights
Copy
right
©20
12 T
he N
iels
en C
ompa
ny. C
onfid
entia
l and
pro
prie
tary
.
8
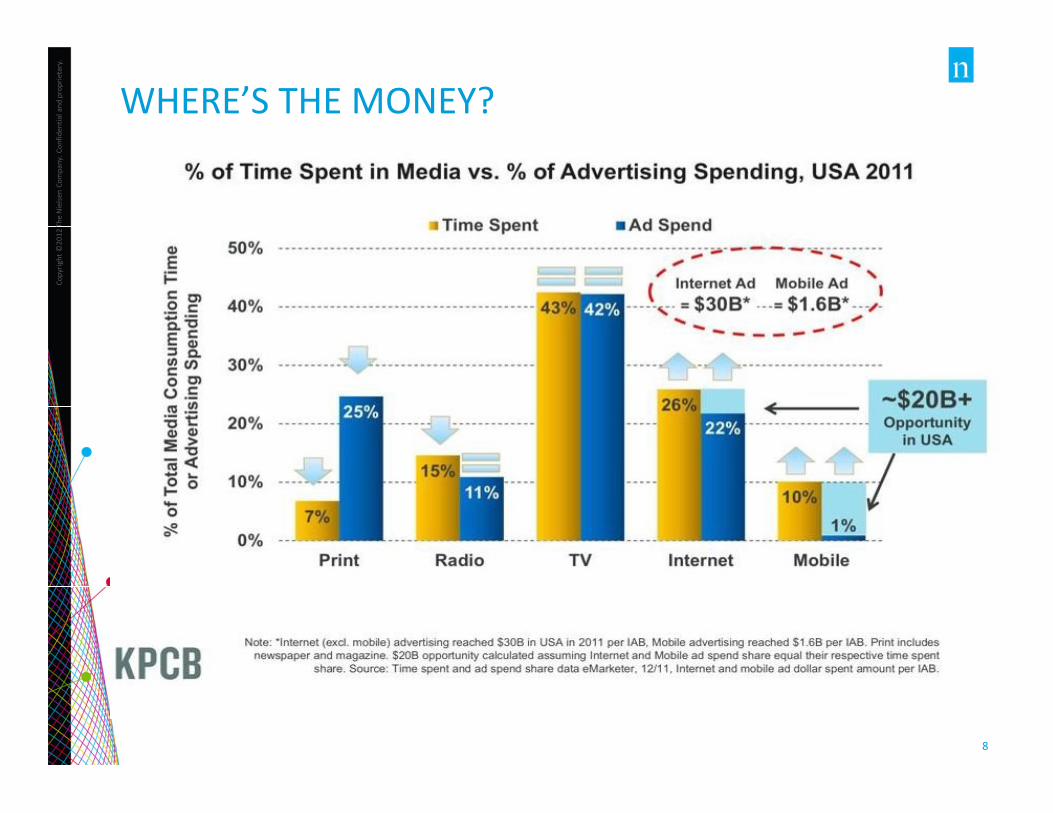
WHERE’S THE MONEY?
Copy
right
©20
12 T
he N
iels
en C
ompa
ny. C
onfid
entia
l and
pro
prie
tary
.
99
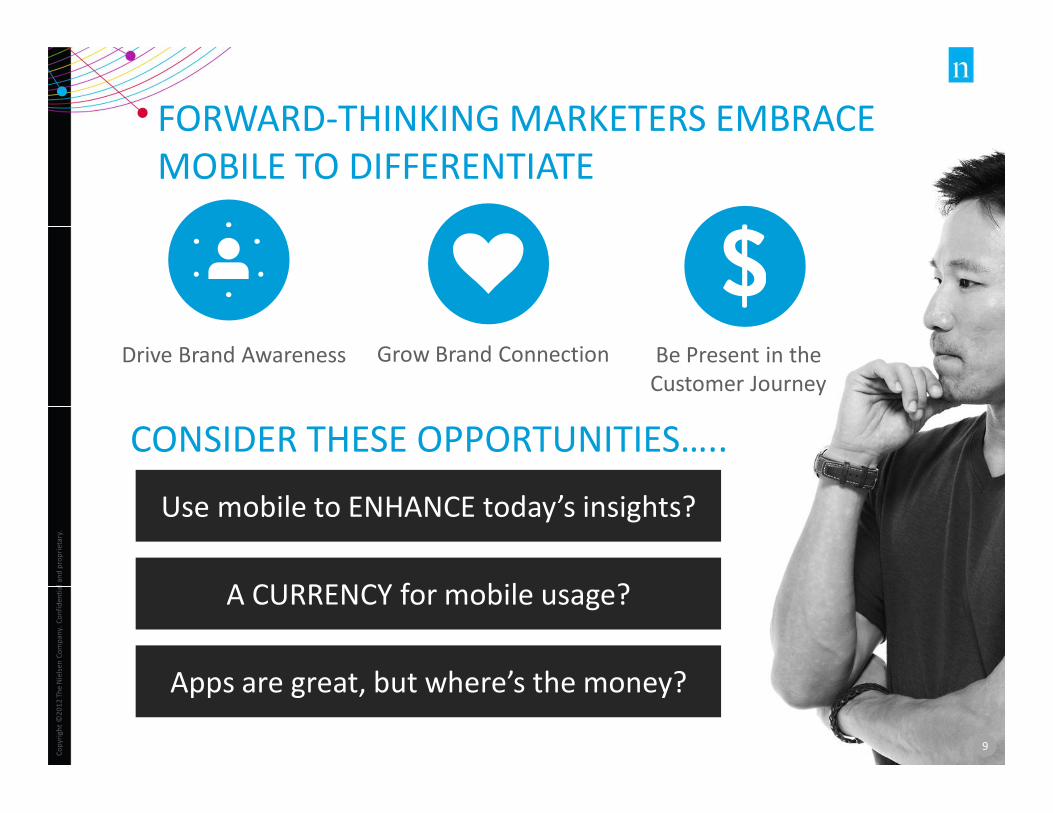
FORWARD-THINKING MARKETERS EMBRACE MOBILE TO DIFFERENTIATE
Drive Brand Awareness Grow Brand Connection Be Present in the Customer Journey
CONSIDER THESE OPPORTUNITIES…..
Use mobile to ENHANCE today’s insights?
Apps are great, but where’s the money?
A CURRENCY for mobile usage?
Copy
right
©20
13 T
he N
iels
en C
ompa
ny. C
onfid
entia
l and
pro
prie
tary
.
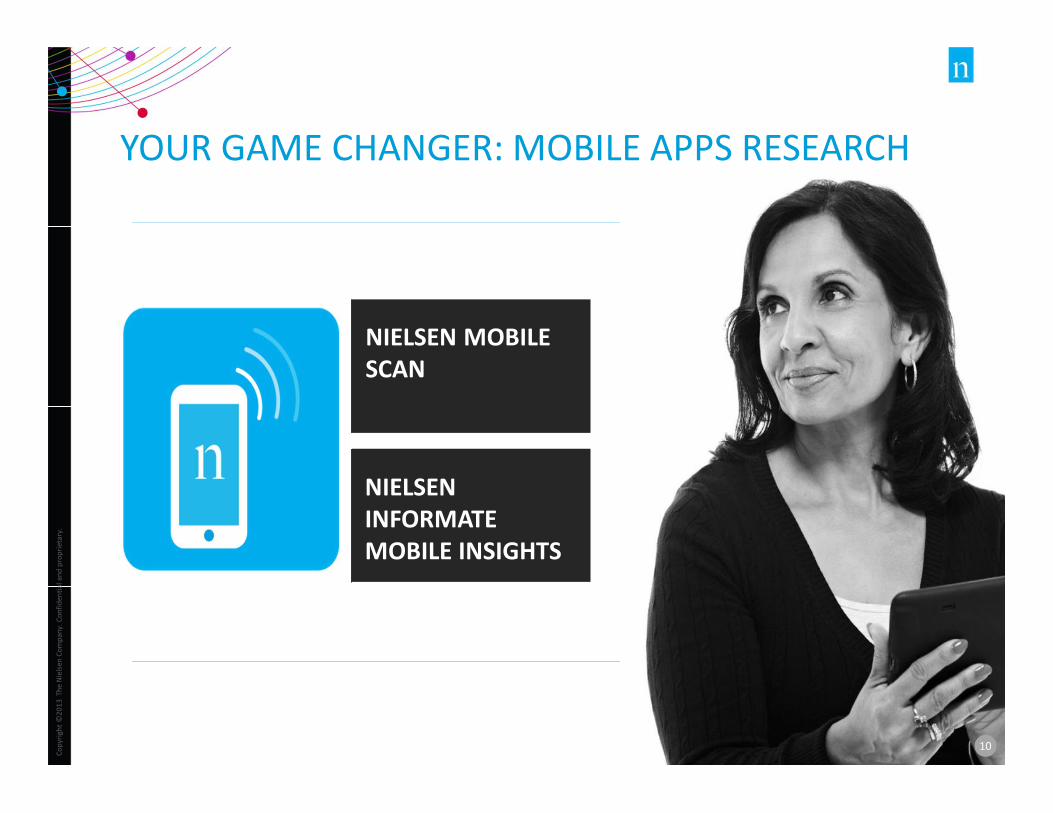
10
YOUR GAME CHANGER: MOBILE APPS RESEARCH
NIELSEN INFORMATE MOBILE INSIGHTS
NIELSEN MOBILE SCAN
10
MOBILESCAN
Copy
right
©20
12 T
he N
iels
en C
ompa
ny. C
onfid
entia
l and
pro
prie
tary
.
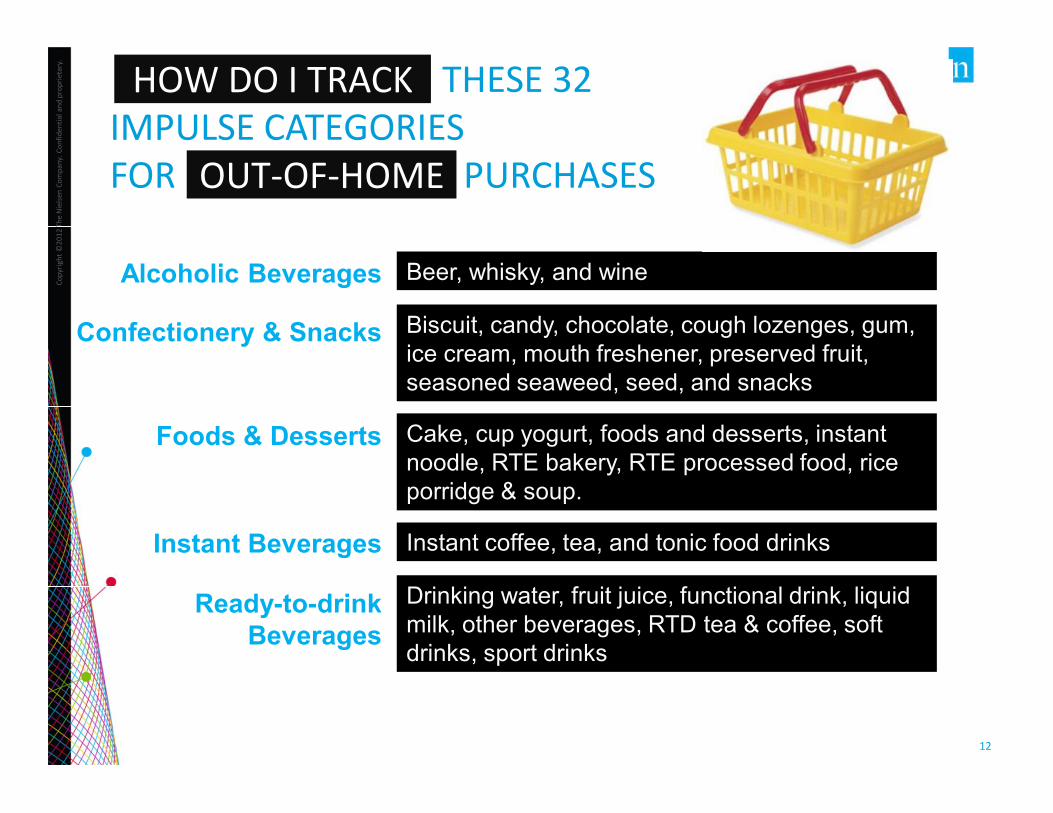
12
THESE 32 IMPULSE CATEGORIES FOR PURCHASES
Alcoholic Beverages
Confectionery & Snacks
Instant Beverages
Foods & Desserts
Ready-to-drink Beverages
Beer, whisky, and wine
Biscuit, candy, chocolate, cough lozenges, gum, ice cream, mouth freshener, preserved fruit, seasoned seaweed, seed, and snacks
Cake, cup yogurt, foods and desserts, instant noodle, RTE bakery, RTE processed food, rice porridge & soup.
Instant coffee, tea, and tonic food drinks
Drinking water, fruit juice, functional drink, liquid milk, other beverages, RTD tea & coffee, soft drinks, sport drinks
HOW DO I TRACK
OUT-OF-HOME
Copy
right
©20
12 T
he N
iels
en C
ompa
ny. C
onfid
entia
l and
pro
prie
tary
.
13
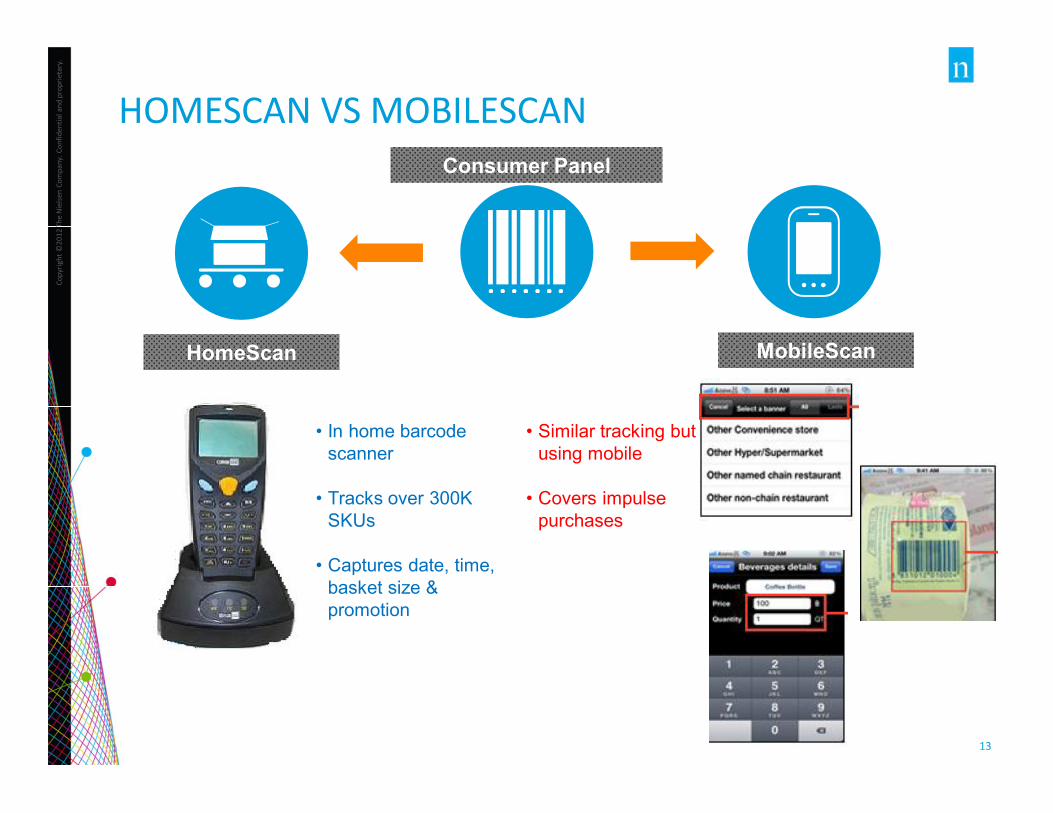
Consumer Panel
• In home barcode scanner
• Tracks over 300K SKUs
• Captures date, time, basket size & promotion
HOMESCAN VS MOBILESCAN
HomeScan MobileScan
• Similar tracking but using mobile
• Covers impulse purchases
Copy
right
©20
12 T
he N
iels
en C
ompa
ny. C
onfid
entia
l and
pro
prie
tary
.
14
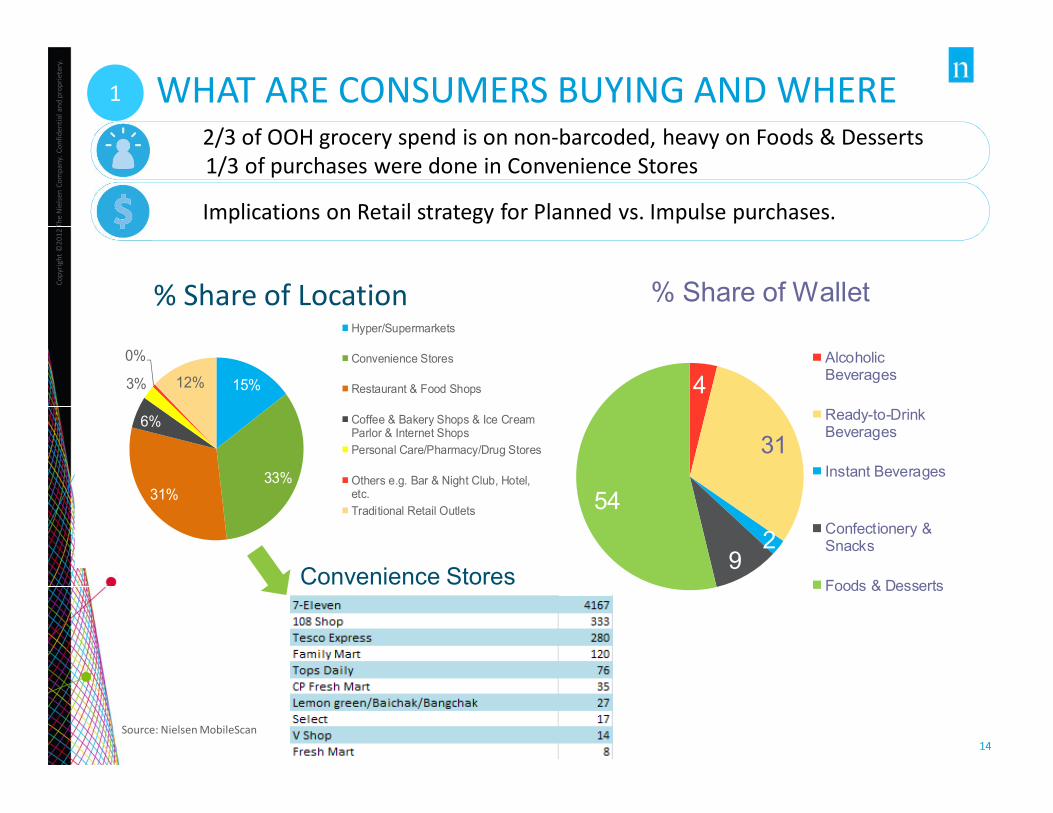
Implications on Retail strategy for Planned vs. Impulse purchases.
2/3 of OOH grocery spend is on non-barcoded, heavy on Foods & Desserts1/3 of purchases were done in Convenience Stores
1 WHAT ARE CONSUMERS BUYING AND WHERE
4
31
29
54
% Share of Wallet
AlcoholicBeverages
Ready-to-DrinkBeverages
Instant Beverages
Confectionery &Snacks
Foods & Desserts
SampleData
15%
33%31%
6%
3%
0%
12%
Hyper/Supermarkets
Convenience Stores
Restaurant & Food Shops
Coffee & Bakery Shops & Ice CreamParlor & Internet ShopsPersonal Care/Pharmacy/Drug Stores
Others e.g. Bar & Night Club, Hotel,etc.Traditional Retail Outlets
% Share of Location
Convenience Stores
Source: Nielsen MobileScan
Copy
right
©20
12 T
he N
iels
en C
ompa
ny. C
onfid
entia
l and
pro
prie
tary
.
15
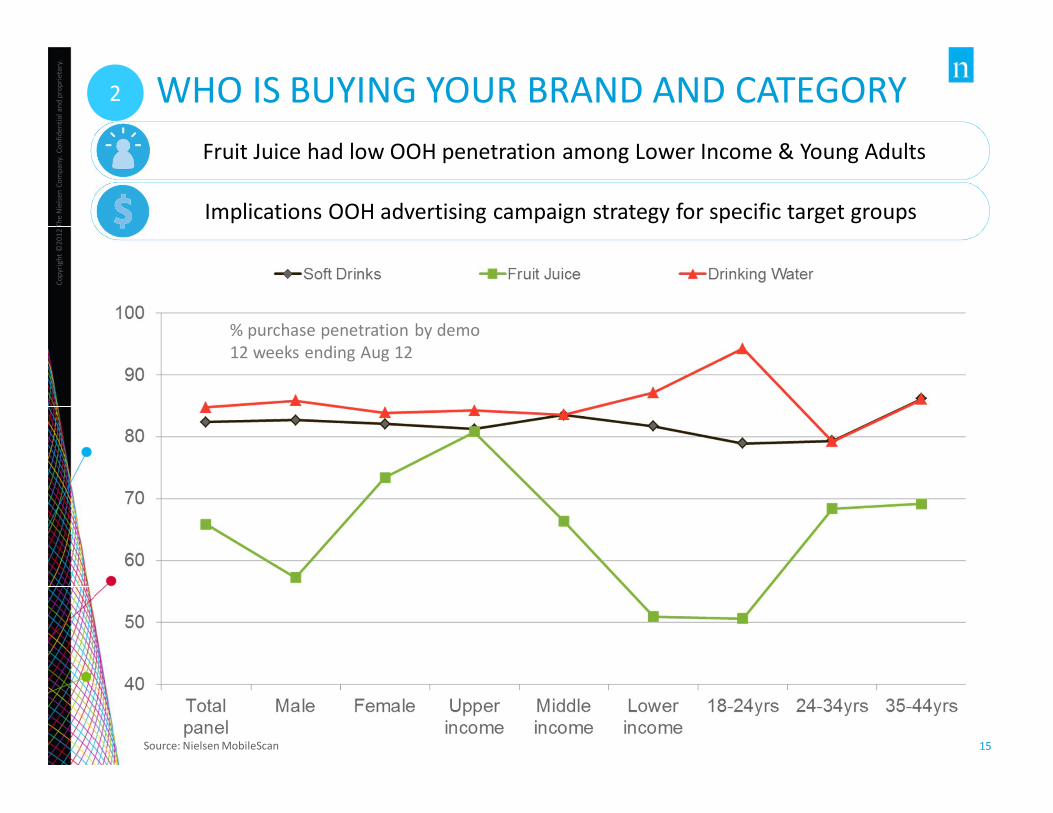
Fruit Juice had low OOH penetration among Lower Income & Young Adults
2 WHO IS BUYING YOUR BRAND AND CATEGORY
% purchase penetration by demo12 weeks ending Aug 12
Implications OOH advertising campaign strategy for specific target groups
Source: Nielsen MobileScan
Copy
right
©20
12 T
he N
iels
en C
ompa
ny. C
onfid
entia
l and
pro
prie
tary
.
16
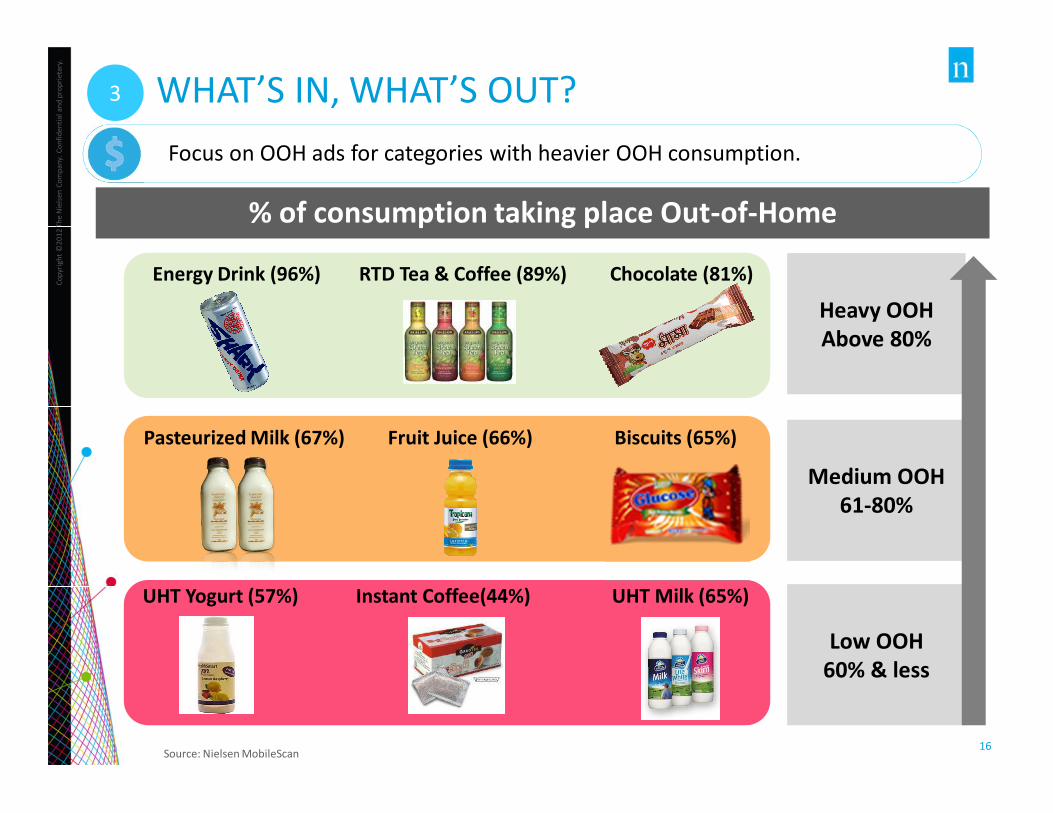
3 WHAT’S IN, WHAT’S OUT? Focus on OOH ads for categories with heavier OOH consumption.
Source: Nielsen MobileScan
% of consumption taking place Out-of-Home
Heavy OOHAbove 80%
Energy Drink (96%) RTD Tea & Coffee (89%) Chocolate (81%)
Medium OOH61-80%
Low OOH60% & less
Pasteurized Milk (67%) Fruit Juice (66%) Biscuits (65%)
UHT Yogurt (57%) Instant Coffee(44%) UHT Milk (65%)
MOBILE INSIGHTS
Copy
right
©20
12 T
he N
iels
en C
ompa
ny. C
onfid
entia
l and
pro
prie
tary
.
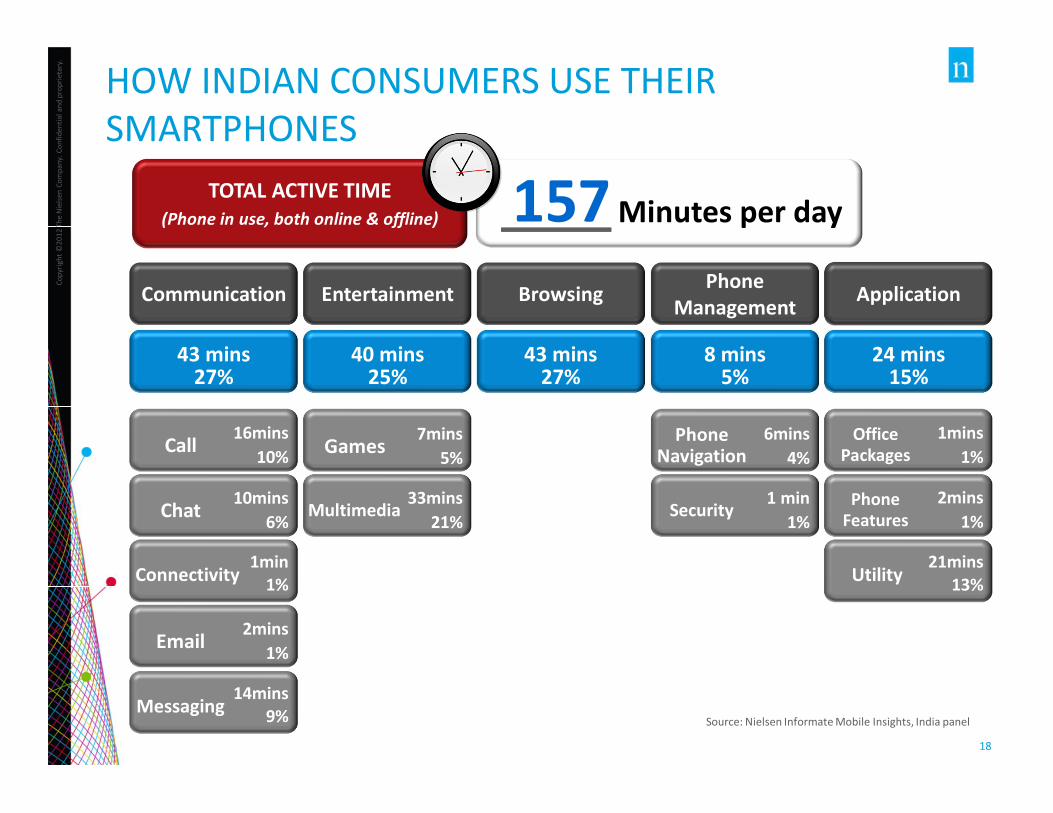
18
TOTAL ACTIVE TIME (Phone in use, both online & offline) Minutes per day
Source: Nielsen Informate Mobile Insights, India panel
157
HOW INDIAN CONSUMERS USE THEIR SMARTPHONES
Call 16mins10%
Chat 10mins6%
Connectivity1min
1%
Email 2mins1%
Messaging14mins
9%
Communication
Games 7mins5%
Multimedia33mins
21%
Entertainment Browsing
Phone Navigation
6mins4%
Security1 min
1%
Phone Management
Office Packages
1mins1%
Utility21mins
13%
Application
43 mins27%
40 mins25%
43 mins27%
8 mins5%
24 mins15%
Phone Features
2mins1%
Copy
right
©20
12 T
he N
iels
en C
ompa
ny. C
onfid
entia
l and
pro
prie
tary
.
1919
UNPARRALLELED SMARTPHONE METERING CAPABILITY
On-Device Meter 24/7 Accurate
GENERATING INSIGHTS SINCE 2009
Copy
right
©20
12 T
he N
iels
en C
ompa
ny. C
onfid
entia
l and
pro
prie
tary
.
20
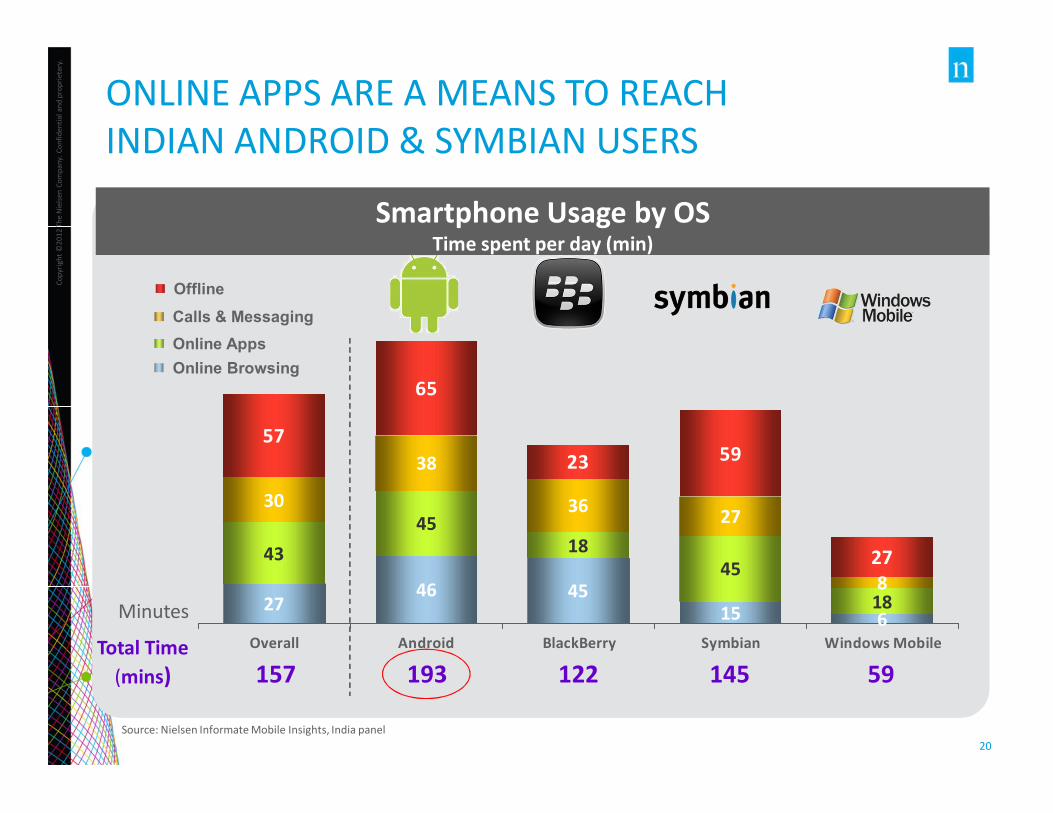
2746 45
15 6
4345
1845
18
30
38
36 27
8
5723 59
27
65
Overall Android BlackBerry Symbian Windows Mobile
Online BrowsingOnline AppsCalls & MessagingOffline
Minutes
Total Time(mins) 157 193 122 145 59
ONLINE APPS ARE A MEANS TO REACH INDIAN ANDROID & SYMBIAN USERS
Smartphone Usage by OSTime spent per day (min)
Source: Nielsen Informate Mobile Insights, India panel
Copy
right
©20
12 T
he N
iels
en C
ompa
ny. C
onfid
entia
l and
pro
prie
tary
.
21
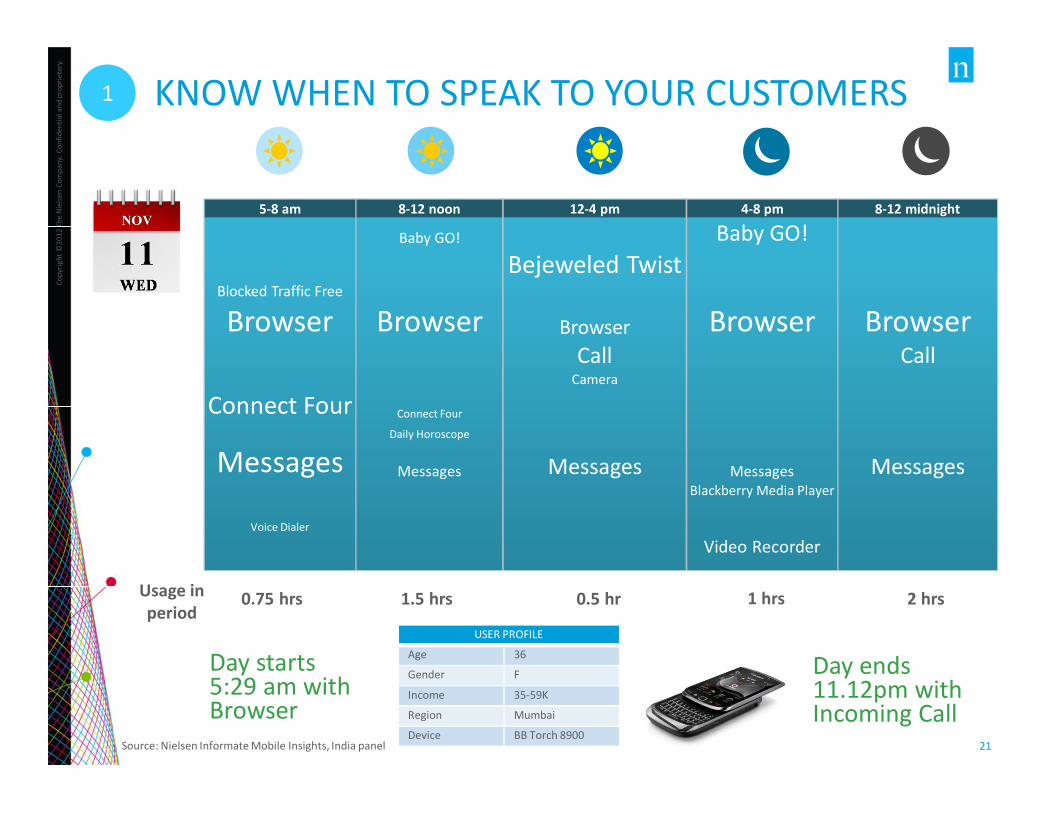
Day starts 5:29 am with Browser
Day ends 11.12pm with Incoming Call
Usage in period
0.75 hrs 1.5 hrs 0.5 hr 1 hrs 2 hrs
5-8 am 8-12 noon 12-4 pm 4-8 pm 8-12 midnight
Baby GO! Baby GO!Bejeweled Twist
Blocked Traffic Free
Browser Browser Browser Browser BrowserCall Call
Camera
Connect Four Connect Four
Daily Horoscope
Messages Messages Messages Messages MessagesBlackberry Media Player
Voice Dialer
Video Recorder
1 KNOW WHEN TO SPEAK TO YOUR CUSTOMERS
USER PROFILE
Age 36
Gender F
Income 35-59K
Region Mumbai
Device BB Torch 8900Source: Nielsen Informate Mobile Insights, India panel
Copy
right
©20
12 T
he N
iels
en C
ompa
ny. C
onfid
entia
l and
pro
prie
tary
.
22
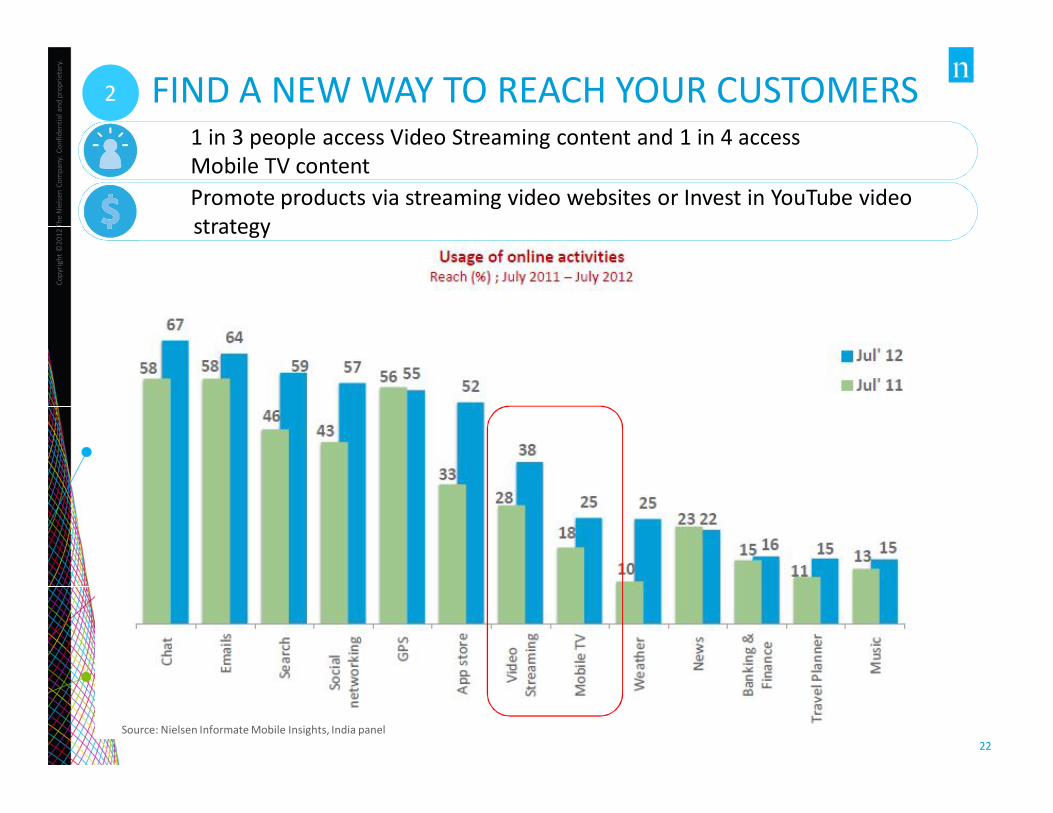
Promote products via streaming video websites or Invest in YouTube video strategy
1 in 3 people access Video Streaming content and 1 in 4 access Mobile TV content
2 FIND A NEW WAY TO REACH YOUR CUSTOMERS
Source: Nielsen Informate Mobile Insights, India panel
Copy
right
©20
12 T
he N
iels
en C
ompa
ny. C
onfid
entia
l and
pro
prie
tary
.
23
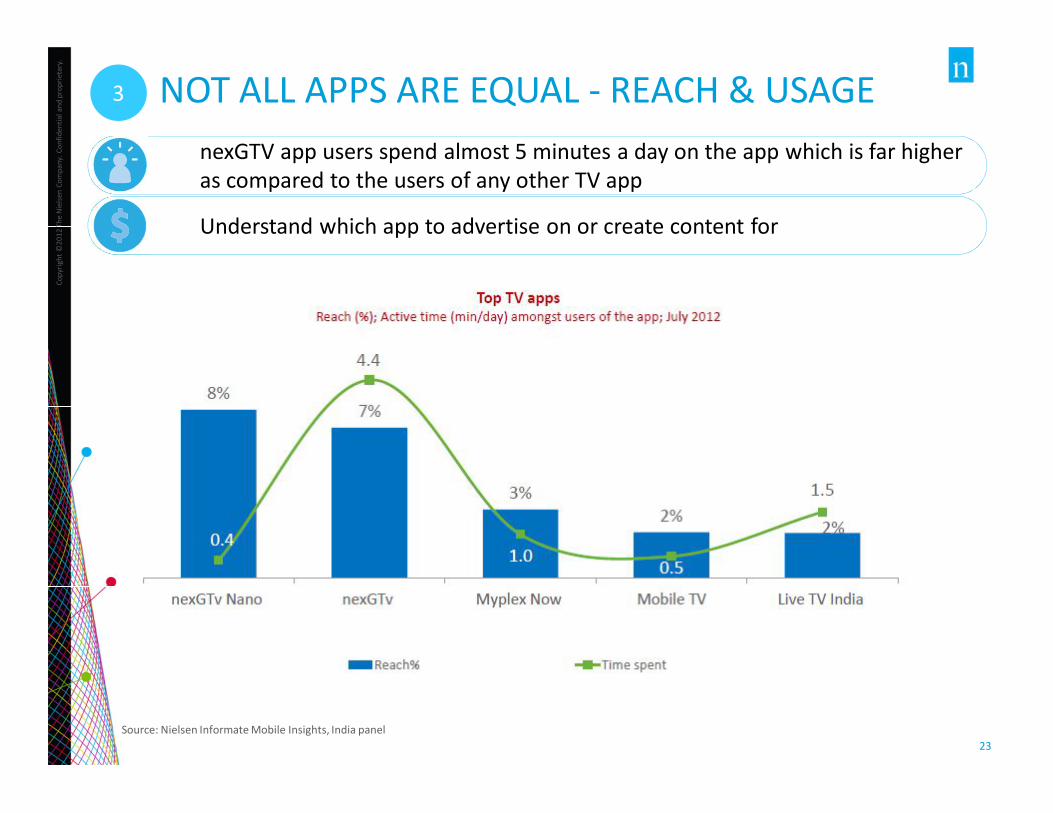
Understand which app to advertise on or create content for
nexGTV app users spend almost 5 minutes a day on the app which is far higher as compared to the users of any other TV app
3 NOT ALL APPS ARE EQUAL - REACH & USAGE
Source: Nielsen Informate Mobile Insights, India panel
Copy
right
©20
12 T
he N
iels
en C
ompa
ny. C
onfid
entia
l and
pro
prie
tary
.
24
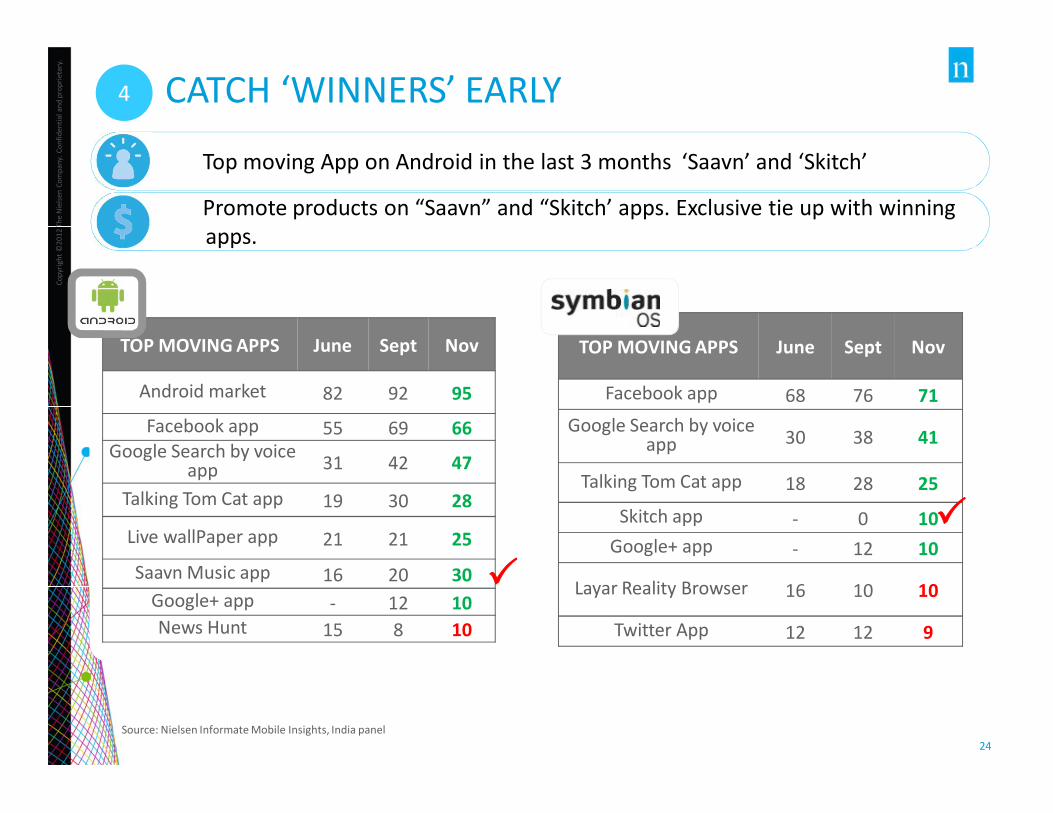
TOP MOVING APPS June Sept Nov
Android market 82 92 95
Facebook app 55 69 66Google Search by voice
app 31 42 47
Talking Tom Cat app 19 30 28
Live wallPaper app 21 21 25
Saavn Music app 16 20 30Google+ app - 12 10News Hunt 15 8 10
TOP MOVING APPS June Sept Nov
Facebook app 68 76 71Google Search by voice
app 30 38 41
Talking Tom Cat app 18 28 25
Skitch app - 0 10Google+ app - 12 10
Layar Reality Browser 16 10 10
Twitter App 12 12 9
P
P
Promote products on “Saavn” and “Skitch’ apps. Exclusive tie up with winning apps.
Top moving App on Android in the last 3 months ‘Saavn’ and ‘Skitch’
4 CATCH ‘WINNERS’ EARLY
Source: Nielsen Informate Mobile Insights, India panel
Copy
right
©20
12 T
he N
iels
en C
ompa
ny. C
onfid
entia
l and
pro
prie
tary
.
2525
LEARNINGS
IT’S NOT JUST THE APPS IT’S THE PANELS
1+1 is >2INTEGRATION IS KEY
LEVERAGING THE DATA: AN (UN)EXPECTED JOURNEY
BEYOND THE COMFORT ZONE: BELIEVE IN FUSION
Copy
right
©20
12 T
he N
iels
en C
ompa
ny. C
onfid
entia
l and
pro
prie
tary
.
26
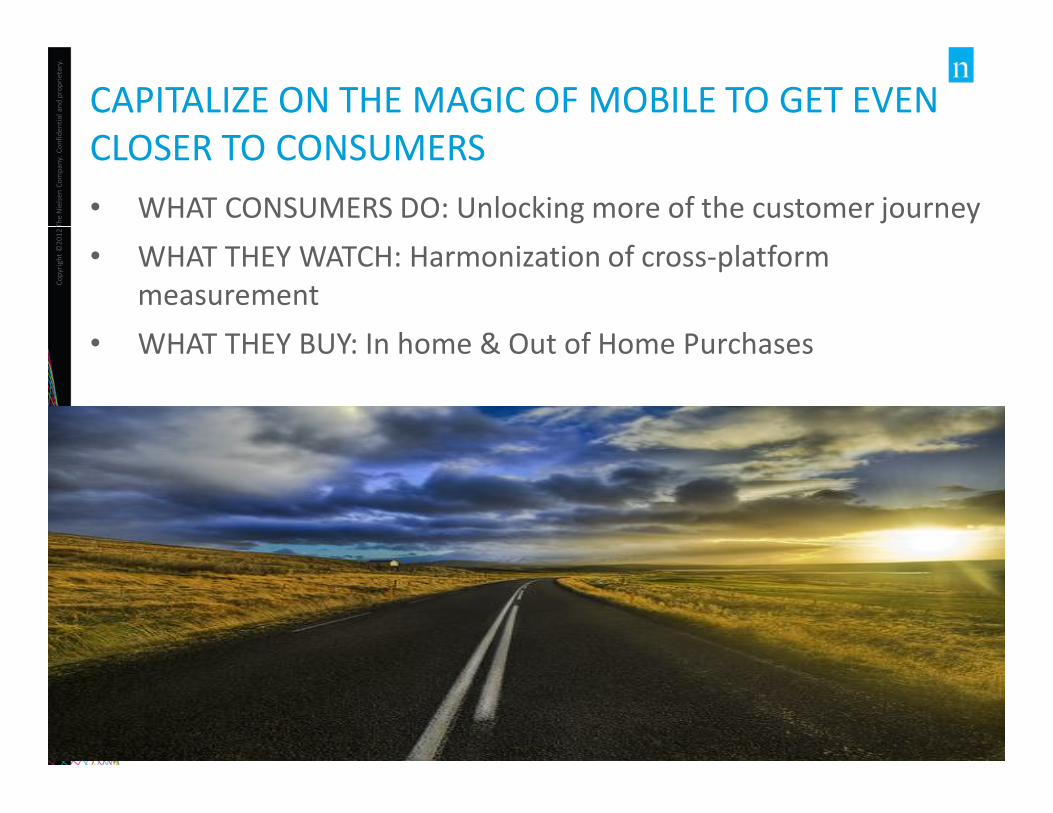
CAPITALIZE ON THE MAGIC OF MOBILE TO GET EVEN CLOSER TO CONSUMERS • WHAT CONSUMERS DO: Unlocking more of the customer journey• WHAT THEY WATCH: Harmonization of cross-platform
measurement • WHAT THEY BUY: In home & Out of Home Purchases
Copy
right
©20
12 T
he N
iels
en C
ompa
ny. C
onfid
entia
l and
pro
prie
tary
.
27
Thank youAdrian TanEmail: [email protected]: AdrianTanKL

Thank you to our sponsors!
Title Sponsor Platinum Sponsor Gold Sponsors
Silver Sponsor Exhibitor Networking Evening Sponsor Networking Break Sponsor
Association Partners
Media Partners
Proudly supported by Kantar, the Leader in Mobile Marketing Research
January 30-31, 2013
Kuala Lumpur, Malaysia
Asia-Pacific Edition 2013 WWW.MRMW.NET
Organized by
TM