Embed Size (px)
Citation preview
Sponsored by XSInc
Achieve the Potential of Variable Rate Irrigation
Chad Godsey, PhD
Precision Ag Insight Webinar
March 9, 2016
Sponsored by XSInc
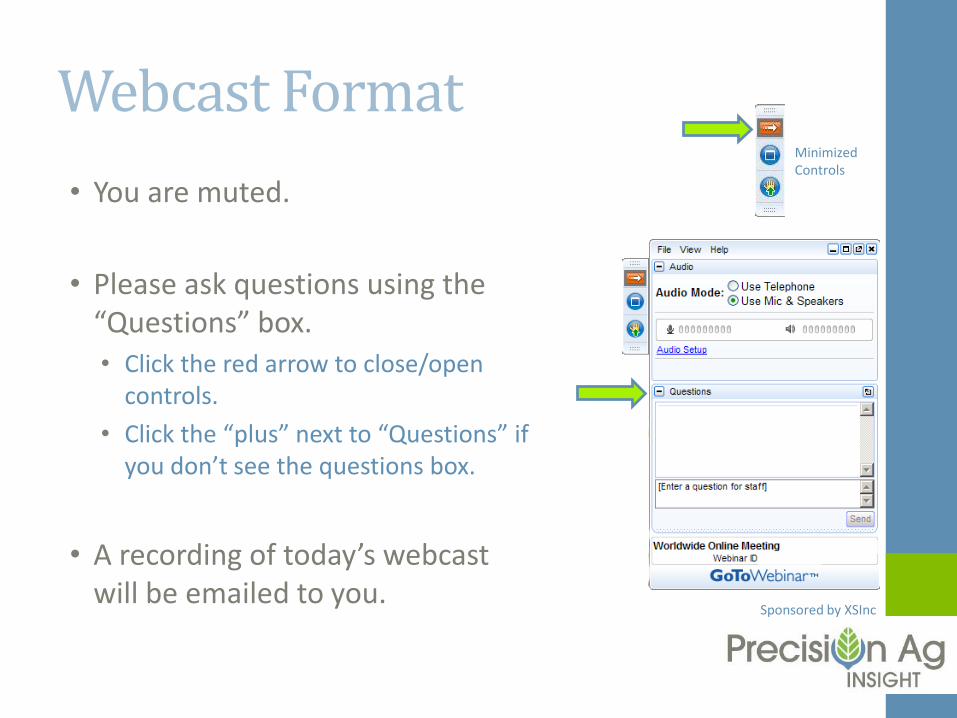
Webcast Format
• You are muted.
• Please ask questions using the “Questions” box.• Click the red arrow to close/open
controls.
• Click the “plus” next to “Questions” if you don’t see the questions box.
• A recording of today’s webcast will be emailed to you.
Minimized Controls

Sponsored by XSInc
Speakers
PresenterDr. Chad GodseyOwner, Godsey Precision Ag
HostBen GistBusiness Development Analyst, XS Inc
Sponsored by XSInc
Overview
VRI Systems and the basics
Case Study
Sponsored by XSInc
Registration Question
• Have you or your growers used variable rate irrigation or performed irrigation trials?
Sponsored by XSInc
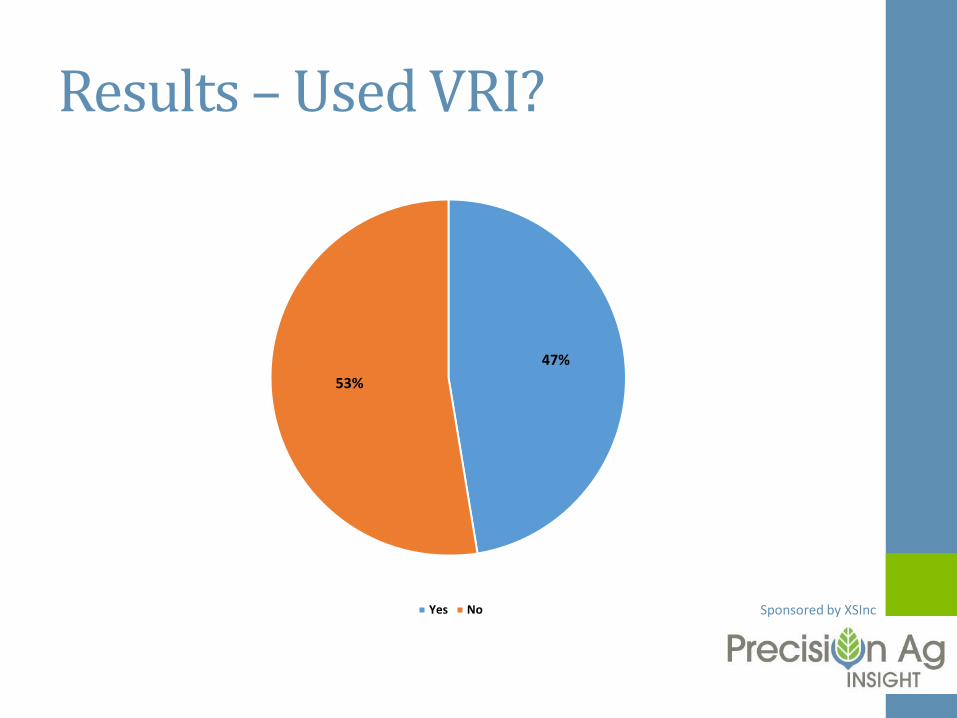
Results –Used VRI?
47%
53%
Yes No
Sponsored by XSInc
VRI
• Effectively evaluating variable rate irrigation (VRI) is much more difficult to do when compared to variable rate seeding or fertilizer applications. The complexity comes from trying to include an adequate “check” or reference strip to be able to compare your variable rate irrigation treatments against.
Sponsored by XSInc
VRI Systems
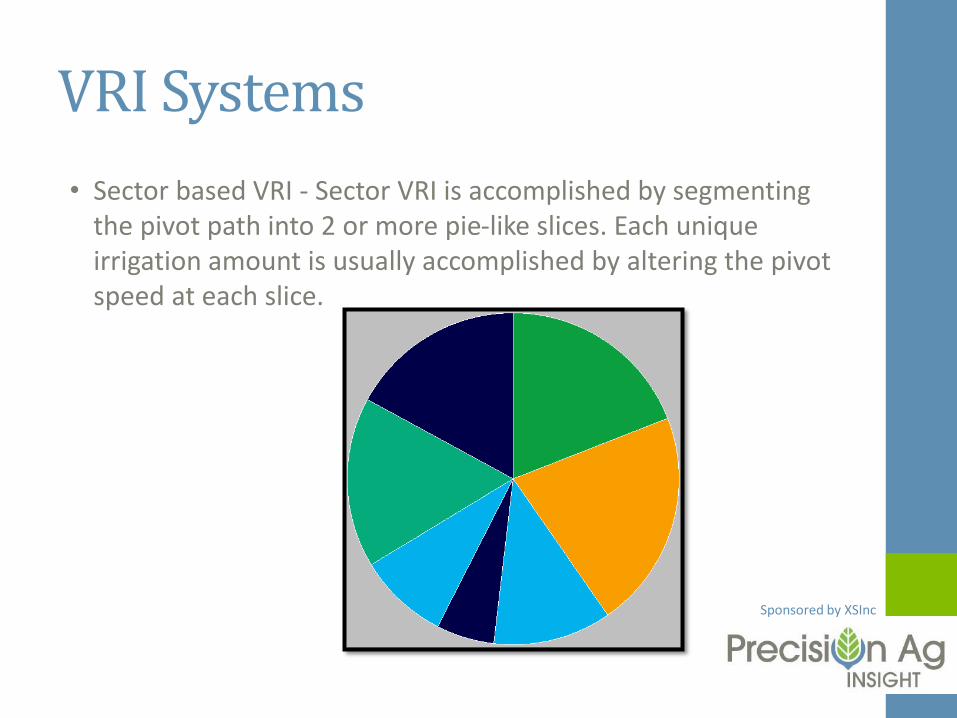
• Sector based VRI - Sector VRI is accomplished by segmenting the pivot path into 2 or more pie-like slices. Each unique irrigation amount is usually accomplished by altering the pivot speed at each slice.
Sponsored by XSInc
VRI Systems
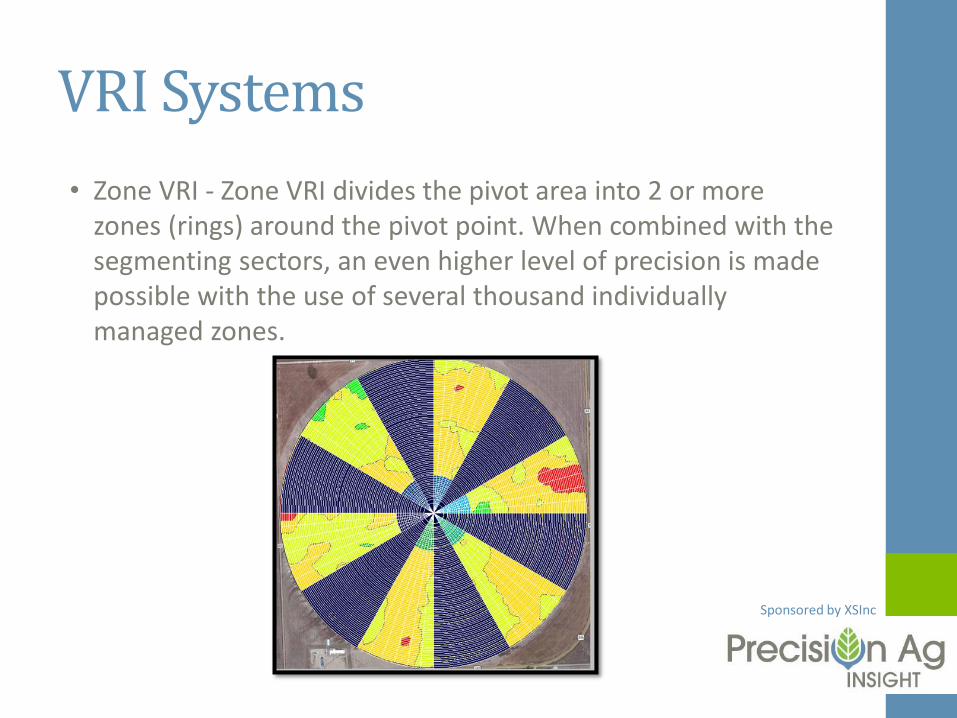
• Zone VRI - Zone VRI divides the pivot area into 2 or more zones (rings) around the pivot point. When combined with the segmenting sectors, an even higher level of precision is made possible with the use of several thousand individually managed zones.
Sponsored by XSInc
VRI Systems
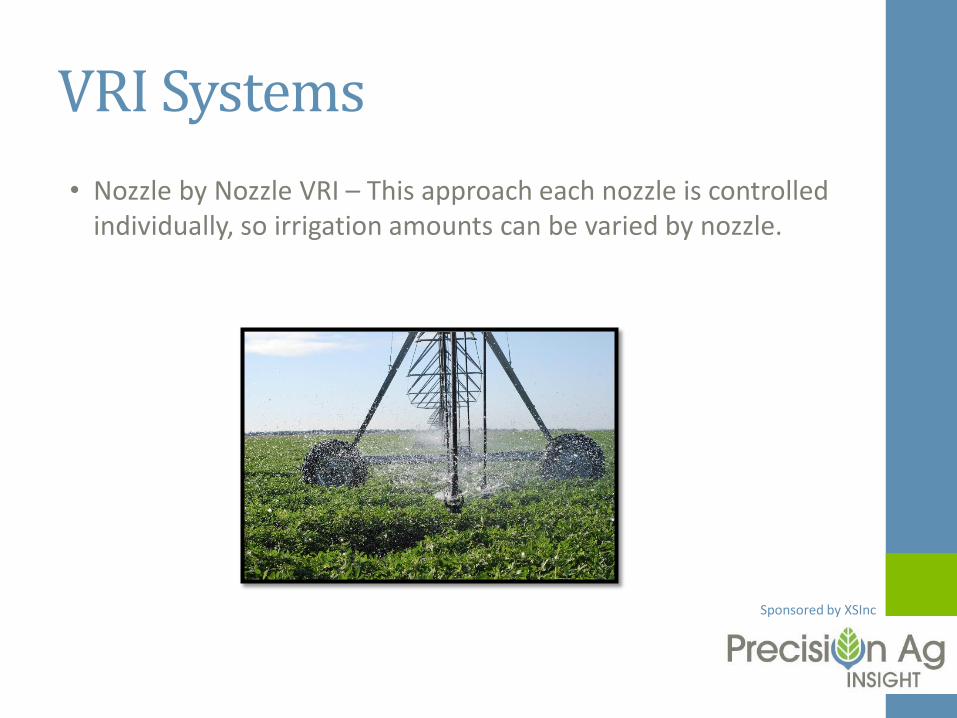
• Nozzle by Nozzle VRI – This approach each nozzle is controlled individually, so irrigation amounts can be varied by nozzle.
Sponsored by XSInc
Delineating Zones
• Similar approaches to seeding of N zones
• EC
• EM
• Slope
• Soil Texture
• Multi-year Yield History
Sponsored by XSInc
Evaluating Sector based VRI
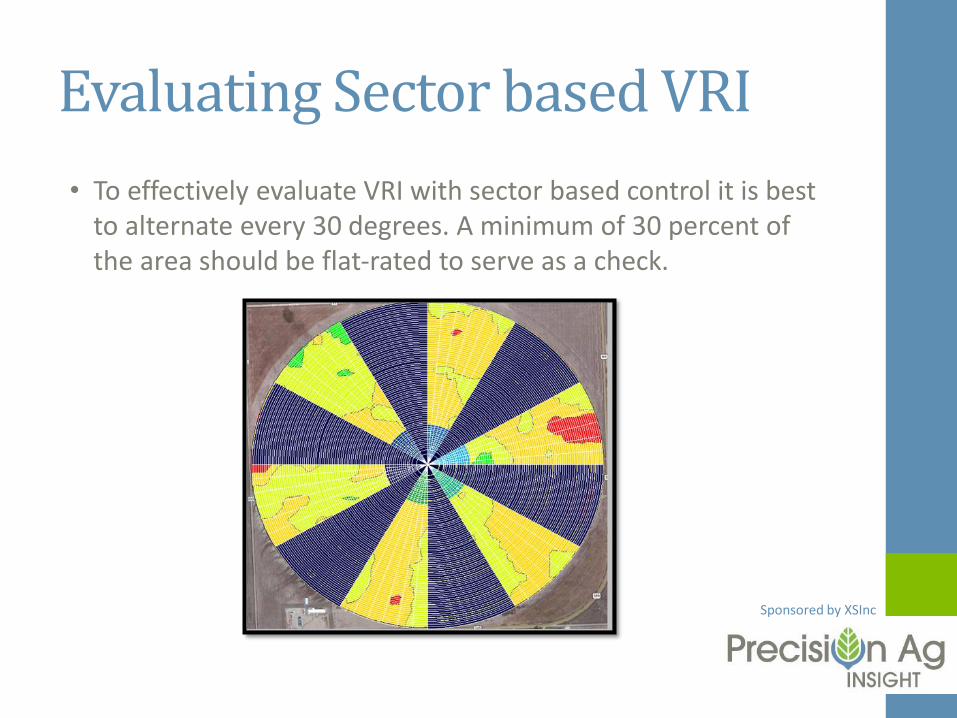
• To effectively evaluate VRI with sector based control it is best to alternate every 30 degrees. A minimum of 30 percent of the area should be flat-rated to serve as a check.
Sponsored by XSInc
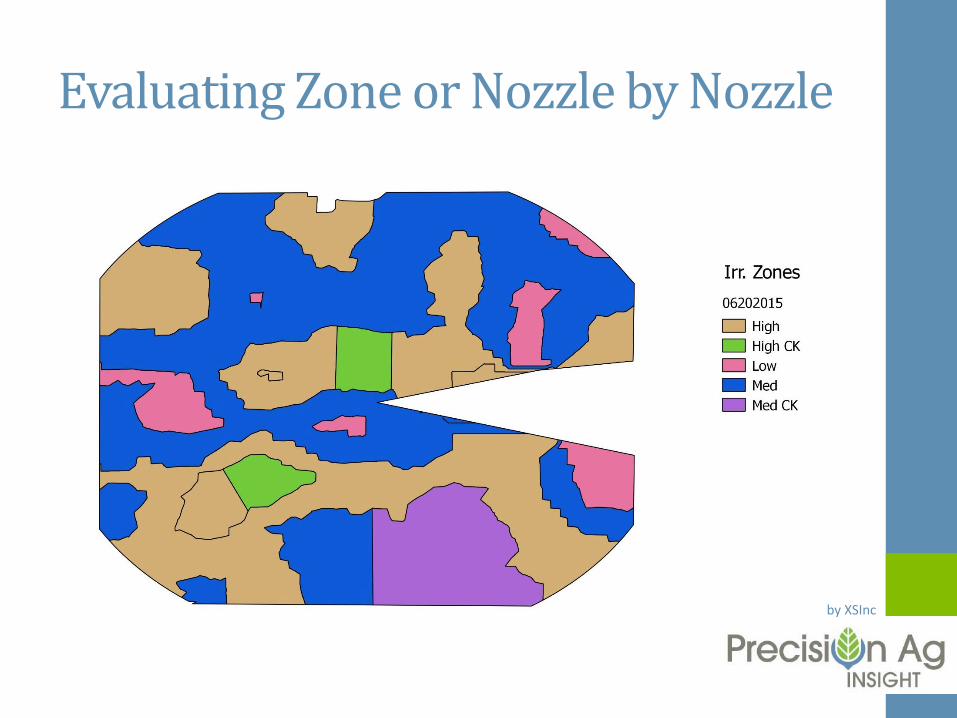
Evaluating Zone or Nozzle by Nozzle
• Determine type of file format
• Some systems will accept a shapefile while others will only accept .xml file types.
• Maintain at least 20-30 percent of the area in the field as a check.
• This 20-30 percent should not be contiguous, instead it should be spread out throughout the field.
• Keep in mind that with VRI the application is not as precise as with fertilizer application equipment. The edges of the zones may receive overthrow from neighboring nozzles or runoff so check zones have to relatively large (>2 ac).
Sponsored by XSInc
Evaluating Zone or Nozzle by Nozzle
Sponsored by XSInc
Other data to collect
• Soil moisture data from as many zones as possible if soil moisture probes are being used to help schedule irrigation.
• Collect irrigation amounts and rainfall from rain gauges if possible.
• Any other observations that may have impacted yield.
Sponsored by XSInc
Registration Question
• What percentage of your growers are actively using soil moisture sensors?
Sponsored by XSInc
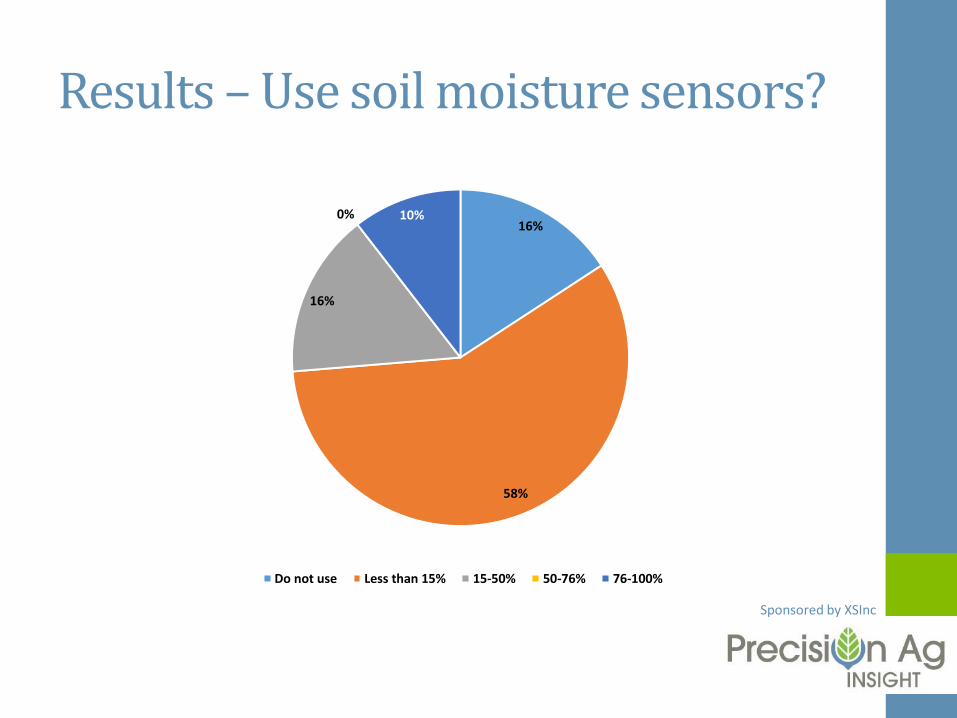
Results –Use soil moisture sensors?
16%
58%
16%
0% 10%
Do not use Less than 15% 15-50% 50-76% 76-100%
Sponsored by XSInc
Registration Question
• How do your growers use soil moisture data for management decisions?
Sponsored by XSInc
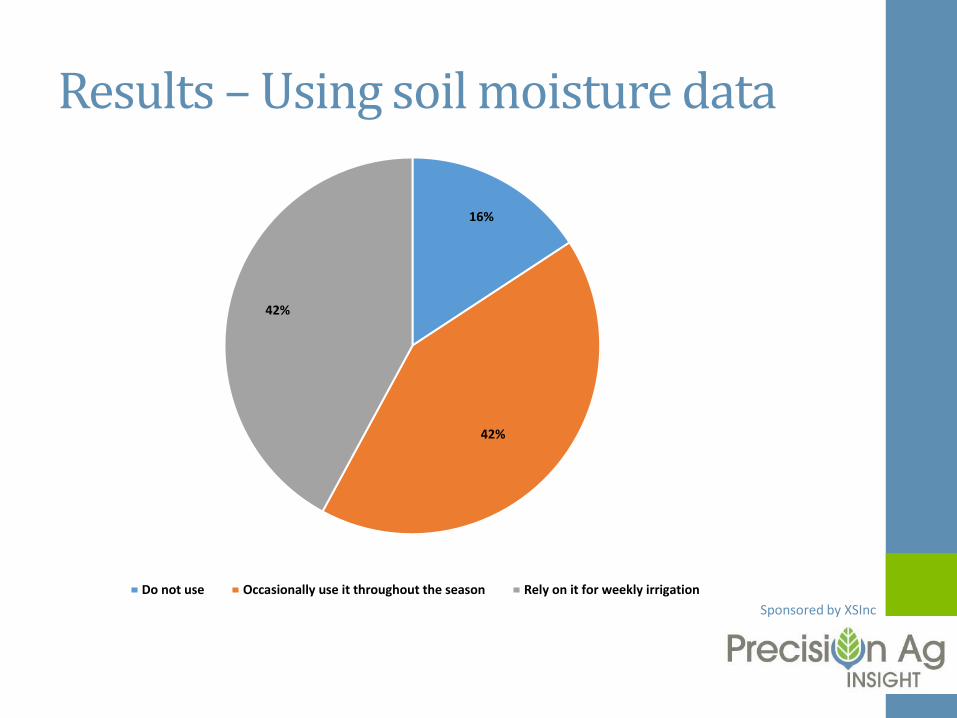
Results –Using soil moisture data
16%
42%
42%
Do not use Occasionally use it throughout the season Rely on it for weekly irrigation
Sponsored by XSInc
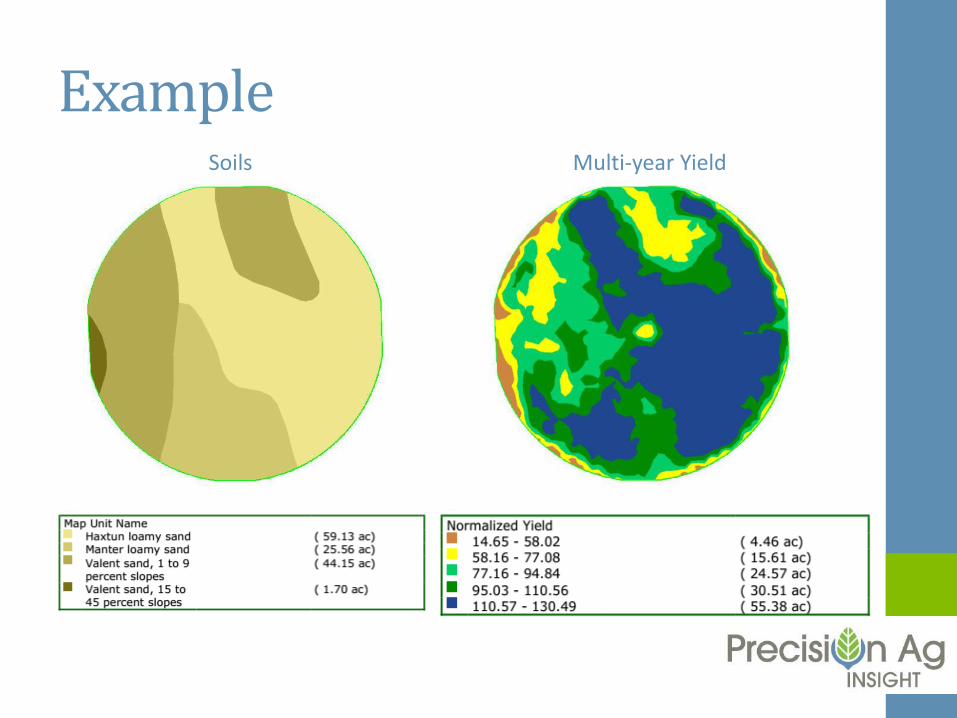
ExampleSoils Multi-year Yield
Sponsored by XSInc
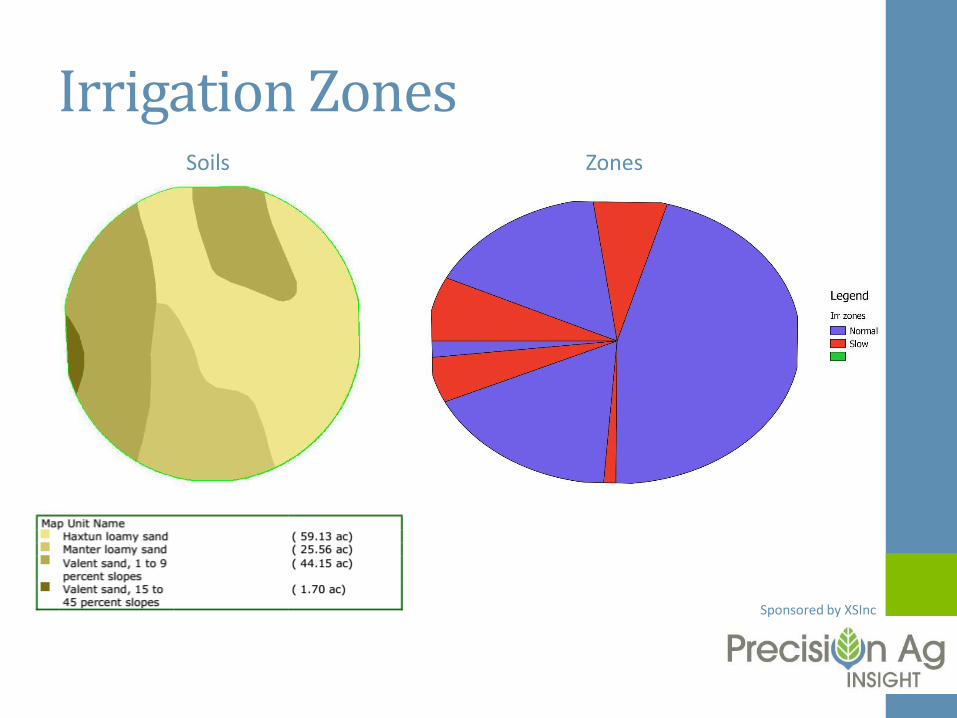
Irrigation ZonesSoils Zones
Sponsored by XSInc
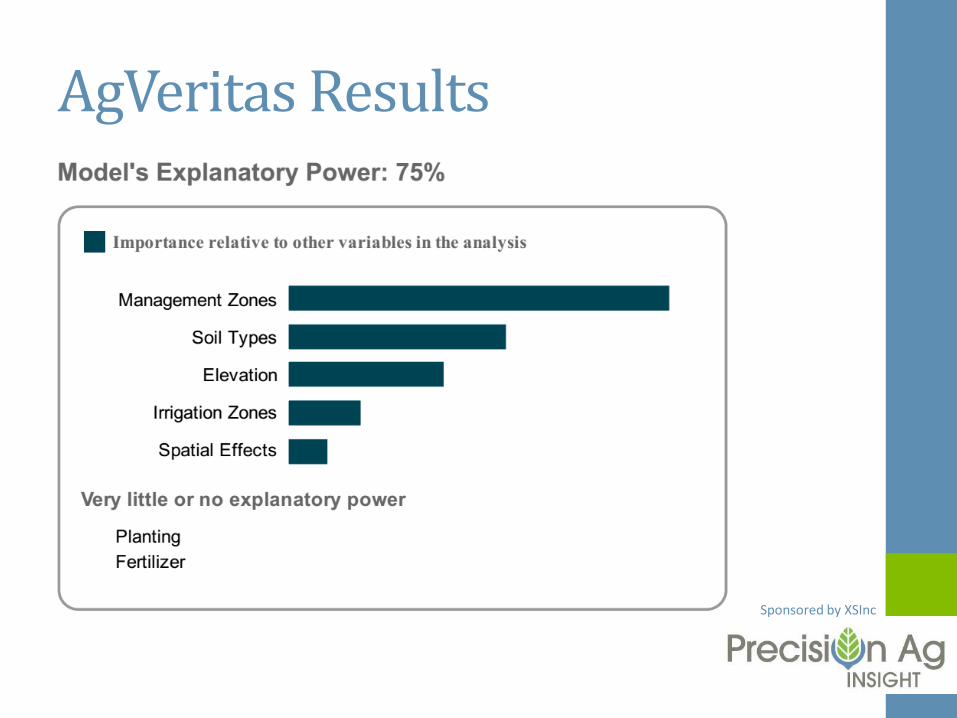
AgVeritas Results
Sponsored by XSInc
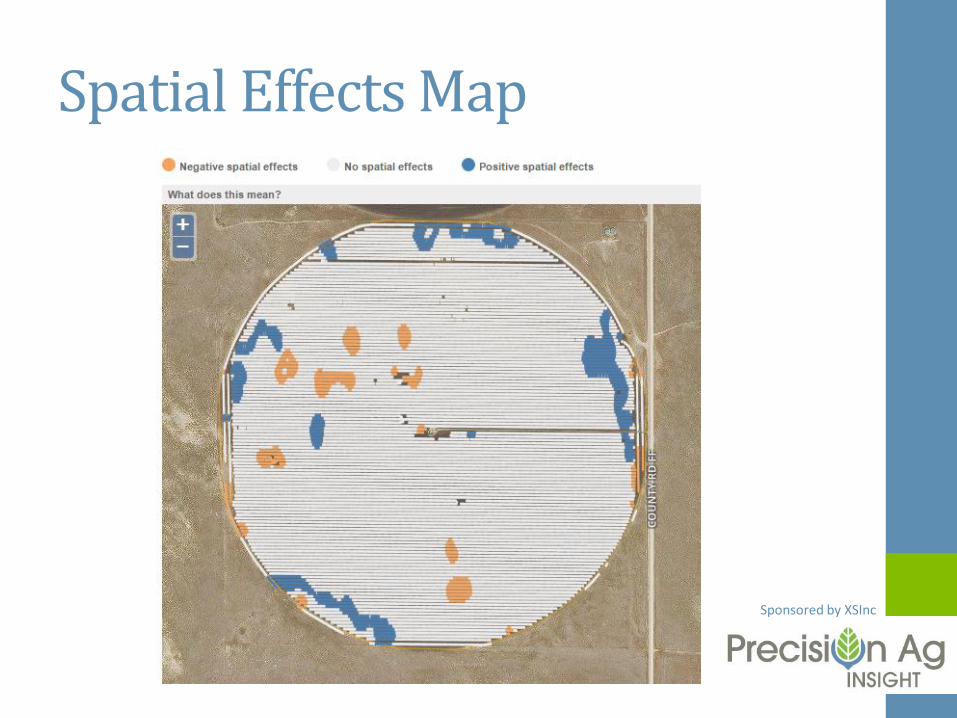
Spatial Effects Map
Sponsored by XSInc
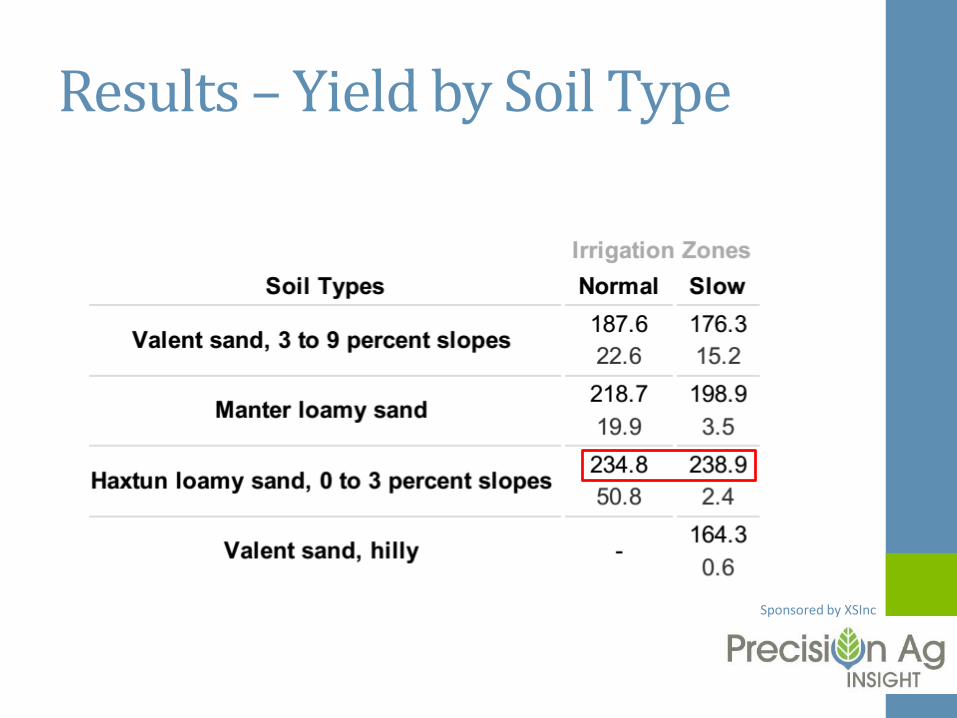
Results – Yield by Soil Type
Sponsored by XSInc
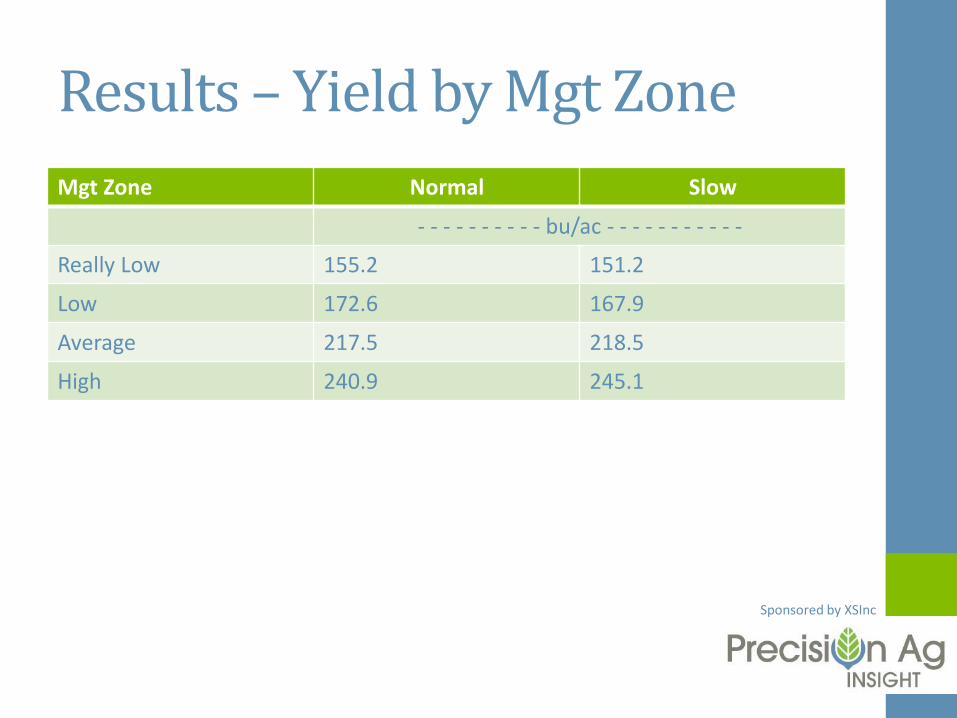
Results – Yield by Mgt Zone
Mgt Zone Normal Slow
- - - - - - - - - - bu/ac - - - - - - - - - - -
Really Low 155.2 151.2
Low 172.6 167.9
Average 217.5 218.5
High 240.9 245.1
Sponsored by XSInc
Results – Profit Analysis
• Crop Price $3.75
• Required Return: 10%
• Irrigation Input
• Normal $1/ac
• Slow Rate $10/ac
• Everything else same as last year
Sponsored by XSInc
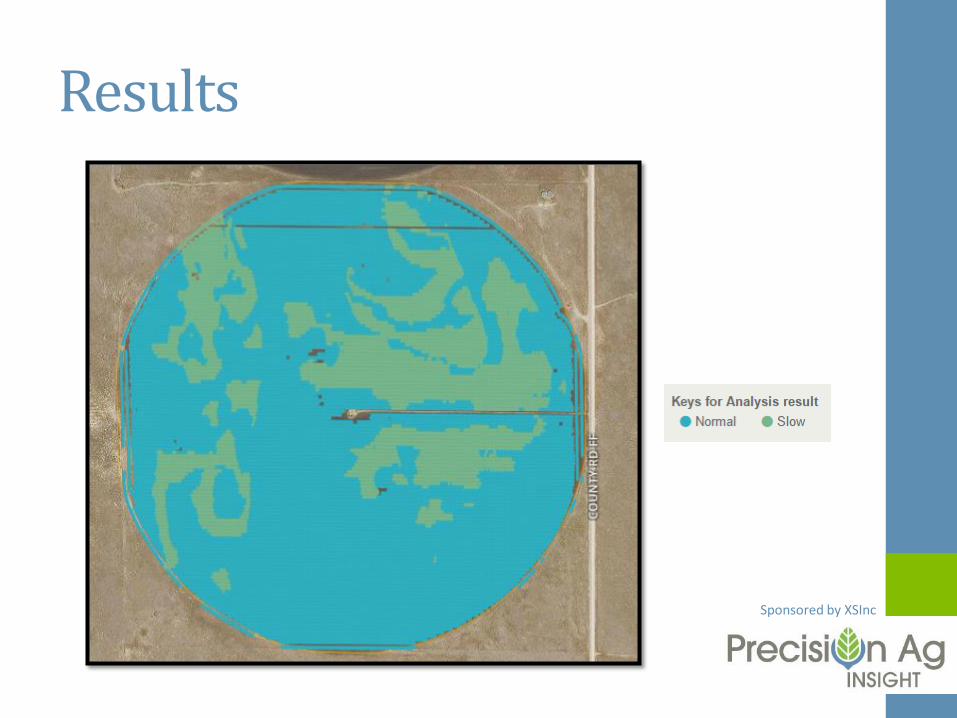
Results
Sponsored by XSInc
Summary
Understand the limitations of the system
Establish Check Strips
Initial Interpretation of Yield Data
Add check plot

Sponsored by XSInc
Thank You
Chad Godsey, PhD
Owner, Godsey Precision Ag
Phone: 970-630-7732
Email: [email protected]
Web: godseyag.com
Twitter: @godseyag
Post event survey: Your feedback is greatly appreciated!