Embed Size (px)
Citation preview

160
Armindo & Botrel Performance sprinklers for precision irrigation
Sci. Agric. v.69, n.2, p.160-167, March/April 2012
Scientia Agricola
ABSTRACT: Variable rate sprinklers (VRS) have been developed to promote localized water ap-plication of irrigated areas. In Precision Irrigation, VRS permits better control of flow adjustment and, at the same time, provides satisfactory radial distribution profiles for various pressures and flow rates are really necessary. The objective of this work was to evaluate the performance and radial distribution profiles of a developed VRS which varies the nozzle cross sectional area by moving a pin in or out using a stepper motor. Field tests were performed under different conditions of service pressure, rotation angles imposed on the pin and flow rate which resulted in maximal water throw radiuses ranging from 7.30 to 10.38 m. In the experiments in which the service pressure remained constant, the maximal throw radius varied from 7.96 to 8.91 m. Averages were used of repetitions performed under conditions without wind or with winds less than 1.3 m s–1. The VRS with the four stream deflector resulted in greater water applica-tion throw radius compared to the six stream deflector. However, the six stream deflector had greater precipitation intensities, as well as better distribution. Thus, selection of the deflector to be utilized should be based on project requirements, respecting the difference in the obtained results. With a small opening of the nozzle, the VRS produced small water droplets that visually presented applicability for foliar chemigation. Regarding the comparison between the estimated and observed flow rates, the stepper motor produced excellent results.Keywords: scheduling irrigation, central pivot, linear irrigation system, automation
Introduction
Variable rate sprinklers (VRS) for mechanical self-propelled irrigation systems have been developed to promote localized water application in function of the spatio-temporal variability of irrigated areas in Preci-sion Irrigation. Some existing techniques for controlling water application depths include pulse modulation, air injection and controlled movement of a concentric pin, all being activated by solenoid valves. Packages of fabri-cated pre-calibrated sprinklers can be used as an option for management of site-specific precision irrigation.
Since the 1990’s, precision irrigation is being de-veloped in response to the need to provide water to the soil in accordance with spatial variability of field topog-raphy, soil type, availability of water to the soil, produc-tion system and other factors, with the intent of opti-mizing production while conserving hydraulic resources and the environment (Stone et al., 2006). Although this is a new area of study, the variable flow irrigation sys-tems should be more efficient in terms of operability and utilization of water and energy (Dukes and Perry, 2006).
King et al. (2005) field tested 32 developed sprin-kler prototypes in three points of a linear irrigation sys-tem, monitoring water application uniformity which exceeded 90 %. Moreover, the reduction in water ap-plication uniformity had a minimal effect, utilizing 4 % of nitrogen in the application. Duke and Perry (2006) evaluated a commercial system and did not observe dif-
Received March 31, 2011Accepted November 08, 2011
1UFPR – Depto. Solos e Engenharia Agrícola, R. dos Funcionários, 1540 – 80035-050 – Curitiba, PR – Brasil. 2USP/ESALQ – Depto. Engenharia de Biossistemas, C.P. 9 – 13418-900 – Piracicaba, SP – Brasil. *Corresponding author <[email protected]>
Edited by: José Euclides Stipp Paterniani
Performance and radial distribution profiles of a variable flow rate sprinkler
Note
Robson André Armindo1*, Tarlei Arriel Botrel2
developed for precision irrigation
ferences between the qualities of application in each operating condition. Al-Kufaishi et al. (2006) analyzed the operation of two variable rate sprinklers in precision irrigation and found that the pulse with modulation sys-tem was more efficient than the bimodal sequential sys-tem, and that during all the tests the pressure of 150 kPa was that which presented the best results. Young et al. (2009) evaluated the Christiansen uniformity coefficient (CUc) of a variable rate sprinkler operated by a pulsing technique controlled by solenoids in a linear irrigation system. The authors reported uniformity values of 94.0, 94.8, 91.7 and 79.5 % for the applied irrigation depths of 25, 18, 13 and 6 mm, respectively.
In search of a VRS which permits better control of flow adjustment and at the same time, provides satisfactory radial distribution profiles for various pressures and flow rates, Armindo et al. (2010) developed an automated proto-type controlled by a stepper motor and presented its com-plete construction and hydraulic characteristics. Therefore, the objective of this study was to evaluate the performance and radial distribution profiles of the prototype developed by Armindo et al. (2010) under field conditions.
Materials and Methods
Project elaboration and ideological conception of the VRS were in Piracicaba, São Paulo state, Brazil. As-sembly of the VRS prototype in the field was realized to determine its radial distribution profile.
Armindo & Botrel Performance sprinklers for precision irrigation
161
Sci. Agric. v.69, n.2, p.160-167, March/April 2012
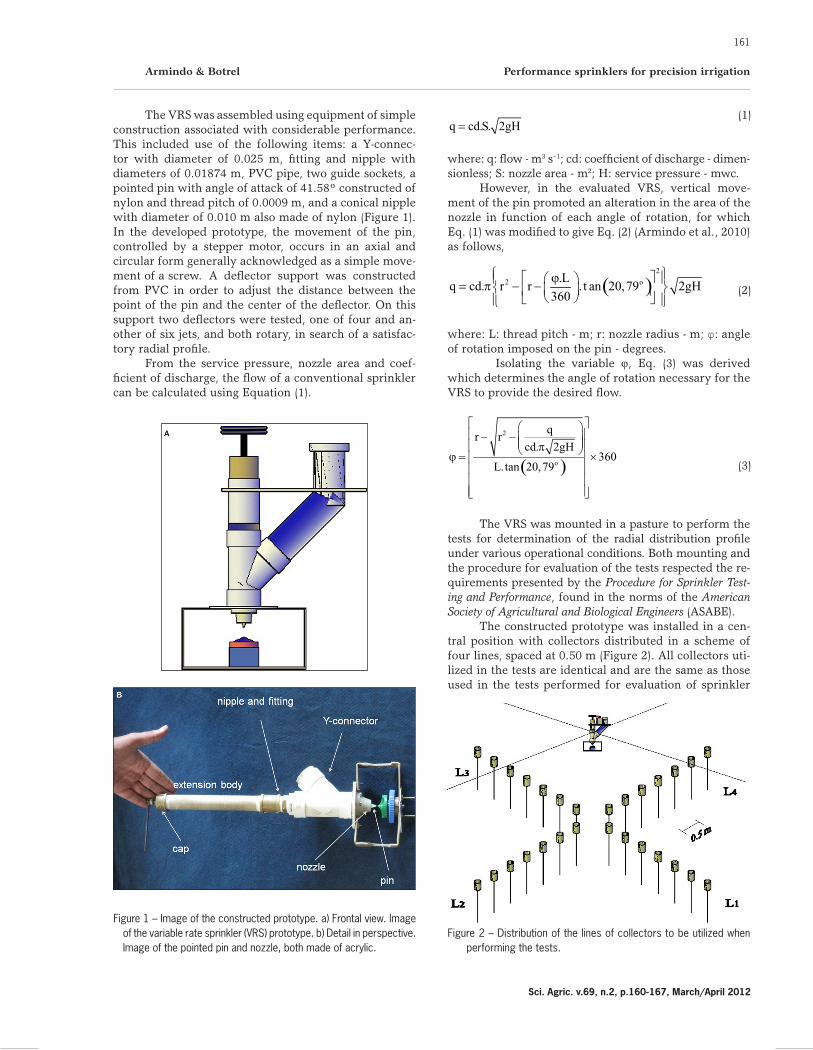
The VRS was assembled using equipment of simple construction associated with considerable performance. This included use of the following items: a Y-connec-tor with diameter of 0.025 m, fitting and nipple with diameters of 0.01874 m, PVC pipe, two guide sockets, a pointed pin with angle of attack of 41.58º constructed of nylon and thread pitch of 0.0009 m, and a conical nipple with diameter of 0.010 m also made of nylon (Figure 1). In the developed prototype, the movement of the pin, controlled by a stepper motor, occurs in an axial and circular form generally acknowledged as a simple move-ment of a screw. A deflector support was constructed from PVC in order to adjust the distance between the point of the pin and the center of the deflector. On this support two deflectors were tested, one of four and an-other of six jets, and both rotary, in search of a satisfac-tory radial profile.
From the service pressure, nozzle area and coef-ficient of discharge, the flow of a conventional sprinkler can be calculated using Equation (1).
q cd.S. 2gH=(1)
where: q: flow - m3 s–1; cd: coefficient of discharge - dimen-sionless; S: nozzle area - m2; H: service pressure - mwc.
However, in the evaluated VRS, vertical move-ment of the pin promoted an alteration in the area of the nozzle in function of each angle of rotation, for which Eq. (1) was modified to give Eq. (2) (Armindo et al., 2010) as follows,
( )2
2 o.Lq cd. r r . t an 20,79 2gH
360
ϕ = π − − (2)
where: L: thread pitch - m; r: nozzle radius - m; φ: angle of rotation imposed on the pin - degrees.
Isolating the variable φ, Eq. (3) was derived which determines the angle of rotation necessary for the VRS to provide the desired flow.
( )
2
o
qr r
cd. 2gH360
L.tan 20,79
− − π ϕ = ×
(3)
The VRS was mounted in a pasture to perform the tests for determination of the radial distribution profile under various operational conditions. Both mounting and the procedure for evaluation of the tests respected the re-quirements presented by the Procedure for Sprinkler Test-ing and Performance, found in the norms of the American Society of Agricultural and Biological Engineers (ASABE).
The constructed prototype was installed in a cen-tral position with collectors distributed in a scheme of four lines, spaced at 0.50 m (Figure 2). All collectors uti-lized in the tests are identical and are the same as those used in the tests performed for evaluation of sprinkler
Figure 2 – Distribution of the lines of collectors to be utilized when performing the tests.
Figure 1 – Image of the constructed prototype. a) Frontal view. Image of the variable rate sprinkler (VRS) prototype. b) Detail in perspective. Image of the pointed pin and nozzle, both made of acrylic.
162
Armindo & Botrel Performance sprinklers for precision irrigation
Sci. Agric. v.69, n.2, p.160-167, March/April 2012
Table 1 – Flow rates tested in the field to obtain the radial distribution profiles of the variable rate sprinkler as a function of pressure (q) and pin angle of rotation (φ).
H kPa 70 105 140 210 280
q dm3 s–1
φ degrees
2880 0.616662520 0.708333600 0.944443240 1.10273960 1.3888
Table 2 – Flow rates (q) tested in the field to obtain the radial distribution profiles of the variable rate sprinkler as a function of the pin angle of rotation (φ) for pressure of 140 kPa.
φ degrees
q dm3 s–1
720 0.616661800 0.708333600 0.94444
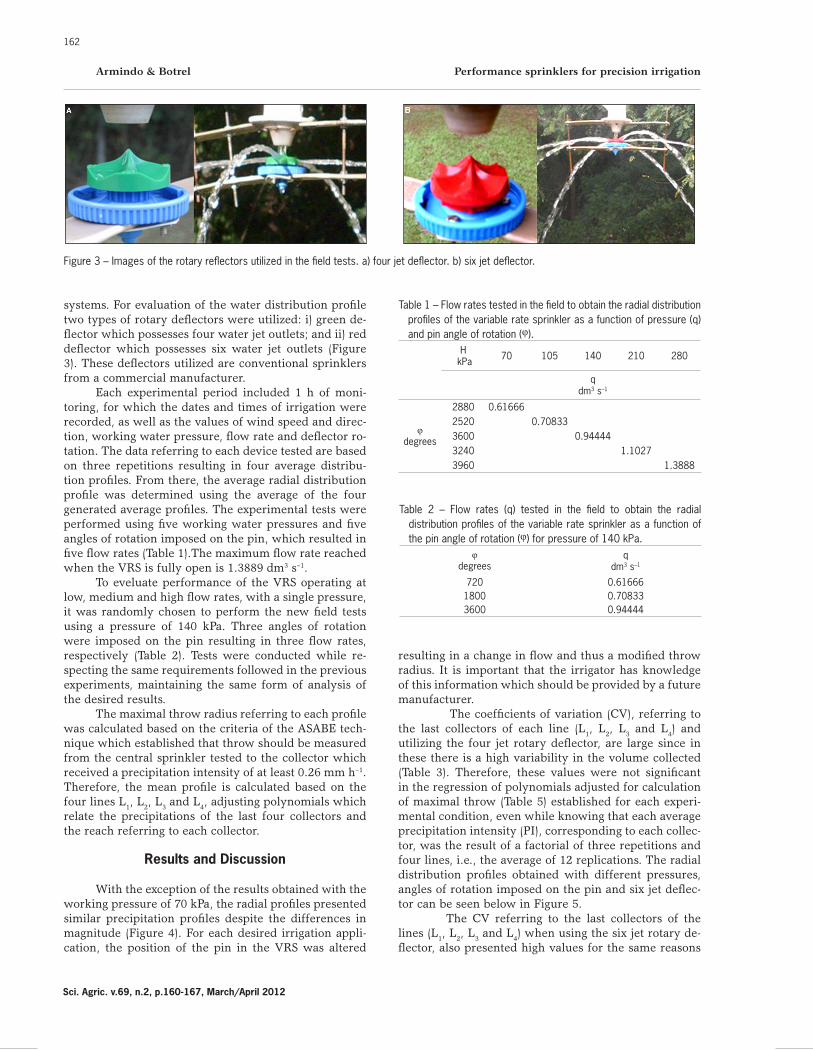
systems. For evaluation of the water distribution profile two types of rotary deflectors were utilized: i) green de-flector which possesses four water jet outlets; and ii) red deflector which possesses six water jet outlets (Figure 3). These deflectors utilized are conventional sprinklers from a commercial manufacturer.
Each experimental period included 1 h of moni-toring, for which the dates and times of irrigation were recorded, as well as the values of wind speed and direc-tion, working water pressure, flow rate and deflector ro-tation. The data referring to each device tested are based on three repetitions resulting in four average distribu-tion profiles. From there, the average radial distribution profile was determined using the average of the four generated average profiles. The experimental tests were performed using five working water pressures and five angles of rotation imposed on the pin, which resulted in five flow rates (Table 1).The maximum flow rate reached when the VRS is fully open is 1.3889 dm3 s–1.
To eveluate performance of the VRS operating at low, medium and high flow rates, with a single pressure, it was randomly chosen to perform the new field tests using a pressure of 140 kPa. Three angles of rotation were imposed on the pin resulting in three flow rates, respectively (Table 2). Tests were conducted while re-specting the same requirements followed in the previous experiments, maintaining the same form of analysis of the desired results.
The maximal throw radius referring to each profile was calculated based on the criteria of the ASABE tech-nique which established that throw should be measured from the central sprinkler tested to the collector which received a precipitation intensity of at least 0.26 mm h–1. Therefore, the mean profile is calculated based on the four lines L1, L2, L3 and L4, adjusting polynomials which relate the precipitations of the last four collectors and the reach referring to each collector.
Results and Discussion
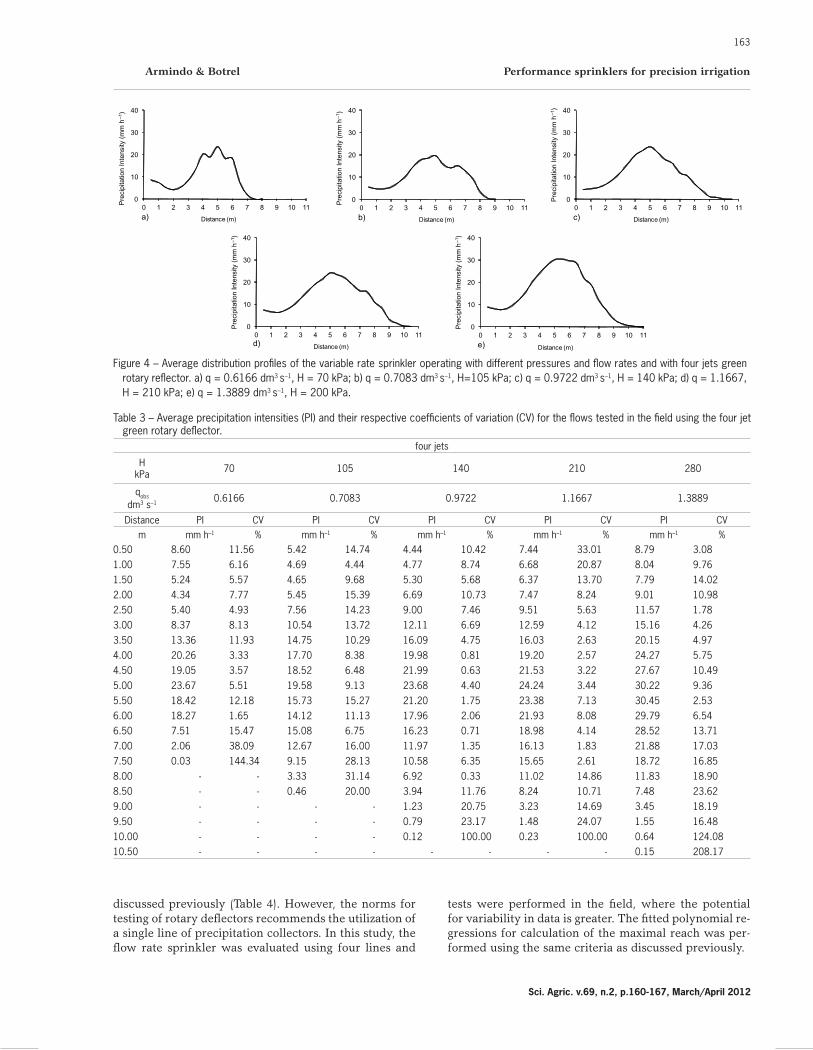
With the exception of the results obtained with the working pressure of 70 kPa, the radial profiles presented similar precipitation profiles despite the differences in magnitude (Figure 4). For each desired irrigation appli-cation, the position of the pin in the VRS was altered
resulting in a change in flow and thus a modified throw radius. It is important that the irrigator has knowledge of this information which should be provided by a future manufacturer.
The coefficients of variation (CV), referring to the last collectors of each line (L1, L2, L3 and L4) and utilizing the four jet rotary deflector, are large since in these there is a high variability in the volume collected (Table 3). Therefore, these values were not significant in the regression of polynomials adjusted for calculation of maximal throw (Table 5) established for each experi-mental condition, even while knowing that each average precipitation intensity (PI), corresponding to each collec-tor, was the result of a factorial of three repetitions and four lines, i.e., the average of 12 replications. The radial distribution profiles obtained with different pressures, angles of rotation imposed on the pin and six jet deflec-tor can be seen below in Figure 5.
The CV referring to the last collectors of the lines (L1, L2, L3 and L4) when using the six jet rotary de-flector, also presented high values for the same reasons
Figure 3 – Images of the rotary reflectors utilized in the field tests. a) four jet deflector. b) six jet deflector.
Armindo & Botrel Performance sprinklers for precision irrigation
163
Sci. Agric. v.69, n.2, p.160-167, March/April 2012
Table 3 – Average precipitation intensities (PI) and their respective coefficients of variation (CV) for the flows tested in the field using the four jet green rotary deflector.
four jets
H kPa 70 105 140 210 280
qobs dm3 s–1 0.6166 0.7083 0.9722 1.1667 1.3889
Distance PI CV PI CV PI CV PI CV PI CVm mm h–1 % mm h–1 % mm h–1 % mm h–1 % mm h–1 %
0.50 8.60 11.56 5.42 14.74 4.44 10.42 7.44 33.01 8.79 3.081.00 7.55 6.16 4.69 4.44 4.77 8.74 6.68 20.87 8.04 9.761.50 5.24 5.57 4.65 9.68 5.30 5.68 6.37 13.70 7.79 14.022.00 4.34 7.77 5.45 15.39 6.69 10.73 7.47 8.24 9.01 10.982.50 5.40 4.93 7.56 14.23 9.00 7.46 9.51 5.63 11.57 1.783.00 8.37 8.13 10.54 13.72 12.11 6.69 12.59 4.12 15.16 4.263.50 13.36 11.93 14.75 10.29 16.09 4.75 16.03 2.63 20.15 4.974.00 20.26 3.33 17.70 8.38 19.98 0.81 19.20 2.57 24.27 5.754.50 19.05 3.57 18.52 6.48 21.99 0.63 21.53 3.22 27.67 10.495.00 23.67 5.51 19.58 9.13 23.68 4.40 24.24 3.44 30.22 9.365.50 18.42 12.18 15.73 15.27 21.20 1.75 23.38 7.13 30.45 2.536.00 18.27 1.65 14.12 11.13 17.96 2.06 21.93 8.08 29.79 6.546.50 7.51 15.47 15.08 6.75 16.23 0.71 18.98 4.14 28.52 13.717.00 2.06 38.09 12.67 16.00 11.97 1.35 16.13 1.83 21.88 17.037.50 0.03 144.34 9.15 28.13 10.58 6.35 15.65 2.61 18.72 16.858.00 - - 3.33 31.14 6.92 0.33 11.02 14.86 11.83 18.908.50 - - 0.46 20.00 3.94 11.76 8.24 10.71 7.48 23.629.00 - - - - 1.23 20.75 3.23 14.69 3.45 18.199.50 - - - - 0.79 23.17 1.48 24.07 1.55 16.4810.00 - - - - 0.12 100.00 0.23 100.00 0.64 124.0810.50 - - - - - - - - 0.15 208.17
Figure 4 – Average distribution profiles of the variable rate sprinkler operating with different pressures and flow rates and with four jets green rotary reflector. a) q = 0.6166 dm3 s–1, H = 70 kPa; b) q = 0.7083 dm3 s–1, H=105 kPa; c) q = 0.9722 dm3 s–1, H = 140 kPa; d) q = 1.1667, H = 210 kPa; e) q = 1.3889 dm3 s–1, H = 200 kPa.
discussed previously (Table 4). However, the norms for testing of rotary deflectors recommends the utilization of a single line of precipitation collectors. In this study, the flow rate sprinkler was evaluated using four lines and
tests were performed in the field, where the potential for variability in data is greater. The fitted polynomial re-gressions for calculation of the maximal reach was per-formed using the same criteria as discussed previously.
0
10
20
30
40
0 1 2 3 4 5 6 7 8 9 10 11
Distance (m)a)
Pre
cipi
tatio
n In
tens
ity (
mm
h–1
)
0
10
20
30
40
0 1 2 3 4 5 6 7 8 9 10 11
Distance (m)b)
Pre
cipi
tatio
n In
tens
ity (
mm
h–1
)
0
10
20
30
40
0 1 2 3 4 5 6 7 8 9 10 11
Distance (m)c)
Pre
cipi
tatio
n In
tens
ity (
mm
h–1
)
0
10
20
30
40
0 1 2 3 4 5 6 7 8 9 10 11
Distance (m)d)
Pre
cipi
tatio
n In
tens
ity (
mm
h–1
)
0
10
20
30
40
0 1 2 3 4 5 6 7 8 9 10 11
Distance (m)e)
Pre
cipi
tatio
n In
tens
ity (
mm
h–1
)
164
Armindo & Botrel Performance sprinklers for precision irrigation
Sci. Agric. v.69, n.2, p.160-167, March/April 2012
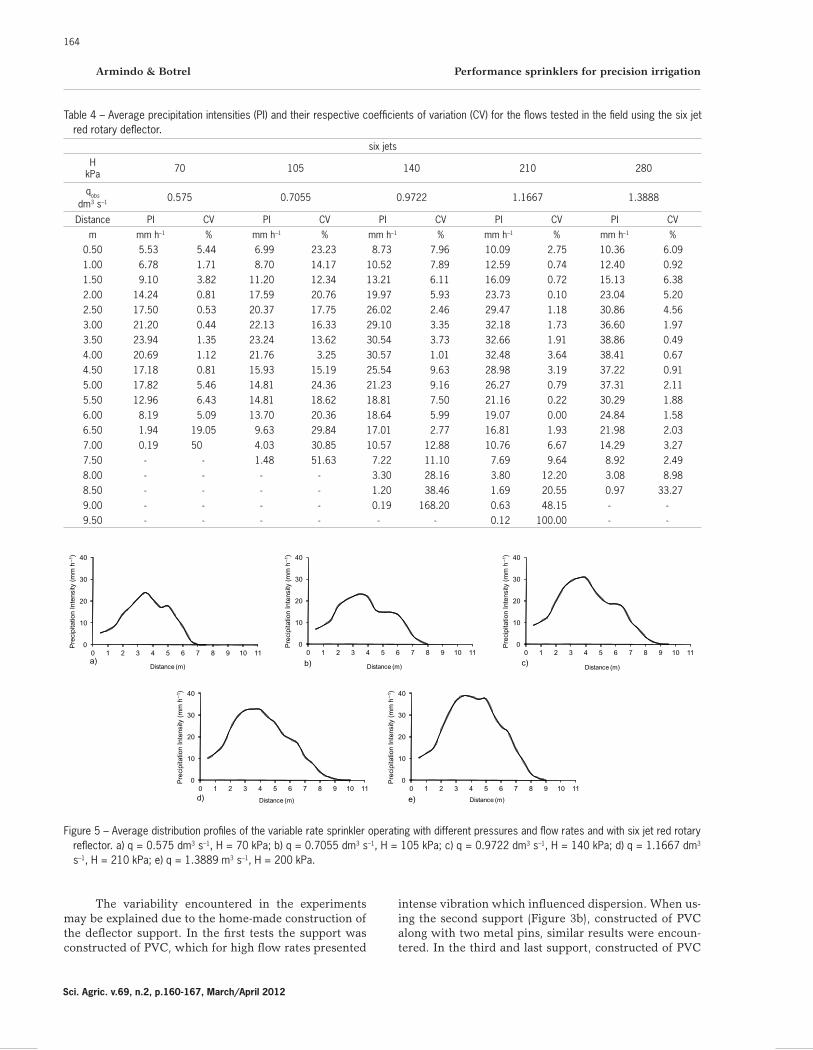
Figure 5 – Average distribution profiles of the variable rate sprinkler operating with different pressures and flow rates and with six jet red rotary reflector. a) q = 0.575 dm3 s–1, H = 70 kPa; b) q = 0.7055 dm3 s–1, H = 105 kPa; c) q = 0.9722 dm3 s–1, H = 140 kPa; d) q = 1.1667 dm3 s–1, H = 210 kPa; e) q = 1.3889 m3 s–1, H = 200 kPa.
Table 4 – Average precipitation intensities (PI) and their respective coefficients of variation (CV) for the flows tested in the field using the six jet red rotary deflector.
six jets
H kPa 70 105 140 210 280
qobs dm3 s–1 0.575 0.7055 0.9722 1.1667 1.3888
Distance PI CV PI CV PI CV PI CV PI CVm mm h–1 % mm h–1 % mm h–1 % mm h–1 % mm h–1 %
0.50 5.53 5.44 6.99 23.23 8.73 7.96 10.09 2.75 10.36 6.091.00 6.78 1.71 8.70 14.17 10.52 7.89 12.59 0.74 12.40 0.921.50 9.10 3.82 11.20 12.34 13.21 6.11 16.09 0.72 15.13 6.382.00 14.24 0.81 17.59 20.76 19.97 5.93 23.73 0.10 23.04 5.202.50 17.50 0.53 20.37 17.75 26.02 2.46 29.47 1.18 30.86 4.563.00 21.20 0.44 22.13 16.33 29.10 3.35 32.18 1.73 36.60 1.973.50 23.94 1.35 23.24 13.62 30.54 3.73 32.66 1.91 38.86 0.494.00 20.69 1.12 21.76 3.25 30.57 1.01 32.48 3.64 38.41 0.674.50 17.18 0.81 15.93 15.19 25.54 9.63 28.98 3.19 37.22 0.915.00 17.82 5.46 14.81 24.36 21.23 9.16 26.27 0.79 37.31 2.115.50 12.96 6.43 14.81 18.62 18.81 7.50 21.16 0.22 30.29 1.886.00 8.19 5.09 13.70 20.36 18.64 5.99 19.07 0.00 24.84 1.586.50 1.94 19.05 9.63 29.84 17.01 2.77 16.81 1.93 21.98 2.037.00 0.19 50 4.03 30.85 10.57 12.88 10.76 6.67 14.29 3.277.50 - - 1.48 51.63 7.22 11.10 7.69 9.64 8.92 2.498.00 - - - - 3.30 28.16 3.80 12.20 3.08 8.988.50 - - - - 1.20 38.46 1.69 20.55 0.97 33.279.00 - - - - 0.19 168.20 0.63 48.15 - -9.50 - - - - - - 0.12 100.00 - -
The variability encountered in the experiments may be explained due to the home-made construction of the deflector support. In the first tests the support was constructed of PVC, which for high flow rates presented
intense vibration which influenced dispersion. When us-ing the second support (Figure 3b), constructed of PVC along with two metal pins, similar results were encoun-tered. In the third and last support, constructed of PVC
0
10
20
30
40
0 1 2 3 4 5 6 7 8 9 10 11
Distance (m)a)
Pre
cipi
tatio
n In
tens
ity (
mm
h–1
)
0
10
20
30
40
0 1 2 3 4 5 6 7 8 9 10 11
Distance (m)b)
Pre
cipi
tatio
n In
tens
ity (
mm
h–1
)
0
10
20
30
40
0 1 2 3 4 5 6 7 8 9 10 11
Distance (m)c)
Pre
cipi
tatio
n In
tens
ity (
mm
h–1
)
0
10
20
30
40
0 1 2 3 4 5 6 7 8 9 10 11
Distance (m)d)
Pre
cipi
tatio
n In
tens
ity (
mm
h–1
)
0
10
20
30
40
0 1 2 3 4 5 6 7 8 9 10 11
Distance (m)e)
Pre
cipi
tatio
n In
tens
ity (
mm
h–1
)
Armindo & Botrel Performance sprinklers for precision irrigation
165
Sci. Agric. v.69, n.2, p.160-167, March/April 2012
and four metal pins (Figure 3a), the improved construc-tion allowed for greater stability and consequently less dispersion of the values.
Alterations were made in distance between the center of the deflector and exit of the water jet in an at-tempt to achieve better results, as well as in the inclina-tion of the deflector which also contributed to variations in the results. It is believed that during utilization of industrial sprinklers in subsequent works based on the prototype tested here, there will be less variability in re-sults. Cost of the tested sprinkler is linked to utilization of a stepper motor for each sprinkler. The variable rate sprinkler of King and Kincaid (2004) utilized the puls-ing technique and a solenoid valve for each sprinkler. Solenoid valves present a lower fixed cost compared to stepper motors of the same size. On the other hand, the stepper motor presents a longer useful life and lower energy consumption since it is not actuated during the entire irritation period as in the case of solenoids, thus reducing the total cost of the system over time. Further-more, with the stepper motor it was possible to achieve much more precise flow rates, as presented by Armindo et al. (2010). However, it is also expected that in mass production the unitary price will be more accessible to the customer. Based on the adjusted polynomials, the maximum throw of each condition was therefore deter-mined (Table 5).
In general, the VRS with the four jet deflector (green) resulted in greater water application throw com-pared to the six jet deflector (red). However, the six jet
deflector showed greater precipitation intensities, as well as better distribution. Thus, the selection of the deflector to be utilized should be based on project requirements, respecting the difference in the obtained results. The variance present between the four profiles, referring to the four lines of collectors, can be explained by factors such as: influence of wind velocity and direction, eccen-tricity between the water stream and the center of the deflector, eccentricity caused by the pin, small misalign-ments of the deflector in relation to the reference plane, small vibrations of the deflector support, small changes in terrain level, among others.
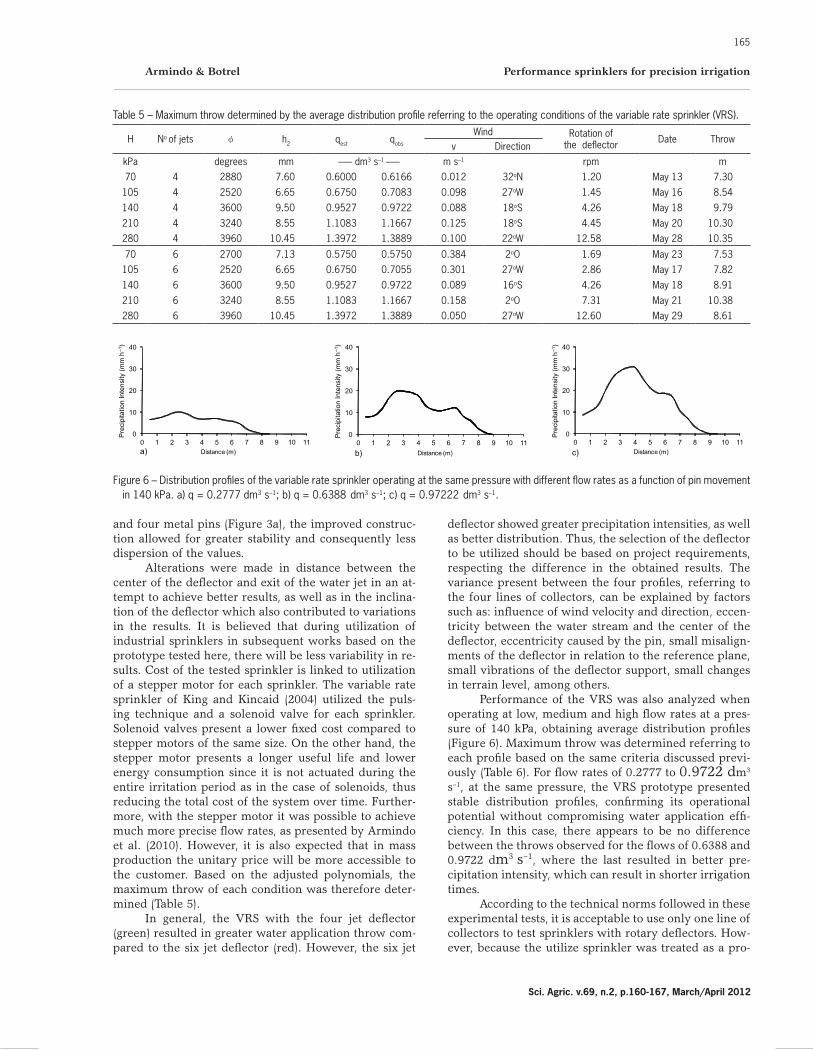
Performance of the VRS was also analyzed when operating at low, medium and high flow rates at a pres-sure of 140 kPa, obtaining average distribution profiles (Figure 6). Maximum throw was determined referring to each profile based on the same criteria discussed previ-ously (Table 6). For flow rates of 0.2777 to 0.9722 dm3 s–1, at the same pressure, the VRS prototype presented stable distribution profiles, confirming its operational potential without compromising water application effi-ciency. In this case, there appears to be no difference between the throws observed for the flows of 0.6388 and 0.9722 dm3 s–1, where the last resulted in better pre-cipitation intensity, which can result in shorter irrigation times.
According to the technical norms followed in these experimental tests, it is acceptable to use only one line of collectors to test sprinklers with rotary deflectors. How-ever, because the utilize sprinkler was treated as a pro-
Table 5 – Maximum throw determined by the average distribution profile referring to the operating conditions of the variable rate sprinkler (VRS).
H No of jets φ h2 qest qobs
Wind Rotation of the deflector Date Throw
v DirectionkPa degrees mm ------- dm3 s–1 ------- m s–1 rpm m70 4 2880 7.60 0.6000 0.6166 0.012 32oN 1.20 May 13 7.30
105 4 2520 6.65 0.6750 0.7083 0.098 27oW 1.45 May 16 8.54
140 4 3600 9.50 0.9527 0.9722 0.088 18oS 4.26 May 18 9.79
210 4 3240 8.55 1.1083 1.1667 0.125 18oS 4.45 May 20 10.30280 4 3960 10.45 1.3972 1.3889 0.100 22oW 12.58 May 28 10.35
70 6 2700 7.13 0.5750 0.5750 0.384 2oO 1.69 May 23 7.53105 6 2520 6.65 0.6750 0.7055 0.301 27oW 2.86 May 17 7.82
140 6 3600 9.50 0.9527 0.9722 0.089 16oS 4.26 May 18 8.91
210 6 3240 8.55 1.1083 1.1667 0.158 2oO 7.31 May 21 10.38280 6 3960 10.45 1.3972 1.3889 0.050 27oW 12.60 May 29 8.61
Figure 6 – Distribution profiles of the variable rate sprinkler operating at the same pressure with different flow rates as a function of pin movement in 140 kPa. a) q = 0.2777 dm3 s–1; b) q = 0.6388 dm3 s–1; c) q = 0.97222 dm3 s–1.
0
10
20
30
40
0 1 2 3 4 5 6 7 8 9 10 11Distance (m)
Pre
cipi
tatio
n In
tens
ity (
mm
h–1
)
a)
0
10
20
30
40
0 1 2 3 4 5 6 7 8 9 10 11
Distance (m)
Pre
cipi
tatio
n In
tens
ity (
mm
h–1
)
b)
0
10
20
30
40
0 1 2 3 4 5 6 7 8 9 10 11Distance (m)c)
Pre
cipi
tatio
n In
tens
ity (
mm
h–1
)

166
Armindo & Botrel Performance sprinklers for precision irrigation
Sci. Agric. v.69, n.2, p.160-167, March/April 2012
totype, it was opted to work with four lines of collectors and utilized the average of the four; it is therefore em-phasized that for each line there were three repetitions, meaning each average profile was the result of an aver-age of twelve observations. Moreover, data was collected on dates in which wind velocity did not exceed 1.3 m s–1, as suggested by the technical norms.
Averages of replications which present conditions without wind or with winds less than 1.3 m s–1 were per-formed, outside of these experimental control conditions interference may be observed among treatments. More-over, the utilized wind gauge informed the total distance traveled due to effect of the wind during the entire ex-perimental time of 1 h. It was not possible to determine wind gusts and during the majority of the experimental period there was no wind, but at short instances there were surely winds with velocities greater than 1.3 m s–1 which were not recorded and likely interfered on the experiment. Another important factor was the direction of winds which sometimes changed during the experi-mental period, affecting the results. In future field stud-ies the use of wind gauges integrated with a data logger is recommended in order to obtain graphs which present the behavior of wind conditions during the test periods or at lease simple use of a wind gauge.
Eccentricity between the water jet and the center of the deflector is another characteristic which needs to be perfected in future variable rate sprinklers. For small nozzle openings, direction of the water jet changes in function of the rotation of the pin causing the water stream to strike points off-center which causes com-pletely non-uniform distribution profiles. To correct this problem it is necessary to align the center of the reflec-tor to the outlet of the water stream in each flow rate to be tested in the field. This problem is believed to be a
fault of precision in alignment of the pin, encountered in the construction of the prototype, which would not occur in the construction of a commercial variable rate sprinkler.
The support constructed to serve as a base to the tested deflectors suffered deformation during the field tests, being another important factor which effected repeatability of the data. When subjected to low flow rates, the first support utilized operated stably, but forceful vibrations were observed when the pressure was increased, which interfered on the distribution profile. To eliminate this effect, it was necessary to use other supports which provided greater resistance to vi-bration.
When working with four lines of precipitation col-lectors and adopting a spacing of 0.5 m, a small differ-ence was observed between the maximal throws of each line. In determined experimental flow rates, the water stream reached the opening of the last collector in one line and only the stake of the last collector in another line bringing about the mentioned difference. A small imbalance of the deflector, a small eccentricity in the outlet of the water stream or even a small difference in terrain height and thus height of the collectors are fac-tors which cause this difference in profiles.
When operating the VRS with a fixed deflector at pressure of 280 kPa and a small nozzle opening refer-ring to a 90° rotation of the pin, a flow of approximately 0.05222 dm3 s–1 was observed which emits what appears to be a spray (Figure 7). Future tests with adhesive papers which assist in determination of volume mean diameter (VMD) and numeric mean diameter (NMD), as well as for determination of the application profile of the VRS operating under these conditions must be performed to prove this additional characteristic of the variable rate
Figure 7 – Variable rate sprinkler operating in spraying conditions with smaller water droplets. A) utilized fixed deflector. B) visual aspect of the spray.
Table 6 – Values of throw obtained for the different flow rates at the same pressure for the six jet deflector.
H No of jets φ h2 qest qobs
Wind Rotationof the deflector Date Throw
v DirectionkPa degrees m ------------------- dm3 s–1 ------------------- m s–1 rpm m140 4 720 1.90 0.2750 0.2750 0.317 16oS 0.40 May 25 7.96140 4 1800 4.75 0.6111 0.6416 0.024 32oN 2.01 May 24 8.69140 4 3600 9.50 0.9527 0.9722 0.089 16oS 4.26 May 18 8.91

Armindo & Botrel Performance sprinklers for precision irrigation
167
Sci. Agric. v.69, n.2, p.160-167, March/April 2012
sprinkler which guarantees even greater versatility. If confirmed, the same equipment used for conventional irritation can also be used for precision irrigation and chemigation.
Conclusion
The technical feasibility of the variable rate sprin-kler prototype was verified. With its use, linear and cen-ter pivot irrigation systems can be used in precision ir-rigation, varying the flow through the lateral pipe, with defined radial application profiles. Furthermore, in con-ventional irrigation, center pivots no longer need to pres-ent a model with multiple spray nozzles along the lateral line. Now, a single nozzle size can be used along the en-tire pipe length, obtaining the required flow at any point by movement of the pin that can even be performed manually. Under conditions of small nozzle opening with a fixed deflector and high operational pressure, the VRS produced visually small water droplets, and may possibly be used for foliar chemigation. An algorithm was successfully programmed for control of the stepper motor which presented excellent results for comparison between the estimated and observed flow rates.
Acknowledgements
To the following Brazilian Institutions for their financial support: Ministério da Ciência e Tecnologia (MCT), Conselho Nacional de Desenvolvimento Cientí-
fico e Tecnológico (CNPq), Fundação de Amparo à Pes-quisa do Estado de São Paulo (FAPESP) and Instituto Nacional de Ciência e Tecnologia em Engenharia de Ir-rigação (INCTEI).
References
Al-kufaishi, S.A.; Blackmore, B.S.; Sourell, H. 2006. The feasibility of using variable rate water application under a central pivot irrigation system. Irrigation and Drainage Systems 20: 317–327.
Armindo, R.A.; Botrel, T.A.; Garzella, T.C. 2010. Flow rate sprinkler for site-specific irrigation. Irrigation Science. DOI 10.1007/s00271–010–0231–7.
Dukes, M.D.; Perry, C. 2006. Uniformity testing of variable-rate center pivot irrigation control systems. Precision Agriculture 7: 205–218.
King, B.A.; Kincaid, D.C. 2004. A variable flow rate sprinkler for site-specific irrigation management. Applied Engineering in Agriculture 20: 765–770.
King, B.A.; Wall, R.W.; Kincaid, D.C.; Westermann, D.T. 2005. Field Testing of a variable rate sprinkler and control system for site-specific water and nutrient application. Applied Engineering in Agriculture. 21: 847–853.
Stone, K.C.; Sadler, E.J.; Millen, J.A.; Evans, D.E.; Camp, C.R. 2006. Water flow rates from a site-specific irrigation system. Applied Engineering in Agriculture. 22: 73–78.
Young, J.H.; Khalilian, A.; Owino, T.O.; Farahani, H.J.; Moore, S. 2009. Development of Clemson variable-rate lateral irrigation system. Computers and Electronics in Agriculture 68: 108–113.