Embed Size (px)
Citation preview

The SaaS Revolution from India
A Joint Study by Google India & Accel Partners
Objective: Identify key opportunity areas, business models and challenges for Indian SaaS companies in the global market
Methodology: ● Primary Interviews with Indian SaaS companies across segments (Oct-Dec 2015)
● Primary Interactions with investors active in this space, SIs, educational institutes (Oct-Dec 2015)
● Google India primary research for SMB consumers targeted to the US (n=200x4, Jan-Feb 2016)
● Secondary Research by Zinnov conducted in India
● Benchmark business metrics from Accel India SaaS portfolio
● Google search trends data for the calendar years 2013, 2014 and 2015
# 1

Executive Summary
Global SaaS Industry
● Global SaaS to be a $132B revenue industry by 2020 driven by SMB demand
● Purpose-built high quality SaaS products will replace generic B2B “single software providers” of today
● Online discovery and adoption will increasingly reduce dependence on Feet-on-Street (FOS) sales
● New and innovative monetization methods are emerging beyond basic software subscription models, driven by verticalization
SaaS business from India
● India will likely grow to be a $10B revenue industry by 2025 (8% of Global SMB SaaS)
● Categories such as CRM, Data Visualization, HR, Marketing, Healthcare & Education are ripe for big SaaS companies to emerge out of India
● As SaaS shifts to mobile, SaaS companies in India will have an edge - India being a mobile first country
● Cost advantage on engineering, inside sales, onboarding and support will allow Indian SaaS firms to aggressively enter and scale the SMB market
● High growth SaaS companies from India need to build world-class products, size the market accurately, focus on competitive pricing and have a high CAC budget to fuel initial growth
● India & other emerging markets’ enterprises starting to adopt Indian SaaS products
Source: Based on analyses by Zinnov and Accel
# 2

A. The hyper-growing SaaS Industry
B. India’s place in the SaaS hyper-growth
C. SaaS for Emerging Markets
D. Key takeaways for the SaaS Industry & Entrepreneurs from India
Contents
# 3

A1. Fast growing Global Public Cloud Computing Market
Approximate figures for ease of computation
Key drivers for Public Cloud growth
● 2x growth in US SMB Cloud adoption by 20201,2
● Strong demand for Cloud Services in Europe &
Asia
● Strong demand for vertical specific solutions
Global Public Cloud Computing Market1,2
Revenue in USD Billion
56
76
175
2020 2013 2015
# 4
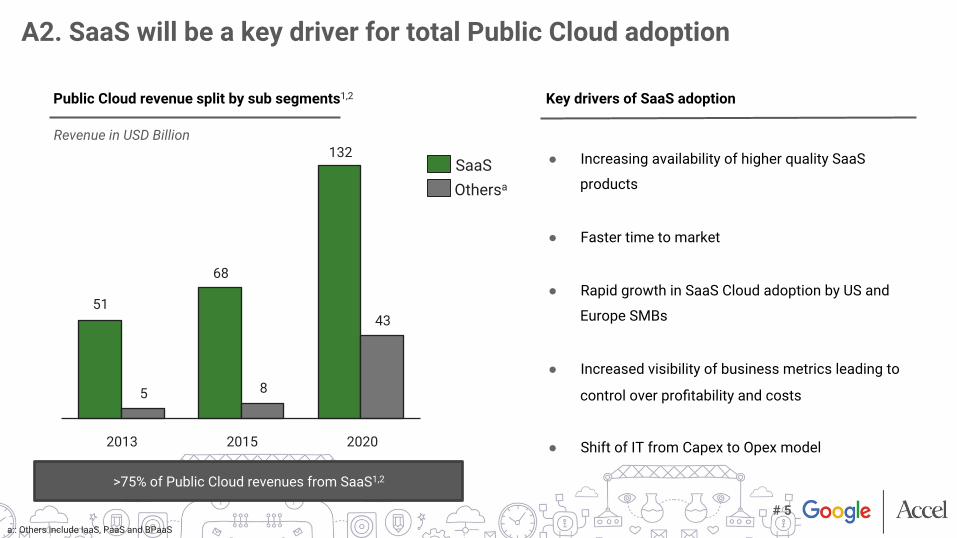
A2. SaaS will be a key driver for total Public Cloud adoption
a:: Others include IaaS, PaaS and BPaaS
51
68
5 8
43
2015 2013 2020
132
Othersa
SaaS
Public Cloud revenue split by sub segments1,2 Key drivers of SaaS adoption
Revenue in USD Billion
● Increasing availability of higher quality SaaS
products
● Faster time to market
● Rapid growth in SaaS Cloud adoption by US and
Europe SMBs
● Increased visibility of business metrics leading to
control over profitability and costs
● Shift of IT from Capex to Opex model
>75% of Public Cloud revenues from SaaS1,2
# 5
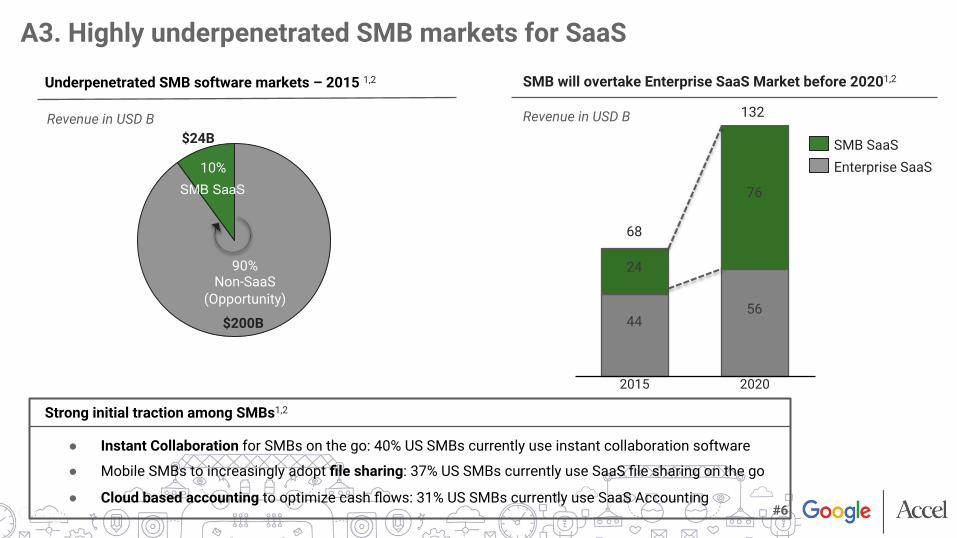
● Instant Collaboration for SMBs on the go: 40% US SMBs currently use instant collaboration software
● Mobile SMBs to increasingly adopt file sharing: 37% US SMBs currently use SaaS file sharing on the go
● Cloud based accounting to optimize cash flows: 31% US SMBs currently use SaaS Accounting
A3. Highly underpenetrated SMB markets for SaaS
10% SMB SaaS
90% Non-SaaS
(Opportunity)
Strong initial traction among SMBs1,2
Underpenetrated SMB software markets – 2015 1,2
Revenue in USD B
SMB will overtake Enterprise SaaS Market before 20201,2
Revenue in USD B
2020
132
76
2015
24
44
68
56
SMB SaaS Enterprise SaaS
$200B
$24B
#6

4.3
2.1 1.9 1.9
1.3 1.2 1.1 1.0 0.9 0.9 0.5 0.4 0.4 0.3 0.3 0.3
0.1 0.1 0.0
A4. Purpose-built SaaS products gaining traction
Advertising
BPM Marketing Finance Sales BI/ Analytics
Developers Collaboration
Identity HR Web Design
Education IT (Mgmt, Automation)
Vertical Specific
SaaS (Travel,
Retail, etc.)
Health care
File Sharing
and Backup
ERP Services and
Support
Productivity
Opportunity for many specialized SaaS companies
Global SaaS funding between 2011 and 20142,5
Funding in USD Billion
# 7

A5. Online product discovery is critical for growth
100 120
180
2011 2013 2015
Online search interest growth for SaaS products4
3% 5%
9%
2011 2013 2015
Brand comparison searches4
5 7
9
2011 2013 2015
Time spent by users on review sites & marketplaces (mins)10
95%
5%
Yes No
Do you prefer to "silently" try before buying a product?6
More information seekers More comparisons of products
Free trial and Freemium is a must More focus on features and user reviews than on FOS sales
Customer behavior is changing
Online is becoming the key driver
# 8

A6. New monetization models to emerge
Per User Most common and easy for enterprises to understand; pricing trends
moving from annual to quarterly to monthly
Aligning to usage, direct outcome or value-based: e.g. percentage of
payments processed (Stripe), unit price X number of key interactions,
percentage of savings realized
Free for enterprises, revenue from suppliers to the enterprises e.g.
Zenefits
Free for enterprises, revenue from services and premium products e.g.
Cloudera, mongoDB
Model Highlights
Will amplify the growth of
verticalized SaaS
Source: Models are publicly abvailable on their respective websites
Usage / Value / Outcome Based
Monetizing Network Effects
Freemium / Open Source
# 9

A. The hyper-growing SaaS Industry
B. India’s place in the SaaS hyper-growth
C. SaaS for Emerging Markets
D. Key takeaways for the SaaS Industry & Entrepreneurs from India
Contents
# 10
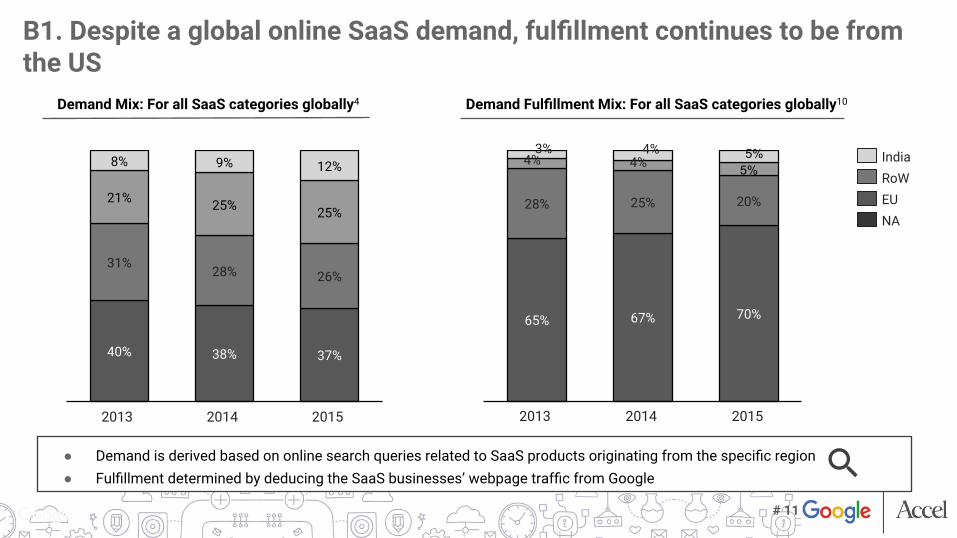
● Demand is derived based on online search queries related to SaaS products originating from the specific region ● Fulfillment determined by deducing the SaaS businesses’ webpage traffic from Google
B1. Despite a global online SaaS demand, fulfillment continues to be from the US
40% 38% 37%
31% 28% 26%
21% 25% 25%
8% 9% 12%
2014 2015 2013
NA EU RoW India
65% 67% 70%
28% 25% 20%
5% 5%
2014 2015
4% 4%
2013
4% 3%
Demand Fulfillment Mix: For all SaaS categories globally10 Demand Mix: For all SaaS categories globally4
# 11

● Demand is derived based on online search queries related to SaaS products originating from the specific region ● Fulfillment determined by deducing the SaaS businesses’ webpage traffic from Google
B2. However, in select categories, India has changed the global fulfillment landscape
39% 37% 37%
28% 27% 25%
23% 24% 25%
10% 12% 13%
2015 2014 2013
NA EU RoW India
77% 62%
52%
17% 33%
42%
2015
4%
2014
4%
2013
5%
Demand Mix: For a category with strong Indian SaaS service providers4
Demand Fulfillment Mix: For a category with strong Indian SaaS service providers10
# 12

a:: A product manager may be from multiple backgrounds (eg. With US experience from the IT sector or consumer sector)
● Enough skilled PMs from IT(MNCs) and consumer companies transitioning to entrepreneurship - over 500 SaaS startups in India currently3
● Institutionalization of product community is starting to show
● MNC product managers skilled in operational aspects starting to move to business / P&L management ● High quality product thinking from consumer/mobile companies influencing SaaS industry
● Product learnings and insights from the US are seeing quick adoption among current SaaS companies
B3. Indian ecosystem ready for product driven SaaS founders Product managers by Country2
Thousands
Indian product managers’ background and experiencea; 2,3,4,7
Thousands
Indicators of ecosystem readiness
2020 2015 2010
IT
Consumer US
365
32
174
US UK Israel India
17 36
68
# 13

B4. India has the necessary developer horsepower to build SaaS
4x cost difference between India and the US By 2020, most of current UX developers will enhance skillsets to move towards UX design & aesthetics DevOps skills is on the critical path
India
130
25
Israel
5
UK
28
US
120
Cloud oriented software developers2,3,7,8
Skill Ready
SaaS Ready
Thousands
5
India
40
6
Israel
1
UK US
22
Skill Ready
SaaS Ready
UI/UX designers2,3,7,8
Thousands
SaaS Ready: Workforce that has working knowledge of / worked on cloud platforms for SaaS product development Skill Ready: Workforce that is ready to acquire an incremental skill with minimal effort and move to a new role/product
# 14

B5. India poised to gain from a shift to mobile in SaaS
Use of mobile/tablets for accessing SaaS6
Desktop SaaS users planning to use mobile/tablet to access SaaS6
2014 2016
40%
10% 80%
70% 40%
Primary Device
No
20%
80%
Yes
Mobile App/UX developers2
121
29 6
39
70
15
120
US UK Israel India
2015 2020
Thousands
Strong Indian talent pool for mobile applications owing to the fast growth in consumer internet industry
210
# 15

Sales closure rates from qualified leads (%)3 Preferred mode of product walkthrough before online SaaS purchase6
Over the phone or internet chat with
agent
Can understand it online myself
12%
In-person visit by salesman
71%
18%
High quality products with inbound sales has a
3x potential of growth than DIY
B6. Inside Sales is critical for business
0%
5%
10%
15%
20%
25%
30%
35%
40%
45%
DIY With Inside Sales support
15%
6% 10%
40%
100% of interviewed companies indicated the need for
inbound sales support for serious / non-free customers2
# 16
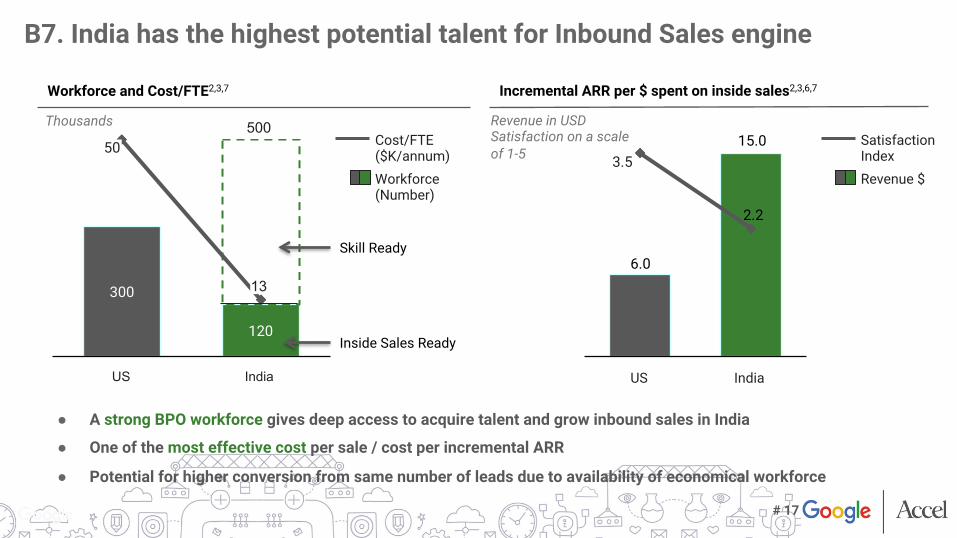
● A strong BPO workforce gives deep access to acquire talent and grow inbound sales in India
● One of the most effective cost per sale / cost per incremental ARR
● Potential for higher conversion from same number of leads due to availability of economical workforce
300
120
India
13
US
Skill Ready
Inside Sales Ready
Workforce �(Number)
Cost/FTE �($K/annum)
6.0
15.0
2.2
India US
Revenue $
Satisfaction �Index
Workforce and Cost/FTE2,3,7 Incremental ARR per $ spent on inside sales2,3,6,7
B7. India has the highest potential talent for Inbound Sales engine
Thousands Revenue in USD Satisfaction on a scale of 1-5 50
3.5
500
# 17
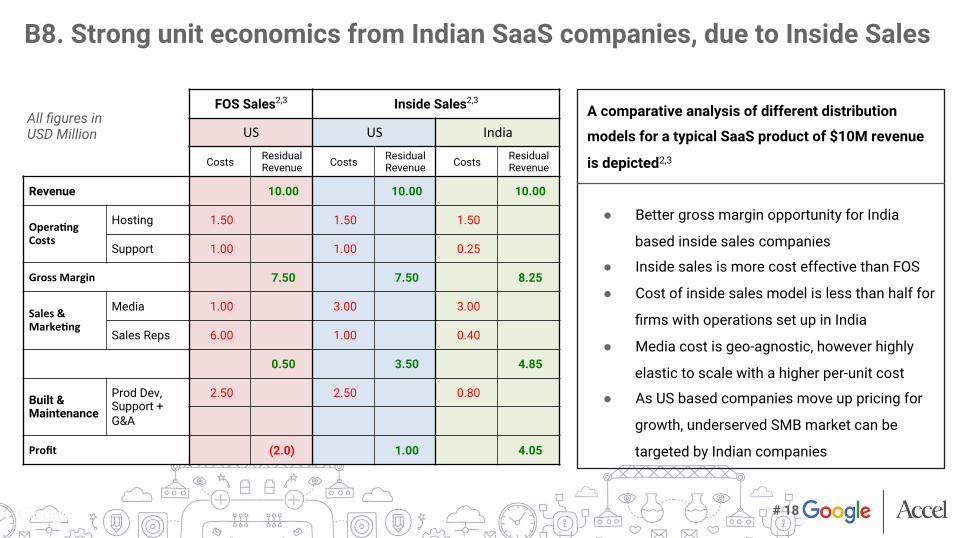
A comparative analysis of different distribution
models for a typical SaaS product of $10M revenue
is depicted2,3
● Better gross margin opportunity for India
based inside sales companies
● Inside sales is more cost effective than FOS
● Cost of inside sales model is less than half for
firms with operations set up in India
● Media cost is geo-agnostic, however highly
elastic to scale with a higher per-unit cost
● As US based companies move up pricing for
growth, underserved SMB market can be
targeted by Indian companies
FOS Sales2,3 Inside Sales2,3
US US India
Costs Residual Revenue Costs Residual
Revenue Costs Residual Revenue
Revenue 10.00 10.00 10.00
Opera&ngCosts
Hosting 1.50 1.50 1.50
Support 1.00 1.00 0.25
GrossMargin 7.50 7.50 8.25
Sales&Marke&ng
Media 1.00 3.00 3.00
Sales Reps 6.00 1.00 0.40
0.50 3.50 4.85
Built & Maintenance
Prod Dev, Support + G&A
2.50 2.50 0.80
Profit (2.0) 1.00 4.05
B8. Strong unit economics from Indian SaaS companies, due to Inside Sales
All figures in USD Million
# 18

B9. Focus on CAC during $1M - $5M ARR critical for hyper-growth
800 1,050
750 600
400
325
150 200
150
150
150 150
5-15M 1-5M
1,350
< 1M > 15M
1,050
1,525
950 1,000
Support cost
CAC Employee cost
Evolution of normalized costs with business size2,3
Costs per million dollars revenue (USD k)
Revenue mix (New/Existing customers)
80/20 70/30 50/50 40/60
Revenue churn2,3
● Cash negative initially with high churn and most cash outflow on CAC
● CAC highest between $1M to $5M ARR range
● Post $15M, recurring revenue from existing customers takes over
40%
25% 20%
15%
25%
15%
5%
-5% -10%
-5% 0% 5%
10% 15% 20% 25% 30% 35% 40% 45%
< 1M 1-5M 5-15M > 15M
Evolution of SaaS business metrics
Revenue
Revenue
# 19

Segments with high demand fulfillment from the US and a higher cost arbitrage for India present big opportunities for Indian SaaS companies to be built
Education
Web / App UX Design
HR / Identity Management
Sales / CRM
Data Management / Visualization
Web Hosting
Healthcare Software
Marketing & Ecom Enablement
Accounting, Billing & Collections
IT Security/ Antivirus
File Sharing & Backup
Productivity & Collaboration
BPM
Online Survey
Photo & Video Editing Events & Mtg Mgmt
Services, Support & Helpdesk
ERP
Finance, Payroll & Expenses
Retail
Developer Softwares
Logistics/Fleet/GPS
BI Analytics
Restaurant/ Hotel Mgmt.
0%
10%
20%
30%
40%
50%
60%
70%
80%
90%
100%
110%
1 1.5 2 2.5 3 3.5 4 4.5 5
Dem
and
Fulfi
llmen
t by
US
Cost Arbitrage for Businesses in India (Low to High)
Chart Legend: • Size of the bubble: Online interest
(search volumes) for the category in 20154
• X axis: Cost arbitrage for businesses in India for the segment3
• Y axis represents the traffic to SaaS businesses’ webpage10
B10. Market categories where big SaaS startups can emerge from India
# 20

0.6
2.5
10
2.6%
3.3%
8.0%
-
2.0
4.0
6.0
8.0
10.0
12.0
2015 2020 2025
Global SMB SaaS Fulfilment from India
Global Share of India
● Currently, a few horizontal segments where big SaaS companies catering to a Global market have emerged out of India
● Maturity and scale of most startups starting to happen
now
● By 2020, a good number of Indian companies will be targeting most opportunity areas
● By 2025, many of them would have scaled and captured
sizeable market share
B11. Indian SaaS industry can touch $10Bn by 2025
Indian SMB SaaS industry projection2,3 Highlights
Revenue in USD Billion
A perfect storm of a) changing customer behavior, b) market accessibility & growth, c) talent availability and d) cost advantage has created an incredible setting for massive global SaaS companies to be built out of India
# 21

A. The hyper-growing SaaS Industry
B. India’s place in the SaaS hyper-growth
C. SaaS for Emerging Markets
D. Key takeaways for the SaaS Industry & Entrepreneurs from India
Contents
# 22
Lack of legacy software • Many large enterprises in EMs have adopted only basic software and are now open to new software that improves productivity and
increases revenue making it much easier to adopt Cloud
Product fit • Products are being built to meet the unique needs in emerging markets (e.g. mobile-first) and at EM price points
Costs & profitability for customer • Cloud models for technology adoption are being accepted given low upfront costs • Increasing cost of skilled labor driving productivity needs across enterprises • Fastest adoption of SaaS in revenue generating functions
Sales model • Enterprises still need a “high-touch” selling model, however, the cost of in-market sales teams much lower in EMs
Opportunities across verticals • New age companies in EMs (e.g. ecommerce) are becoming the first to embrace SaaS products. Other verticals quickly catching up
Source: Based on analyses by Zinnov and Accel
C1. Emerging Markets could become large Enterprise SaaS markets over the next decade
# 23

Source: Based on analyses by Zinnov and Accel
Customize for local languages • Local languages are the primary business language for most of the SMBs in EMs
Mobile-first • Be mobile first rather than mobile-enabled
Offer value & innovate on pricing • Use network effects to offer value based verticalized SaaS offerings - scaling quickly, becomes all the more important • Align pricing to business objectives / outcome of the clients instead on purely relying on subscription based pricing
Online-offline integration • Build products that are able to work offline (cost of data still high) • Build low data consuming products (connectivity unreliable)
C2. Great SaaS products for EMs can learn from consumer products
# 24

A. The hyper-growing SaaS Industry
B. India’s place in the SaaS hyper-growth
C. SaaS for Emerging Markets
D. Key takeaways for the SaaS Industry & Entrepreneurs from India
Contents
# 25
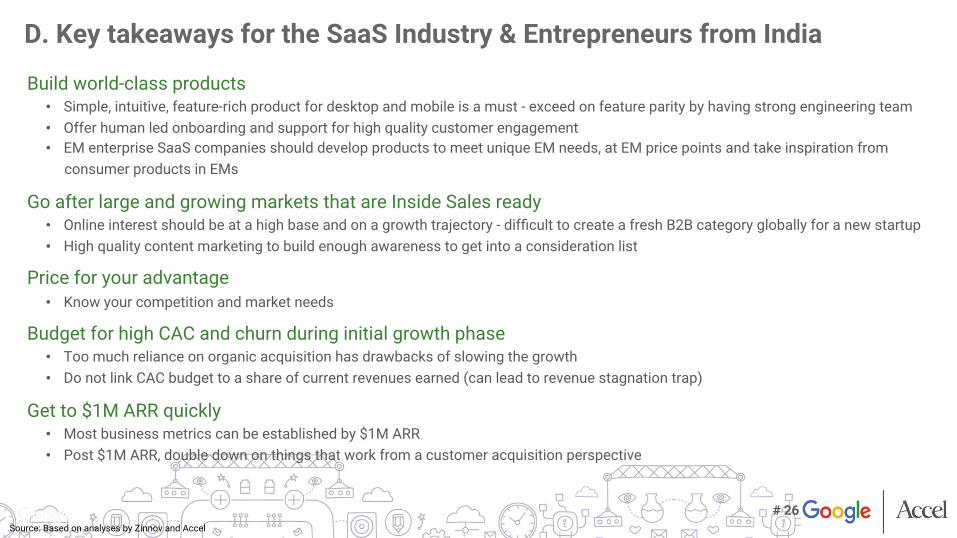
Build world-class products • Simple, intuitive, feature-rich product for desktop and mobile is a must - exceed on feature parity by having strong engineering team • Offer human led onboarding and support for high quality customer engagement • EM enterprise SaaS companies should develop products to meet unique EM needs, at EM price points and take inspiration from
consumer products in EMs
Go after large and growing markets that are Inside Sales ready • Online interest should be at a high base and on a growth trajectory - difficult to create a fresh B2B category globally for a new startup • High quality content marketing to build enough awareness to get into a consideration list
Price for your advantage • Know your competition and market needs
Budget for high CAC and churn during initial growth phase • Too much reliance on organic acquisition has drawbacks of slowing the growth • Do not link CAC budget to a share of current revenues earned (can lead to revenue stagnation trap)
Get to $1M ARR quickly • Most business metrics can be established by $1M ARR • Post $1M ARR, double down on things that work from a customer acquisition perspective
Source: Based on analyses by Zinnov and Accel
D. Key takeaways for the SaaS Industry & Entrepreneurs from India
# 26
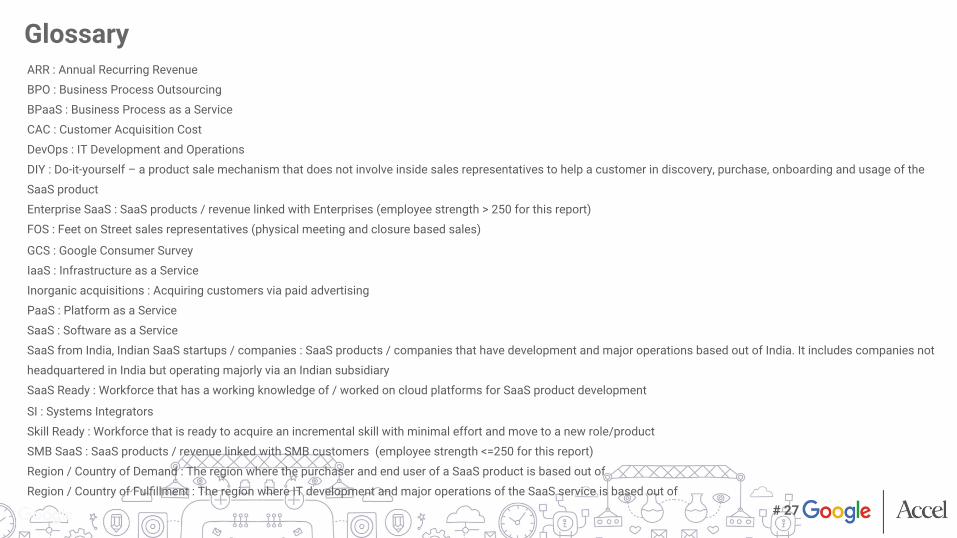
ARR : Annual Recurring Revenue
BPO : Business Process Outsourcing
BPaaS : Business Process as a Service
CAC : Customer Acquisition Cost
DevOps : IT Development and Operations
DIY : Do-it-yourself – a product sale mechanism that does not involve inside sales representatives to help a customer in discovery, purchase, onboarding and usage of the
SaaS product
Enterprise SaaS : SaaS products / revenue linked with Enterprises (employee strength > 250 for this report)
FOS : Feet on Street sales representatives (physical meeting and closure based sales)
GCS : Google Consumer Survey
IaaS : Infrastructure as a Service
Inorganic acquisitions : Acquiring customers via paid advertising
PaaS : Platform as a Service
SaaS : Software as a Service
SaaS from India, Indian SaaS startups / companies : SaaS products / companies that have development and major operations based out of India. It includes companies not
headquartered in India but operating majorly via an Indian subsidiary
SaaS Ready : Workforce that has a working knowledge of / worked on cloud platforms for SaaS product development
SI : Systems Integrators
Skill Ready : Workforce that is ready to acquire an incremental skill with minimal effort and move to a new role/product
SMB SaaS : SaaS products / revenue linked with SMB customers (employee strength <=250 for this report)
Region / Country of Demand : The region where the purchaser and end user of a SaaS product is based out of
Region / Country of Fulfillment : The region where IT development and major operations of the SaaS service is based out of
Glossary
# 27
[1] Forrester Global Cloud Estimates (http://onforb.es/18dQ1zA) [2] Zinnov analysis conducted independently in 2016, based upon primary interviews and secondary research [3] Accel India estimates based on internal studies of global and Indian SaaS companies
[4] Google search trends indexed data for calendar years 2013, 2014 and 2015 [5] Public data on SaaS industry funding (http://bit.ly/1oKYthM)
[6] Google Consumer Survey for SMB consumers targeted to the US (Jan-Feb 2016) [7] LinkedIn secondary research conducted by Zinnov in 2016
[8] Glassdoor secondary research conducted by Zinnov in 2016 [9] Primary interviews of SaaS founders from India by Zinnov in 2016
[10] Comscore data for the calendar year 2013, 2014 and 2015
Sources
# 28

Rajan Anandan MD & VP, Google India & South-East Asia Shekhar Kirani Partner, Accel India
Amiya Adwitiya Accel India [email protected] Arpit Jaiswal Industry Manager - Software as a Service, Google India [email protected] Jayank Srivastava Analytical Lead, Google India Karan Gambhir Industry Head - Technology, Google India Nitin Bawankule Director – Google India & South Asia Frontier
Contact
# 29

The information and opinions in this Report have been prepared or compiled by ACCEL PARTNERS and are subject to change/modification without any notice. The information contained in this Report is believed to be accurate at the time of date of issue of this Report, but no representation or warranty is given (express or implied) as to its accuracy, completeness or correctness. ACCEL PARTNERS accepts no liability whatsoever for any direct, indirect or consequential loss or damage arising in any way from any use of or reliance placed on this material for any purpose. The contents of this Report are the copyright of ACCEL PARTNERS. Nothing on this Report constitutes advice, nor creates any contractual relationship. Google does not take any responsibility on the findings of the research or any data/methods used by third parties in compilation of the report.
Disclaimer
# 30