Embed Size (px)
Citation preview

October 10, 2013
4 Steps to Take Back Control of your Datacenter IT Ops
Mick NolenSr. Systems Engineer, Zenoss
Deepak KanwarMarketing Strategist, Zenoss

2
Webinar Logistics
• All lines are in listen-only mode
• We will answer questions throughout and at the end, so please post questions early and often
• Link to webcast recording will be emailed shortly after the show
• Stay in touch- Twitter @zenoss
- FB https://www.facebook.com/Zenoss
- Google+ https://plus.google.com/u/0/+zenoss/posts
© 2013 All rights reserved.

3
Zenoss at a Glance
Cool Vendor inIT Operations 2010
Best Monitoring Toolfor the Cloud
• Transforming IT Operations• Founders lived the pain of legacy platforms at pioneering cloud providers• New approach to both technology and business
• Leading Commercial Open Source Player in Category• Large Global Footprint: 2.4M Downloads, 35K Organizations, 175 Countries• Large Active Community: 105K Members• Rapid Innovation & Lower Costs
• Fastest Growing Enterprise Management Software Company• 2010, 2011,2012 Inc 500• 2011 #22 2012 #55 on Deloitte Fast 500• Growth across key segments: Enterprise, Web, Federal, SMB, Service Provider
• Most Widely Adopted Cloud Management Console• Largest install-base of any cloud-capable management product in the market• Unifies physical, virtual & cloud monitoring• Enables public, private and hybrid cloud scenarios
• Strong Business & Team• Rapid growth with new customer acquisition and retention• Annapolis, MD & Austin, TX & San Jose, CA
© 2013 All rights reserved.

4
Agenda
• What are the issues we are facing today?
• The 4 things you can do to stem the tide
• How can Zenoss help?
• Q&A
© 2013 All rights reserved.

5
Today’s Datacenter Issues
© 2013 All rights reserved.
Virtualized
Converged Infrastructure Legacy
Public Clouds
Private Clouds
Hybrid Clouds
Access Devices
6
Systems are broken
© 2013 All rights reserved.
“How often do performance / availability issues occur within your organization that impact your business applications/services?”
Source: A commissioned study conducted by Forrester Consulting on behalf of Zenoss, August 2013
Base: 157 North American IT decision makers
Disruptions are common
“When a performance or availability issue arises, how is the support function in your organization usually
alerted?”
The reporting process is fragmented
7
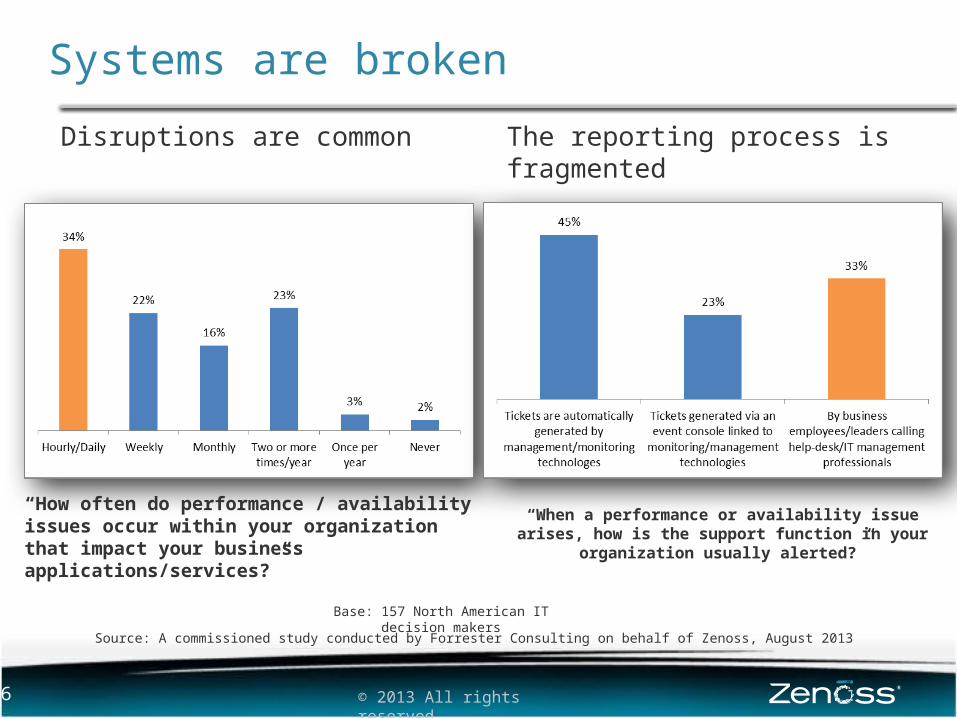
Resolution is NOT Easy
© 2013 All rights reserved.
41% Root Cause Analysis can take between 1 hour and 5 days
72%Determining the root cause requires human intervention
63% Need 4-10+ Full Time Employees to address a major disruption
Source: A commissioned study conducted by Forrester Consulting on behalf of Zenoss, August 2013
Base: 157 North American IT decision makers
8
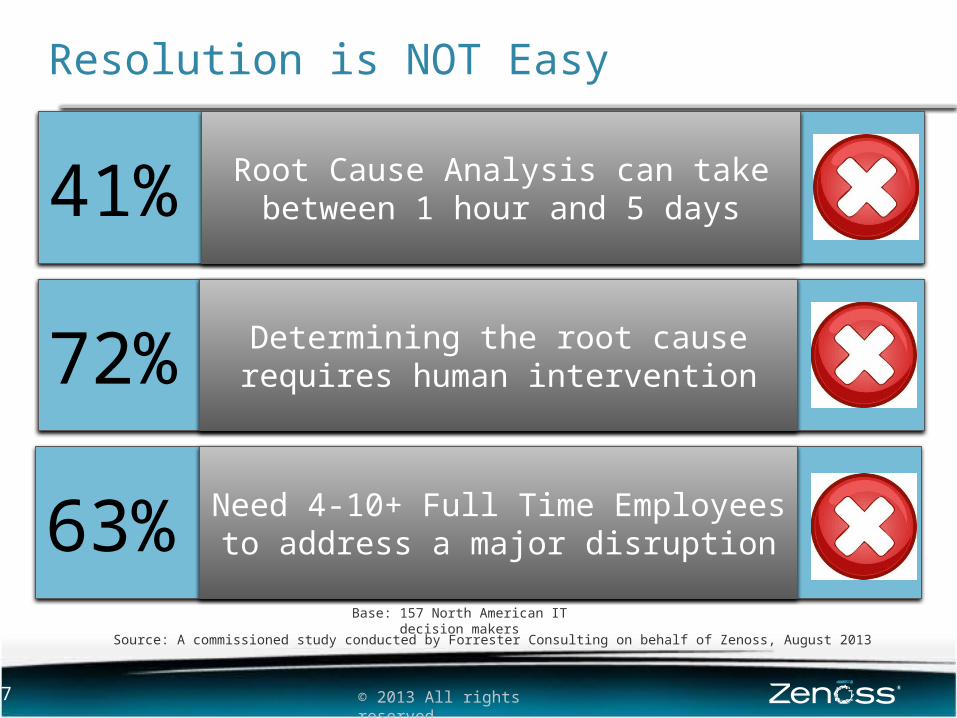
Poll
• What does your IT monitoring look like?
• An adhoc mix of tools that have been accumulated over time
• Mix of solutions centered around the main technology
components
• One main technology management suite augmented by a
tightly integrated set of other products
• One holistic technology management from one vendor
© 2013 All rights reserved.
9
Recommendations
© 2013 All rights reserved.
• The 4 things you can do to stem the tide
• Reduce MTTK
• Enable end-to-end, unified monitoring
• Measure and understand the real TCO of your
environment
• Enable intelligent Capacity Planning and
Infrastructure Optimization

10
Recommendations
© 2013 All rights reserved.
• The 4 things you can do to stem the tide
• Reduce MTTK
• Enable end-to-end, unified monitoring
• Measure and understand the real TCO of your
environment
• Enable intelligent Capacity Planning and
Infrastructure Optimization

11
Anatomy of Mean Time To Resolution
© 2013 All rights reserved.
MTTI MTTK MTTF MTTV
Mean Time To Inform
Mean Time To Know
Mean Time To Fix
Mean Time To Validate
Figuring out the Root Cause
Mean Time To Resolution
Disruption begins
Normalcy is restored

12
MTTK is a HUGE determinant of MTTR
© 2013 All rights reserved.
Once Root Cause is determined, resolution moves quickly
MTTK: Mean Time To Know, time required to determine the root cause of an issueMTTK gives you the biggest bang for your buck
Source: A commissioned study conducted by Forrester Consulting on behalf of Zenoss, August 2013
Base: 157 North American IT decision makers

13 © 2013 All rights reserved.
1
2-3
4-6
7-10
10+
Don’t know
2%
28%
33%
14%
16%
7%
Root Cause Analysis takes up some your best Resources
FTEs needed to address a
major outage
14
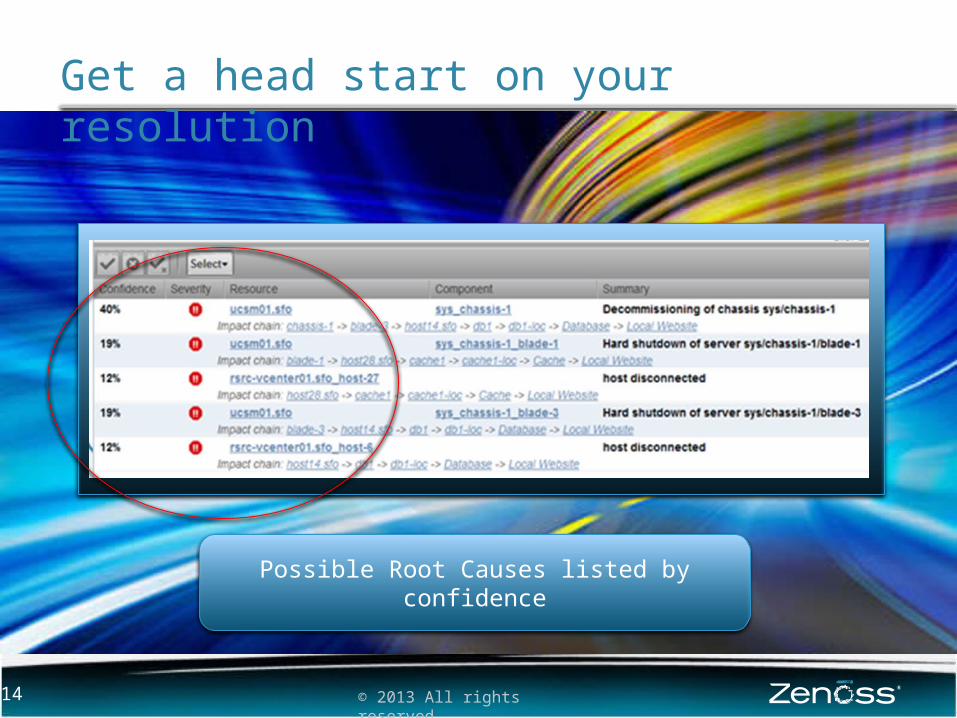
Get a head start on your resolution
© 2013 All rights reserved.
Possible Root Causes listed by confidence

15
Key Takeaways
• Mean Time To Know (MTTK) is the biggest driver of
MTTR
• Root Cause Analysis can take time and your best
resources
• Your tools must provide you with a way to shorten MTTK
© 2013 All rights reserved.

16
Recommendations
© 2013 All rights reserved.
• The 4 things you can do to stem the tide
• Reduce MTTK
• Enable end-to-end, unified monitoring
• Measure and understand the real TCO of your
environment
• Enable intelligent Capacity Planning and
Infrastructure Optimization

17
Service
Database
SAN
Virtual LAN
Virtual Machine
Physical Network
Public Cloud
Elemental Monitoring alone is Detrimental
© 2013 All rights reserved.
Monitoring
Monitoring
Monitoring
Monitoring
Monitoring
Monitoring

18
Get a Service-Centric view
© 2013 All rights reserved.
• Know the topology of your environment
• Automate Root Cause Analysis
• Realize end-to-end service-centric monitoring
19
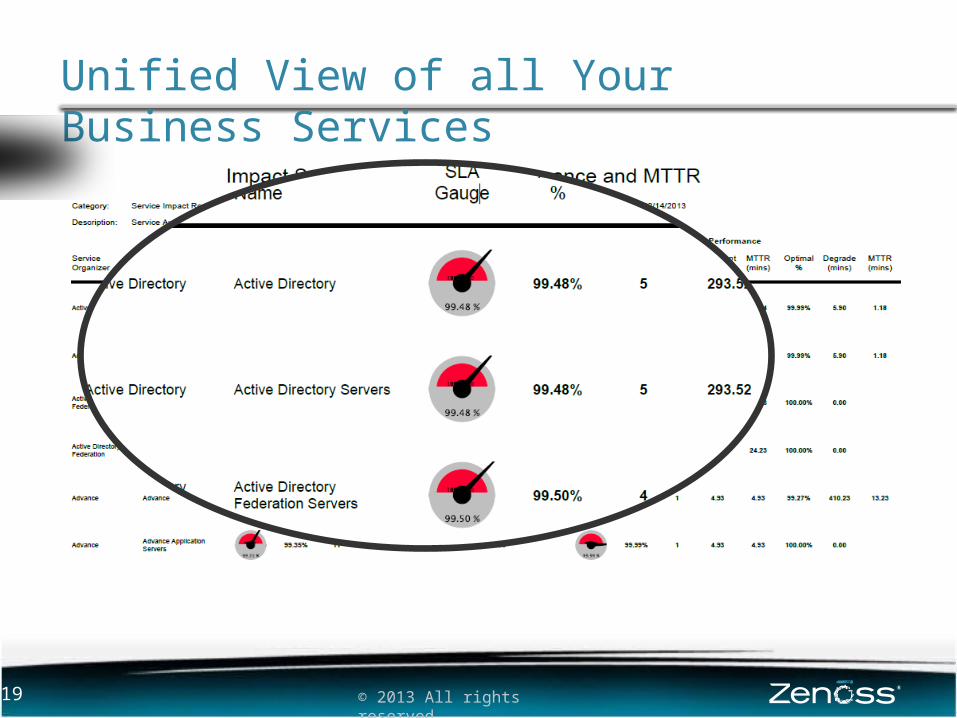
Unified View of all Your Business Services
© 2013 All rights reserved.

20
Key Takeaways
• Monitoring using Elemental tools is inefficient and
increases complexity
• Need to take a service-centric view to expedite
RCA/MTTK
• Unified monitoring enables you to get comprehensive
views of your environment
© 2013 All rights reserved.
21
Recommendations
© 2013 All rights reserved.
• The 4 things you can do to stem the tide
• Reduce MTTK
• Enable end-to-end, unified monitoring
• Measure and understand the real TCO of your
environment
• Enable intelligent Capacity Planning and
Infrastructure Optimization

22
If you call now ….
We will even throw in this “$100 million” list price
software for FREE!!!!
23
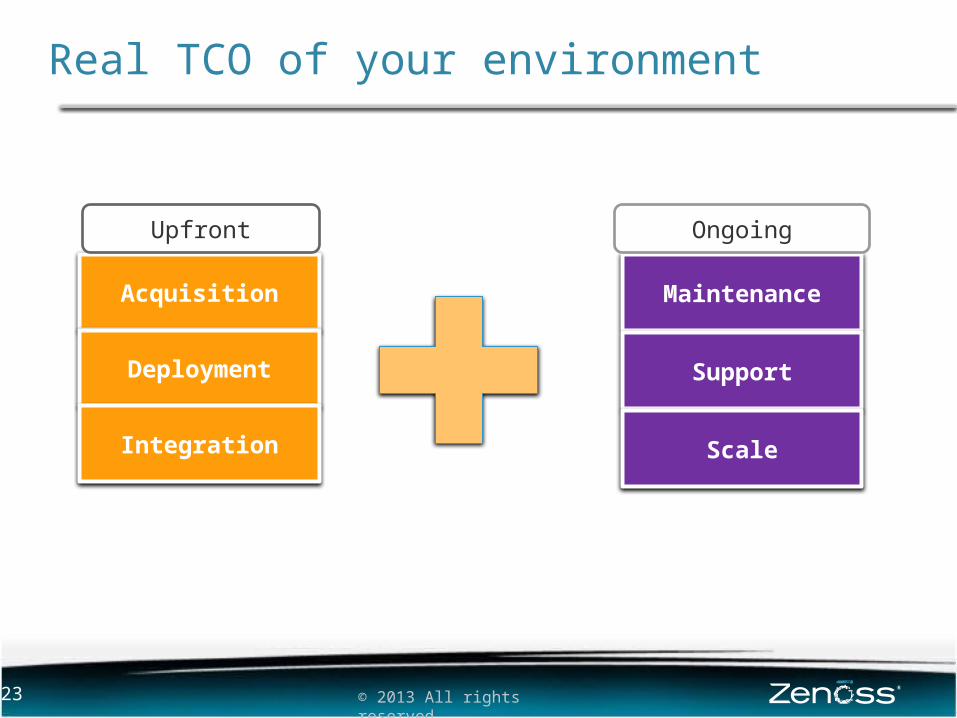
Real TCO of your environment
© 2013 All rights reserved.
Acquisition
Deployment
Integration
Maintenance
Support
Scale
Upfront Ongoing

24
Real TCO of your environment
© 2013 All rights reserved.
Acquisition
Deployment
Integration
Upfront
• What is the cost of the solution?• How much do I have to pay in maintenance?• How is it calculated?
• How many products am I actually deploying?• How much will a ProServ engagement run?• Does it need dedicated infrastructure?• Does it require proprietary infrastructure?
• How will this impact my current environment?• Do I have to change my current
processes/workflows to accommodate this solution? If yes, what will that cost?
“Even though the solution was free, maintenance is
charged on List Price”

25
Real TCO of your environment
© 2013 All rights reserved.
Day to Day Ops
Maint & Support
Extensibility
Ongoing
• Do I need specialized skills to run the solution?
• Are those skills readily available?• Can those skills be applied elsewhere?• Does this speed up my RCA?
• Is there a professional support organization supporting the product?
• Is there one number to get support?
• Can I easily extend the solution?• Is it going to be rip & replace?
“You must have PostgreSQL skills
in house”

26
Calculating 3 Year TCO
© 2013 All rights reserved.
List price = $0Acquisition Price = $0Maint = $0Specialized Personnel = 2Average MTTR = 3 Hours
3 year TCO = $2,650,000
List price = $500,000Acquisition cost = $0Maint = $100,000Specialized personnel = 1Average MTTR= 1 Hour
3 year TCO = $1,180,000
• Infrastructure = $10,000• Cost of System Admin = $100,000• Cost of Specialized Personnel (SP)= $90,000• Cost of Downtime = $50,000/Hour• Average Outages/year = 12
3 Yr TCO = Acquisition Cost + Infrastructure cost + 3*Maint + 3*Specialized Personnel + 3*SysAdmn + 3*(Cost of downtime*MTTR*# of outages/Year)
Free Solution Maintenance only
List price = $500,000Acquisition cost = $0Maint = $100,000Specialized personnel = 0Average MTTR = 1 Hour
3 year TCO = $910,000
Maintenance only

27
Key Inputs for TCO calculations
© 2013 All rights reserved.
• Cost of Acquisition
• Cost of Maintenance/Support
• Cost of Infrastructure
• Cost of System Admin
• Cost of Specialized personnel e.g. PostgreSQL
administrator
• Cost of proprietary hardware
• Cost of MTTR (Downtime cost + Labor cost)

28
Key Takeaways
• Free software is NOT free
• Software might require specialized skills/infrastructure
• Downtime, often driven by MTTK is a huge part of TCO
• Identify relevant inputs as you calculate your TCO
© 2013 All rights reserved.
29
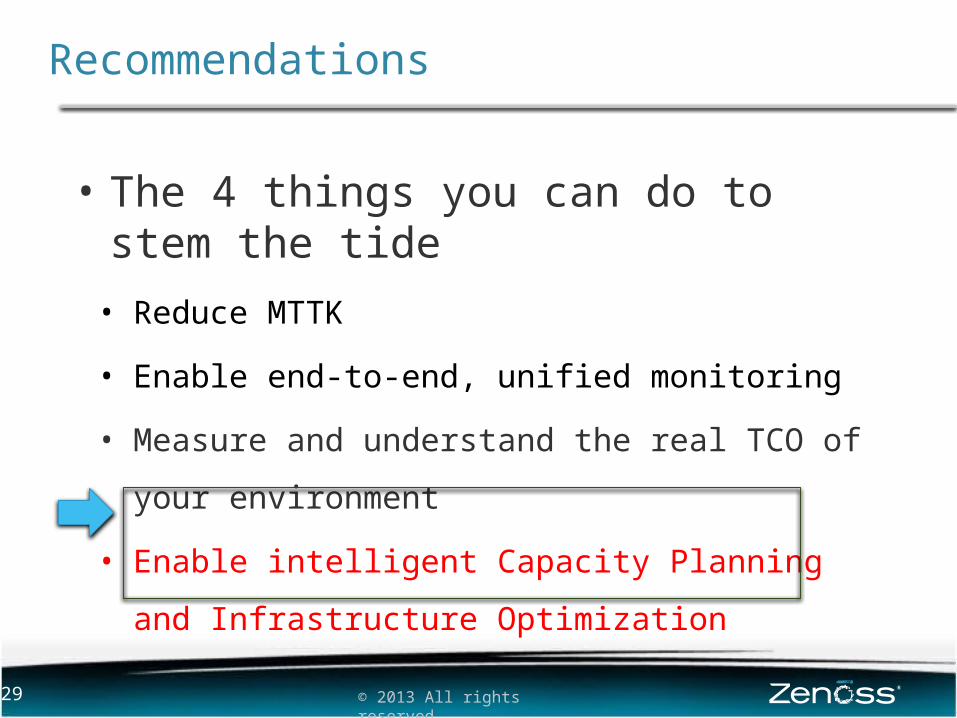
Recommendations
© 2013 All rights reserved.
• The 4 things you can do to stem the tide
• Reduce MTTK
• Enable end-to-end, unified monitoring
• Measure and understand the real TCO of your
environment
• Enable intelligent Capacity Planning and
Infrastructure Optimization

30
Capacity Planning the #1 cause of failures
“What would you say are the three main causes of technology performance or availability issues in your environment today?”
Source: A commissioned study conducted by Forrester Consulting on behalf of Zenoss, August 2013
Base: 157 North American IT decision makers

31 © 2013 All rights reserved.
• Understand and follow your utilization rates and trends
• Provide key input into your Capacity Planning & infrastructure optimization
• Needs Unified Monitoring to be viable
Right Capacity does not just happen

32
Need to have historical perspective
© 2013 All rights reserved.

33
Key Takeaways
• Capacity Planning is key to your service delivery
• Monitoring tools must be leveraged to make capacity
planning more intelligent
© 2013 All rights reserved.

HOW CAN ZENOSS HELP?
© 2013 All rights reserved.

35
How can Zenoss Service Dynamics help?
Resource Manager
Impact Analytics
ZenPacks•Bring extensibility to Zenoss platform
•Add capability without rip & replace
Resource Manager• Unified full-stack monitoring• Topology modeling and
visualization• Large scale event
processing• Multi-instance event
aggregation
Impact• Real time service
dependency mapping and impact analysis
• Automated root cause analysis
Analytics• Service Level Reporting
from a Single Dashboard. • Trends & Patterns to help
Root Cause Analysis• Input for Capacity planning
& infrastructure optimization
ZenPacks

DEMO
© 2013 All rights reserved.
37
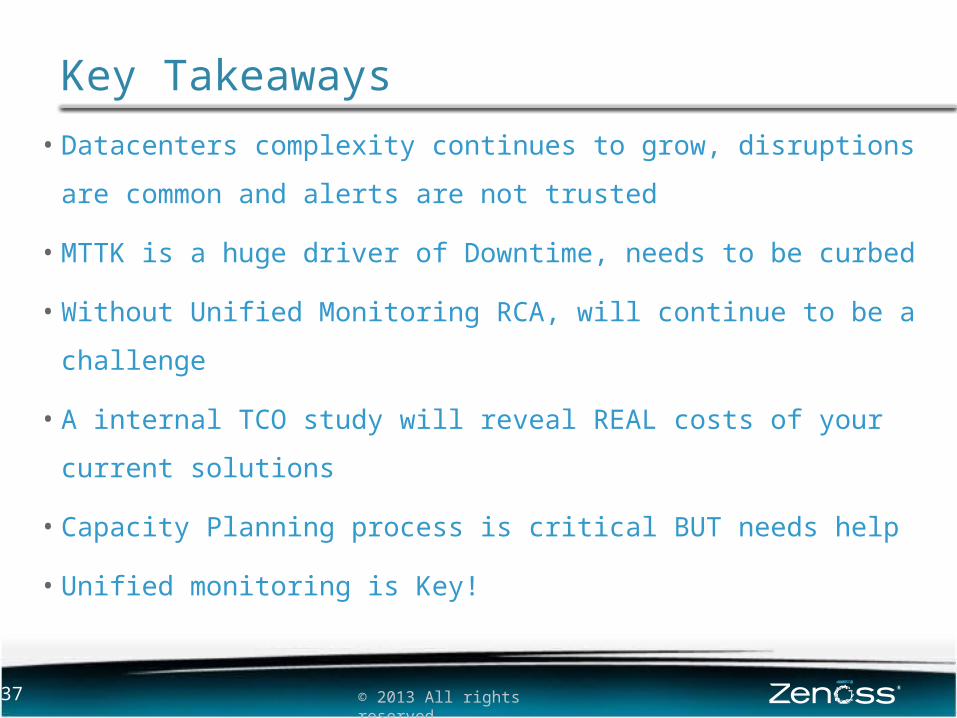
Key Takeaways
© 2013 All rights reserved.
• Datacenters complexity continues to grow, disruptions are
common and alerts are not trusted
• MTTK is a huge driver of Downtime, needs to be curbed
• Without Unified Monitoring RCA, will continue to be a challenge
• A internal TCO study will reveal REAL costs of your current
solutions
• Capacity Planning process is critical BUT needs help
• Unified monitoring is Key!
38
Q&A
For more information:
www.zenoss.com | blog.zenoss.com
toll-free +1-888-936-6770