Embed Size (px)
Citation preview

Prism Solar Technologies – 5th PVPMC Santa Clara CA 2016
Annual Bifacial Energy Yield Best-Fit Model
by Jose Castillo-Aguilella [email protected]
5Th PV Performance Modelling and Monitoring Workshop Santa Clara, California
Prism Solar Technologies – 5th PVPMC Santa Clara CA 2016
Prism Solar Technologies
• Prism Solar founded in 2005.
• Researched bifacial and holographic technology and applications since 2008; 5 awarded patents in bifacial technology and applications.
• Manufacturing of bifacial modules since 2012.
Prism Solar Technologies – 5th PVPMC Santa Clara CA 2016
Rating of Bifacial Modules is Generally Left to Manufacturers
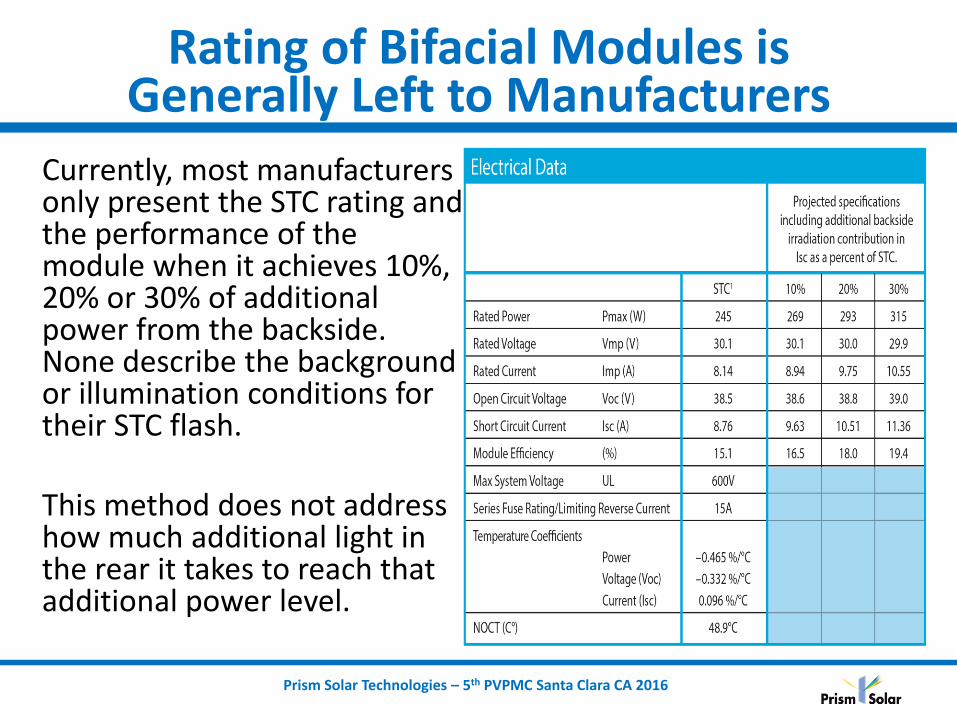
Currently, most manufacturers only present the STC rating and the performance of the module when it achieves 10%, 20% or 30% of additional power from the backside. None describe the background or illumination conditions for their STC flash. This method does not address how much additional light in the rear it takes to reach that additional power level.
Prism Solar Technologies – 5th PVPMC Santa Clara CA 2016
What is the True Rating of a Bifacial Module?
Manufacturer
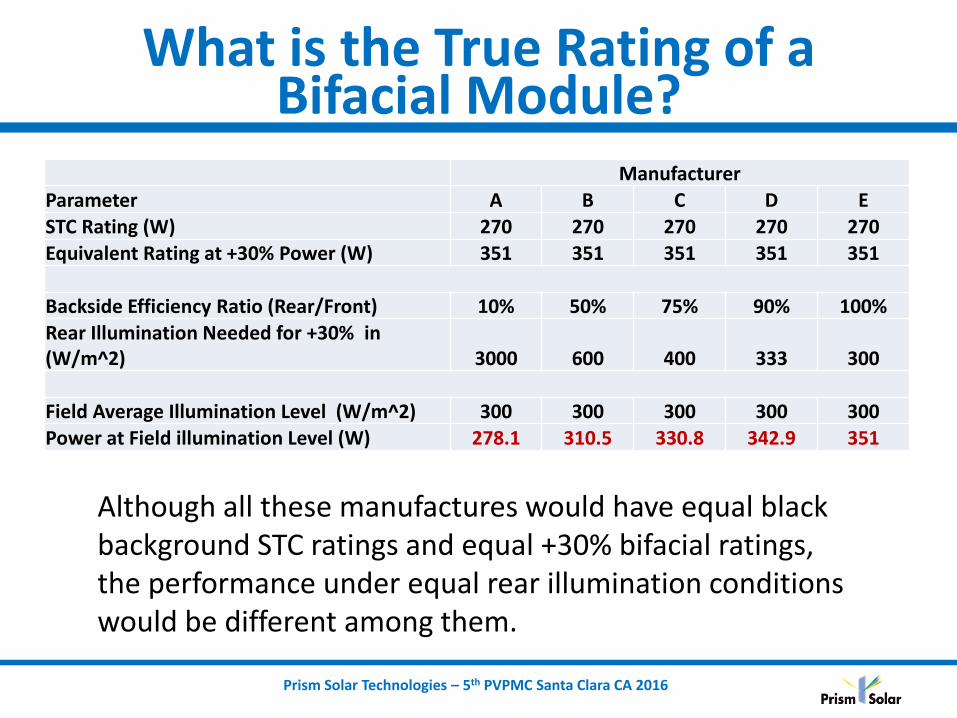
Parameter A B C D E STC Rating (W) 270 270 270 270 270
Equivalent Rating at +30% Power (W) 351 351 351 351 351
Backside Efficiency Ratio (Rear/Front) 10% 50% 75% 90% 100% Rear Illumination Needed for +30% in (W/m^2) 3000 600 400 333 300
Field Average Illumination Level (W/m^2) 300 300 300 300 300 Power at Field illumination Level (W) 278.1 310.5 330.8 342.9 351
Although all these manufactures would have equal black background STC ratings and equal +30% bifacial ratings, the performance under equal rear illumination conditions would be different among them.

Prism Solar Technologies – 5th PVPMC Santa Clara CA 2016
BSTC = Bifacial STC
BSTC provides additional relevant information about the bifacial performance of a module. By comparing the BSTC and Front STC ratings, the rear STC module efficiency can be estimated. Alternatively, if the Front STC and Rear STC is given, the BSTC can be determined. Bifacial ratings, safety protections and wiring sizing should account for bifacial effects.
BSTC conditions (TÜV and Prism guidelines) = Cell temp 25°C, AM1.5, 1000W/m2 (front) + 300W/m2 (rear)
Prism Solar Technologies – 5th PVPMC Santa Clara CA 2016
Modules Used in the Study
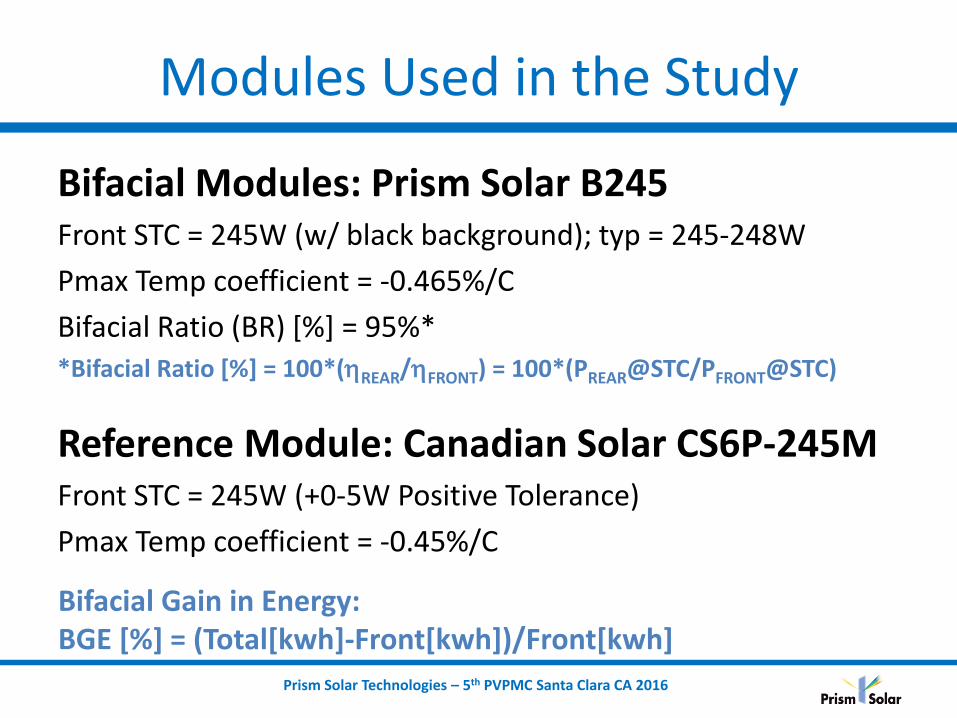
Bifacial Modules: Prism Solar B245 Front STC = 245W (w/ black background); typ = 245-248W
Pmax Temp coefficient = -0.465%/C
Bifacial Ratio (BR) [%] = 95%*
*Bifacial Ratio [%] = 100*(REAR/FRONT) = 100*(PREAR@STC/PFRONT@STC)
Reference Module: Canadian Solar CS6P-245M Front STC = 245W (+0-5W Positive Tolerance)
Pmax Temp coefficient = -0.45%/C
Bifacial Gain in Energy: BGE [%] = (Total[kwh]-Front[kwh])/Front[kwh]
Prism Solar Technologies – 5th PVPMC Santa Clara CA 2016
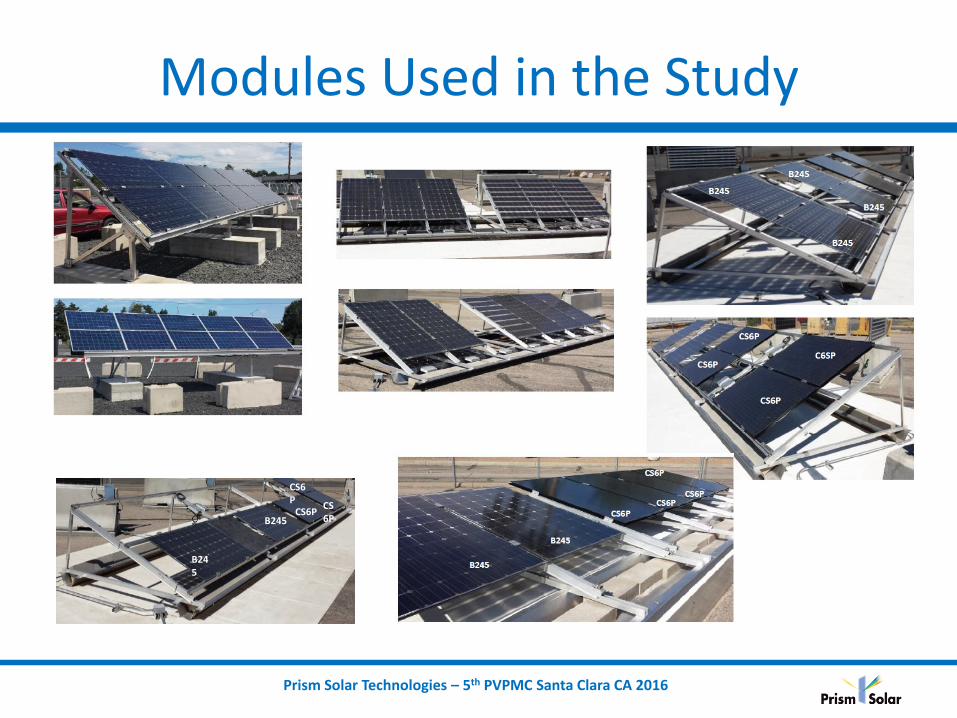
B245
B245 CS6P
CS6P
CS6P
Modules Used in the Study
Prism Solar Technologies – 5th PVPMC Santa Clara CA 2016
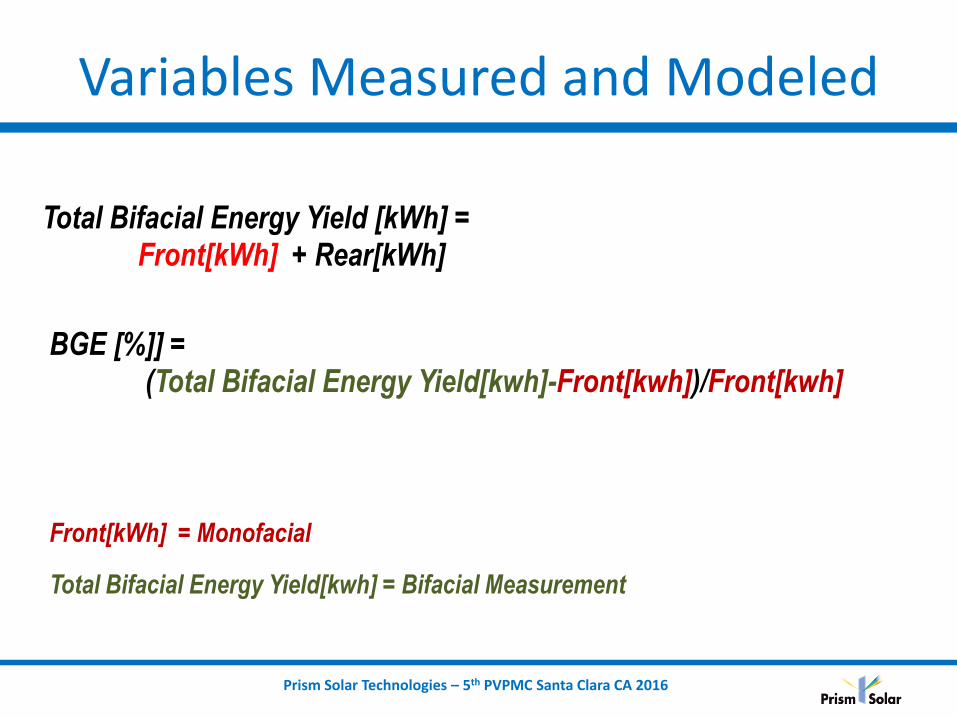
Variables Measured and Modeled
Total Bifacial Energy Yield [kWh] = Front[kWh] + Rear[kWh]
BGE [%]] = (Total Bifacial Energy Yield[kwh]-Front[kwh])/Front[kwh]
Front[kWh] = Monofacial
Total Bifacial Energy Yield[kwh] = Bifacial Measurement
Prism Solar Technologies – 5th PVPMC Santa Clara CA 2016
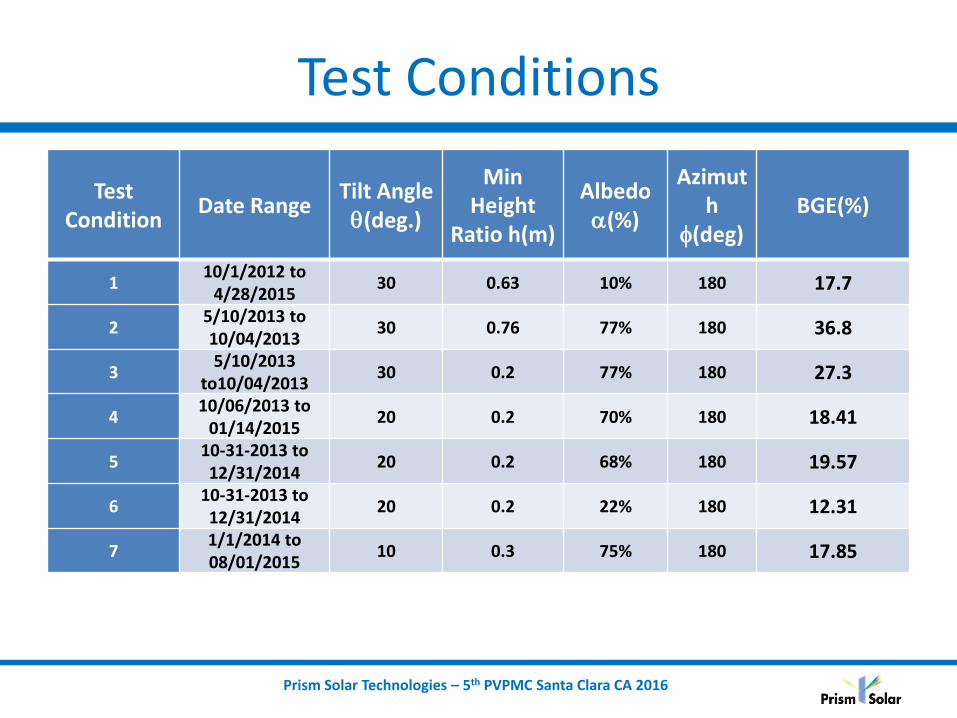
Test Conditions
Test Condition
Date Range Tilt Angle (deg.)
Min Height
Ratio h(m)
Albedo (%)
Azimuth
(deg) BGE(%)
1 10/1/2012 to
4/28/2015 30 0.63 10% 180 17.7
2 5/10/2013 to 10/04/2013
30 0.76 77% 180 36.8
3 5/10/2013
to10/04/2013 30 0.2 77% 180 27.3
4 10/06/2013 to
01/14/2015 20 0.2 70% 180 18.41
5 10-31-2013 to 12/31/2014
20 0.2 68% 180 19.57
6 10-31-2013 to 12/31/2014
20 0.2 22% 180 12.31
7 1/1/2014 to 08/01/2015
10 0.3 75% 180 17.85
Prism Solar Technologies – 5th PVPMC Santa Clara CA 2016
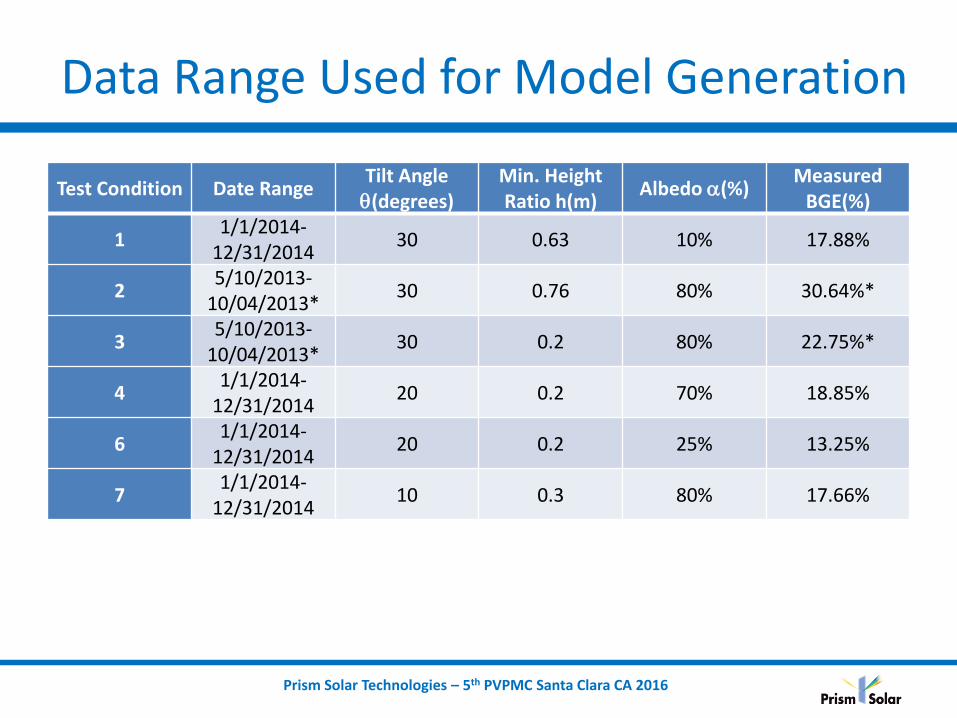
Data Range Used for Model Generation
Test Condition Date Range Tilt Angle (degrees)
Min. Height Ratio h(m)
Albedo (%) Measured
BGE(%)
1 1/1/2014-
12/31/2014 30 0.63 10% 17.88%
2 5/10/2013-
10/04/2013* 30 0.76 80% 30.64%*
3 5/10/2013-
10/04/2013* 30 0.2 80% 22.75%*
4 1/1/2014-
12/31/2014 20 0.2 70% 18.85%
6 1/1/2014-
12/31/2014 20 0.2 25% 13.25%
7 1/1/2014-
12/31/2014 10 0.3 80% 17.66%

Prism Solar Technologies – 5th PVPMC Santa Clara CA 2016
For Detailed Information on Data Set
1. J. E. Castillo-Aguilella and P. S. Hauser, "Multi-Variable Bifacial
Photovoltaic Module Test Results and Best-Fit Annual Bifacial Energy
Yield Model," in IEEE Access, vol. 4, pp. 498-506, 2016.
[DOI:10.1109/ACCESS.2016.2518399]
2. J E Castillo-Aguilella, “Multi-Year Study of Bifacial Energy Gains Under
Various Field Conditions”. 4th PV Performance Modelling Workshop.
Cologne, Germany on October 23rd, 2015.
Prism Solar Technologies – 5th PVPMC Santa Clara CA 2016
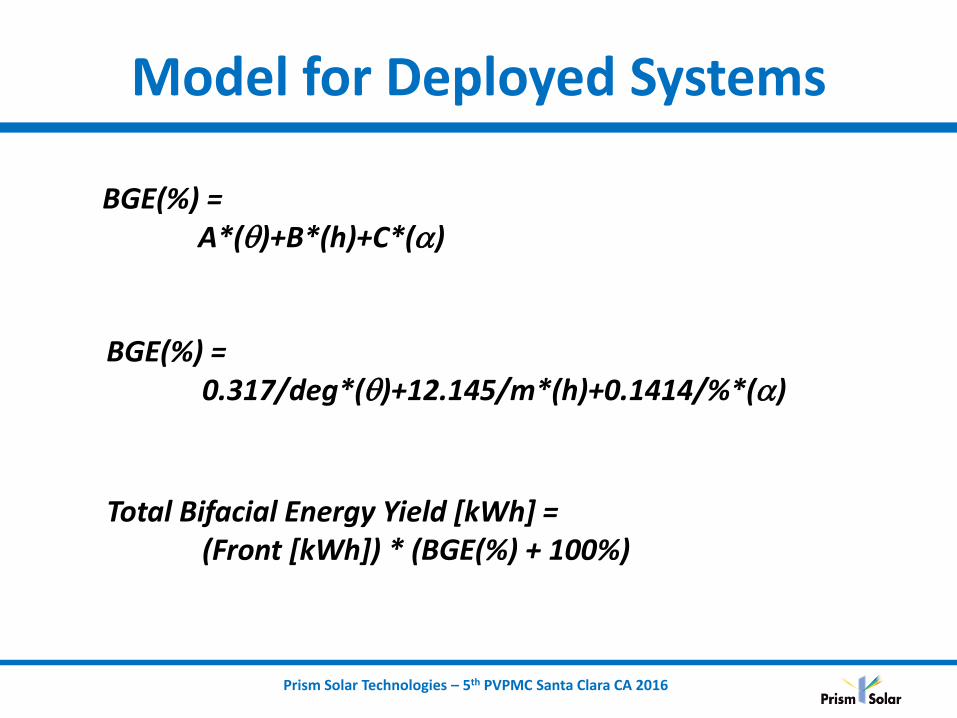
Model for Deployed Systems
BGE(%) = A*()+B*(h)+C*()
BGE(%) = 0.317/deg*()+12.145/m*(h)+0.1414/%*()
Total Bifacial Energy Yield [kWh] = (Front [kWh]) * (BGE(%) + 100%)
Prism Solar Technologies – 5th PVPMC Santa Clara CA 2016
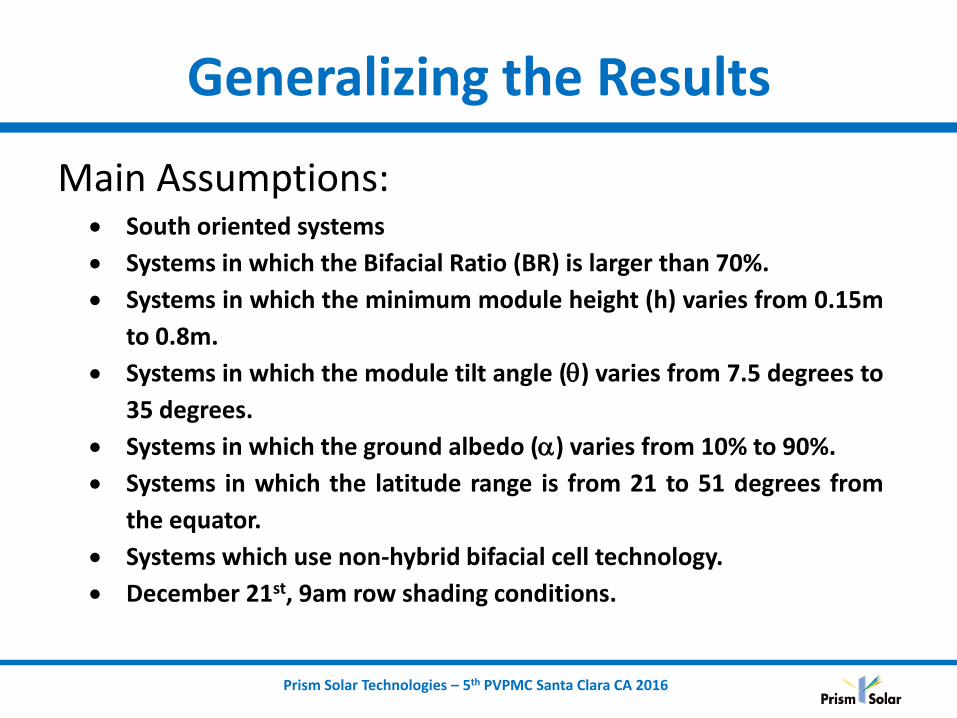
Generalizing the Results
Main Assumptions: South oriented systems
Systems in which the Bifacial Ratio (BR) is larger than 70%.
Systems in which the minimum module height (h) varies from 0.15m
to 0.8m.
Systems in which the module tilt angle () varies from 7.5 degrees to
35 degrees.
Systems in which the ground albedo () varies from 10% to 90%.
Systems in which the latitude range is from 21 to 51 degrees from
the equator.
Systems which use non-hybrid bifacial cell technology.
December 21st, 9am row shading conditions.
Prism Solar Technologies – 5th PVPMC Santa Clara CA 2016
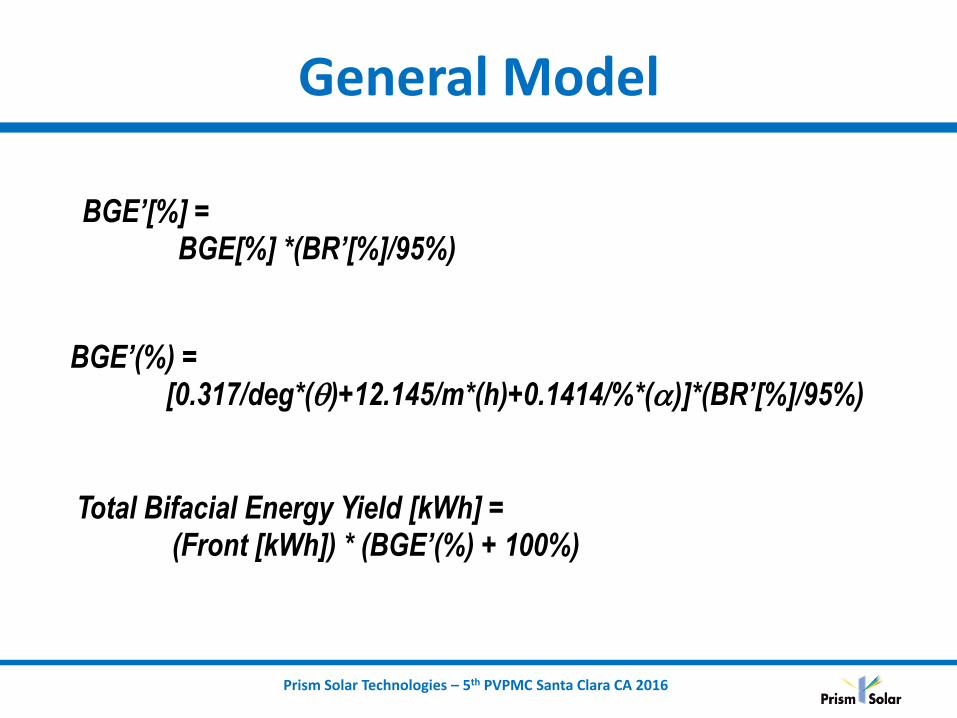
General Model
BGE’[%] = BGE[%] *(BR’[%]/95%)
BGE’(%) = [0.317/deg*()+12.145/m*(h)+0.1414/%*()]*(BR’[%]/95%)
Total Bifacial Energy Yield [kWh] = (Front [kWh]) * (BGE’(%) + 100%)
Prism Solar Technologies – 5th PVPMC Santa Clara CA 2016
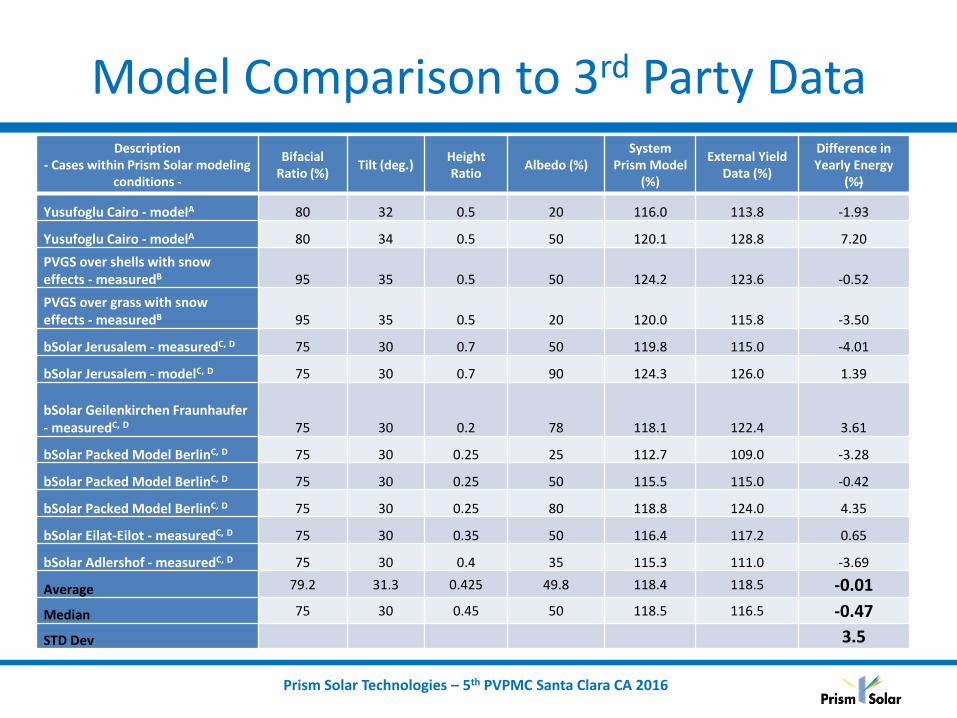
Model Comparison to 3rd Party Data Description
- Cases within Prism Solar modeling conditions -
Bifacial Ratio (%)
Tilt (deg.) Height Ratio
Albedo (%) System
Prism Model (%)
External Yield Data (%)
Difference in Yearly Energy
(%)
Yusufoglu Cairo - modelA 80 32 0.5 20 116.0 113.8 -1.93
Yusufoglu Cairo - modelA 80 34 0.5 50 120.1 128.8 7.20
PVGS over shells with snow effects - measuredB 95 35 0.5 50 124.2 123.6 -0.52
PVGS over grass with snow effects - measuredB 95 35 0.5 20 120.0 115.8 -3.50
bSolar Jerusalem - measuredC, D 75 30 0.7 50 119.8 115.0 -4.01
bSolar Jerusalem - modelC, D 75 30 0.7 90 124.3 126.0 1.39
bSolar Geilenkirchen Fraunhaufer - measuredC, D 75 30 0.2 78 118.1 122.4 3.61
bSolar Packed Model BerlinC, D 75 30 0.25 25 112.7 109.0 -3.28
bSolar Packed Model BerlinC, D 75 30 0.25 50 115.5 115.0 -0.42
bSolar Packed Model BerlinC, D 75 30 0.25 80 118.8 124.0 4.35
bSolar Eilat-Eilot - measuredC, D 75 30 0.35 50 116.4 117.2 0.65
bSolar Adlershof - measuredC, D 75 30 0.4 35 115.3 111.0 -3.69
Average 79.2 31.3 0.425 49.8 118.4 118.5 -0.01
Median 75 30 0.45 50 118.5 116.5 -0.47
STD Dev 3.5
Prism Solar Technologies – 5th PVPMC Santa Clara CA 2016
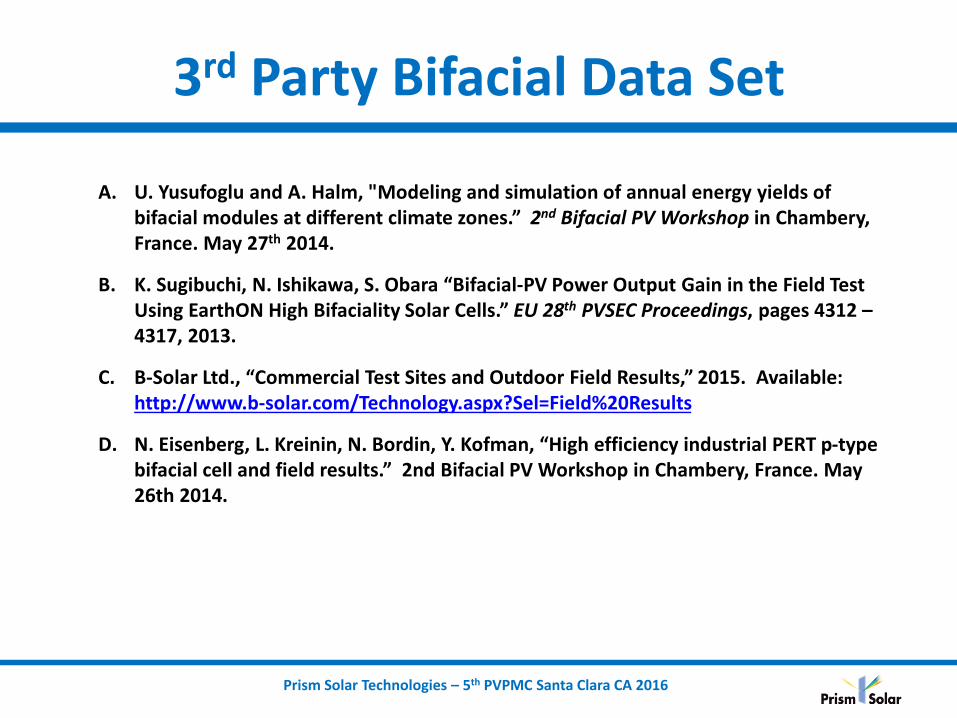
3rd Party Bifacial Data Set
A. U. Yusufoglu and A. Halm, "Modeling and simulation of annual energy yields of bifacial modules at different climate zones.” 2nd Bifacial PV Workshop in Chambery, France. May 27th 2014.
B. K. Sugibuchi, N. Ishikawa, S. Obara “Bifacial-PV Power Output Gain in the Field Test Using EarthON High Bifaciality Solar Cells.” EU 28th PVSEC Proceedings, pages 4312 – 4317, 2013.
C. B-Solar Ltd., “Commercial Test Sites and Outdoor Field Results,” 2015. Available: http://www.b-solar.com/Technology.aspx?Sel=Field%20Results
D. N. Eisenberg, L. Kreinin, N. Bordin, Y. Kofman, “High efficiency industrial PERT p-type bifacial cell and field results.” 2nd Bifacial PV Workshop in Chambery, France. May 26th 2014.
Prism Solar Technologies – 5th PVPMC Santa Clara CA 2016
Model Limitations
020406080
100120140160180200220240260280
5 7 9 11 13 15 17 19
Ave
rage
Mo
du
le P
ow
er
[W]
5/11/2013 - Time of day
CS6P-245M Average
B245 Average
0%
25%
50%
75%
100%
125%
150%
5 7 9 11 13 15 17 19
BG
E (%
)
5/11/2013 - Time of day
5 min BGE (%) Daily BGE (%) Annual BGE (%)
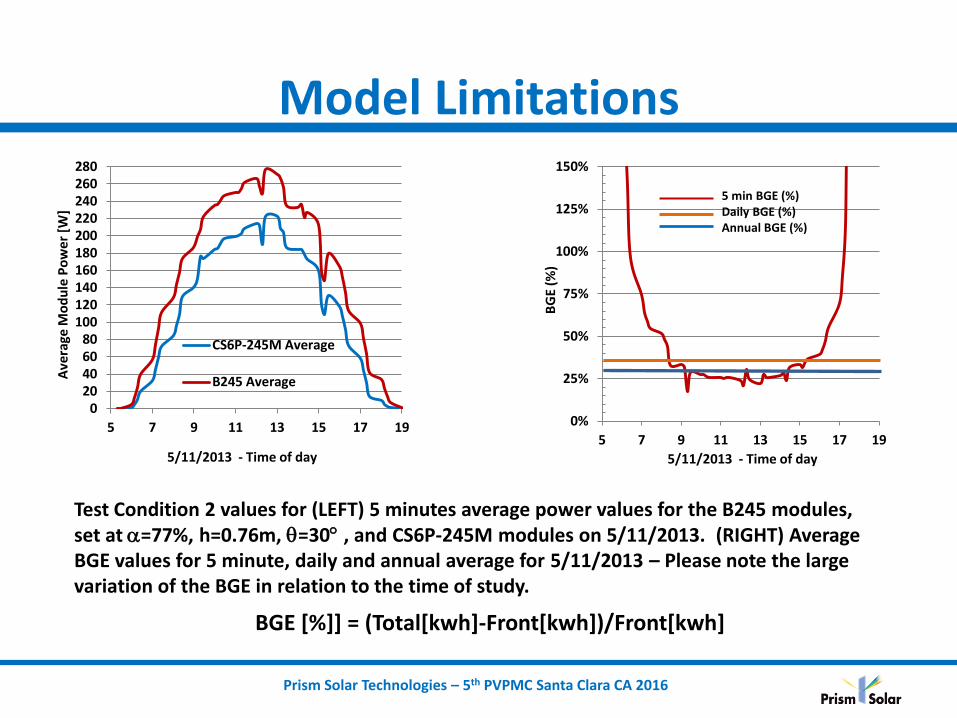
Test Condition 2 values for (LEFT) 5 minutes average power values for the B245 modules, set at =77%, h=0.76m, =30 , and CS6P-245M modules on 5/11/2013. (RIGHT) Average BGE values for 5 minute, daily and annual average for 5/11/2013 – Please note the large variation of the BGE in relation to the time of study.
BGE [%]] = (Total[kwh]-Front[kwh])/Front[kwh]
Prism Solar Technologies – 5th PVPMC Santa Clara CA 2016
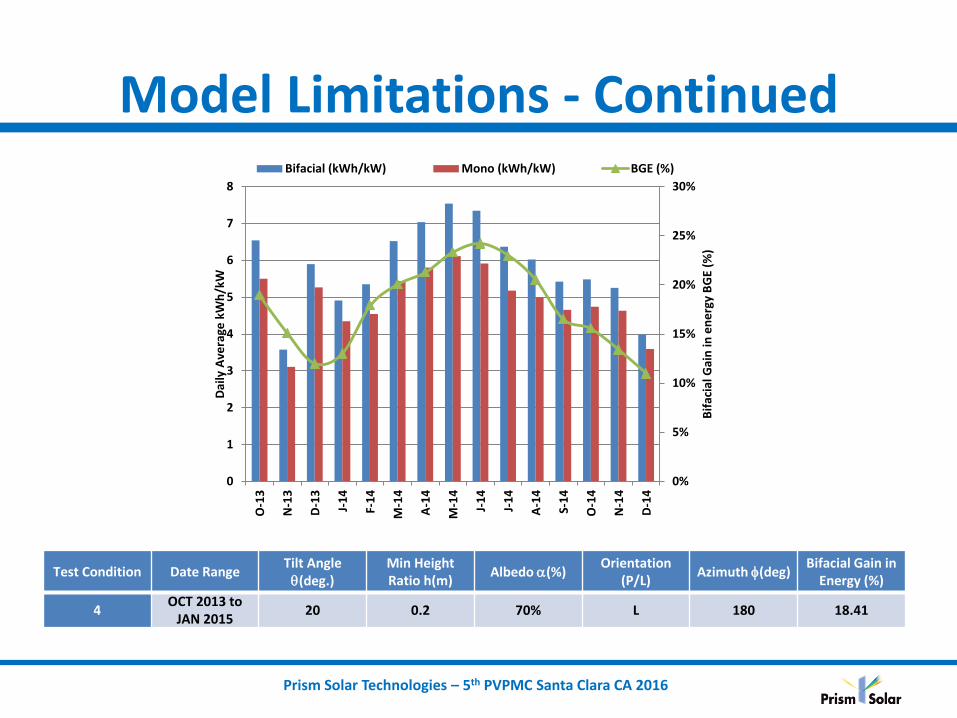
Test Condition Date Range Tilt Angle (deg.)
Min Height Ratio h(m)
Albedo (%) Orientation
(P/L) Azimuth (deg)
Bifacial Gain in Energy (%)
4 OCT 2013 to
JAN 2015 20 0.2 70% L 180 18.41
0%
5%
10%
15%
20%
25%
30%
0
1
2
3
4
5
6
7
8
O-1
3
N-1
3
D-1
3
J-1
4
F-1
4
M-1
4
A-1
4
M-1
4
J-1
4
J-1
4
A-1
4
S-1
4
O-1
4
N-1
4
D-1
4
Bif
acia
l Gai
n in
en
erg
y B
GE
(%)
Dai
ly A
vera
ge k
Wh
/kW
Bifacial (kWh/kW) Mono (kWh/kW) BGE (%)
Model Limitations - Continued

Prism Solar Technologies – 5th PVPMC Santa Clara CA 2016
Additional Independent Testing
TÜV/GTM Comparative Energy Yield (CEY) program which is deploying systems at 4 sites world-wide, each with 10 module manufacturer’s products in a direct comparison of various PV commercially available technologies in a minimum row configuration. GTM data to be published in Q2/Q3 2016. 2 sites currently operational (Phoenix, Arizona and Davis, California) since May 2015. For both sites, Prism Solar bifacial modules have reported a higher energy yield (kWh/kW) than any other system including other bifacial modules.
All systems were deployed over low albedo surfaces, and with partial racking obstructions of the rear of some of the bifacial modules in the array

Prism Solar Technologies – 5th PVPMC Santa Clara CA 2016
Sandia Bifacial Gain Validation Study
Deploying 3 similarly configured bifacial systems in New Mexico, Nevada, and Vermont. Other bifacial experiment configurations planned as well.
Prism Solar Technologies – 5th PVPMC Santa Clara CA 2016
Bifacial Energy Estimation – Prism Solar Design Guide
A simplified annual yield model based on these experiments is presented as the Prism Solar Bifacial Design Guide.
http://www.prismsolar.com/pdf/Design_guide.pdf
Customers can estimate the additional annual backside energy performance of Prism Solar modules (Bifacial Ratio ~0.90) under some of the most common field installation conditions.
Prism Solar Technologies – 5th PVPMC Santa Clara CA 2016
Conclusions • The field performance of bifacial modules under a variety
of field conditions was shown.
• A best fit model that covers common installation conditions of bifacial models was introduced.
• The field data and annual energy model show that under standard mounting conditions, bifacial modules exceeded annual energy yield of monofacial reference modules by at least 12% and up to +30%.
• Lack of bifacial standards makes a direct comparison between bifacial manufacturers difficult, based both on IV flash test conditions and rear side efficiency.
Prism Solar Technologies – 5th PVPMC Santa Clara CA 2016
Thank You
Additional questions: [email protected]