Embed Size (px)
Citation preview
3D Printing – Opportunities, Risks and Path Forward
2015

2
Agenda
• Market Trends – Current and Emerging State
• Adoption Considerations
• Path Forward
3
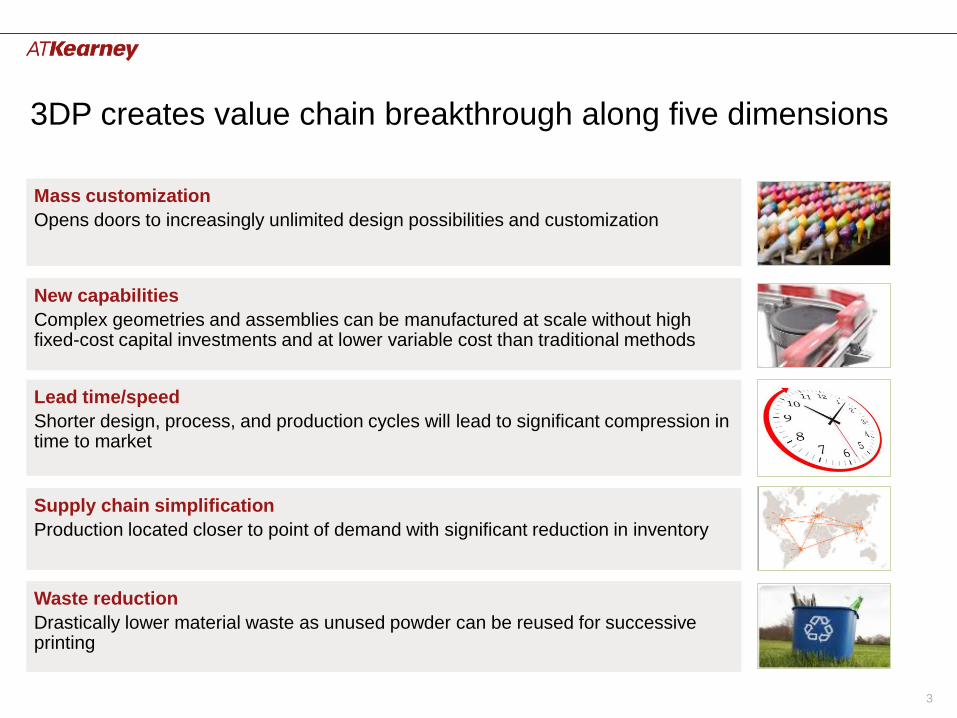
3DP creates value chain breakthrough along five dimensions
Mass customization
Opens doors to increasingly unlimited design possibilities and customization
New capabilities
Complex geometries and assemblies can be manufactured at scale without high fixed-cost capital investments and at lower variable cost than traditional methods
Supply chain simplification
Production located closer to point of demand with significant reduction in inventory
Waste reduction
Drastically lower material waste as unused powder can be reused for successive printing
Lead time/speed
Shorter design, process, and production cycles will lead to significant compression in time to market

4
3DP market at $4-5B in 2015 and will rapidly grow to ~$17B
by 2020
Global 3DP Industry Market Size: Consensus View($Bn)
Source: A.T. Kearney; Wohlers report; Smarttech markets; 3D Printing Reports; Credit Suisse;
2.33.5
5.5
8.6
1.3
1.9
2.9
4.3
0.9
1.3
1.8
2.6
0.1
0.4
0.9
1.7
0
2
4
6
8
10
12
14
16
18
2014 2016 2018 2020
Hardware Supplies Services Software
4.5
7.0
11.0
17.2
• Market size is by 3DP spend (hardware, materials, software)
• End product value market size significantly higher
5
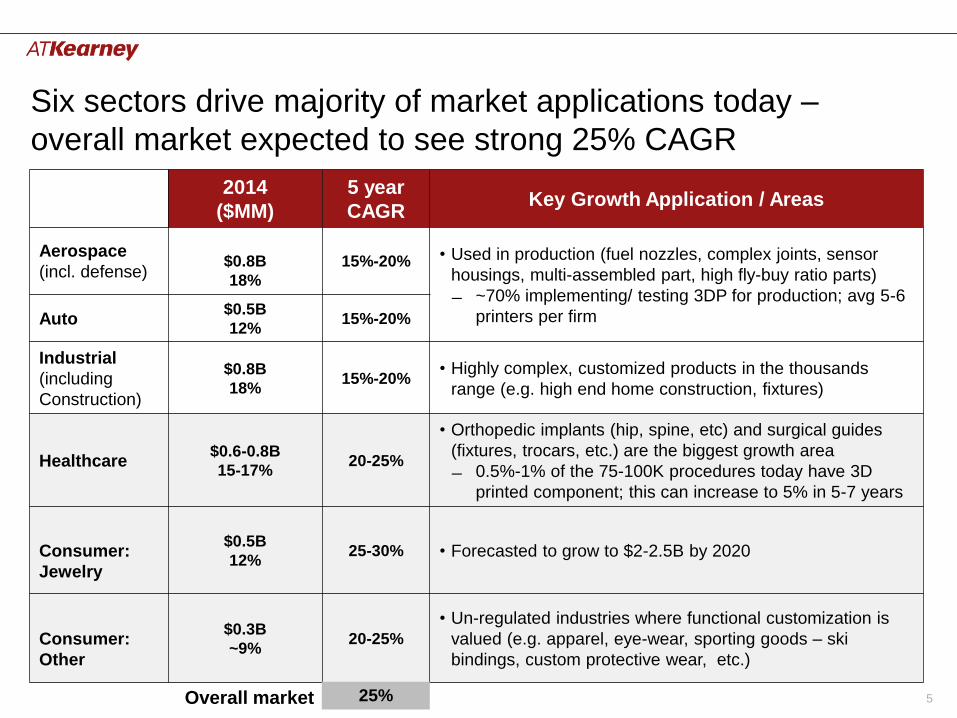
Six sectors drive majority of market applications today –
overall market expected to see strong 25% CAGR
2014
($MM)
5 year
CAGRKey Growth Application / Areas
Aerospace
(incl. defense)$0.8B
18%
15%-20% • Used in production (fuel nozzles, complex joints, sensor
housings, multi-assembled part, high fly-buy ratio parts)
~70% implementing/ testing 3DP for production; avg 5-6
printers per firmAuto$0.5B
12%15%-20%
Industrial
(including
Construction)
$0.8B
18%15%-20%
• Highly complex, customized products in the thousands
range (e.g. high end home construction, fixtures)
Healthcare$0.6-0.8B
15-17%20-25%
• Orthopedic implants (hip, spine, etc) and surgical guides
(fixtures, trocars, etc.) are the biggest growth area
0.5%-1% of the 75-100K procedures today have 3D
printed component; this can increase to 5% in 5-7 years
Consumer:
Jewelry
$0.5B
12%25-30% • Forecasted to grow to $2-2.5B by 2020
Consumer:
Other
$0.3B
~9%20-25%
• Un-regulated industries where functional customization is
valued (e.g. apparel, eye-wear, sporting goods – ski
bindings, custom protective wear, etc.)
Overall market 25%
6
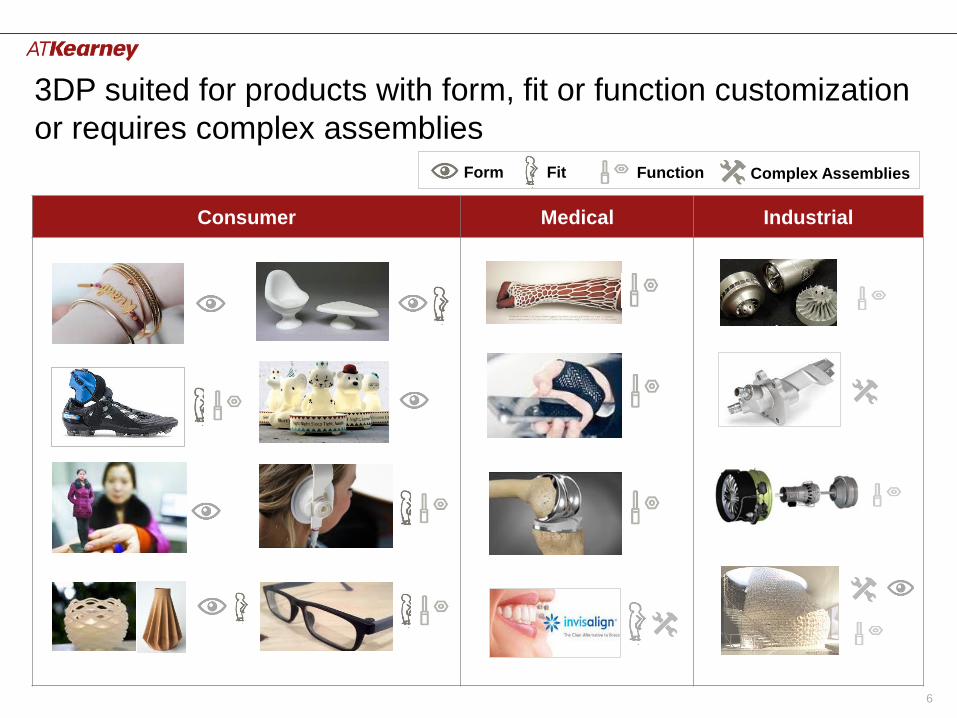
3DP suited for products with form, fit or function customization
or requires complex assemblies
Consumer Medical Industrial
Form Fit Function Complex Assemblies
7
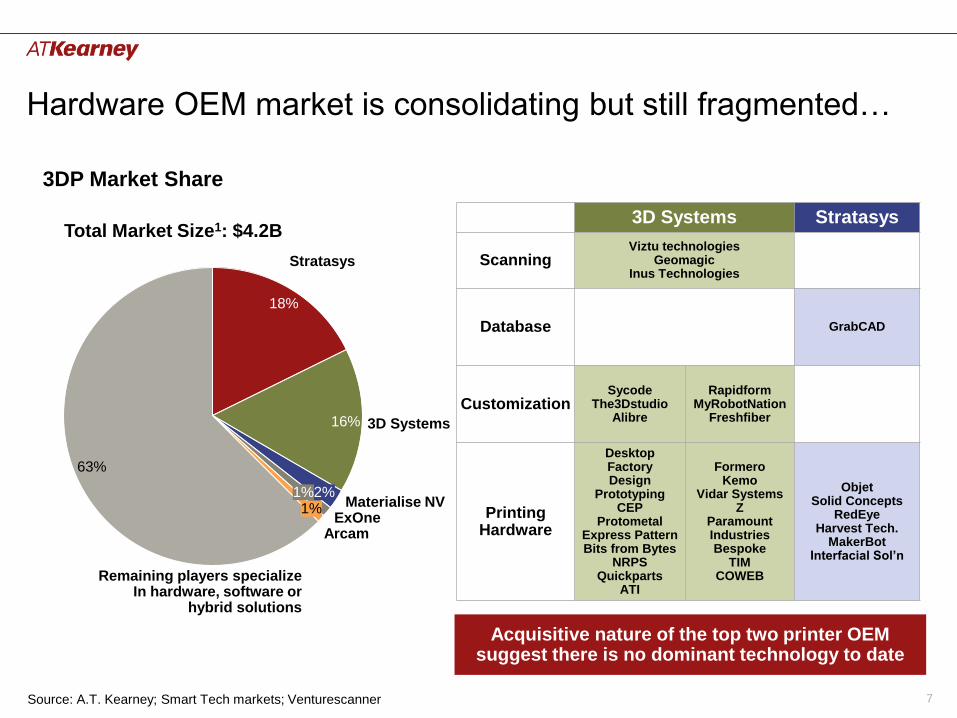
Hardware OEM market is consolidating but still fragmented…
Source: A.T. Kearney; Smart Tech markets; Venturescanner
3DP Market Share
Remaining players specializeIn hardware, software or
hybrid solutions
ExOne1%
Stratasys
Arcam
18%
63%
2%
3D Systems
1%
16%
Materialise NV
Total Market Size1: $4.2B3D Systems Stratasys
ScanningViztu technologies
GeomagicInus Technologies
Database GrabCAD
CustomizationSycode
The3DstudioAlibre
RapidformMyRobotNation
Freshfiber
Printing Hardware
DesktopFactoryDesign
Prototyping CEP
ProtometalExpress PatternBits from Bytes
NRPSQuickparts
ATI
FormeroKemo
Vidar SystemsZ
Paramount IndustriesBespoke
TIM COWEB
ObjetSolid Concepts
RedEyeHarvest Tech.
MakerBotInterfacial Sol’n
Acquisitive nature of the top two printer OEM suggest there is no dominant technology to date
8
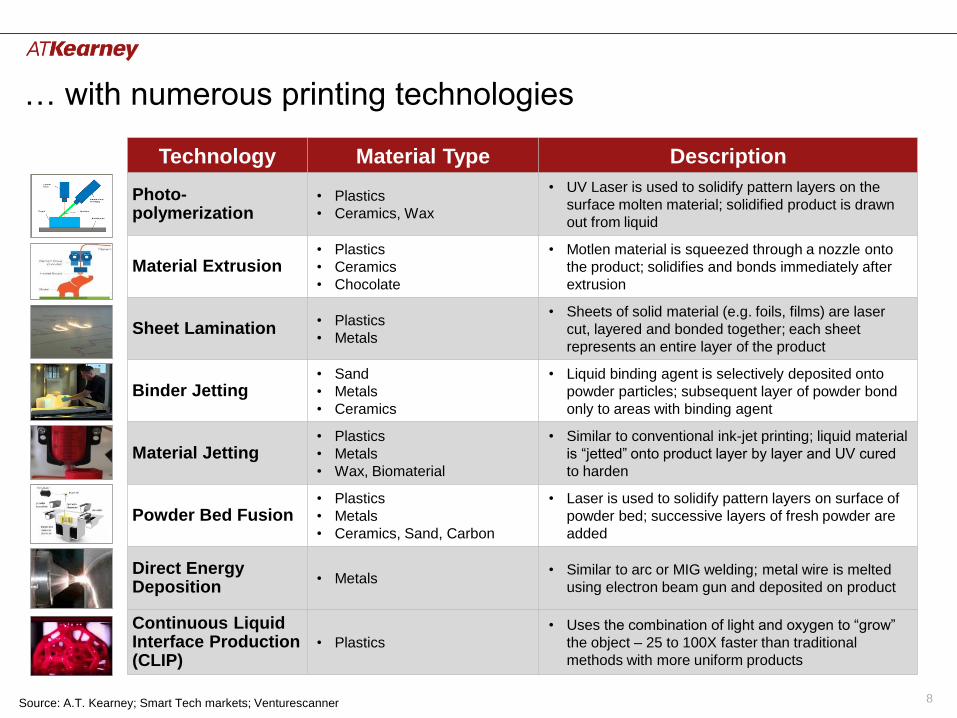
… with numerous printing technologies
Source: A.T. Kearney; Smart Tech markets; Venturescanner
Technology Material Type Description
Photo-polymerization
• Plastics
• Ceramics, Wax
• UV Laser is used to solidify pattern layers on the
surface molten material; solidified product is drawn
out from liquid
Material Extrusion• Plastics
• Ceramics
• Chocolate
• Motlen material is squeezed through a nozzle onto
the product; solidifies and bonds immediately after
extrusion
Sheet Lamination• Plastics
• Metals
• Sheets of solid material (e.g. foils, films) are laser
cut, layered and bonded together; each sheet
represents an entire layer of the product
Binder Jetting• Sand
• Metals
• Ceramics
• Liquid binding agent is selectively deposited onto
powder particles; subsequent layer of powder bond
only to areas with binding agent
Material Jetting• Plastics
• Metals
• Wax, Biomaterial
• Similar to conventional ink-jet printing; liquid material
is “jetted” onto product layer by layer and UV cured
to harden
Powder Bed Fusion• Plastics
• Metals
• Ceramics, Sand, Carbon
• Laser is used to solidify pattern layers on surface of
powder bed; successive layers of fresh powder are
added
Direct Energy Deposition
• Metals• Similar to arc or MIG welding; metal wire is melted
using electron beam gun and deposited on product
Continuous Liquid Interface Production (CLIP)
• Plastics
• Uses the combination of light and oxygen to “grow”
the object – 25 to 100X faster than traditional
methods with more uniform products
9
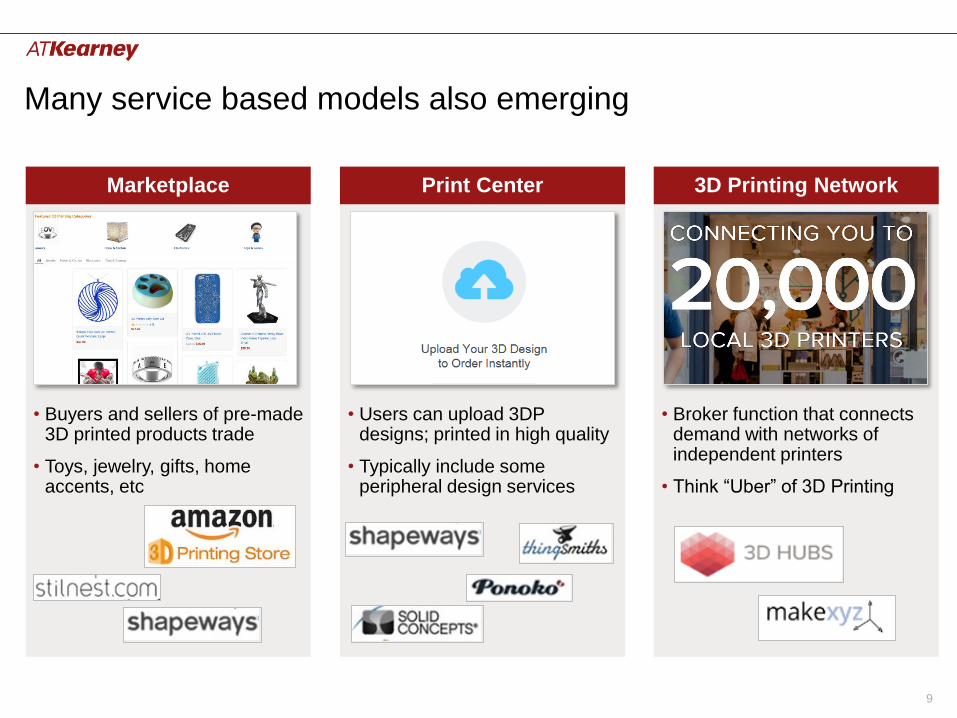
Many service based models also emerging
• Buyers and sellers of pre-made 3D printed products trade
• Toys, jewelry, gifts, home accents, etc
• Users can upload 3DP designs; printed in high quality
• Typically include some peripheral design services
• Broker function that connects demand with networks of independent printers
• Think “Uber” of 3D Printing
Marketplace Print Center 3D Printing Network
10
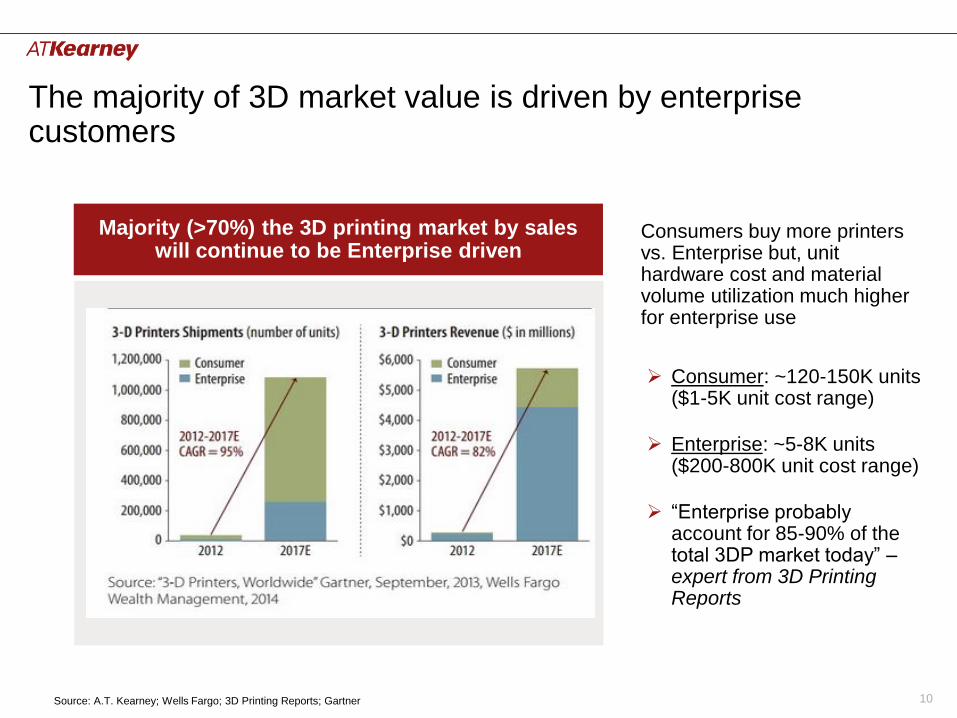
The majority of 3D market value is driven by enterprise customers
Source: A.T. Kearney; Wells Fargo; 3D Printing Reports; Gartner
Majority (>70%) the 3D printing market by sales will continue to be Enterprise driven
Consumers buy more printers vs. Enterprise but, unit hardware cost and material volume utilization much higher for enterprise use
Consumer: ~120-150K units ($1-5K unit cost range)
Enterprise: ~5-8K units ($200-800K unit cost range)
“Enterprise probably account for 85-90% of the total 3DP market today” –expert from 3D Printing Reports

11
Agenda
• Market Trends – Current and Emerging State
• Adoption Considerations
• Path Forward
12
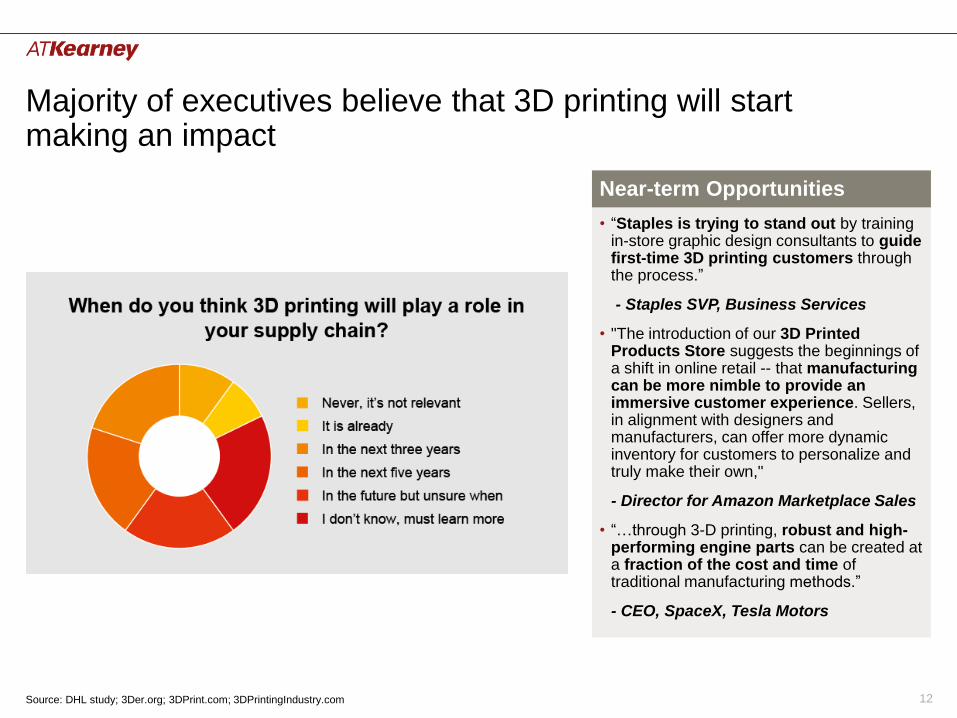
Majority of executives believe that 3D printing will start making an impact
Near-term Opportunities
• “Staples is trying to stand out by training in-store graphic design consultants to guide first-time 3D printing customers through the process.”
- Staples SVP, Business Services
• "The introduction of our 3D Printed Products Store suggests the beginnings of a shift in online retail -- that manufacturing can be more nimble to provide an immersive customer experience. Sellers, in alignment with designers and manufacturers, can offer more dynamic inventory for customers to personalize and truly make their own,"
- Director for Amazon Marketplace Sales
• “…through 3-D printing, robust and high-performing engine parts can be created at a fraction of the cost and time of traditional manufacturing methods.”
- CEO, SpaceX, Tesla Motors
Source: DHL study; 3Der.org; 3DPrint.com; 3DPrintingIndustry.com
13
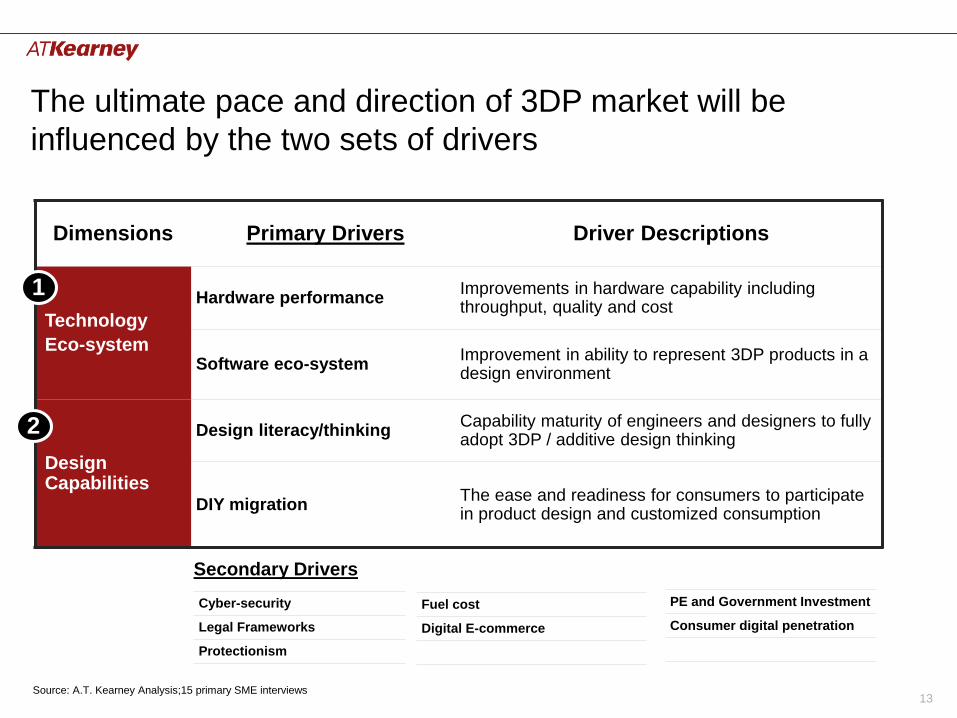
Dimensions Primary Drivers Driver Descriptions
Technology
Eco-system
Hardware performanceImprovements in hardware capability including throughput, quality and cost
Software eco-system Improvement in ability to represent 3DP products in a design environment
Design Capabilities
Design literacy/thinkingCapability maturity of engineers and designers to fully adopt 3DP / additive design thinking
DIY migrationThe ease and readiness for consumers to participate in product design and customized consumption
Source: A.T. Kearney Analysis;15 primary SME interviews
The ultimate pace and direction of 3DP market will be
influenced by the two sets of drivers
Cyber-security
Legal Frameworks
Protectionism
Fuel cost
Digital E-commerce
PE and Government Investment
Consumer digital penetration
Secondary Drivers
1
2
14
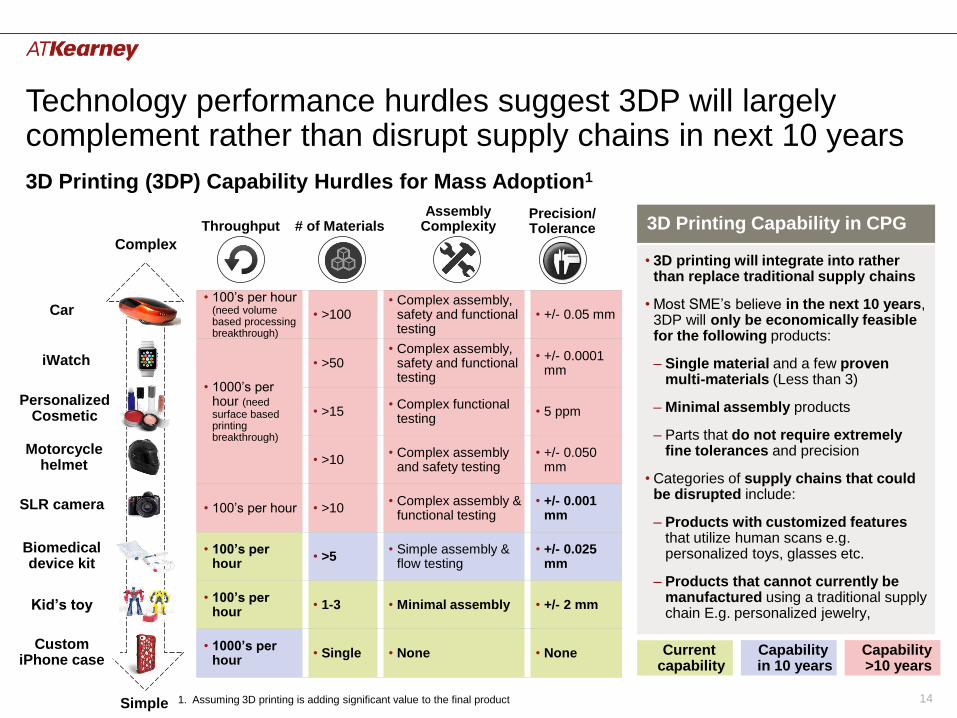
Technology performance hurdles suggest 3DP will largely complement rather than disrupt supply chains in next 10 years
• 100’s per hour (need volume based processing breakthrough)
• >100• Complex assembly,
safety and functional testing
• +/- 0.05 mm
• 1000’s per hour (need surface based printing breakthrough)
• >50• Complex assembly,
safety and functional testing
• +/- 0.0001 mm
• >15• Complex functional
testing• 5 ppm
• >10• Complex assembly
and safety testing• +/- 0.050
mm
• 100’s per hour • >10• Complex assembly &
functional testing• +/- 0.001
mm
• 100’s per hour
• >5• Simple assembly &
flow testing• +/- 0.025
mm
• 100’s per hour
• 1-3 • Minimal assembly • +/- 2 mm
• 1000’s per hour
• Single • None • None
Complex
Simple
3D Printing (3DP) Capability Hurdles for Mass Adoption1
Kid’s toy
Custom iPhone case
Biomedical device kit
SLR camera
Motorcycle helmet
Personalized Cosmetic
Car
iWatch
3D Printing Capability in CPGThroughput # of MaterialsAssembly
ComplexityPrecision/Tolerance
• 3D printing will integrate into rather than replace traditional supply chains
• Most SME’s believe in the next 10 years, 3DP will only be economically feasible for the following products:
– Single material and a few proven multi-materials (Less than 3)
– Minimal assembly products
– Parts that do not require extremely fine tolerances and precision
• Categories of supply chains that could be disrupted include:
– Products with customized features that utilize human scans e.g. personalized toys, glasses etc.
– Products that cannot currently be manufactured using a traditional supply chain E.g. personalized jewelry,
1. Assuming 3D printing is adding significant value to the final product
Capability in 10 years
Current capability
Capability >10 years
15
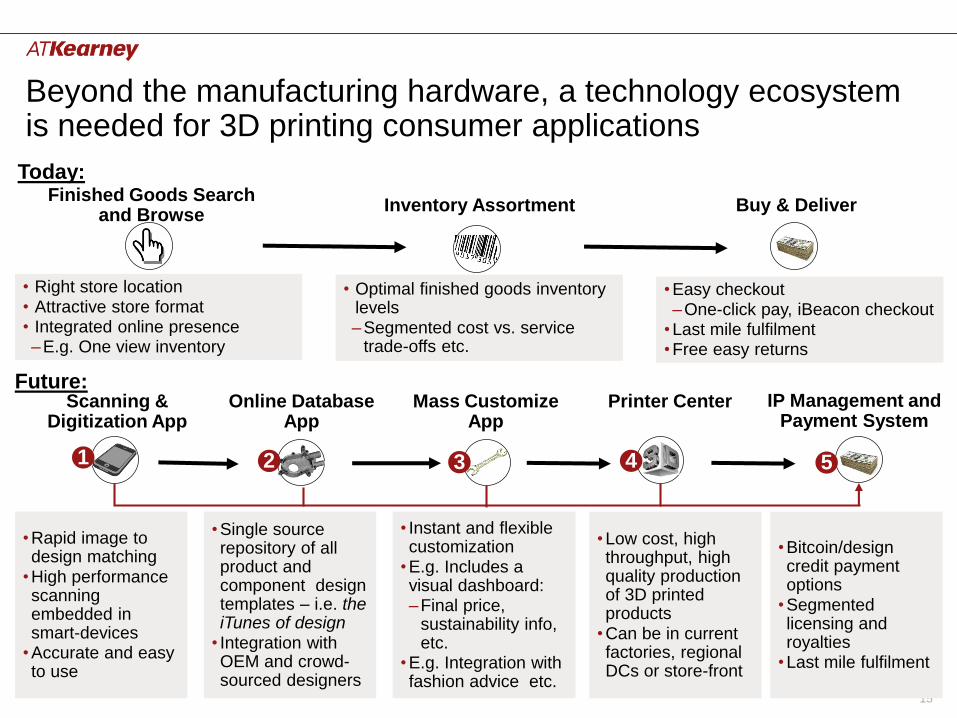
Beyond the manufacturing hardware, a technology ecosystem is needed for 3D printing consumer applications
Inventory AssortmentFinished Goods Search
and BrowseBuy & Deliver
Today:
• Rapid image to design matching
• High performance scanning embedded in smart-devices
• Accurate and easy to use
• Single source repository of all product and component design templates – i.e. the iTunes of design
• Integration with OEM and crowd-sourced designers
• Instant and flexible customization
• E.g. Includes a visual dashboard:–Final price,
sustainability info, etc.
• E.g. Integration with fashion advice etc.
• Low cost, high throughput, high quality production of 3D printed products
• Can be in current factories, regional DCs or store-front
• Bitcoin/design credit payment options
• Segmented licensing and royalties
• Last mile fulfilment
Online Database App
Scanning & Digitization App
Mass Customize App
Printer Center
2 3 41
Future:IP Management and
Payment System
• Right store location• Attractive store format• Integrated online presence–E.g. One view inventory
• Easy checkout–One-click pay, iBeacon checkout
• Last mile fulfilment• Free easy returns
• Optimal finished goods inventory levels–Segmented cost vs. service
trade-offs etc.
5
16
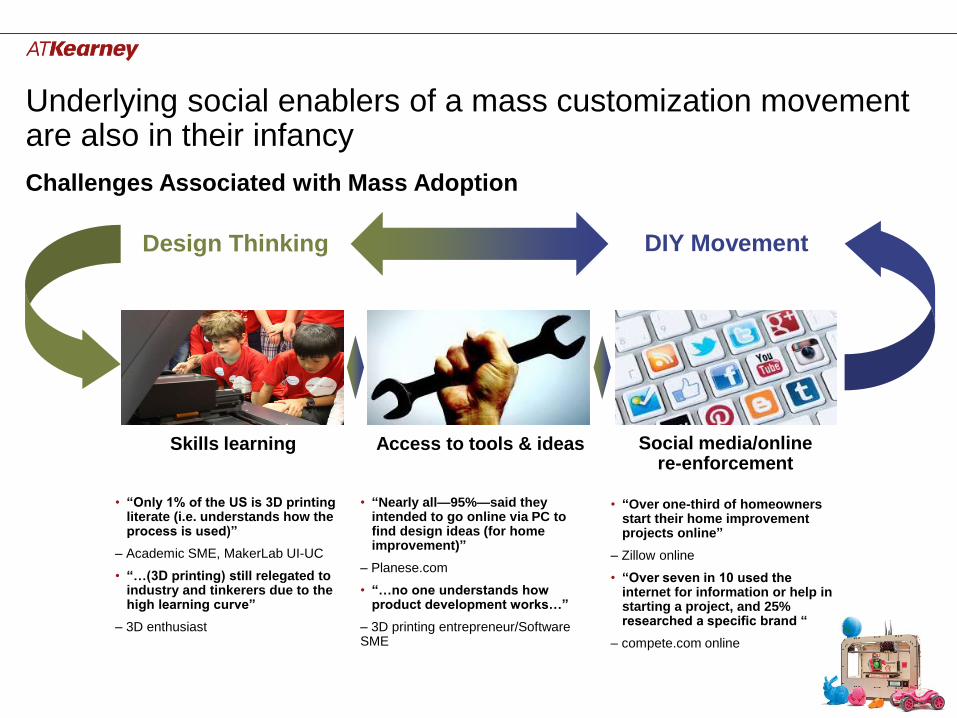
Underlying social enablers of a mass customization movement are also in their infancy
Challenges Associated with Mass Adoption
Design Thinking DIY Movement
Skills learning Access to tools & ideas Social media/online re-enforcement
• “Nearly all—95%—said they intended to go online via PC to find design ideas (for home improvement)”
– Planese.com
• “…no one understands how product development works…”
– 3D printing entrepreneur/Software SME
• “Over one-third of homeowners start their home improvement projects online”
– Zillow online
• “Over seven in 10 used the internet for information or help in starting a project, and 25% researched a specific brand “
– compete.com online
• “Only 1% of the US is 3D printing literate (i.e. understands how the process is used)”
– Academic SME, MakerLab UI-UC
• “…(3D printing) still relegated to industry and tinkerers due to the high learning curve”
– 3D enthusiast
17
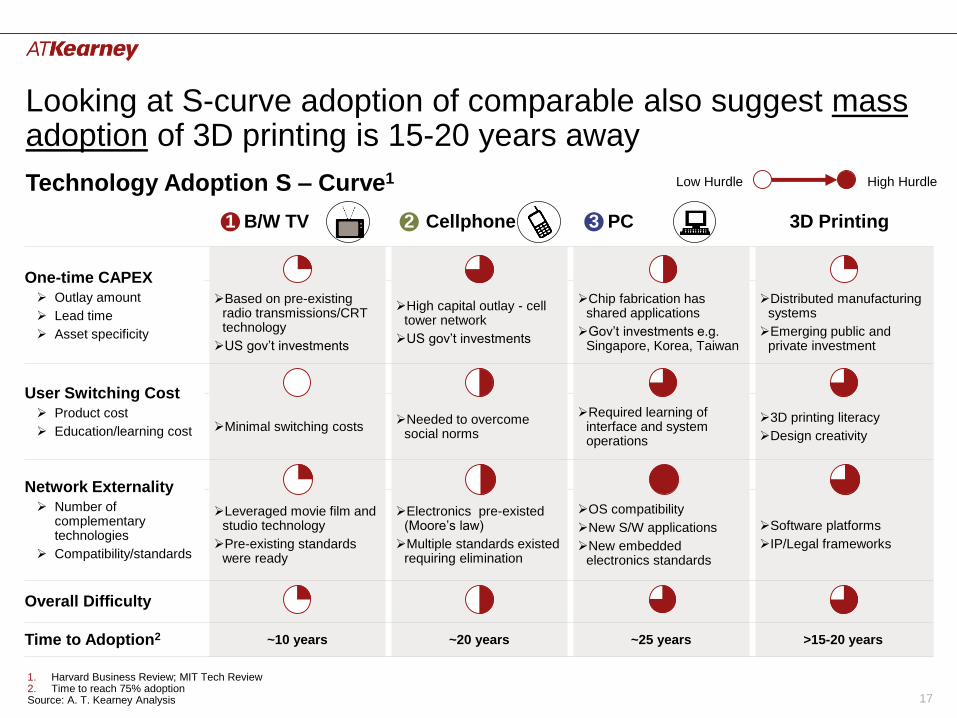
Looking at S-curve adoption of comparable also suggest mass adoption of 3D printing is 15-20 years away
B/W TV Cellphone PC 3D Printing
One-time CAPEX
Outlay amount
Lead time
Asset specificity
Based on pre-existingradio transmissions/CRT technology
US gov’t investments
High capital outlay - cell tower network
US gov’t investments
Chip fabrication has shared applications
Gov’t investments e.g. Singapore, Korea, Taiwan
Distributed manufacturing systems
Emerging public and private investment
User Switching Cost
Product cost
Education/learning cost Minimal switching costsNeeded to overcome
social norms
Required learning of interface and system operations
3D printing literacy
Design creativity
Network Externality
Number of complementarytechnologies
Compatibility/standards
Leveraged movie film andstudio technology
Pre-existing standards were ready
Electronics pre-existed (Moore’s law)
Multiple standards existed requiring elimination
OS compatibility
New S/W applications
New embedded electronics standards
Software platforms
IP/Legal frameworks
Overall Difficulty
Time to Adoption2 ~10 years ~20 years ~25 years >15-20 years
High HurdleLow HurdleTechnology Adoption S – Curve1
1. Harvard Business Review; MIT Tech Review2. Time to reach 75% adoptionSource: A. T. Kearney Analysis
1 2 3

18
Agenda
• Market Trends – Current and Emerging State
• Adoption Considerations
• Path Forward
19
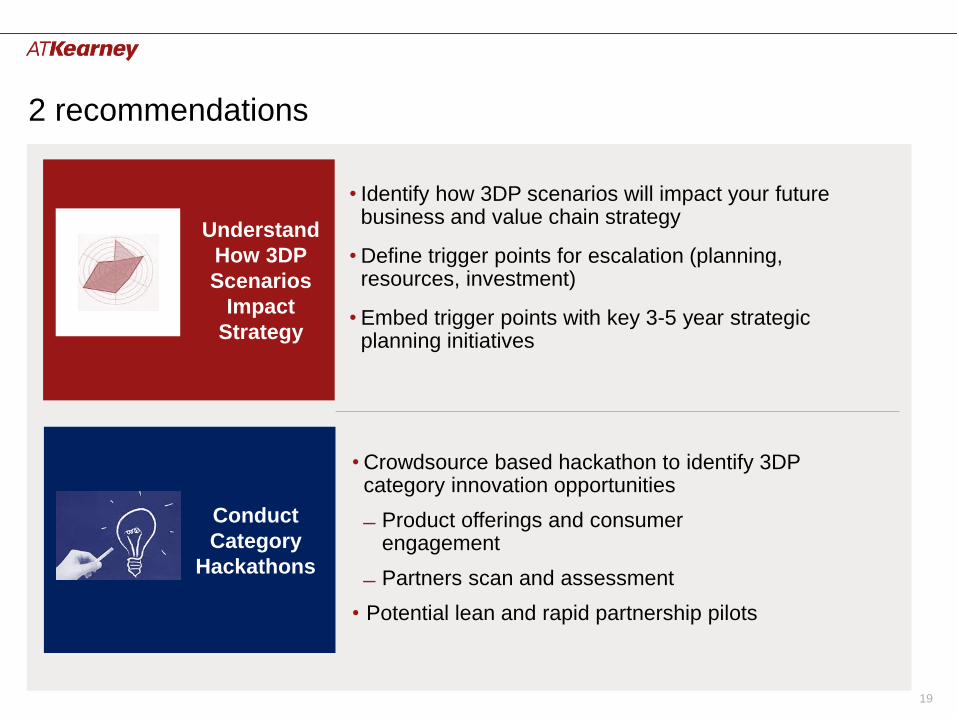
Understand
How 3DP
Scenarios
Impact
Strategy
Conduct
Category
Hackathons
• Identify how 3DP scenarios will impact your future business and value chain strategy
• Define trigger points for escalation (planning, resources, investment)
• Embed trigger points with key 3-5 year strategic planning initiatives
• Crowdsource based hackathon to identify 3DP category innovation opportunities
Product offerings and consumer engagement
Partners scan and assessment
• Potential lean and rapid partnership pilots
2 recommendations
20
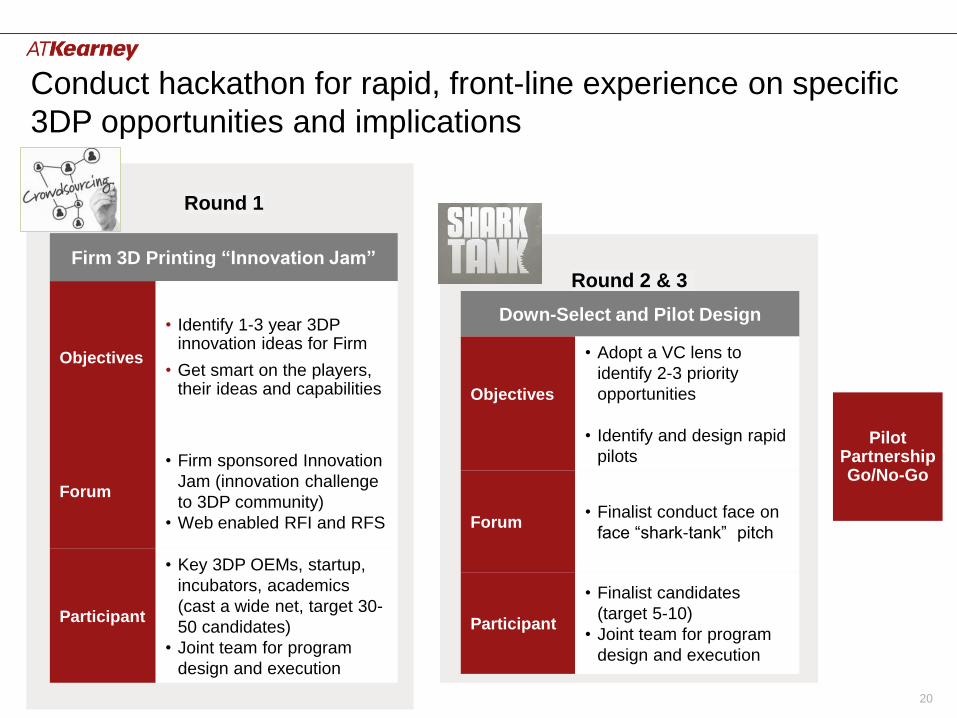
Conduct hackathon for rapid, front-line experience on specific
3DP opportunities and implications
Round 1
Round 2 & 3
Pilot Partnership Go/No-Go
Firm 3D Printing “Innovation Jam”
Objectives
• Identify 1-3 year 3DP innovation ideas for Firm
• Get smart on the players, their ideas and capabilities
Forum
• Firm sponsored Innovation
Jam (innovation challenge
to 3DP community)
• Web enabled RFI and RFS
Participant
• Key 3DP OEMs, startup,
incubators, academics
(cast a wide net, target 30-
50 candidates)
• Joint team for program
design and execution
Down-Select and Pilot Design
Objectives
• Adopt a VC lens to
identify 2-3 priority
opportunities
• Identify and design rapid
pilots
Forum• Finalist conduct face on
face “shark-tank” pitch
Participant
• Finalist candidates
(target 5-10)
• Joint team for program
design and execution
21
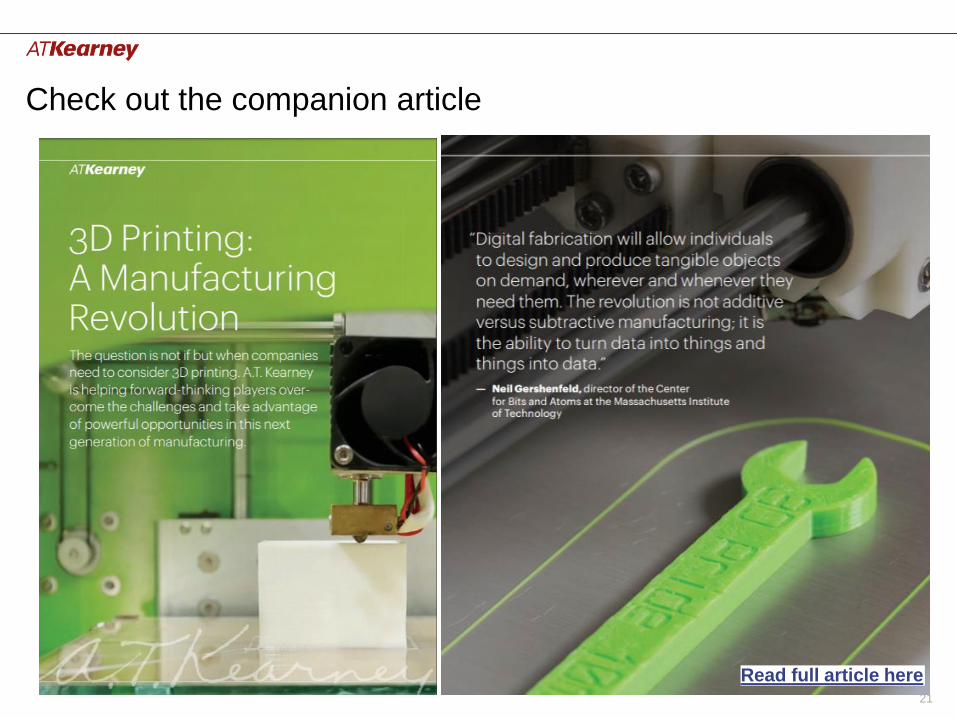
Check out the companion article
Read full article here
22
Americas Atlanta
Bogotá
Calgary
Chicago
Dallas
Detroit
Houston
Mexico City
New York
Palo Alto
San Francisco
São Paulo
Toronto
Washington, D.C.
Asia Pacific Bangkok
Beijing
Hong Kong
Jakarta
Kuala Lumpur
Melbourne
Mumbai
New Delhi
Seoul
Shanghai
Singapore
Sydney
Tokyo
Europe Amsterdam
Berlin
Brussels
Bucharest
Budapest
Copenhagen
Düsseldorf
Frankfurt
Helsinki
Istanbul
Kiev
Lisbon
Ljubljana
London
Madrid
Milan
Moscow
Munich
Oslo
Paris
Prague
Rome
Stockholm
Stuttgart
Vienna
Warsaw
Zurich
Middle East
and Africa
Abu Dhabi
Doha
Dubai
JohannesburgManama
Riyadh
A.T. Kearney is a leading global management consulting firm with offices in more than 40 countries. Since
1926, we have been trusted advisors to the world's foremost organizations. A.T. Kearney is a partner-owned
firm, committed to helping clients achieve immediate impact and growing advantage on their most mission-
critical issues. For more information, visit www.atkearney.com.