Embed Size (px)
Citation preview

nanomaterials
Article
Electrochemistry Studies of Hydrothermally GrownZnO on 3D-Printed Graphene
Dimitra Vernardou 1,* and George Kenanakis 2
1 Center of Materials Technology and Photonics, School of Engineering, Hellenic Mediterranean University,710 04 Heraklion, Crete, Greece
2 Institute of Electronic Structure and Laser, Foundation for Research and Technology-Hellas, N. Plastira 100,Vasilika Vouton, GR-700 13 Heraklion, Crete, Greece
* Correspondence: [email protected]; Tel.: +30-281-037-9753
Received: 9 July 2019; Accepted: 20 July 2019; Published: 23 July 2019�����������������
Abstract: A three-dimensional (3D) printer was utilised for the three-dimensional production ofgraphene-based pyramids and an efficient hydrothermal procedure for ZnO growth. In particular, the3D-printed graphene pyramids were forwarded in Pyrex glass bottles with autoclavable screw capsfilled with 50 mL of an aqueous solution of zinc nitrate hexahydrate and hexamethylenetetramine for1 h at 95 ◦C; sufficient enough time to deposit well-dispersed nanoparticles. X-ray diffraction patternswere in accordance with a Raman analysis and presented the characteristic peaks of graphite alongwith those of wurtzite ZnO. Different positions on the sample were tested, confirming the uniformdispersion of ZnO on graphene pyramids. From the electrochemical studies, it was found that thecharging and discharging processes are affected by the presence of ZnO, indicating one well-definedplateau for each process compared to the previously reported bare graphene pyramids. In total, thematerial shows a value of 325 mAh g−1, a capacitance retention factor of 92% after 5000 scans, and acoulombic efficiency of 100% for the first scan that drops to 85% for the 5000th scan. This excellentperformance is the result of the effect of ZnO and graphene that combines two Li+ accommodationsites, and the contribution of graphene pyramids, which provides more available sites to favor lithiumstorage capacity. Hence, this anode may be a promising electrode material for lithium-ion batteries.
Keywords: 3D-printed graphene; zinc oxide; hydrothermal growth; electrochemical studies
1. Introduction
Metal oxides have been widely investigated as electrodes for Li-ion batteries due to their hightheoretical capacities, low cost and natural abundance [1,2].In particular, ZnO has received increasedattention as a large band gap semiconductor with distinctive photocatalytic, sensing and electrochemicalproperties [3–5]. As an anode material, it has a particularly high theoretical capacity of 978 mAh g−1
(i.e., higher than that of graphite, which is 370 mA h g−1) [6], chemical stability and a lack of safetyissues associated with its use. Nevertheless, achieving a high rate capability and good stability hasbeen very challenging because of its low electronic conductivity and undesirable large volume changeduring its charging and discharging processes [7–10]. To tackle this drawback, one proposed strategyis to decrease the particle size of the metal oxide (i.e., to the nanoscale level). This will provide alarger area of active material, accommodating effectively the strain of Li intercalation/deintercalationin nanomaterials [11–13]. However, low conductivity and inferior cyclability remain critical issueslimiting its application [14,15].
The exceptional conductivity, abundant adsorption sites and short diffusion paths associated withgraphene are expected to further enhance the transport processes within the oxide nanomaterials [16].A major advantage of graphene over other carbon materials is the excellent distribution of metal oxides
Nanomaterials 2019, 9, 1056; doi:10.3390/nano9071056 www.mdpi.com/journal/nanomaterials

Nanomaterials 2019, 9, 1056 2 of 8
on its surface [17]. The advantages of ZnO/graphene composites were evaluated in many studies [18]estimating a reversible capacity of 515 mAh g−1 after 100 cycles at 200 mA g−1 [19], a high initialdischarge capacity of 1583 mAh g−1 at 200 mA g−1 [11] and a reversible capacity of 653.7 mAh g−1
after 100 cycles [20].In this work, ZnO is deposited on three-dimensional (3D)-printed graphene [21] using the
environmentally friendly hydrothermal process [22] at 95 ◦C for 1 h. The hydrothermal procedure andthe printing technique are both considered to be low-cost and easily compatible with the production ofelectrodes with new shapes and compositions. Considering these aspects, the proposed material maymake an important contribution to the fabrication of battery material technology.
2. Materials and Methods
Commercially available PLA (polylactic acid)-graphene filaments (purchased from BlackMagic3D,Ronkonkoma, NY, USA) with a volume resistivity of 0.6 ohm·cm, compatible with typical FDM (FusedDeposition Modeling) 3D printers, were used. As reported elsewhere [21], the development of graphenepyramids was carried out using a 0.4 mm nozzle at 240 ◦C, while the surface where the object wasprinted was adjusted at 50 ◦C. The 3D printing parameters (nozzle speed, extrusion velocity, layerthickness, printing path, etc.) were optimized in order to obtain uniformly printed samples with afilling ratio of 100%.
The 3D-printed PLA-graphene pyramids (as presented in [21]) were forwarded in Pyrex glassbottles with autoclavable screw caps filled with 50mL of a 0.01 M, aqueous solution of Zn(NO3)2·6H2Oand HMTA at 95 ◦C. The HMTA acts asa reducing agent in the hydrothermal synthesis of ZnO [23].In particular, it decomposes upon heating to form formaldehyde and ammonia, which then react withH2O to produce OH− and promote the precipitation reaction. Since the oxidation state of Zn in ZnOand Zn(NO3)2·6H2O is 2, the role of the reducing agent is in the nucleation and growth rate processes ofZnO materials instead of the reduction ofZn2+ ions [24]. After 1 h of deposition time, one could noticea white ZnO layer on the 3D-printed pyramids [22,23,25]. The composites were then washed withMilliQ H2O, dried in air at 95 ◦C, and characterized using the techniques described below. The growthtemperature was carefully controlled with thermometers inside the oven and the Pyrex glass bottlesduring the whole growth period.
The surface morphology of the samples was determined using a field emission scanning electronmicroscope (FE-SEM, JEOL JSM-7000F, Tokyo, Japan) with a magnification of 100×.The crystal structureof all ZnO/3D-printed graphene samples was studied by X-ray diffraction (XRD, Rigaku (RINT 2000diffractometer, Tokyo, Japan) with Cu Kα (λ = 1.5406 Å). Raman measurements were carried out using aHoriba LabRAM HR (Kyoto, Japan) via a 532 nm solid state laser with an output power of 100 mW [21].
Electrochemical analysis of the materials was performed in an electrochemical cell [26] using Pt,Ag/AgCl and the ZnO/3D-printed graphene as the counter, reference and working electrode, respectively,in 1M LiCl for a scan rate of 10 mV s−1 at potential ranging from −1.0 V to +0.5 V. Galvanostaticmeasurements were obtained in the range −0.5 V to +0.5 V under a specific current of 40 mA g−1.
3. Results
3.1. Surface Morphology
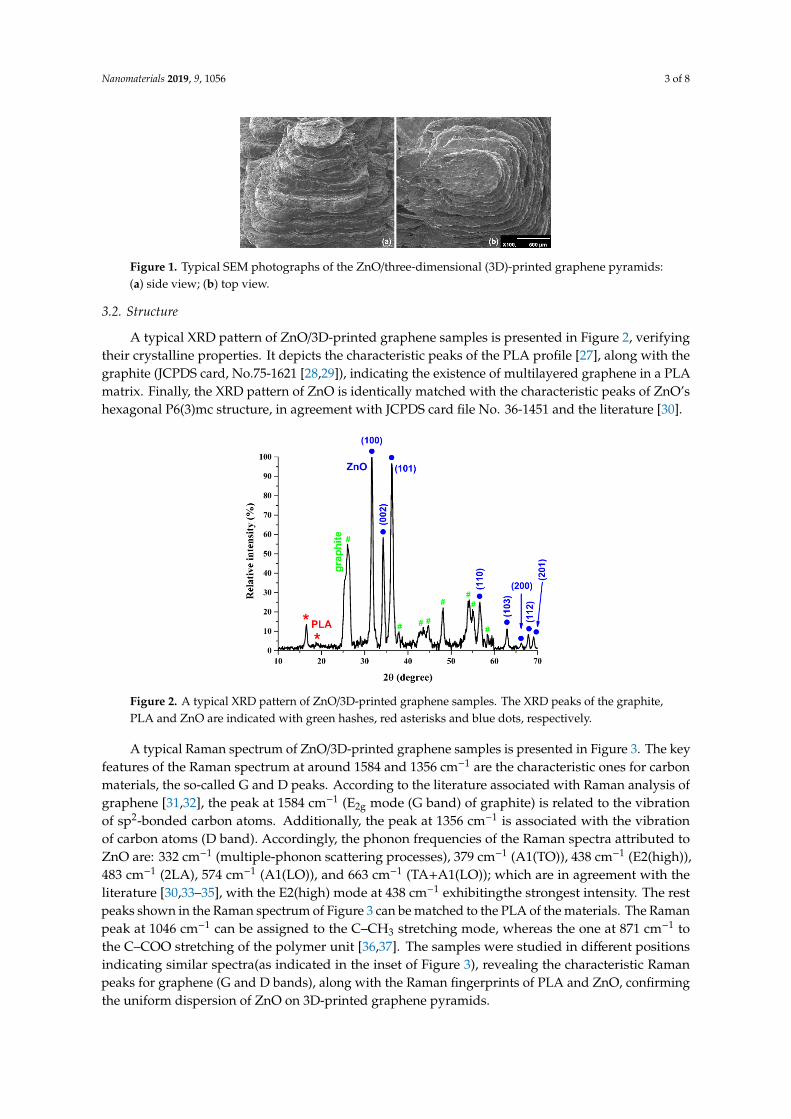
Figure 1 depicts a typical SEM photograph of a ZnO/3D-printed graphene pyramid. The3Dstructure of the printed samples can be clearly seen in Figure 1 to approach a truncated pyramid insteadof an ideal square pyramid. Moreover, one can see from Figure 1 the layer-by-layer fabrication of the3D-printed samples, with an ~100 µm spatial resolution in the z-axis, which is a typical resolution formost FDM 3D printers.
Nanomaterials 2019, 9, 1056 3 of 8Nanomaterials 2019, 9, x FOR PEER REVIEW 3 of 8
Figure 1.Typical SEM photographs of the ZnO/three-dimensional (3D)-printed graphene pyramids:
(a) side view; (b) top view.
3.2. Structure
A typical XRD pattern of ZnO/3D-printed graphene samples is presented in Figure 2, verifying
their crystalline properties. It depicts the characteristic peaks of the PLA profile [27], along with the
graphite (JCPDS card, No.75-1621 [28,29]), indicating the existence of multilayered graphene in a PLA
matrix. Finally, the XRD pattern of ZnO is identically matched with the characteristic peaks of ZnO’s
hexagonal P6(3)mc structure, in agreement with JCPDS card file No. 36-1451 and the literature [30].
Figure 2.A typical XRD pattern of ZnO/3D-printed graphene samples. The XRD peaks of the graphite,
PLA and ZnO are indicated with green hashes, red asterisks and blue dots, respectively.
A typical Raman spectrum of ZnO/3D-printed graphene samples is presented in Figure 3.The
key features of the Raman spectrum at around 1584 and 1356 cm−1 are the characteristic ones for
carbon materials, the so-called G and D peaks. According to the literature associated with Raman
analysis of graphene [31,32], the peak at 1584 cm-1(E2g mode (G band) of graphite) is related to the
vibration of sp2-bonded carbon atoms. Additionally, the peak at 1356 cm−1 is associated with the
vibration of carbon atoms (D band). Accordingly, the phonon frequencies of the Raman spectra
attributed to ZnO are: 332 cm−1 (multiple-phonon scattering processes), 379 cm−1 (A1(TO)), 438 cm−1
(E2(high)), 483 cm-1 (2LA), 574 cm−1 (A1(LO)), and 663 cm−1 (TA+A1(LO)); which are in agreement
with the literature [30,33–35], with the E2(high) mode at438 cm−1exhibitingthe strongest intensity. The
rest peaks shown in the Raman spectrum of Figure 3 can be matched to the PLA of the materials. The
Raman peak at 1046 cm−1can be assigned to the C–CH3 stretching mode, whereas the one at 871 cm−1
to the C–COO stretching of the polymer unit [36,37]. The samples were studied in different positions
indicating similar spectra(as indicated in the inset of Figure 3),revealing the characteristic Raman
peaks for graphene (G and D bands), along with the Raman fingerprints of PLA and ZnO, confirming
the uniform dispersion of ZnO on 3D-printed graphene pyramids.
Figure 1. Typical SEM photographs of the ZnO/three-dimensional (3D)-printed graphene pyramids:(a) side view; (b) top view.
3.2. Structure
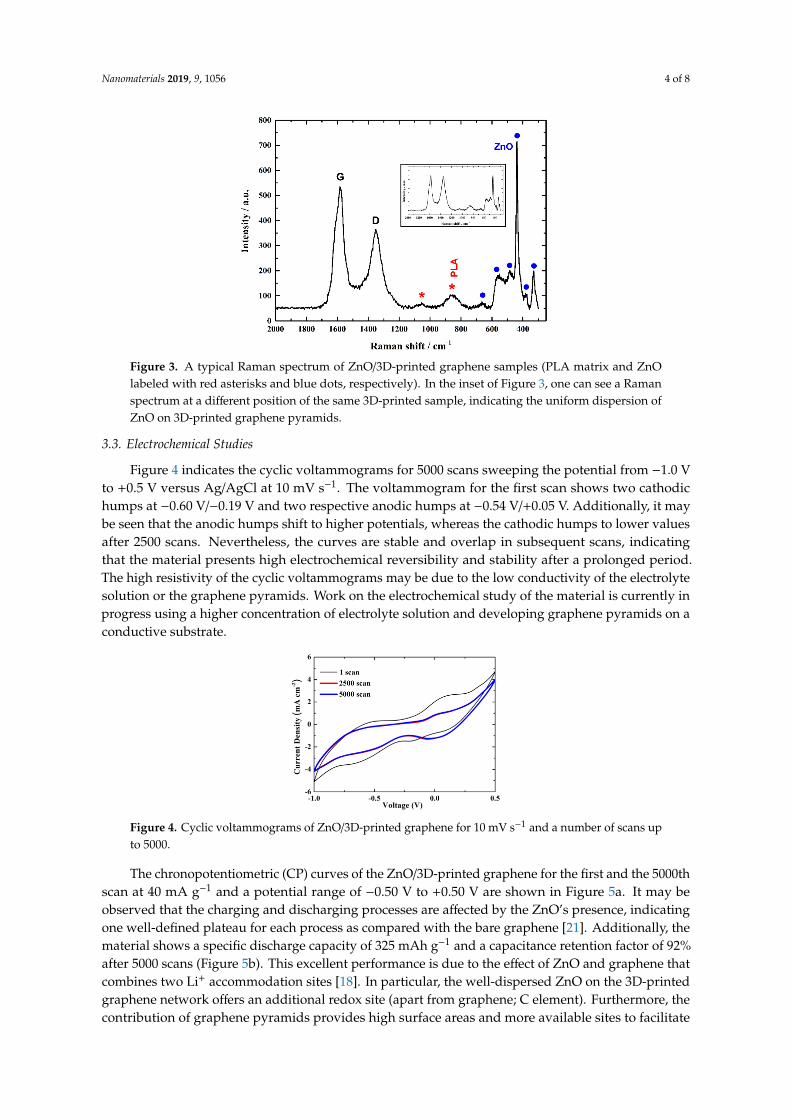
A typical XRD pattern of ZnO/3D-printed graphene samples is presented in Figure 2, verifyingtheir crystalline properties. It depicts the characteristic peaks of the PLA profile [27], along with thegraphite (JCPDS card, No.75-1621 [28,29]), indicating the existence of multilayered graphene in a PLAmatrix. Finally, the XRD pattern of ZnO is identically matched with the characteristic peaks of ZnO’shexagonal P6(3)mc structure, in agreement with JCPDS card file No. 36-1451 and the literature [30].
Nanomaterials 2019, 9, x FOR PEER REVIEW 3 of 8
Figure 1.Typical SEM photographs of the ZnO/three-dimensional (3D)-printed graphene pyramids:
(a) side view; (b) top view.
3.2. Structure
A typical XRD pattern of ZnO/3D-printed graphene samples is presented in Figure 2, verifying
their crystalline properties. It depicts the characteristic peaks of the PLA profile [27], along with the
graphite (JCPDS card, No.75-1621 [28,29]), indicating the existence of multilayered graphene in a PLA
matrix. Finally, the XRD pattern of ZnO is identically matched with the characteristic peaks of ZnO’s
hexagonal P6(3)mc structure, in agreement with JCPDS card file No. 36-1451 and the literature [30].
Figure 2.A typical XRD pattern of ZnO/3D-printed graphene samples. The XRD peaks of the graphite,
PLA and ZnO are indicated with green hashes, red asterisks and blue dots, respectively.
A typical Raman spectrum of ZnO/3D-printed graphene samples is presented in Figure 3.The
key features of the Raman spectrum at around 1584 and 1356 cm−1 are the characteristic ones for
carbon materials, the so-called G and D peaks. According to the literature associated with Raman
analysis of graphene [31,32], the peak at 1584 cm-1(E2g mode (G band) of graphite) is related to the
vibration of sp2-bonded carbon atoms. Additionally, the peak at 1356 cm−1 is associated with the
vibration of carbon atoms (D band). Accordingly, the phonon frequencies of the Raman spectra
attributed to ZnO are: 332 cm−1 (multiple-phonon scattering processes), 379 cm−1 (A1(TO)), 438 cm−1
(E2(high)), 483 cm-1 (2LA), 574 cm−1 (A1(LO)), and 663 cm−1 (TA+A1(LO)); which are in agreement
with the literature [30,33–35], with the E2(high) mode at438 cm−1exhibitingthe strongest intensity. The
rest peaks shown in the Raman spectrum of Figure 3 can be matched to the PLA of the materials. The
Raman peak at 1046 cm−1can be assigned to the C–CH3 stretching mode, whereas the one at 871 cm−1
to the C–COO stretching of the polymer unit [36,37]. The samples were studied in different positions
indicating similar spectra(as indicated in the inset of Figure 3),revealing the characteristic Raman
peaks for graphene (G and D bands), along with the Raman fingerprints of PLA and ZnO, confirming
the uniform dispersion of ZnO on 3D-printed graphene pyramids.
Figure 2. A typical XRD pattern of ZnO/3D-printed graphene samples. The XRD peaks of the graphite,PLA and ZnO are indicated with green hashes, red asterisks and blue dots, respectively.
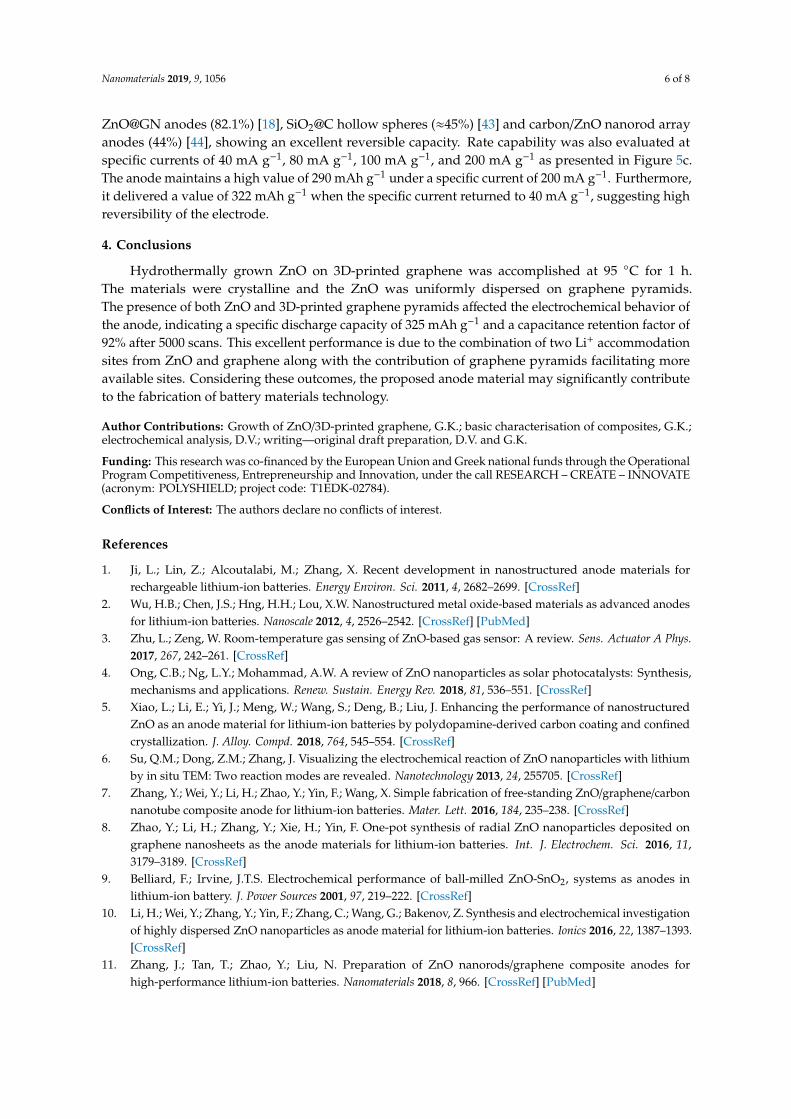
A typical Raman spectrum of ZnO/3D-printed graphene samples is presented in Figure 3. The keyfeatures of the Raman spectrum at around 1584 and 1356 cm−1 are the characteristic ones for carbonmaterials, the so-called G and D peaks. According to the literature associated with Raman analysis ofgraphene [31,32], the peak at 1584 cm−1 (E2g mode (G band) of graphite) is related to the vibrationof sp2-bonded carbon atoms. Additionally, the peak at 1356 cm−1 is associated with the vibrationof carbon atoms (D band). Accordingly, the phonon frequencies of the Raman spectra attributed toZnO are: 332 cm−1 (multiple-phonon scattering processes), 379 cm−1 (A1(TO)), 438 cm−1 (E2(high)),483 cm−1 (2LA), 574 cm−1 (A1(LO)), and 663 cm−1 (TA+A1(LO)); which are in agreement with theliterature [30,33–35], with the E2(high) mode at 438 cm−1 exhibitingthe strongest intensity. The restpeaks shown in the Raman spectrum of Figure 3 can be matched to the PLA of the materials. The Ramanpeak at 1046 cm−1 can be assigned to the C–CH3 stretching mode, whereas the one at 871 cm−1 tothe C–COO stretching of the polymer unit [36,37]. The samples were studied in different positionsindicating similar spectra(as indicated in the inset of Figure 3), revealing the characteristic Ramanpeaks for graphene (G and D bands), along with the Raman fingerprints of PLA and ZnO, confirmingthe uniform dispersion of ZnO on 3D-printed graphene pyramids.
Nanomaterials 2019, 9, 1056 4 of 8Nanomaterials 2019, 9, x FOR PEER REVIEW 4 of 8
Figure 3. A typical Raman spectrum of ZnO/3D-printed graphene samples (PLA matrix and ZnO
labeled with red asterisks and blue dots, respectively).In the inset of Figure 3, one can see a Raman
spectrum at a different position of the same 3D-printed sample, indicating the uniform dispersion of
ZnO on 3D-printed graphene pyramids.
3.3. Electrochemical Studies
Figure 4 indicates the cyclic voltammograms for 5000 scans sweeping the potential from −1.0 V
to +0.5 V versus Ag/AgCl at 10 mV s−1. The voltammogram for the first scan shows two cathodic
humps at -0.60 V/-0.19 V and two respective anodic humps at −0.54 V/+0.05 V. Additionally, it may
be seen that the anodic humps shift to higher potentials, whereas the cathodic humps to lower values
after 2500 scans. Nevertheless, the curves are stable and overlap in subsequent scans, indicating that
the material presents high electrochemical reversibility and stability after a prolonged period.The
high resistivity of the cyclic voltammograms may be due to the low conductivity of the electrolyte
solution or the graphene pyramids. Work on the electrochemical study of the material is currently in
progress using a higher concentration of electrolyte solution and developing graphene pyramids on
a conductive substrate.
Figure 4.Cyclic voltammograms of ZnO/3D-printed graphene for 10 mV s−1 and a number of scans up
to 5000.
The chronopotentiometric (CP) curves of the ZnO/3D-printed graphene for the first and the
5000th scan at 40 mA g−1 and a potential range of−0.50 V to +0.50 V are shown in Figure 5a. It may be
observed that the charging and discharging processes are affected by the ZnO’s presence, indicating
one well-defined plateau for each process as compared with the bare graphene [21]. Additionally, the
material shows a specific discharge capacity of 325 mAh g-1and a capacitance retention factor of 92%
after 5000 scans (Figure 5b). This excellent performance is due to the effect of ZnO and graphene that
combines two Li+ accommodation sites [18]. In particular, the well-dispersed ZnO on the 3D-printed
graphene network offers an additional redox site (apart from graphene; C element). Furthermore, the
Figure 3. A typical Raman spectrum of ZnO/3D-printed graphene samples (PLA matrix and ZnOlabeled with red asterisks and blue dots, respectively). In the inset of Figure 3, one can see a Ramanspectrum at a different position of the same 3D-printed sample, indicating the uniform dispersion ofZnO on 3D-printed graphene pyramids.
3.3. Electrochemical Studies
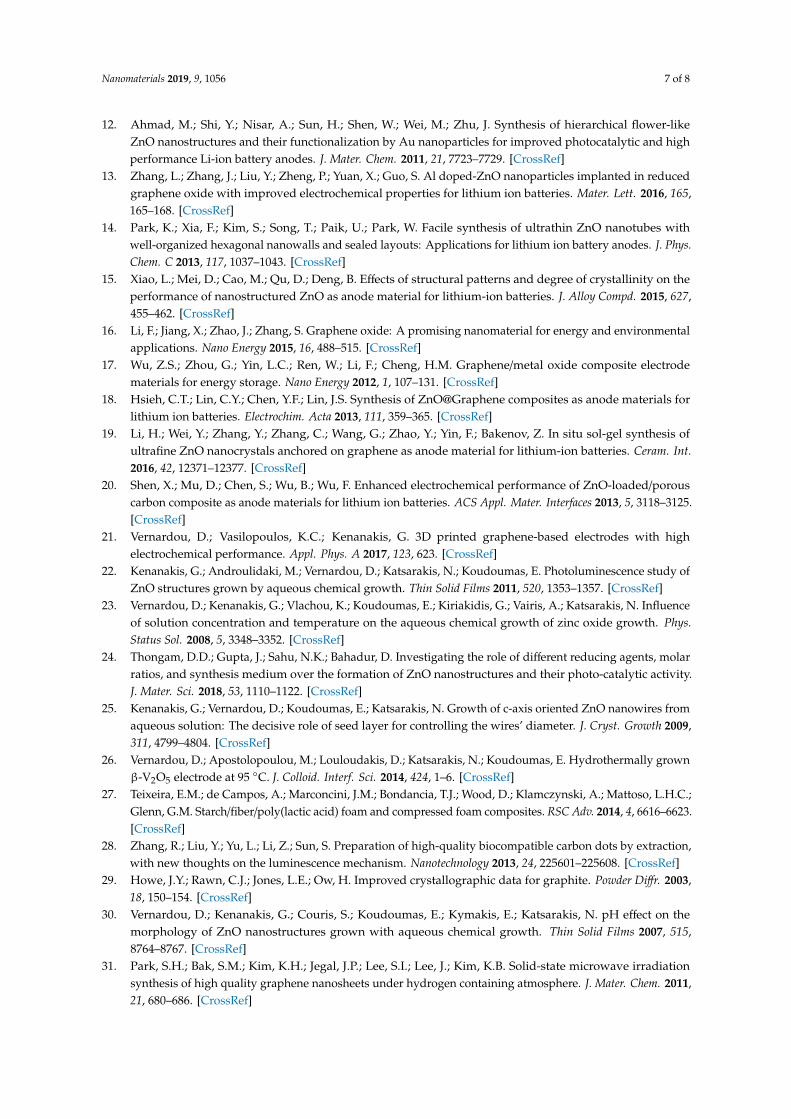
Figure 4 indicates the cyclic voltammograms for 5000 scans sweeping the potential from −1.0 Vto +0.5 V versus Ag/AgCl at 10 mV s−1. The voltammogram for the first scan shows two cathodichumps at −0.60 V/−0.19 V and two respective anodic humps at −0.54 V/+0.05 V. Additionally, it maybe seen that the anodic humps shift to higher potentials, whereas the cathodic humps to lower valuesafter 2500 scans. Nevertheless, the curves are stable and overlap in subsequent scans, indicatingthat the material presents high electrochemical reversibility and stability after a prolonged period.The high resistivity of the cyclic voltammograms may be due to the low conductivity of the electrolytesolution or the graphene pyramids. Work on the electrochemical study of the material is currently inprogress using a higher concentration of electrolyte solution and developing graphene pyramids on aconductive substrate.
Nanomaterials 2019, 9, x FOR PEER REVIEW 4 of 8
Figure 3. A typical Raman spectrum of ZnO/3D-printed graphene samples (PLA matrix and ZnO
labeled with red asterisks and blue dots, respectively).In the inset of Figure 3, one can see a Raman
spectrum at a different position of the same 3D-printed sample, indicating the uniform dispersion of
ZnO on 3D-printed graphene pyramids.
3.3. Electrochemical Studies
Figure 4 indicates the cyclic voltammograms for 5000 scans sweeping the potential from −1.0 V
to +0.5 V versus Ag/AgCl at 10 mV s−1. The voltammogram for the first scan shows two cathodic
humps at -0.60 V/-0.19 V and two respective anodic humps at −0.54 V/+0.05 V. Additionally, it may
be seen that the anodic humps shift to higher potentials, whereas the cathodic humps to lower values
after 2500 scans. Nevertheless, the curves are stable and overlap in subsequent scans, indicating that
the material presents high electrochemical reversibility and stability after a prolonged period.The
high resistivity of the cyclic voltammograms may be due to the low conductivity of the electrolyte
solution or the graphene pyramids. Work on the electrochemical study of the material is currently in
progress using a higher concentration of electrolyte solution and developing graphene pyramids on
a conductive substrate.
Figure 4.Cyclic voltammograms of ZnO/3D-printed graphene for 10 mV s−1 and a number of scans up
to 5000.
The chronopotentiometric (CP) curves of the ZnO/3D-printed graphene for the first and the
5000th scan at 40 mA g−1 and a potential range of−0.50 V to +0.50 V are shown in Figure 5a. It may be
observed that the charging and discharging processes are affected by the ZnO’s presence, indicating
one well-defined plateau for each process as compared with the bare graphene [21]. Additionally, the
material shows a specific discharge capacity of 325 mAh g-1and a capacitance retention factor of 92%
after 5000 scans (Figure 5b). This excellent performance is due to the effect of ZnO and graphene that
combines two Li+ accommodation sites [18]. In particular, the well-dispersed ZnO on the 3D-printed
graphene network offers an additional redox site (apart from graphene; C element). Furthermore, the
Figure 4. Cyclic voltammograms of ZnO/3D-printed graphene for 10 mV s−1 and a number of scans upto 5000.
The chronopotentiometric (CP) curves of the ZnO/3D-printed graphene for the first and the 5000thscan at 40 mA g−1 and a potential range of −0.50 V to +0.50 V are shown in Figure 5a. It may beobserved that the charging and discharging processes are affected by the ZnO’s presence, indicatingone well-defined plateau for each process as compared with the bare graphene [21]. Additionally, thematerial shows a specific discharge capacity of 325 mAh g−1 and a capacitance retention factor of 92%after 5000 scans (Figure 5b). This excellent performance is due to the effect of ZnO and graphene thatcombines two Li+ accommodation sites [18]. In particular, the well-dispersed ZnO on the 3D-printedgraphene network offers an additional redox site (apart from graphene; C element). Furthermore, thecontribution of graphene pyramids provides high surface areas and more available sites to facilitate

Nanomaterials 2019, 9, 1056 5 of 8
the Li-storage capacity. The reduction of ZnO into Zn and the formation of a lithium–zinc alloyare proposed regarding the Li-redox reactions in the active sites of ZnO [38,39]. Accordingly, theelectroactive sites in graphene pyramids for Li storage can be expressed according to the equationxLi+ + C6 + xe− <-> LixC6 [21]. In Table 1 below, the specific discharge capacity value and scannumber of other anode materials are shown and compared with the one reported in this work. It isindicated that the anode material that was prepared by the combination of a 3D-printing techniqueand a hydrothermal procedure has not been reported before utilising either an organic or an inorganicelectrolyte. The estimated capacity value after 5000 scans is promising for further exploitation in Li-ionbatteries if one considers the low cost and the high safety of the materials technology along with theaqueous-based electrolytes, respectively.
Nanomaterials 2019, 9, x FOR PEER REVIEW 5 of 8
contribution of graphene pyramids provides high surface areas and more available sites to facilitate
the Li-storage capacity. The reduction of ZnO into Zn and the formation of a lithium–zinc alloy are
proposed regarding the Li-redox reactions in the active sites of ZnO [38,39]. Accordingly, the
electroactive sites in graphene pyramids for Li storage can be expressed according to the equation
xLi+ + C6 + xe- <-> LixC6 [21]. In Table 1below, the specific discharge capacity value and scan number
of other anode materials are shown and compared with the one reported in this work. It is indicated
that the anode material that was prepared by the combination of a 3D-printing technique and a
hydrothermal procedure has not been reported before utilising either an organic or an inorganic
electrolyte. The estimated capacity value after 5000 scans is promising for further exploitation in Li-
ion batteries if one considers the low cost and the high safety of the materials technology along with
the aqueous-based electrolytes, respectively.
(a) (b)
(c)
Figure 5. (a) The chronopotentiometric (CP) curves of ZnO/3D-printed graphene for −0.5 V to +0.5 V
at 40 mA g−1 (the charge and discharge curves are indicated along with the 1st and the 5000th scan in
black and red color, respectively); (b) Specific discharge capacity and coulombic efficiency of the
anode material as a function of the scan numbers; (c) Rate capability of the composite at 40, 80, 100,
200 mA g−1 and then back to 40 mA g−1.
Table 1. Coulombic efficiency and specific discharge capacity of anodes taken from the literature.
Anodes Specific Discharge
Capacity Scan Number References
ZnO-CoO-C 438 mAh g−1 50 (0.0–2.5 V) [40]
ZnO/graphene 250 mAh g−1 100 (0.005–3.0 V) [41]
ZnO-Loaded/Porous carbon
composite 512.7 mAh g−1 10 (0.1–3.0 V) [20]
ZnO nanorod 358 mAh g−1 30 (0.3–3.0 V) [42]
3D-printed graphene 265 mAh g−1 1000(−1.0–0.5 V) [21]
ZnO/3D-printed graphene pyramids 306 mAh g−1 5000 (−1.0–0.5 V) This work
Figure 5. (a) The chronopotentiometric (CP) curves of ZnO/3D-printed graphene for −0.5 V to +0.5 Vat 40 mA g−1 (the charge and discharge curves are indicated along with the 1st and the 5000th scanin black and red color, respectively); (b) Specific discharge capacity and coulombic efficiency of theanode material as a function of the scan numbers; (c) Rate capability of the composite at 40, 80, 100,200 mA g−1 and then back to 40 mA g−1.
Table 1. Coulombic efficiency and specific discharge capacity of anodes taken from the literature.
Anodes Specific Discharge Capacity Scan Number References
ZnO-CoO-C 438 mAh g−1 50 (0.0–2.5 V) [40]ZnO/graphene 250 mAh g−1 100 (0.005–3.0 V) [41]
ZnO-Loaded/Porous carbon composite 512.7 mAh g−1 10 (0.1–3.0 V) [20]ZnO nanorod 358 mAh g−1 30 (0.3–3.0 V) [42]
3D-printed graphene 265 mAh g−1 1000(−1.0–0.5 V) [21]ZnO/3D-printed graphene pyramids 306 mAh g−1 5000 (−1.0–0.5 V) This work
The anode material exhibited a coulombic efficiency of 100% that dropped to 85% after 5000 scansas shown in Figure 5b. The coulombic efficiency observed in this material is much higher than that of
Nanomaterials 2019, 9, 1056 6 of 8
ZnO@GN anodes (82.1%) [18], SiO2@C hollow spheres (≈45%) [43] and carbon/ZnO nanorod arrayanodes (44%) [44], showing an excellent reversible capacity. Rate capability was also evaluated atspecific currents of 40 mA g−1, 80 mA g−1, 100 mA g−1, and 200 mA g−1 as presented in Figure 5c.The anode maintains a high value of 290 mAh g−1 under a specific current of 200 mA g−1. Furthermore,it delivered a value of 322 mAh g−1 when the specific current returned to 40 mA g−1, suggesting highreversibility of the electrode.
4. Conclusions
Hydrothermally grown ZnO on 3D-printed graphene was accomplished at 95 ◦C for 1 h.The materials were crystalline and the ZnO was uniformly dispersed on graphene pyramids.The presence of both ZnO and 3D-printed graphene pyramids affected the electrochemical behavior ofthe anode, indicating a specific discharge capacity of 325 mAh g−1 and a capacitance retention factor of92% after 5000 scans. This excellent performance is due to the combination of two Li+ accommodationsites from ZnO and graphene along with the contribution of graphene pyramids facilitating moreavailable sites. Considering these outcomes, the proposed anode material may significantly contributeto the fabrication of battery materials technology.
Author Contributions: Growth of ZnO/3D-printed graphene, G.K.; basic characterisation of composites, G.K.;electrochemical analysis, D.V.; writing—original draft preparation, D.V. and G.K.
Funding: This research was co-financed by the European Union and Greek national funds through the OperationalProgram Competitiveness, Entrepreneurship and Innovation, under the call RESEARCH – CREATE – INNOVATE(acronym: POLYSHIELD; project code: T1EDK-02784).
Conflicts of Interest: The authors declare no conflicts of interest.
References
1. Ji, L.; Lin, Z.; Alcoutalabi, M.; Zhang, X. Recent development in nanostructured anode materials forrechargeable lithium-ion batteries. Energy Environ. Sci. 2011, 4, 2682–2699. [CrossRef]
2. Wu, H.B.; Chen, J.S.; Hng, H.H.; Lou, X.W. Nanostructured metal oxide-based materials as advanced anodesfor lithium-ion batteries. Nanoscale 2012, 4, 2526–2542. [CrossRef] [PubMed]
3. Zhu, L.; Zeng, W. Room-temperature gas sensing of ZnO-based gas sensor: A review. Sens. Actuator A Phys.2017, 267, 242–261. [CrossRef]
4. Ong, C.B.; Ng, L.Y.; Mohammad, A.W. A review of ZnO nanoparticles as solar photocatalysts: Synthesis,mechanisms and applications. Renew. Sustain. Energy Rev. 2018, 81, 536–551. [CrossRef]
5. Xiao, L.; Li, E.; Yi, J.; Meng, W.; Wang, S.; Deng, B.; Liu, J. Enhancing the performance of nanostructuredZnO as an anode material for lithium-ion batteries by polydopamine-derived carbon coating and confinedcrystallization. J. Alloy. Compd. 2018, 764, 545–554. [CrossRef]
6. Su, Q.M.; Dong, Z.M.; Zhang, J. Visualizing the electrochemical reaction of ZnO nanoparticles with lithiumby in situ TEM: Two reaction modes are revealed. Nanotechnology 2013, 24, 255705. [CrossRef]
7. Zhang, Y.; Wei, Y.; Li, H.; Zhao, Y.; Yin, F.; Wang, X. Simple fabrication of free-standing ZnO/graphene/carbonnanotube composite anode for lithium-ion batteries. Mater. Lett. 2016, 184, 235–238. [CrossRef]
8. Zhao, Y.; Li, H.; Zhang, Y.; Xie, H.; Yin, F. One-pot synthesis of radial ZnO nanoparticles deposited ongraphene nanosheets as the anode materials for lithium-ion batteries. Int. J. Electrochem. Sci. 2016, 11,3179–3189. [CrossRef]
9. Belliard, F.; Irvine, J.T.S. Electrochemical performance of ball-milled ZnO-SnO2, systems as anodes inlithium-ion battery. J. Power Sources 2001, 97, 219–222. [CrossRef]
10. Li, H.; Wei, Y.; Zhang, Y.; Yin, F.; Zhang, C.; Wang, G.; Bakenov, Z. Synthesis and electrochemical investigationof highly dispersed ZnO nanoparticles as anode material for lithium-ion batteries. Ionics 2016, 22, 1387–1393.[CrossRef]
11. Zhang, J.; Tan, T.; Zhao, Y.; Liu, N. Preparation of ZnO nanorods/graphene composite anodes forhigh-performance lithium-ion batteries. Nanomaterials 2018, 8, 966. [CrossRef] [PubMed]
Nanomaterials 2019, 9, 1056 7 of 8
12. Ahmad, M.; Shi, Y.; Nisar, A.; Sun, H.; Shen, W.; Wei, M.; Zhu, J. Synthesis of hierarchical flower-likeZnO nanostructures and their functionalization by Au nanoparticles for improved photocatalytic and highperformance Li-ion battery anodes. J. Mater. Chem. 2011, 21, 7723–7729. [CrossRef]
13. Zhang, L.; Zhang, J.; Liu, Y.; Zheng, P.; Yuan, X.; Guo, S. Al doped-ZnO nanoparticles implanted in reducedgraphene oxide with improved electrochemical properties for lithium ion batteries. Mater. Lett. 2016, 165,165–168. [CrossRef]
14. Park, K.; Xia, F.; Kim, S.; Song, T.; Paik, U.; Park, W. Facile synthesis of ultrathin ZnO nanotubes withwell-organized hexagonal nanowalls and sealed layouts: Applications for lithium ion battery anodes. J. Phys.Chem. C 2013, 117, 1037–1043. [CrossRef]
15. Xiao, L.; Mei, D.; Cao, M.; Qu, D.; Deng, B. Effects of structural patterns and degree of crystallinity on theperformance of nanostructured ZnO as anode material for lithium-ion batteries. J. Alloy Compd. 2015, 627,455–462. [CrossRef]
16. Li, F.; Jiang, X.; Zhao, J.; Zhang, S. Graphene oxide: A promising nanomaterial for energy and environmentalapplications. Nano Energy 2015, 16, 488–515. [CrossRef]
17. Wu, Z.S.; Zhou, G.; Yin, L.C.; Ren, W.; Li, F.; Cheng, H.M. Graphene/metal oxide composite electrodematerials for energy storage. Nano Energy 2012, 1, 107–131. [CrossRef]
18. Hsieh, C.T.; Lin, C.Y.; Chen, Y.F.; Lin, J.S. Synthesis of ZnO@Graphene composites as anode materials forlithium ion batteries. Electrochim. Acta 2013, 111, 359–365. [CrossRef]
19. Li, H.; Wei, Y.; Zhang, Y.; Zhang, C.; Wang, G.; Zhao, Y.; Yin, F.; Bakenov, Z. In situ sol-gel synthesis ofultrafine ZnO nanocrystals anchored on graphene as anode material for lithium-ion batteries. Ceram. Int.2016, 42, 12371–12377. [CrossRef]
20. Shen, X.; Mu, D.; Chen, S.; Wu, B.; Wu, F. Enhanced electrochemical performance of ZnO-loaded/porouscarbon composite as anode materials for lithium ion batteries. ACS Appl. Mater. Interfaces 2013, 5, 3118–3125.[CrossRef]
21. Vernardou, D.; Vasilopoulos, K.C.; Kenanakis, G. 3D printed graphene-based electrodes with highelectrochemical performance. Appl. Phys. A 2017, 123, 623. [CrossRef]
22. Kenanakis, G.; Androulidaki, M.; Vernardou, D.; Katsarakis, N.; Koudoumas, E. Photoluminescence study ofZnO structures grown by aqueous chemical growth. Thin Solid Films 2011, 520, 1353–1357. [CrossRef]
23. Vernardou, D.; Kenanakis, G.; Vlachou, K.; Koudoumas, E.; Kiriakidis, G.; Vairis, A.; Katsarakis, N. Influenceof solution concentration and temperature on the aqueous chemical growth of zinc oxide growth. Phys.Status Sol. 2008, 5, 3348–3352. [CrossRef]
24. Thongam, D.D.; Gupta, J.; Sahu, N.K.; Bahadur, D. Investigating the role of different reducing agents, molarratios, and synthesis medium over the formation of ZnO nanostructures and their photo-catalytic activity.J. Mater. Sci. 2018, 53, 1110–1122. [CrossRef]
25. Kenanakis, G.; Vernardou, D.; Koudoumas, E.; Katsarakis, N. Growth of c-axis oriented ZnO nanowires fromaqueous solution: The decisive role of seed layer for controlling the wires’ diameter. J. Cryst. Growth 2009,311, 4799–4804. [CrossRef]
26. Vernardou, D.; Apostolopoulou, M.; Louloudakis, D.; Katsarakis, N.; Koudoumas, E. Hydrothermally grownβ-V2O5 electrode at 95 ◦C. J. Colloid. Interf. Sci. 2014, 424, 1–6. [CrossRef]
27. Teixeira, E.M.; de Campos, A.; Marconcini, J.M.; Bondancia, T.J.; Wood, D.; Klamczynski, A.; Mattoso, L.H.C.;Glenn, G.M. Starch/fiber/poly(lactic acid) foam and compressed foam composites. RSC Adv. 2014, 4, 6616–6623.[CrossRef]
28. Zhang, R.; Liu, Y.; Yu, L.; Li, Z.; Sun, S. Preparation of high-quality biocompatible carbon dots by extraction,with new thoughts on the luminescence mechanism. Nanotechnology 2013, 24, 225601–225608. [CrossRef]
29. Howe, J.Y.; Rawn, C.J.; Jones, L.E.; Ow, H. Improved crystallographic data for graphite. Powder Diffr. 2003,18, 150–154. [CrossRef]
30. Vernardou, D.; Kenanakis, G.; Couris, S.; Koudoumas, E.; Kymakis, E.; Katsarakis, N. pH effect on themorphology of ZnO nanostructures grown with aqueous chemical growth. Thin Solid Films 2007, 515,8764–8767. [CrossRef]
31. Park, S.H.; Bak, S.M.; Kim, K.H.; Jegal, J.P.; Lee, S.I.; Lee, J.; Kim, K.B. Solid-state microwave irradiationsynthesis of high quality graphene nanosheets under hydrogen containing atmosphere. J. Mater. Chem. 2011,21, 680–686. [CrossRef]
Nanomaterials 2019, 9, 1056 8 of 8
32. Shen, J.; Li, T.; Long, Y.; Shi, M.; Li, N.; Ye, M. One-step solid state preparation of reduced graphene oxide.Carbon 2012, 50, 2134–2140. [CrossRef]
33. Zhaochun, Z.; Baibiao, H.; Yongqin, Y.; Deliang, C. Electrical properties and Raman spectra of undoped andAl-doped ZnO thin films by metalorganic vapor phase epitaxy. Mater. Sci. Eng. B 2001, 86, 109–112. [CrossRef]
34. Cusco, R.; Alarcon-Liado, E.; Ibanez, J.; Artus, L.; Jimenez, J.; Wang, B.; Callahan, M.J. Temperaturedependence of Raman scattering in ZnO. Phys. Rev. B 2007, 75, 165202. [CrossRef]
35. Cerqueira, M.F.; Viseu, T.; Ayres de Campos, J.; Rolo, A.G.; de Lacerda-Aroso, T.; Oliveira, F.;Bogdanovic-Radovic, I.; Alves, E.; Vasilevskiy, M.I. Raman study of insulating and conductive ZnO:(Al, Mn)thin films. Phys. Status Solidi 2015, 212, 2345–2354. [CrossRef]
36. Vano-Herrera, K.; Misiun, A.; Vogt, C. Preparation and characterization of poly(lactic acid)/poly(methylmethacrylate) blend tablets for application in quantitative analysis by micro Raman spectroscopy.J. Raman Spectrosc. 2015, 46, 273–279. [CrossRef]
37. Garlotta, D. A literature review of poly(lactic acid). J. Polym. Environ. 2001, 9, 63–84. [CrossRef]38. Huang, X.H.; Xia, X.H.; Yuan, Y.F.; Zhou, F. Porous ZnO nanosheets grown on copper substrates as anode for
lithium ion batteries. Electrochim. Acta 2011, 56, 4960–4965. [CrossRef]39. Huang, X.H.; Wu, J.B.; Lin, Y.; Guo, R.Q. ZnO microrod arrays grown on copper substrates as anode materials
for lithium ion batteries. Int. J. Electrochem. Sci. 2012, 7, 6611–6621.40. Wu, Z.; Qin, L.; Pan, Q. Fabrication and electrochemical behaviour of flower-like ZnO-CoO-C nanowall
arrays as anodes for lithium-ion batteries. J. Alloy Compd. 2011, 509, 9207–9213. [CrossRef]41. Moon, Y.W.; Choi, I.J.; Koh, Y.H.; Kim, H.E. Porous alumina ceramic scaffolds with biomimetic macro/micro-
porous structure using three-dimensional (3-D) ceramic/camphene-based extrusion. Ceram. Int. 2015, 41,12371–12377. [CrossRef]
42. Lee, J.H.; Hon, M.H.; Chung, Y.W. The effect of TiO2 coating on the electrochemical performance of ZnOnanorod as the anode material for lithium-ion battery. Appl. Phys. A Mater. Sci. Process. 2011, 102, 545–550.[CrossRef]
43. Liu, X.; Chen, Y.; Liu, H.; Liu, Z.Q. SiO2@C hollow sphere anodes for lithium-ion batteries. J. Mater. Sci. Technol.2017, 33, 239–245. [CrossRef]
44. Liu, J.; Li, Y.; Ding, J.J.; Hu, Y.; Ji, X.; Chi, Q.; Zhu, Z.; Huang, X. Carbon/ZnO nanorod array electrode withsignificantly improved lithium storage capability. J. Phys. Chem. C 2009, 113, 5336–5339. [CrossRef]
© 2019 by the authors. Licensee MDPI, Basel, Switzerland. This article is an open accessarticle distributed under the terms and conditions of the Creative Commons Attribution(CC BY) license (http://creativecommons.org/licenses/by/4.0/).


![Sunday 27 November 2016...hydrothermally grown ZnO nanorods [page a-68] Wuttichai 16:20 [OR -MA 04]Application of amine functionalized magnesium ferrite nanoparticles in wastewater](https://img.pdfslide.us/doc/110x75/60f6b676a6e0011a1839dd16/sunday-27-november-2016-hydrothermally-grown-zno-nanorods-page-a-68-wuttichai.jpg)