Embed Size (px)
Citation preview
SaaS Metrics Report
February 2016
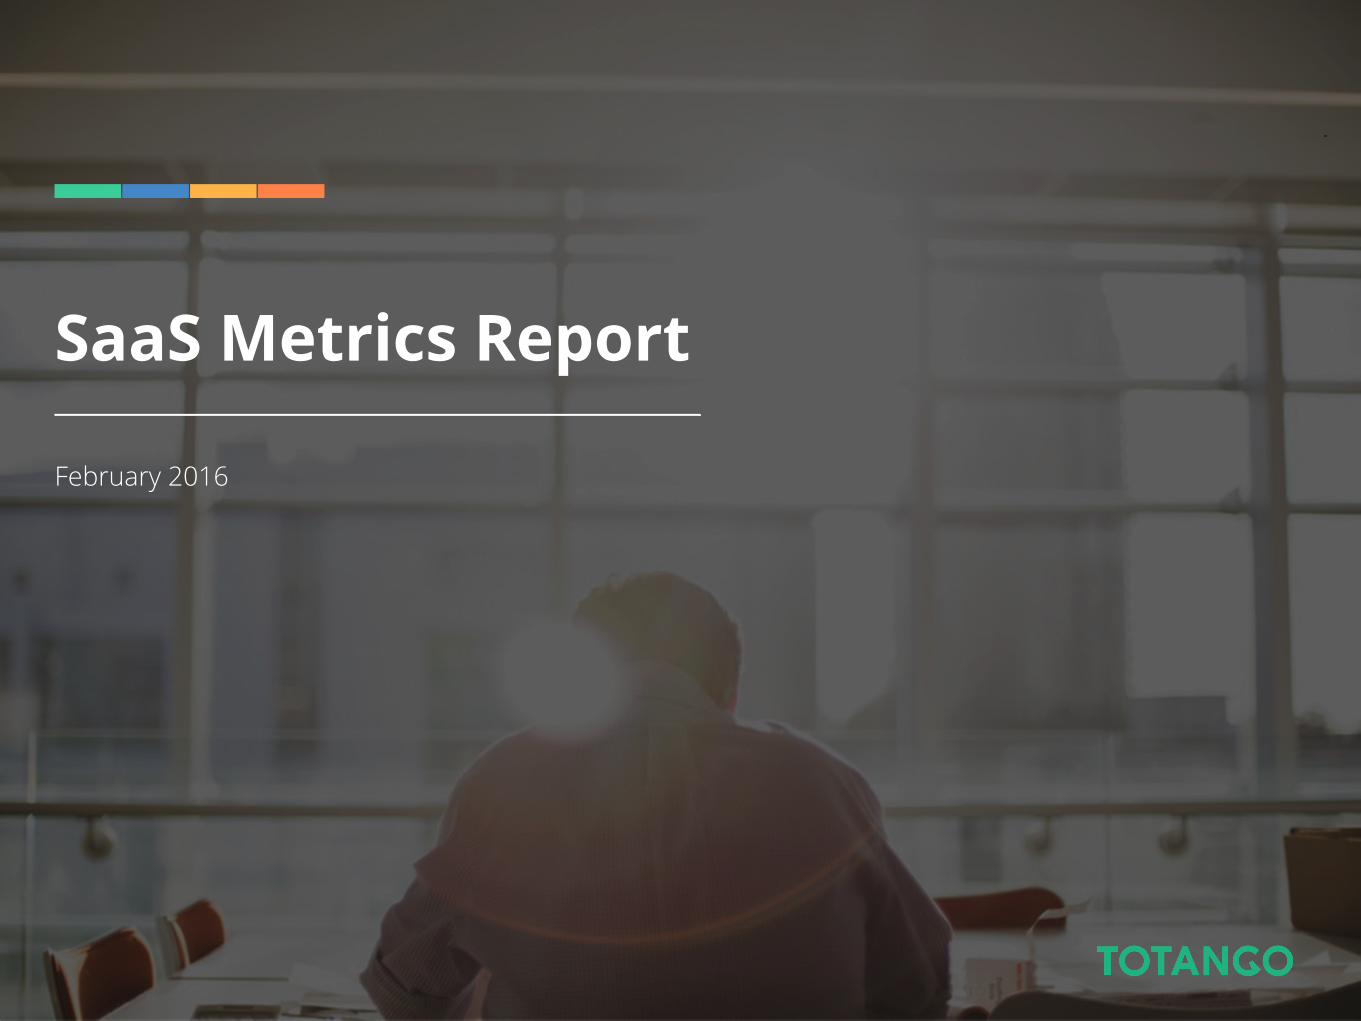
About The Research
The SaaS Metrics Report isbased on an annually conducted survey started in 2011.
This year’s report lookedat responses from over300 SaaS professionals.
AboutTotango
Totango is the leader in customer success management for SaaSbusinesses.
Totango helps companiesimprove customer health, boost revenue, and manage their customer success operations.
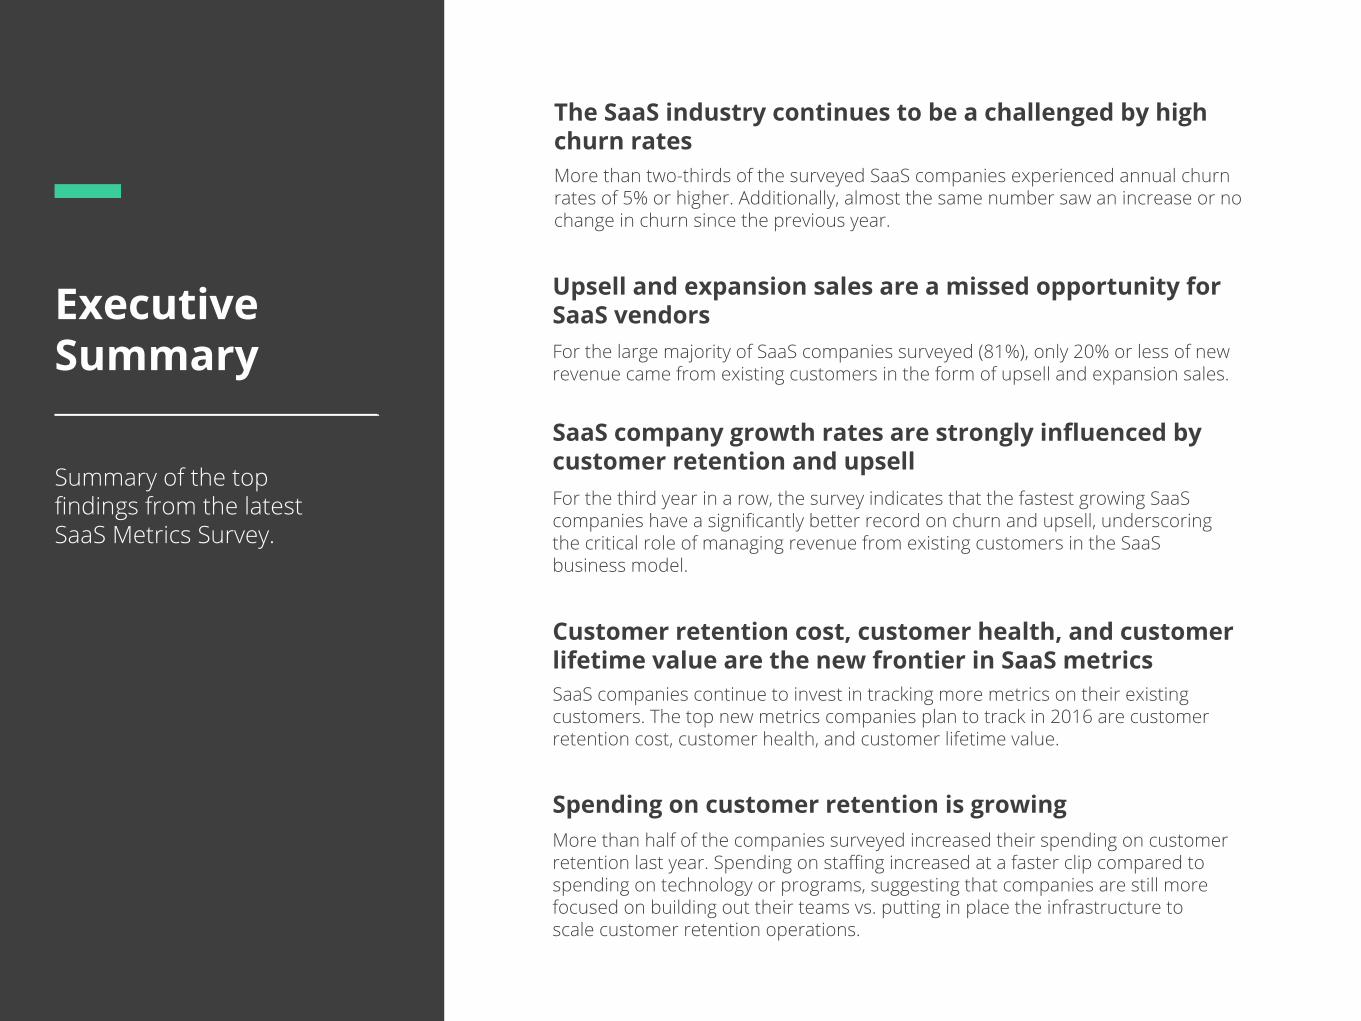
ExecutiveSummary
Summary of the topfindings from the latestSaaS Metrics Survey.
Customer retention cost, customer health, and customer lifetime value are the new frontier in SaaS metrics
The SaaS industry continues to be a challenged by high churn rates
Spending on customer retention is growing
SaaS companies continue to invest in tracking more metrics on their existing customers. The top new metrics companies plan to track in 2016 are customer retention cost, customer health, and customer lifetime value.
More than two-thirds of the surveyed SaaS companies experienced annual churn rates of 5% or higher. Additionally, almost the same number saw an increase or no change in churn since the previous year.
More than half of the companies surveyed increased their spending on customer retention last year. Spending on staffing increased at a faster clip compared to spending on technology or programs, suggesting that companies are still more focused on building out their teams vs. putting in place the infrastructure to scale customer retention operations.
Upsell and expansion sales are a missed opportunity for SaaS vendorsFor the large majority of SaaS companies surveyed (81%), only 20% or less of new revenue came from existing customers in the form of upsell and expansion sales.
SaaS company growth rates are strongly influenced by customer retention and upsellFor the third year in a row, the survey indicates that the fastest growing SaaS companies have a significantly better record on churn and upsell, underscoring the critical role of managing revenue from existing customers in the SaaS business model.

ParticipantProfile
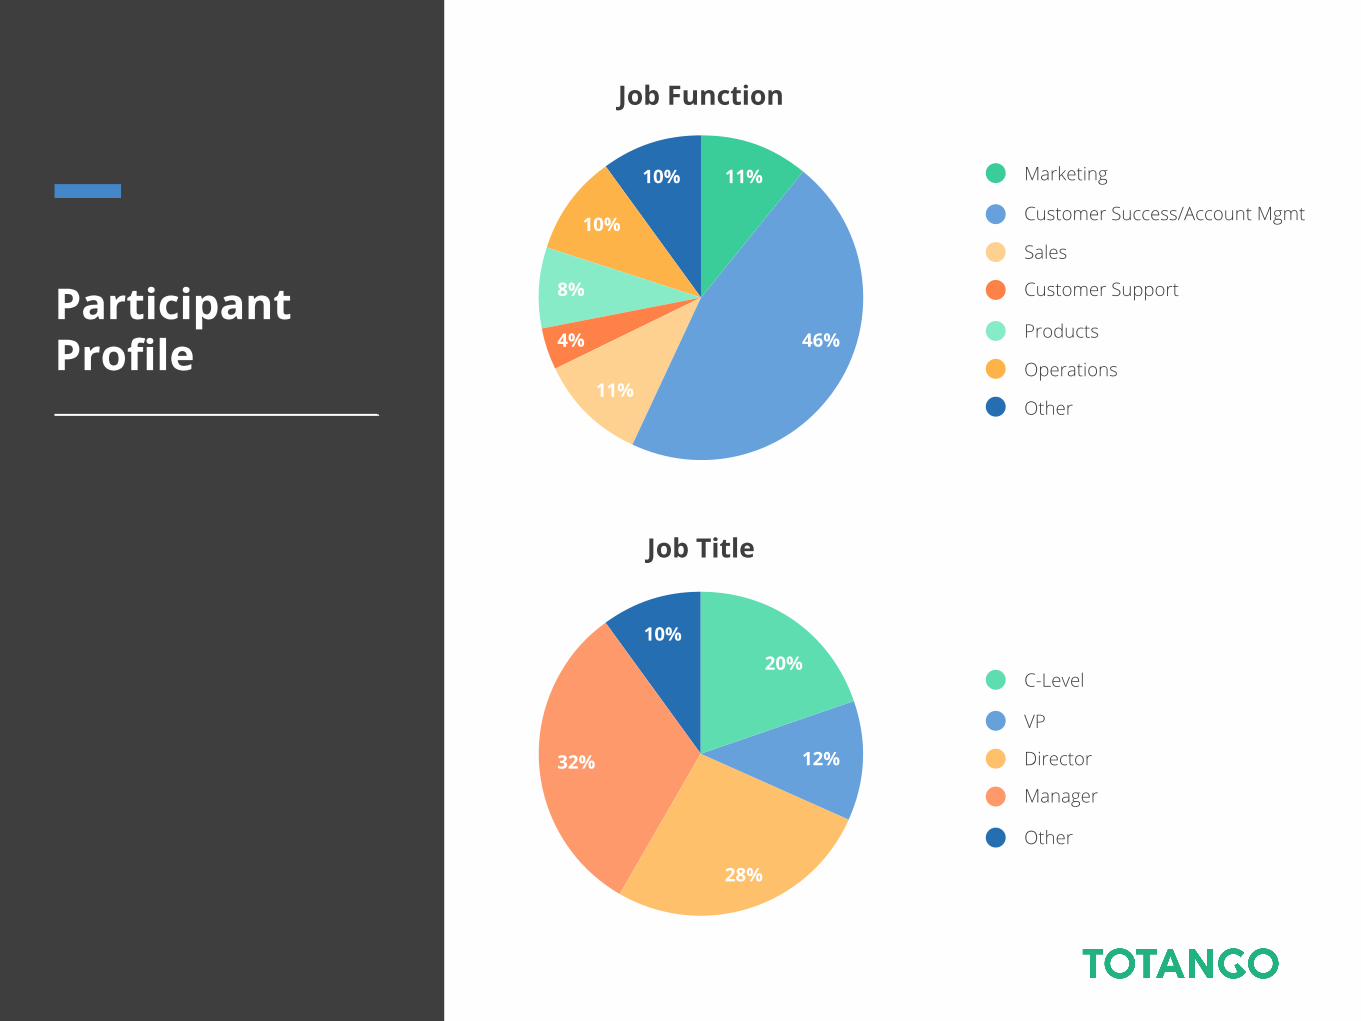
Job Function
Job Title
Marketing
Customer Success/Account Mgmt
Sales
Customer Support
Products
Operations
Other
C-Level
VP
Director
Manager
Other
ParticipantProfile
11%
46%
11%
4%
8%
10%
10%
20%
12%
28%
32%
10%
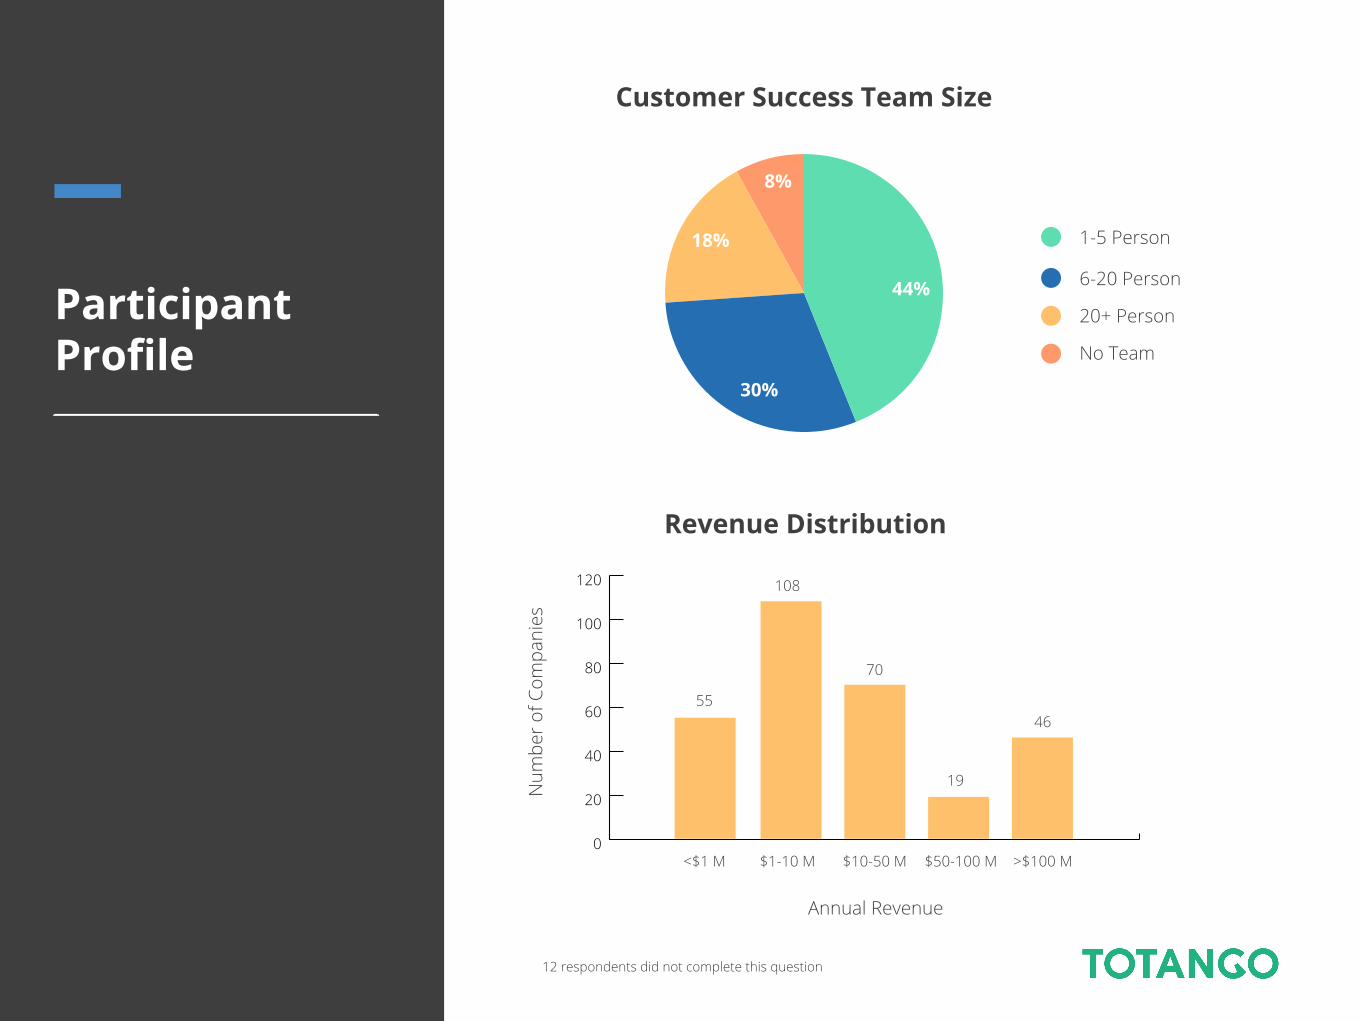
ParticipantProfile
Customer Success Team Size
1-5 Person
6-20 Person
20+ Person
No Team
44%
30%
18%
8%
Revenue Distribution
0
20
40
60
80
100
120
<$1 M $1-10 M $10-50 M $50-100 M >$100 M
55
108
70
19
46
Annual Revenue
Num
ber o
f Com
pani
es
12 respondents did not complete this question
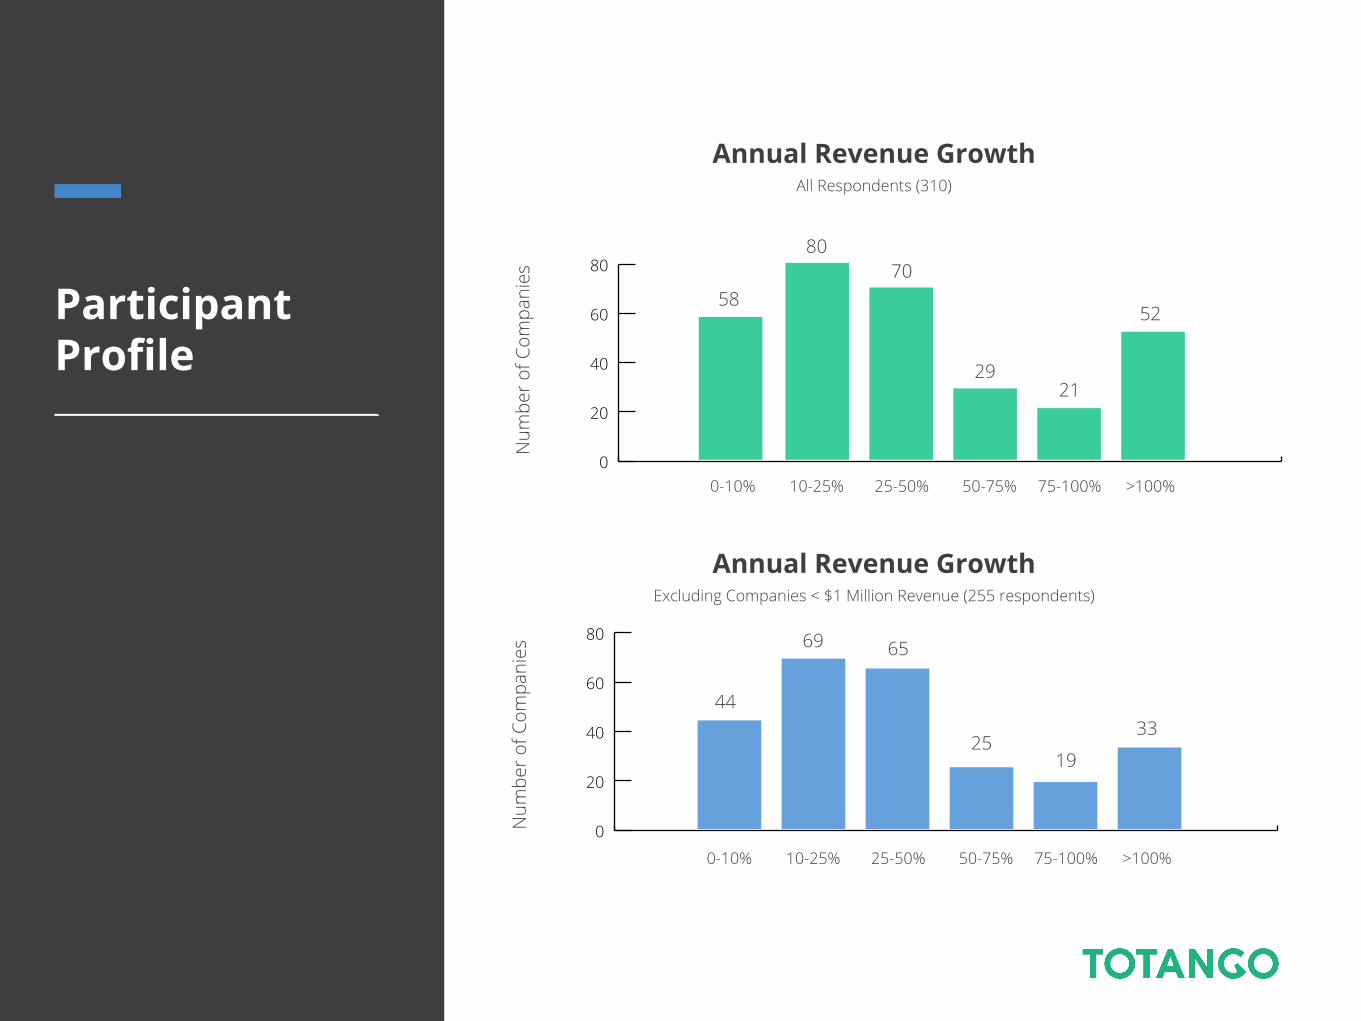
Annual Revenue Growth
ParticipantProfile
Num
ber o
f Com
pani
es
0
20
40
60
80
0
20
40
60
80
Num
ber o
f Com
pani
es
0-10% 10-25% 25-50% 50-75% 75-100% >100%
0-10% 10-25% 25-50% 50-75% 75-100% >100%
58
8070
2921
52
44
69 65
2519
33
All Respondents (310)
Annual Revenue GrowthExcluding Companies < $1 Million Revenue (255 respondents)

Survey Results& Analysis
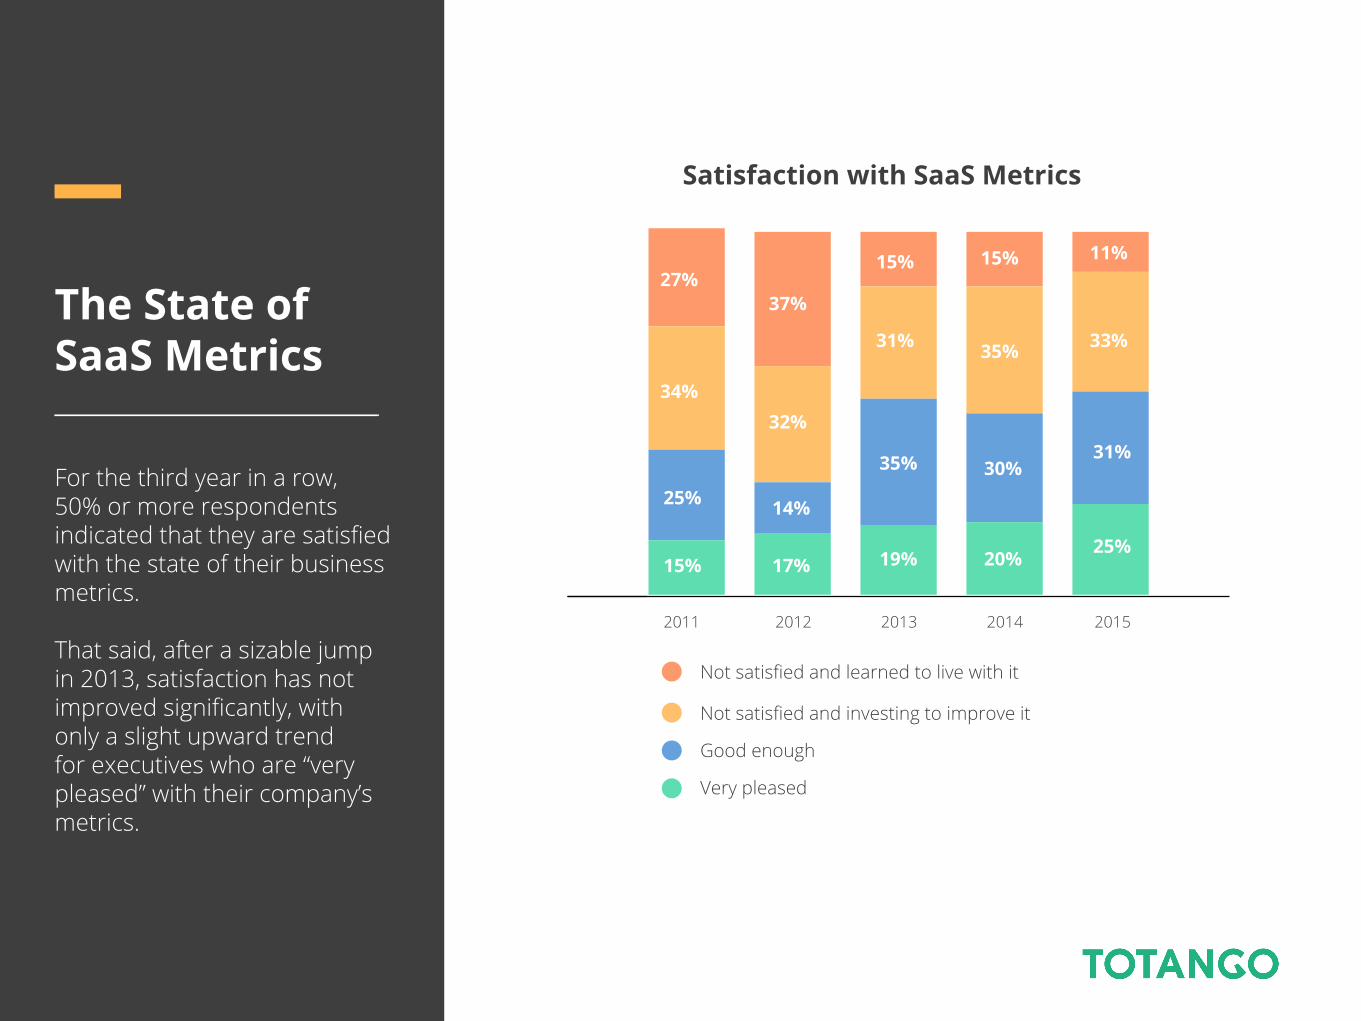
The State ofSaaS Metrics
For the third year in a row, 50% or more respondents indicated that they are satisfiedwith the state of their businessmetrics.
That said, after a sizable jumpin 2013, satisfaction has not improved significantly, with only a slight upward trendfor executives who are “very pleased” with their company’smetrics.
Satisfaction with SaaS Metrics
Not satisfied and learned to live with it
Not satisfied and investing to improve it
Good enough
Very pleased
27%
2011 2012 2013 2014 2015
34%
25%
15%
37%
32%
14%
17%
15%
31%
35%
19%
15%
35%
30%
20%
11%
33%
31%
25%
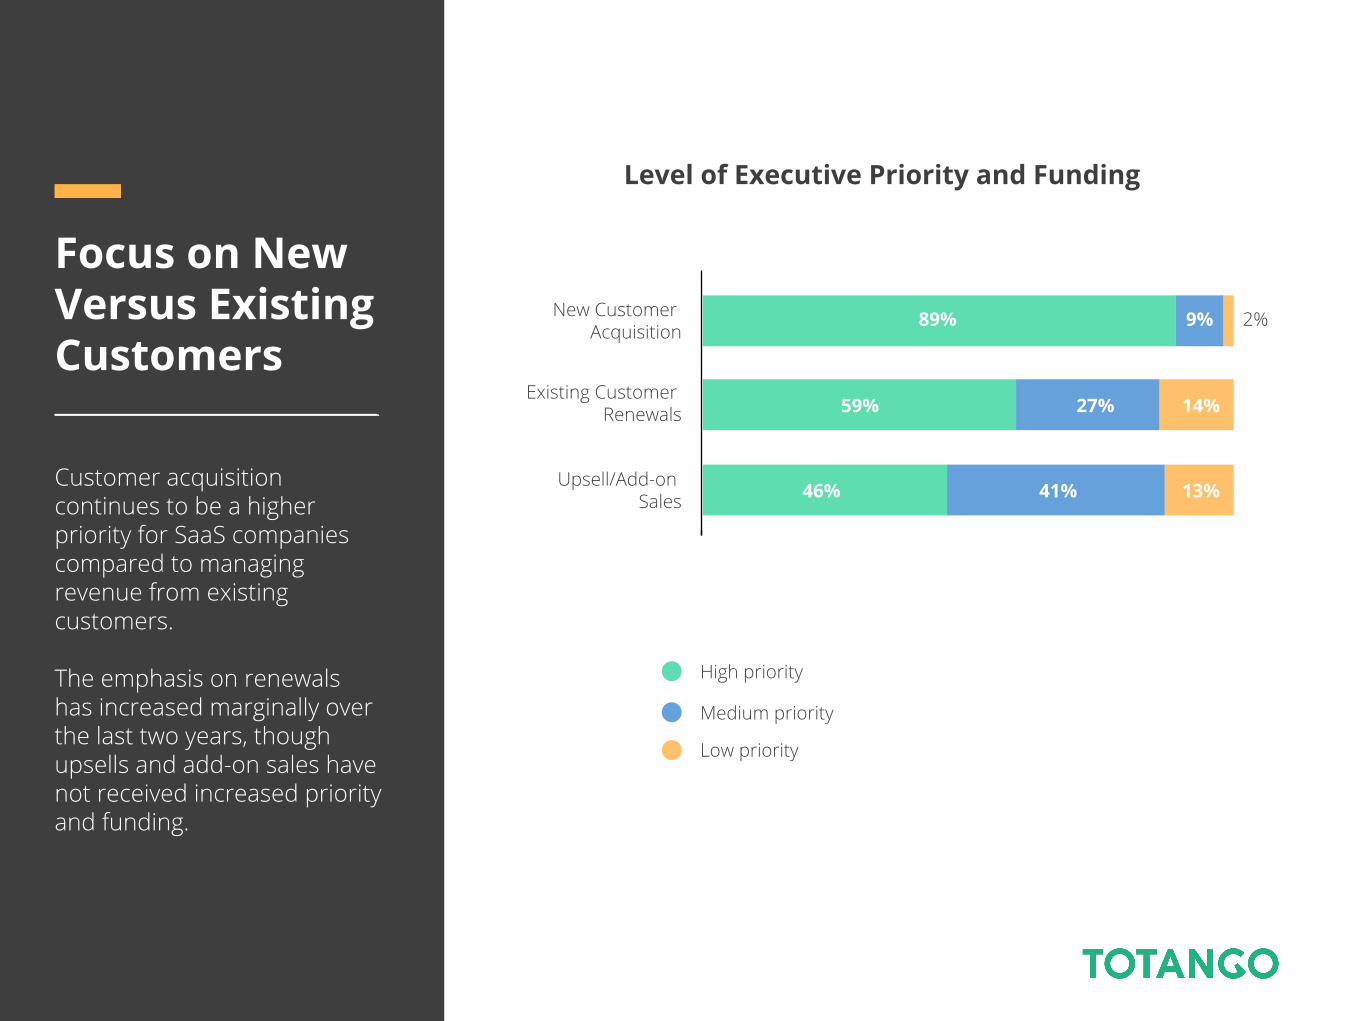
Level of Executive Priority and Funding
High priority
Medium priority
Low priority
Focus on NewVersus ExistingCustomers
Customer acquisitioncontinues to be a higherpriority for SaaS companiescompared to managing revenue from existingcustomers.
The emphasis on renewalshas increased marginally overthe last two years, thoughupsells and add-on sales havenot received increased priorityand funding.
New Customer Acquisition
Existing Customer Renewals
Upsell/Add-on Sales
89% 9%
59%
46%
27%
41% 13%
14%
2%
46%
49%
50%
54%
58%
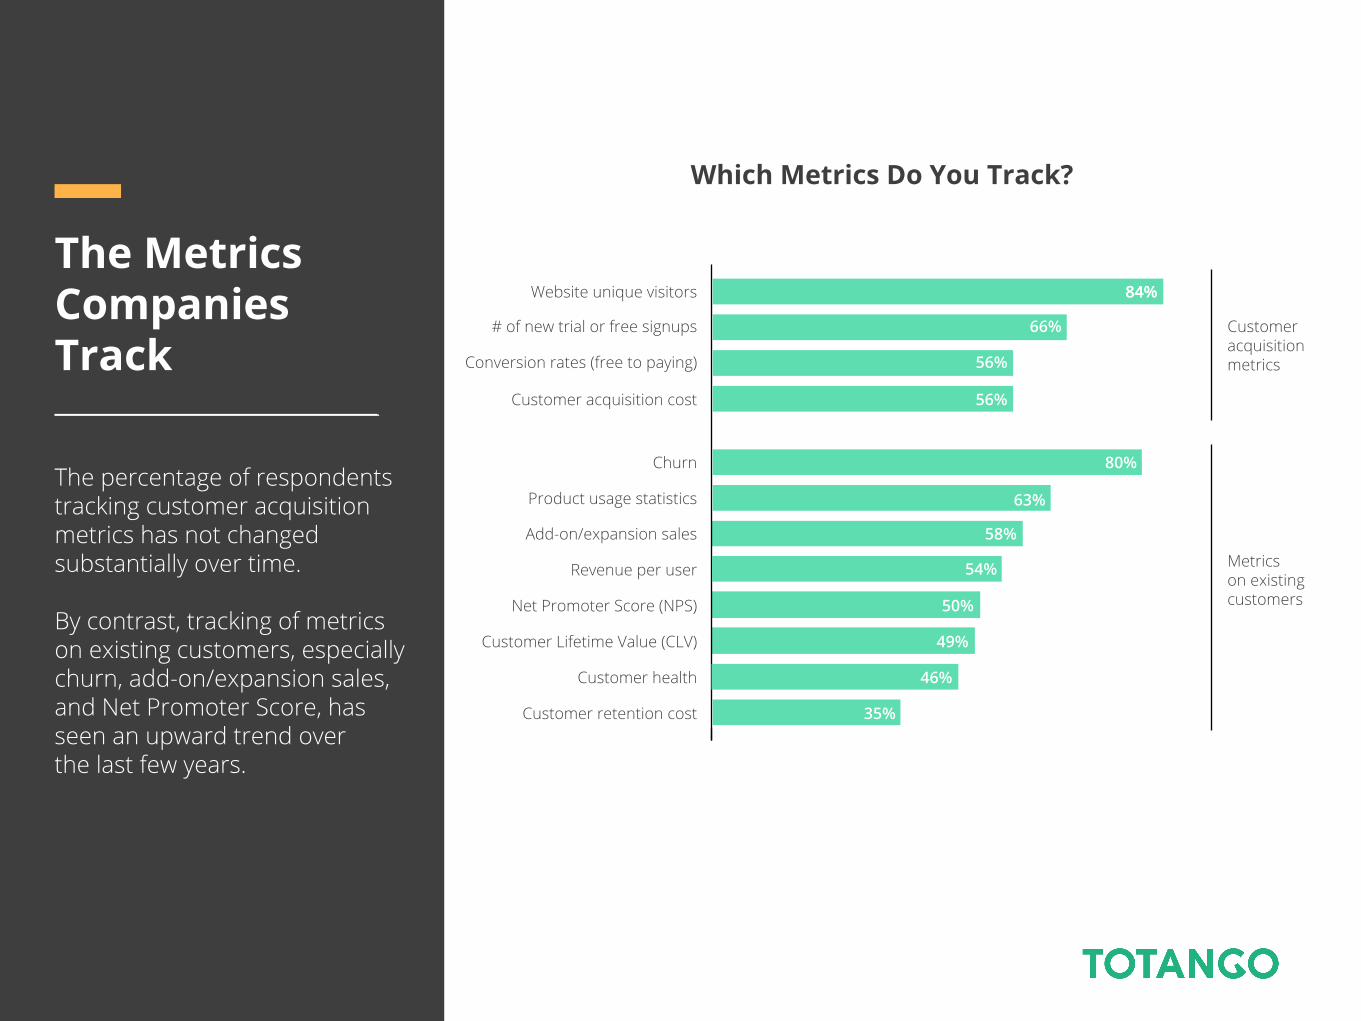
Which Metrics Do You Track?
Website unique visitors
The MetricsCompaniesTrack
The percentage of respondents tracking customer acquisition metrics has not changed substantially over time.
By contrast, tracking of metricson existing customers, especially churn, add-on/expansion sales, and Net Promoter Score, hasseen an upward trend overthe last few years.
# of new trial or free signups
Conversion rates (free to paying)
Customer acquisition cost
Churn
Product usage statistics
Add-on/expansion sales
Revenue per user
Net Promoter Score (NPS)
Customer Lifetime Value (CLV)
Customer health
Customer retention cost
84%
66%
56%
56%
80%
63%
84%
35%
Customeracquisitionmetrics
Metricson existingcustomers
54%
46%
37%
45%
46%
55%
22%
37%
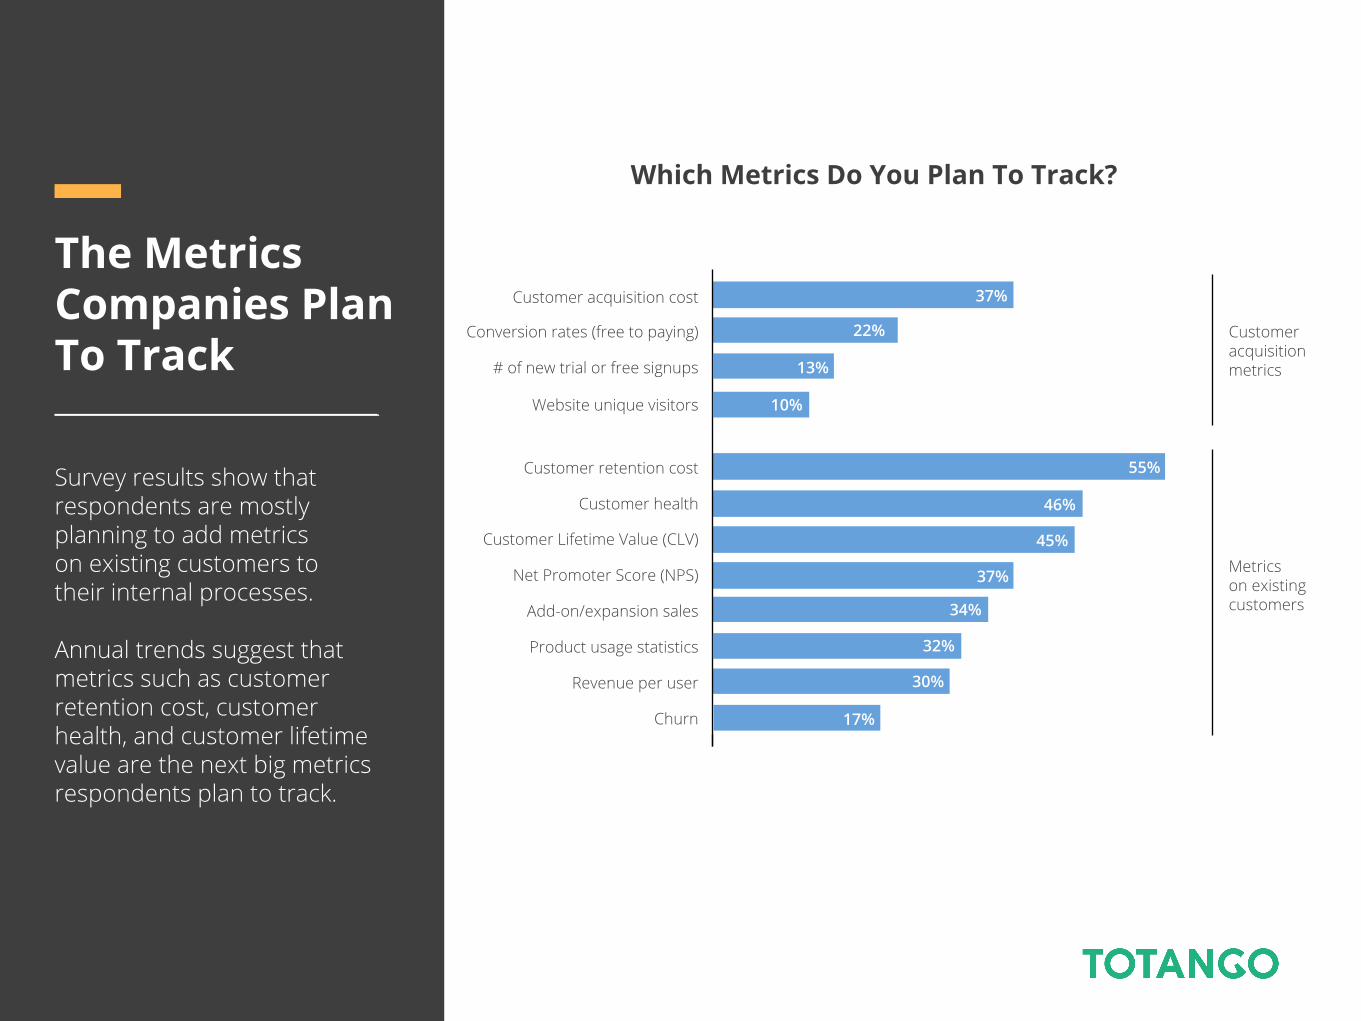
The MetricsCompanies PlanTo Track
Survey results show thatrespondents are mostly planning to add metricson existing customers to their internal processes.
Annual trends suggest thatmetrics such as customer retention cost, customer health, and customer lifetimevalue are the next big metricsrespondents plan to track.
Which Metrics Do You Plan To Track?
Customer acquisition cost
Conversion rates (free to paying)
# of new trial or free signups
Website unique visitors
Customer retention cost
Customer health
Customer Lifetime Value (CLV)
Net Promoter Score (NPS)
Add-on/expansion sales
Product usage statistics
Revenue per user
Churn 17%
32%
30%
34%
10%
Customeracquisitionmetrics
Metricson existingcustomers
13%
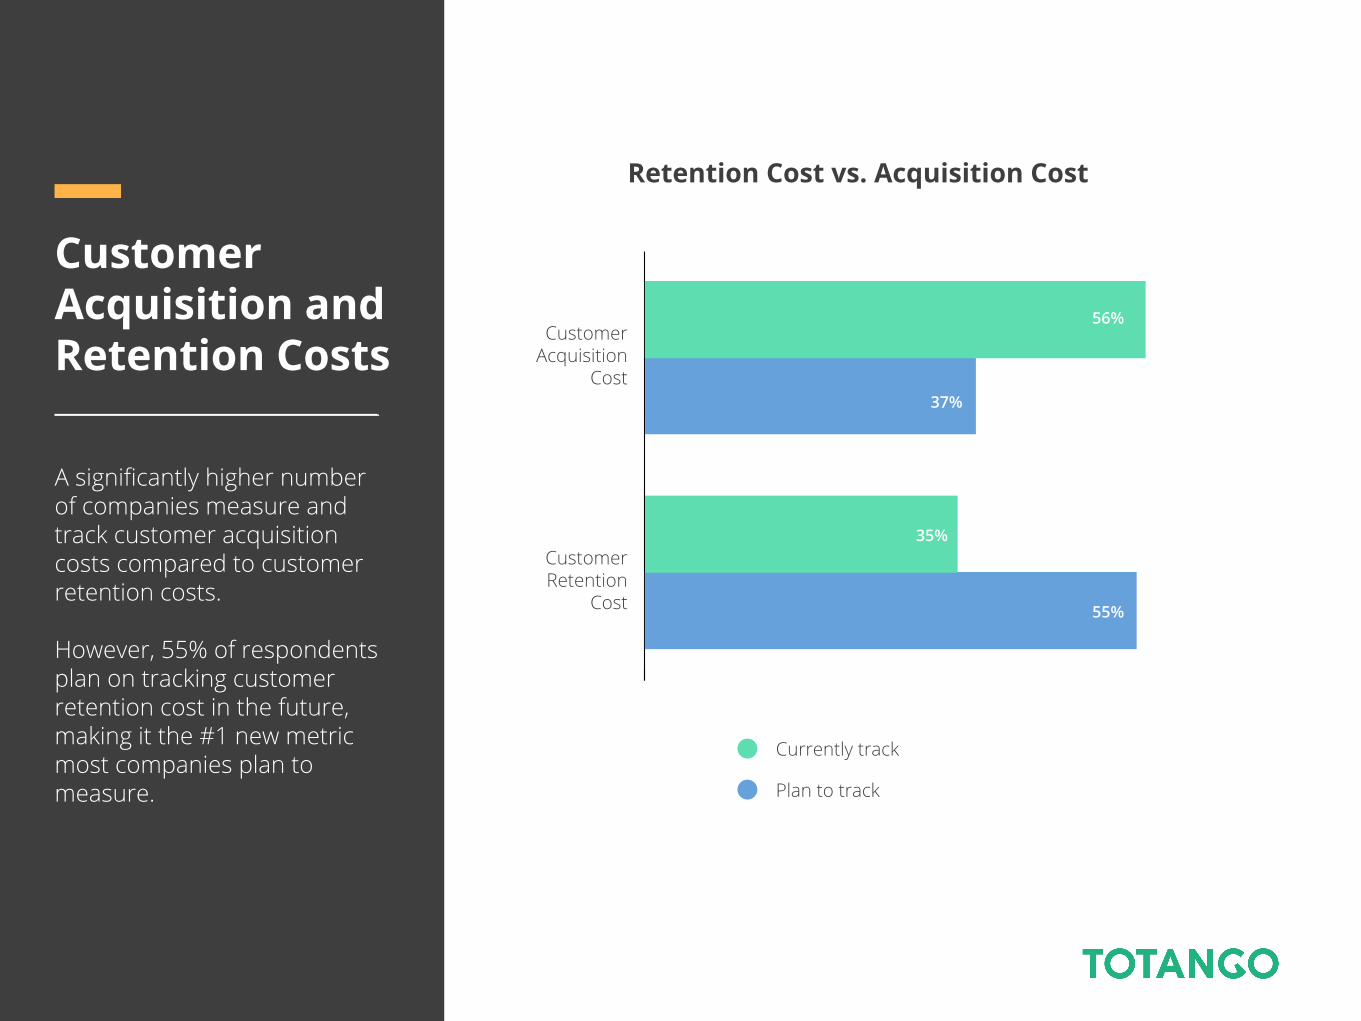
CustomerAcquisition andRetention Costs
A significantly higher numberof companies measure and track customer acquisition costs compared to customerretention costs.
However, 55% of respondentsplan on tracking customer retention cost in the future,making it the #1 new metricmost companies plan tomeasure.
Retention Cost vs. Acquisition Cost
CustomerAcquisition
Cost
CustomerRetention
Cost
56%
37%
55%
Currently track
Plan to track
35%
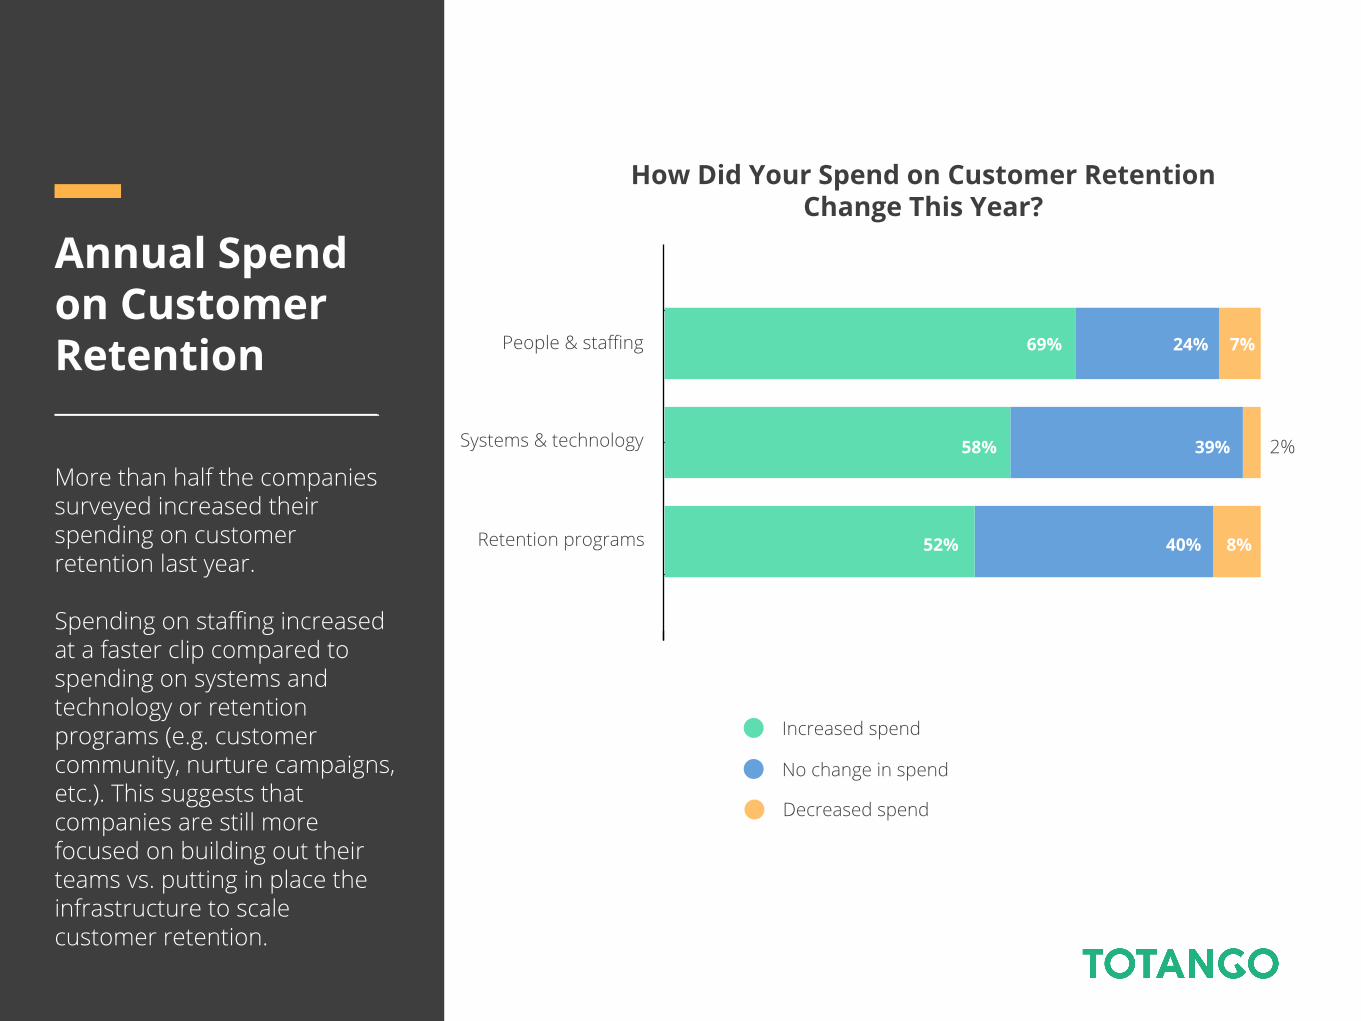
Annual Spendon CustomerRetention
More than half the companiessurveyed increased theirspending on customerretention last year.
Spending on staffing increasedat a faster clip compared tospending on systems andtechnology or retentionprograms (e.g. customercommunity, nurture campaigns,etc.). This suggests thatcompanies are still more focused on building out theirteams vs. putting in place theinfrastructure to scalecustomer retention.
How Did Your Spend on Customer RetentionChange This Year?
Increased spend
No change in spend
Decreased spend
24%69% 7%
39%58%
40%52% 8%
2%
People & staffing
Systems & technology
Retention programs
22%58% 20%
31%46% 23%
39%33% 28%
39%26% 35%
23%21% 56%
39%30% 31%
33%35% 32%
25%47% 28%
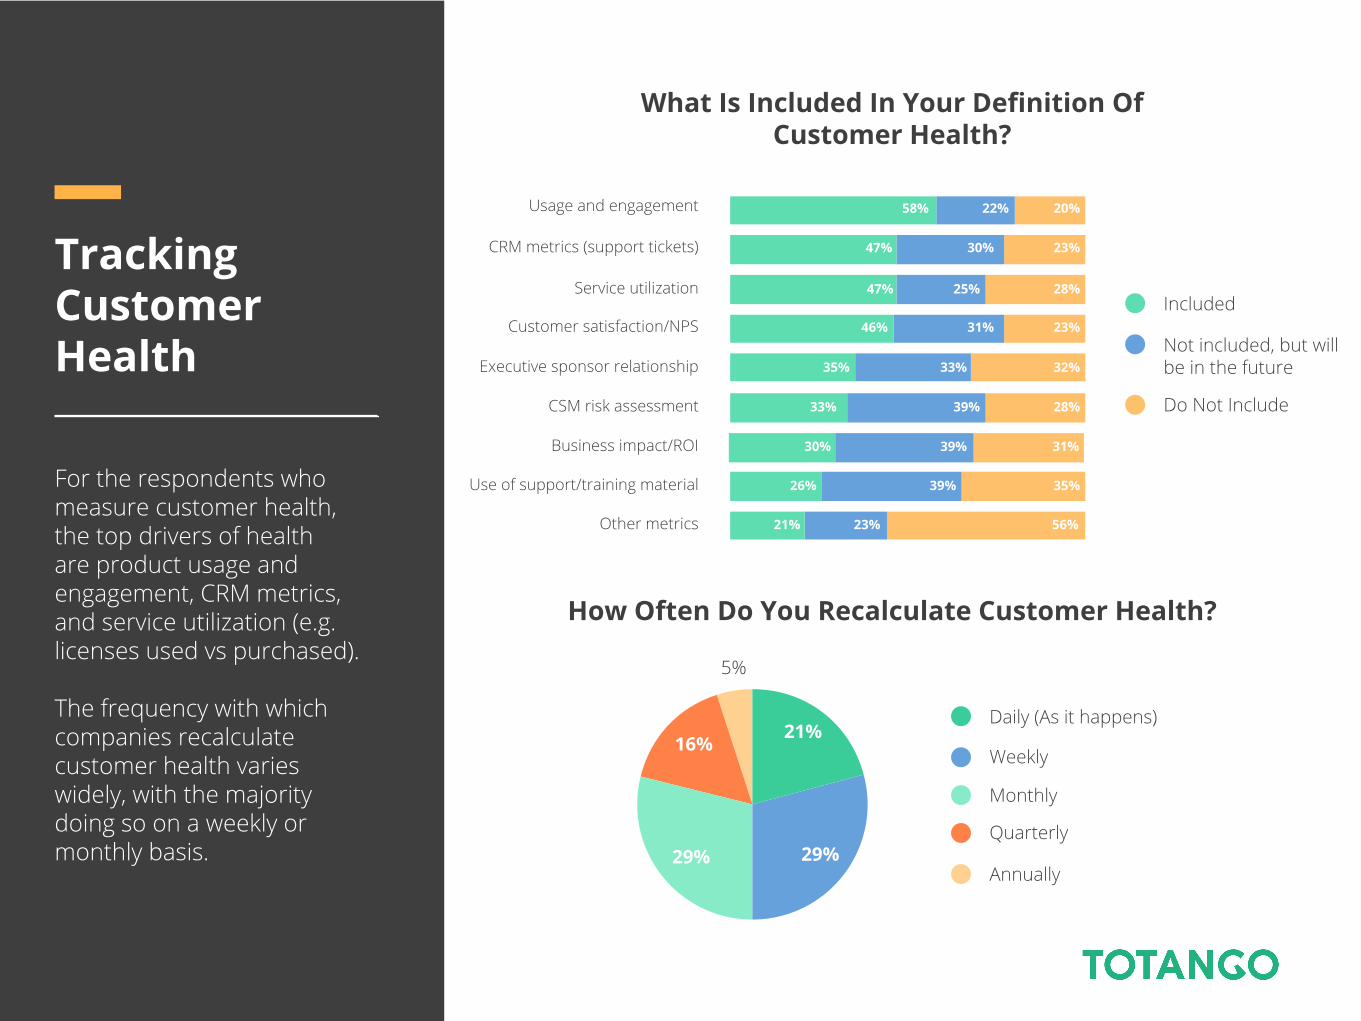
30%47% 23%TrackingCustomer Health
For the respondents whomeasure customer health,the top drivers of healthare product usage and engagement, CRM metrics, and service utilization (e.g. licenses used vs purchased).
The frequency with which companies recalculatecustomer health varieswidely, with the majoritydoing so on a weekly or monthly basis.
What Is Included In Your Definition OfCustomer Health?
Usage and engagement
CRM metrics (support tickets)
Service utilization
Customer satisfaction/NPS
Executive sponsor relationship
CSM risk assessment
Business impact/ROI
Use of support/training material
Other metrics
Included
Not included, but will be in the future
Do Not Include
How Often Do You Recalculate Customer Health?
Daily (As it happens)
Weekly
Monthly
Quarterly
Annually
21%
29%
16%
29%
5%
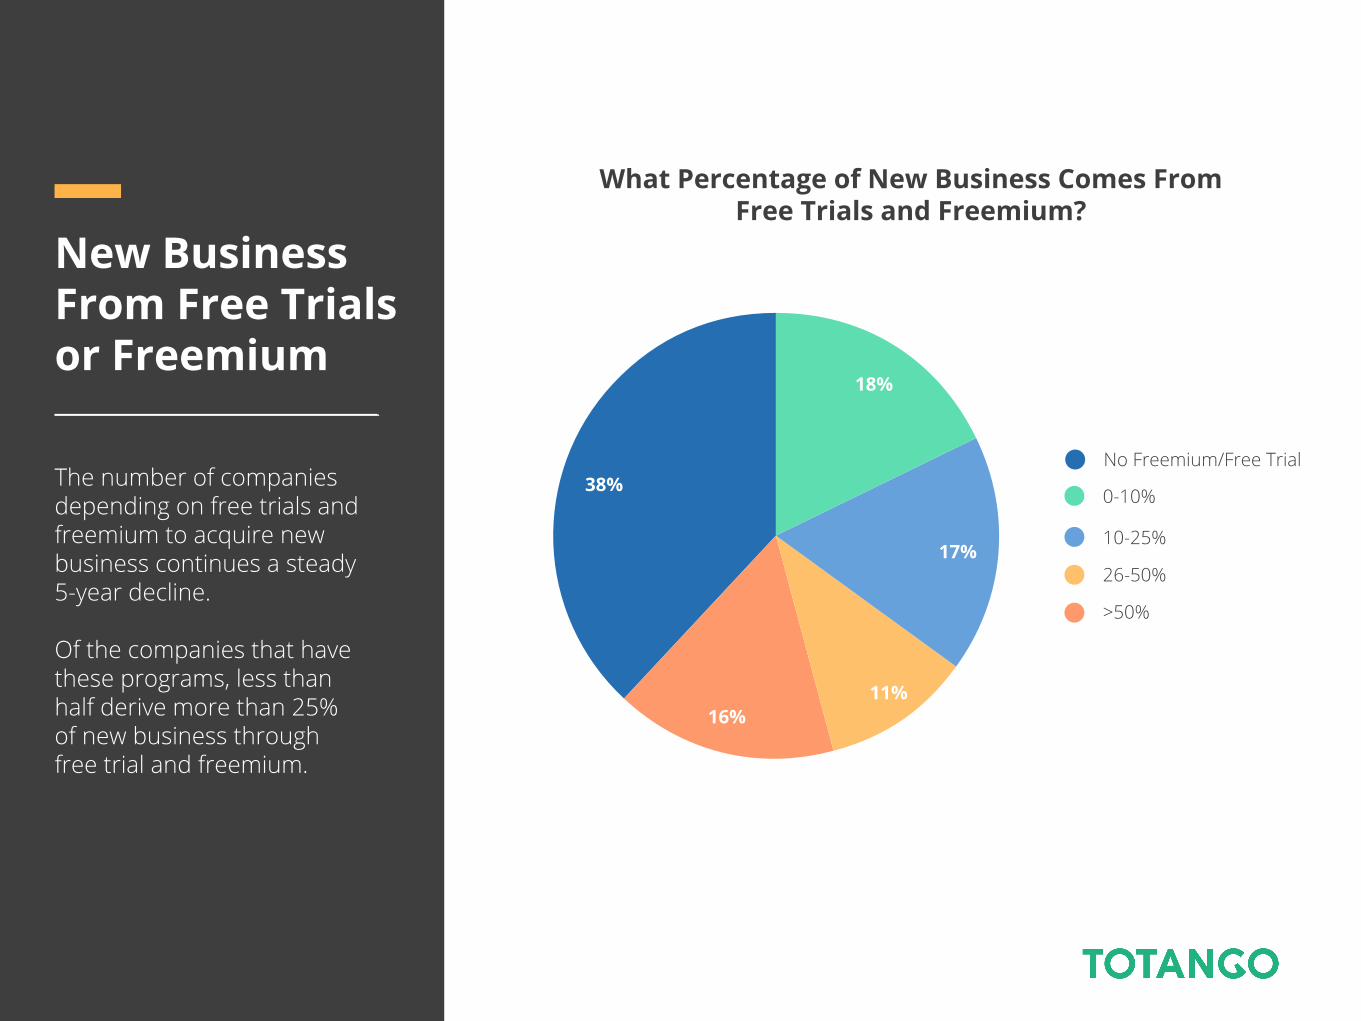
New BusinessFrom Free Trialsor Freemium
The number of companiesdepending on free trials andfreemium to acquire newbusiness continues a steady5-year decline.
Of the companies that havethese programs, less thanhalf derive more than 25%of new business throughfree trial and freemium.
What Percentage of New Business Comes FromFree Trials and Freemium?
17%
16%
38%
18%
11%
0-10%
10-25%
26-50%
>50%
No Freemium/Free Trial
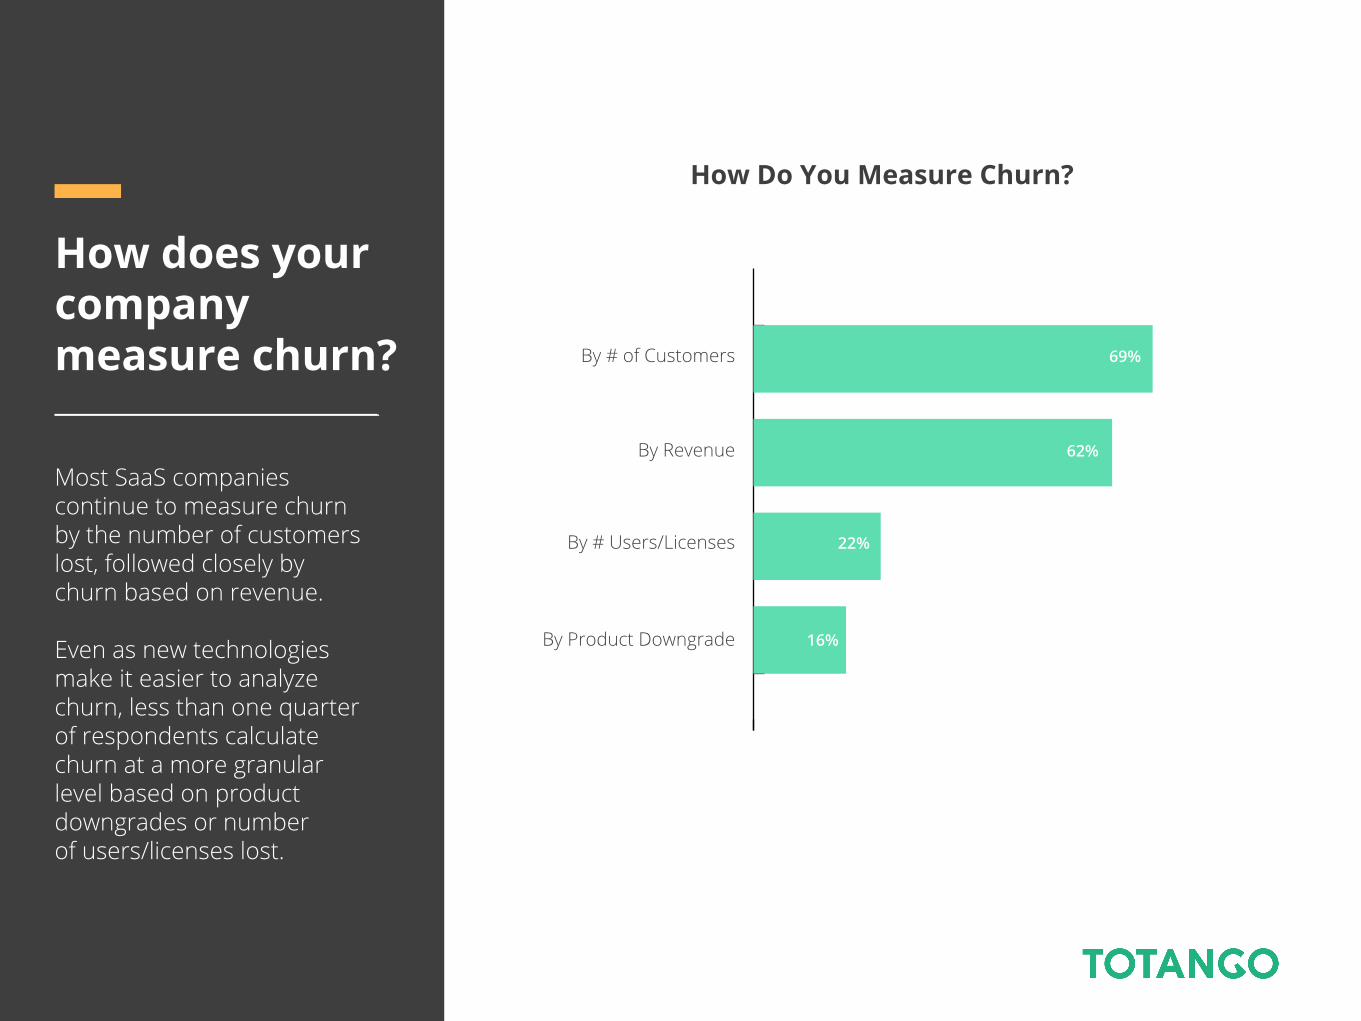
How does yourcompanymeasure churn?
Most SaaS companiescontinue to measure churnby the number of customerslost, followed closely bychurn based on revenue.
Even as new technologiesmake it easier to analyzechurn, less than one quarter of respondents calculatechurn at a more granularlevel based on productdowngrades or numberof users/licenses lost.
How Do You Measure Churn?
By # of Customers
By Revenue
By # Users/Licenses
By Product Downgrade
69%
62%
22%
16%
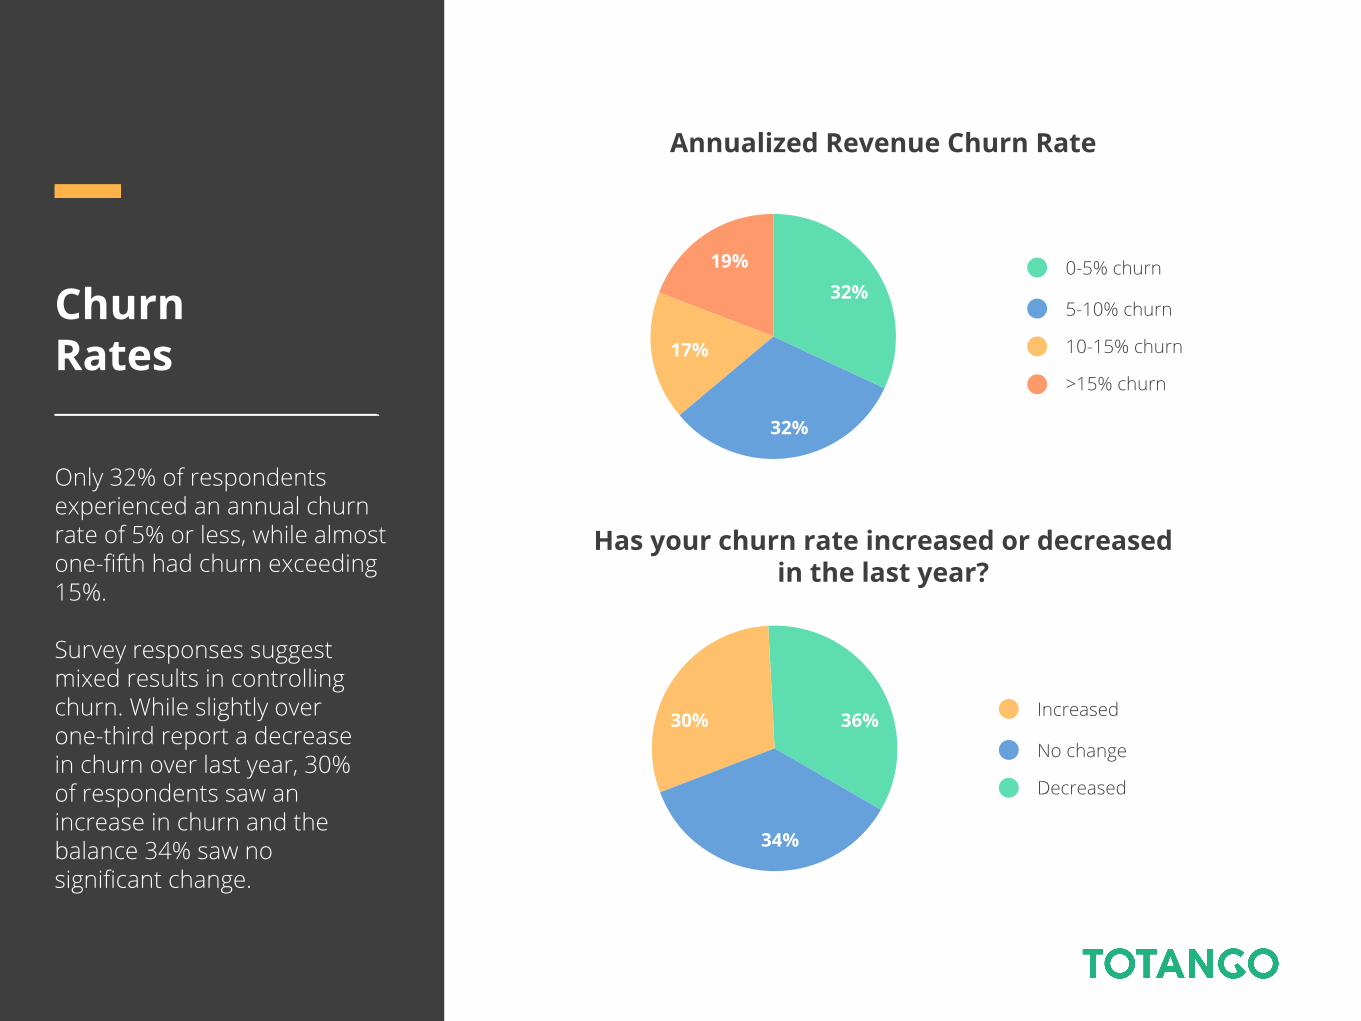
ChurnRates
Only 32% of respondentsexperienced an annual churn rate of 5% or less, while almost one-fifth had churn exceeding 15%.
Survey responses suggestmixed results in controllingchurn. While slightly overone-third report a decreasein churn over last year, 30%of respondents saw anincrease in churn and thebalance 34% saw nosignificant change.
Annualized Revenue Churn Rate
0-5% churn
5-10% churn
10-15% churn
>15% churn
32%
32%
17%
19%
36%
34%
30% Increased
No change
Decreased
Has your churn rate increased or decreasedin the last year?
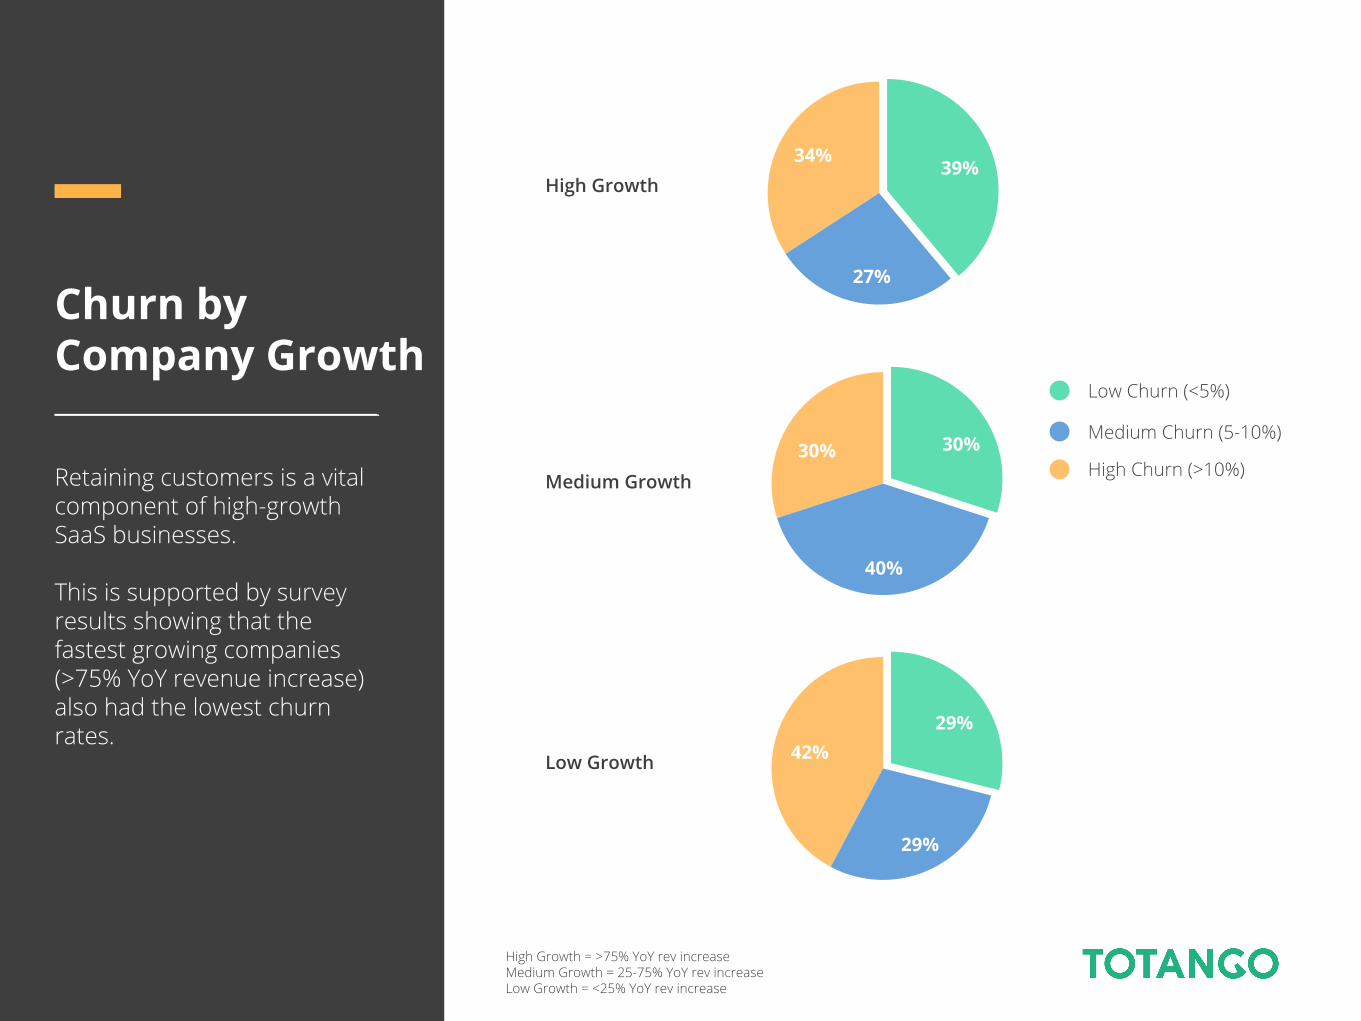
Churn byCompany Growth
Retaining customers is a vitalcomponent of high-growthSaaS businesses.
This is supported by surveyresults showing that thefastest growing companies (>75% YoY revenue increase)also had the lowest churn rates.
Low Churn (<5%)
Medium Churn (5-10%)
High Churn (>10%)
High Growth
Medium Growth
Low Growth
39%
27%
34%
30%
40%
30%
29%
29%
42%
High Growth = >75% YoY rev increaseMedium Growth = 25-75% YoY rev increaseLow Growth = <25% YoY rev increase
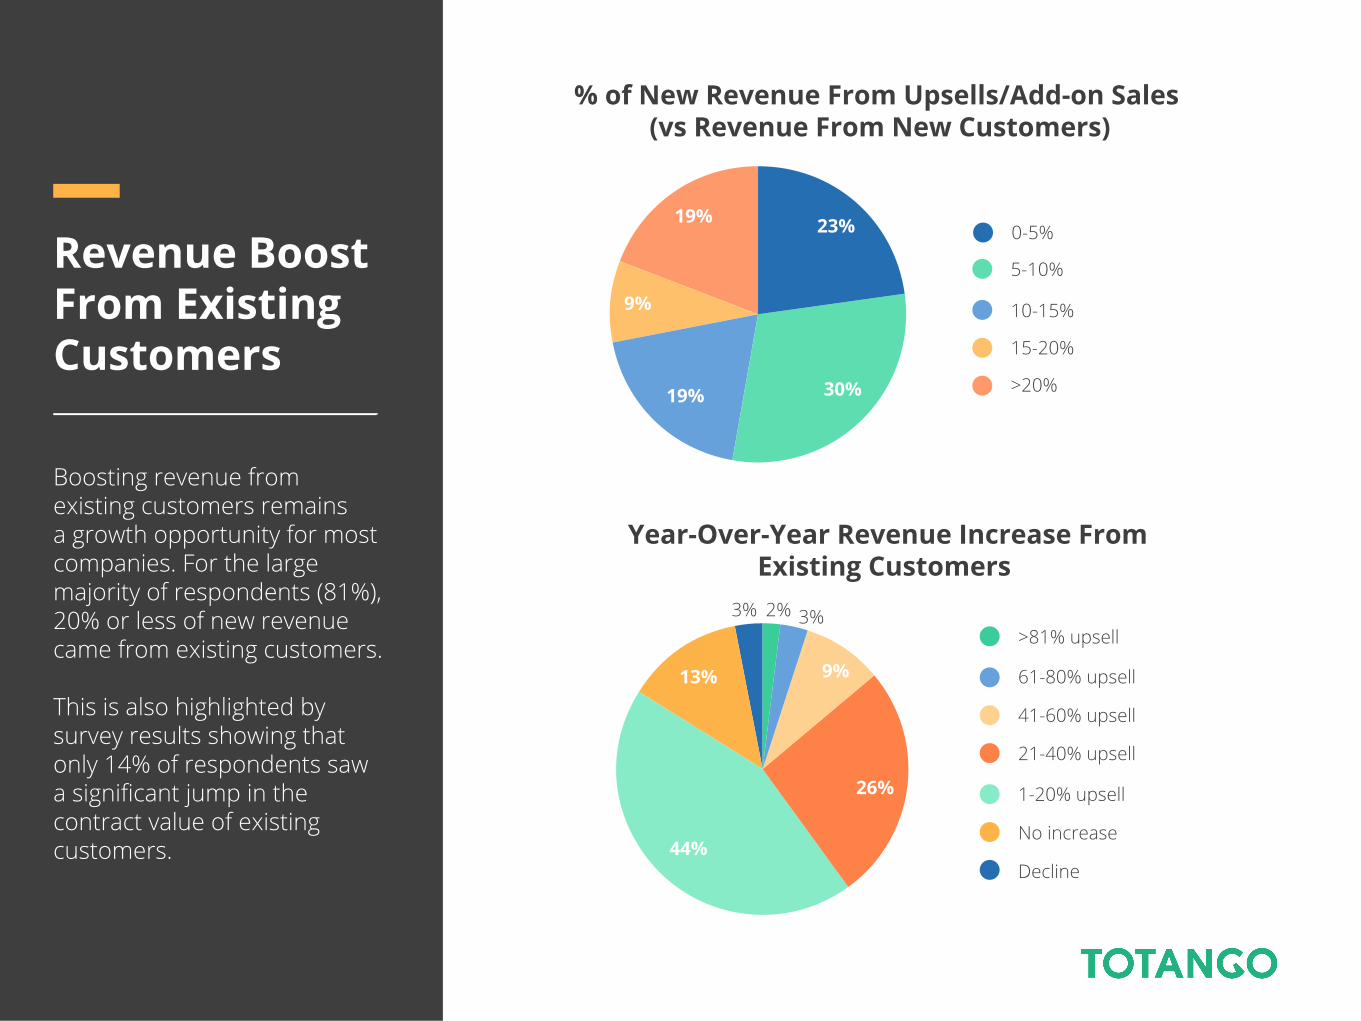
Revenue BoostFrom ExistingCustomers
Boosting revenue fromexisting customers remainsa growth opportunity for mostcompanies. For the largemajority of respondents (81%),20% or less of new revenuecame from existing customers.
This is also highlighted by survey results showing that only 14% of respondents saw a significant jump in the contract value of existing customers.
Year-Over-Year Revenue Increase FromExisting Customers
>81% upsell
61-80% upsell
41-60% upsell
21-40% upsell
1-20% upsell
No increase
Decline
9%
26%
44%
13%
3% 2% 3%
5-10%
10-15%
15-20%
>20%
0-5%
% of New Revenue From Upsells/Add-on Sales (vs Revenue From New Customers)
23%
30%19%
19%
9%
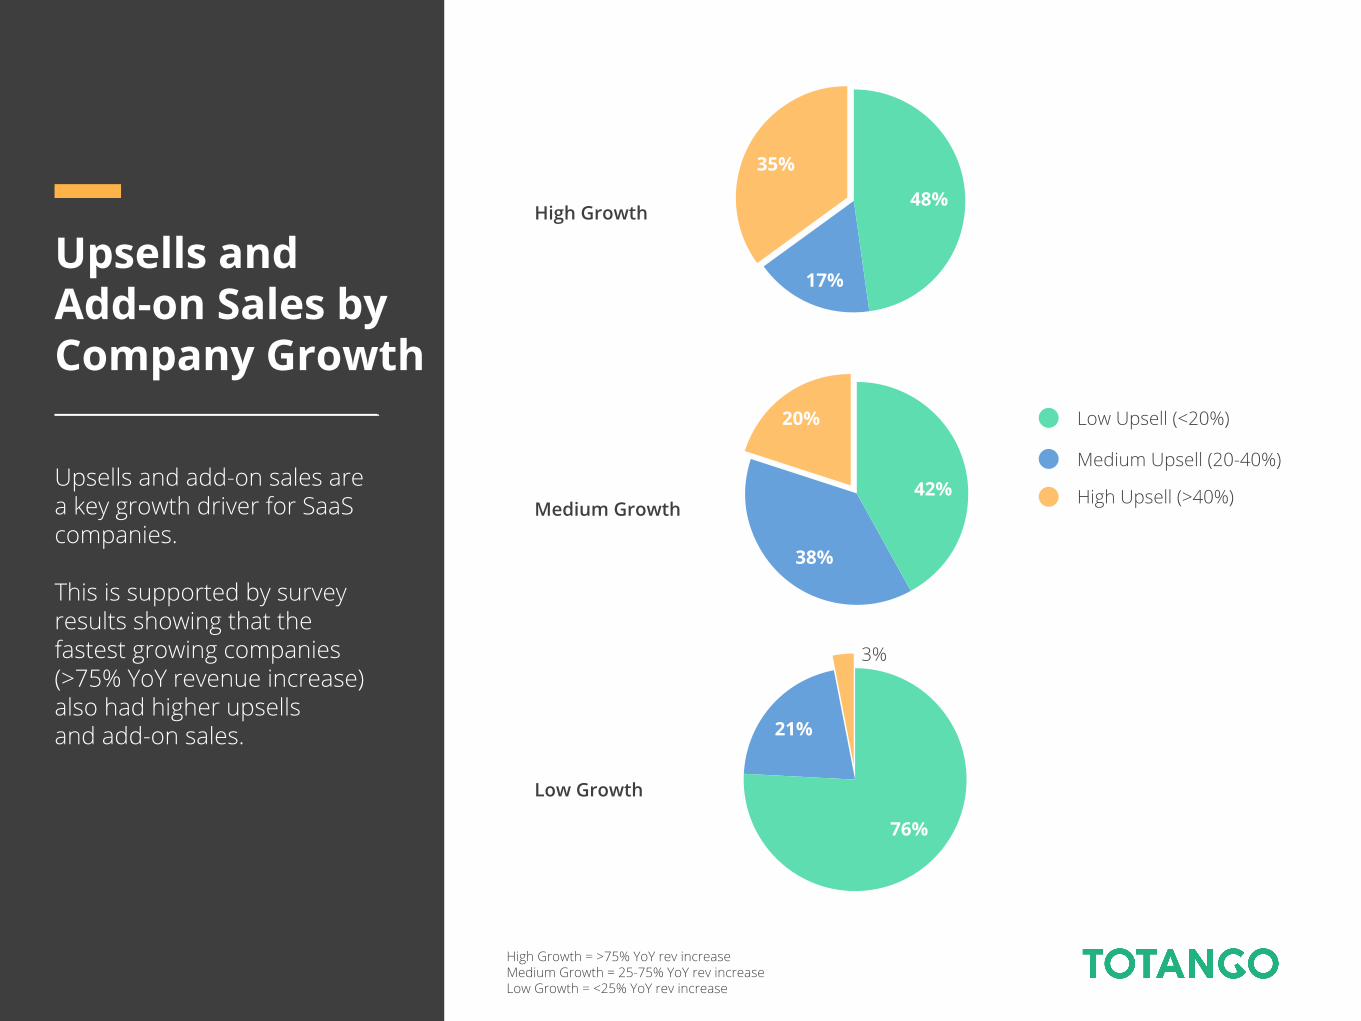
Upsells andAdd-on Sales byCompany Growth
Upsells and add-on sales area key growth driver for SaaScompanies.
This is supported by survey results showing that the fastest growing companies(>75% YoY revenue increase)also had higher upsellsand add-on sales.
Low Upsell (<20%)
Medium Upsell (20-40%)
High Upsell (>40%)
High Growth
Medium Growth
Low Growth
48%
17%
35%
42%
38%
20%
76%
3%
21%
High Growth = >75% YoY rev increaseMedium Growth = 25-75% YoY rev increaseLow Growth = <25% YoY rev increase
Join hundreds of businesses driving customer successwith Totango.
Learn more:
www.totango.com
1-800-634-1990
@Totango