Embed Size (px)
Citation preview

Oracle® Manufacturing Operations Center Release 12.1 August 2010
Structure
1 Overview 2 Setup Steps 3 Administrator Role 4 User Role 5 Manufacturing Operations Center Catalog 6 Plant Manager Dashboard 7 Facilities Manager Dashboard 8 MOC and Oracle Enterprise Asset Management (eAM) Integration 9 Ad hoc Reports A Navigation B Error Management Glossary
Overview of Oracle Manufacturing Operations Center
Oracle Manufacturing Operations Center (MOC) is a prebuilt, flexible, and extensible solution that improves your plant performance by collecting data from disparate plant floor systems, contextualizing them with business context, and provides real-time intelligence on plant floor operations. Oracle Manufacturing Operations Center is the foundation for continuous improvement. Key components of this application include: • A data model based on ISA-95 industry standard and extensible attribute framework. • Pre-built extensible adapters for Oracle EBS. • A robust contextualization rules engine to convert raw shop floor data into meaningful business information. • Pre-built key performance indicators and analytics, delivered in Oracle's industry leading, easy to configure and extend Business Intelligence (BI) technology. • Ability to monitor production performance in real time. Oracle Manufacturing Operations Center provides new capabilities to drive sustainability initiatives. Sustainability Aspect is a generic name used for continuous inputs consumed by companies to be able to operate and create goods or services. Common examples of sustainability aspects are electricity, gas, oil, water, helium etc.
1
The Sustainability Sensor Data Management system of Oracle MOC helps you meet the legislative requirements and social responsibilities to go green and accelerate sustainability improvements of companies focusing on manufacturing, innovation, or services, and enables you to:
• Monitor and analyze energy consumption, energy cost, and carbon emissions with dashboards and built-in key performance indicators (KPIs), leveraged by Oracle Business Intelligence Enterprise Edition (OBIEE) technology. • Integrate with smart meters, environmental management systems. • Build automation systems and collect energy consumption and emissions data. • Identify specific opportunities for improving energy efficiency and reduction in carbon emissions. • Normalize and correlate energy consumption to operating conditions and production variables, and enable energy-aware manufacturing. • Leverage as a certifiable data repository for energy usage reporting based on Global Reporting Initiative (GRI) framework and Green House Gas (GHG) protocol.
Setup Steps
Setting Up Manufacturing Operations Center
The Oracle Manufacturing Operations Center (MOC) setup steps span several Oracle systems including Oracle Business Intelligence Enterprise Edition (OBIEE), Oracle Warehouse Builder (OWB), and the MOC setup pages:
• OBIEE provides analytics from data spanning enterprise sources and applications. • OWB provides data extraction, and transformation and loading from source systems into the MOC environment. • The MOC Administrator role is used to setup Sustainability Aspect, Emission Factors, Tags, Meters, Entity Hierarchy, and setup contextualization methods for business context, and create and associate attribute groups and attribute data entities. It can also be used to create meters, run concurrent program to process meter readings, and use extensible attributes workbench to setup classifications and attributes for user-defined attributes. • The User role is used to view and integrate data collection, and perform analytic reporting. User can use extensible attributes workbench to create attributes and
attribute groups, and associate them with classifications. The following chart lists the setup steps for Oracle Manufacturing Center Operations. Some steps are required, others are optional, depending upon other functions in your environment:
1
1. Source Systems Setup Source system definitions are set up to load data from different source systems.
2. Site Setup Site definitions are set up and mapped to source organizations in different systems.
3. Sustainability Aspect Setup Sustainability Aspect is a generic name used for continuous inputs consumed by companies in order to be able to operate and create goods or services. Common examples of sustainability aspect are electricity, gas, oil, water, helium etc. Sustainability aspects always have associated costs for companies and are often source of harmful emissions to environment. Companies usually monitor consumption of sustainability aspects and make efforts to minimize them for efficiency and environmental concerns. Setting up sustainability aspect refers to defining energy, usage categories, and emissions.
2-2
4. Site Sustainability Setup Setting up sustainability aspect for a site by defining energy sources, planned energy usage, cost, and emission factors. You must perform this setup to populate sustainability aspect for any entity belonging to the site.
5. Time Dimension Setup Define time dimensions including calendars and workday shifts. You can analyze data for different hierarchies for time dimension.
6. Item Dimension Setup Define item dimensions. You can analyze items by different hierarchies. Three item hierarchies are seeded, and any number of hierarchies can be built and analyzed. Item hierarchy supports ten levels.
7. Equipment Dimension Setup Define equipment dimensions. You can build multiple hierarchies for equipment, and these can be rolled up using different hierarchies for reporting. Five seeded hierarchies are provided, and ten hierarchy levels are supported. Any number of equipment hierarchies can be built and analyzed.
8. Data Collection Setup This task involves setting the profile option MTH: System Global Name in the source EBS system for collecting data from E-Business Suite applications master data. This data includes item and item hierarchies, resource and resource hierarchies, and shift definition. Reference data is also collected for production schedules and material produced, item and resource costs, and sale order lines pegged to work orders. Set up Oracle Warehouse Builder to load data using Microsoft Excel templates from other source systems into the MOC staging tables.
3

16. MOC Catalog Setup

1

Administrator Role
Overview of the Administrator Role
The MOC Administrator role is used to setup and maintain master data for the Manufacturing Operations Center application. It is also used to calculate meter readings and sustainability consumption. Following is a brief overview of the tasks under this role:
• Contextualization setup: Used to setup contextualization method for equipment. • Tag setup: Used to associate tags to equipment and MOC entities, and define rules for adding the business context through the contextualization setup. • Sustainability aspect setup: Used to setup sustainability aspect and its corresponding usage categories and emission codes. • Site setup: Used to setup site. • Site sustainability setup: Used to setup the association of site to sustainability aspect and define the sustainability aspect sources and emission factors. • Equipment setup: Used to setup equipments. • Tag equipment mapping setup: Used to associate tags to equipment. • Resource setup: Used to setup resources. • User-defined entities setup: Used to setup user defined entities. • Shift setup: Used to create shift templates and generate shifts for site and its entities. • Hierarchy setup: Used to setup and build hierarchy. • Meter setup: Used to setup meters. 1

Setting Up Tags
A tag is the metadata configured in PLC or other device connector providing data at the program interval. MOC requires specific tags for obtaining the operation details and business context. There are two types of tags. Business context tags provide work order, operation, product, and equipment details. Data tags provide value of output, scrap, rework, quantity, and completed quantity.
Tag metadata is imported into MOC through Oracle Warehouse Builder mapping by loading data from the comma-separated values (csv) templates.
To define tag data information:
1. Navigate to the Tag Setup page. If you have already imported the tag metadata
using the csv template, then they display on this page.
2. To add a new Tag Data Source, Click Add Source. 3. Enter the name of the new tag data source in the Tag Data Source field.
4. Select the Type of the tag. Options are Operation and Sustainability. 5. Select the System for the tag. The list of Source Systems that you set up while setting up the MOC application display in the list of values for this field. Refer to the "Setting Up Source Systems" chapter of the Oracle Manufacturing Operations Systems Implementation Guide for more information. 6. Save your work. To add tags to a tag data source:
1. Select a Tag Data Source to which you want to add tags. 2. Click Add. 3. Enter the following information for a tag: • Tag Code is the code for the tag. • Tag is the name of the tag. • Description is a brief description of the tag. 4. Select the Data Type for the tag. Options are Alphanumeric and Numeric. Numeric displays by default. 5. Select the Reading Type for the tag. Options are Cumulative and Incremental. Cumulative displays by default. 6. Select the Order in which the readings for the tag are recorded. Options are Ascending and Descending. This field is enabled only if you select Cumulative as 3

the Reading Type. If you select Cumulative as the Reading Type, then Ascending displays by default.
7. Enter a Reset Value. Reset Value is the value at which the tag reading recording must be reset. This field is enabled only if you select Cumulative as the Reading Type. 8. Enter an Initial Value. Initial Value is the starting value that you expect to receive from a tag meter recording. This field is enabled only if you select Cumulative as the Reading Type. Zero is the default value. 9. Enter a Reading Interval (in minutes) as the time interval at which the tag readings must be recorded. You can enter a reading interval only for a tag of the sustainability type tag data source. 10. Status displays as Active by default. To inactive a tag, click Inactivate. 11. Click Save. Note: A tag can be associated to an equipment record only once, but can be associated to multiple equipment.
To update a tag:
1. Select a tag. 2. Click Update. Edit the following fields: • Tag • Description • Reading Type • Order. This field is enabled for a Cumulative reading type tag only. • Reset Value. This field is enabled for a Cumulative reading type tag only. 3-4
• Initial Value. This field is enabled for a Cumulative reading type tag only. • Reading Interval. This field is enabled for Incremental reading type tag of a Sustainability type tag data source. 3. Click Save. Mapping Tags to Equipment
Oracle Manufacturing Operations Center enables you to map tags to equipment using the Tag Mapping page. You map a separate tag for each equipment output.
To map tags to equipment:
1. Navigate to the Tag Mapping page. 2. Select the Site Name. All the Sites defined in the MOC application display in the list of values (LOV). 3. Select Equipment Name of the equipment to which you want to map tags. 4. Click Go. If tags are already mapped to the selected equipment, then they display. 5. Click Add to map a tag. 6. Enter the Tag Code that you want to map to the equipment. All the tags in the Tag Master display in the LOV. This is a required field. 7. Optionally, enter a Data Element for the tag. 8. Optionally, enter Attribute Group Name and Attribute Name. You can choose from a list of attribute groups and attributes that you define using the Extensible Attributes page as part of setting up the MOC application. Refer to the topic " Setting Up Extensible Attributes" chapter of the Oracle Manufacturing Operations Implementation Guide for more information. 9. Click Submit. 5

Note: You can associate a tag to either to an entity or an attribute belonging to an attribute group. MOC does not allow an association to both an entity and attribute.
Running the MTH: Process and Populate MOC Entity Sustainability Aspect
Run the MTH: Process and Populate MOC Entity Sustainability Aspect to calculate the carbon emission and electricity usage costs for an entity. When you run the concurrent program the data obtained from the meter readings is processed to calculate the sustainability aspect consumed, the cost of and the carbon emission due to the consumption.
To run the MTH: Process and Populate MOC Entity Sustainability Aspect
1. Navigate to the Parameters window. 2. Enter the Process Mode as: • INIT to run the process in Initial mode. • INCR to run the process in Incremental mode. 3. Enter the Meter Calculation Start Date. 4. Click Submit. 5. Note the Request ID number. 6. Choose View from the menu and select Requests to view the status of your request in the concurrent program manager. 7. When your request ID is complete with a Status of Normal, click View Details to view the details of the run. Creating Equipment Contextualization Information
Contextualization is the ability to take highly granular tag data collected from shop floor transactions and convert it into meaningful business data for analyzing. The contextualization rules engine enables users with various levels of sophistication on the shop floor to add the business context to the data tags. There are two tag types used:
• Business Context Tags–tags that provide work order, operation, product, and
equipment details. 3-6

• Data Tags–tags that provide value of output quantity, scrap quantity, rework quantity, reject quantity, completed quantity, equipment status, and attribute tags. The Equipment Contextualization page is used to associate a contextualization method for equipment and to define the mandatory or optional context for the business related to that equipment. The following three methods are used to add the business context:
Tag Based Contextualization
Business context such as work order, operation, and item is derived from the tags that are configured in the PLC for that equipment from the shop floor. The business context tags and the data tags are received into MOC with using the same group identifier for this type of contextualization.
Schedule Based Contextualization
Business context is derived from the equipment production schedule. If this contextualization method is selected, MOC uses the data tags from the equipment to select business context of:
• Work order and operation from the equipment production schedule • Product from production material produced • Equipment based on the setup of the tag to equipment association is done • Shift based on the reading time Manual Contextualization
Context is determined through data entered manually and is not derived from the Manufacturing Operations Center hub. The Manual Contextualization page on the Tag Data Workbench under the User role enables you to manually enter and edit context for all active tags that have not been summarized in the Equipment Summary tables.
To select equipment for contextualization:
1. Navigate to the Equipment Contextualization Setup page. 2.
Select a value in the Plant field. 3. In the Equipment field, select a specific record and then select Go. You can also leave the field null and select Go to display all the equipment records for the plant. The results table displays all the equipment associated to this plant record.
7
4. To edit equipment contextualization values, select equipment records and select a Contextualization Method. Choices are: • Tag Based—context is determined through tag readings of the equipment. • Schedule Based—context is determined through schedule data in the Equipment Production Schedules table. • Manual—context is determined through data entered manually. 5. In the Workorder field, indicate whether a business context is Mandatory or Optional for the selected equipment. Workorder context is determined from either the tag or the equipment production schedule.
6. In the Workorder Segment field, indicate whether a business context is Mandatory or Optional for the selected equipment. 7. In the Item field, indicate whether a business context is Mandatory or Optional for the selected equipment. 3-8
8. Save your work. To change multiple records using the same contextulization rule:
1. Select equipment records to create similar contextualization rules. 2. Select Enter Context in Batch to display the Batch Equipment Contextualization Update page. 3. Select the appropriate values in the following fields for the batch update: • Contextualization Method • Workorder • Workorder Segment • Item 4. Select Enter in Batch to return to the Equipment Contextualization Setup page. 5. Save your work to create the batch update for the selected records. Related Topics
Setting Up Tags, page 3-2
Adding Reason Codes
You can use tags to display reasons for downtime status and scrap quantity. You can define a list of all reason codes and reason meanings for Manufacturing Operations Center (MOC) plants, at the Instance level in FND_LOOKUPS, and equipment level in the Equipment Reason Setup user interface. In the Tag Mapping setup for the reason tag, map the tag to a data element (Equipment Downtime Reason and Scrap Reason).
You can set up Reason Codes using FND Lookup. Lookup types seeded by Manufacturing Operations Center include:
9
• MTH_SCRAP_REASON (for setting up scrap reasons) • MTH_EQUIP_DOWNTIME_REASON (for setting up downtime reason) Add reason codes in the Application Object Library Lookups window from the Development Manager responsibility. You can also set up reason codes using the Lookups menu from the MOC Administrator's responsibility.
To add reason codes:
1. Navigate to the Application Object Library Lookups window. 2. In the Type field, query by example MTH_SCRAP_REASON, MTH_EQUIP_DOWNTIME_REASON, or MTH_EQUIP_IDLE_REASON. The window displays all Reason Codes associated with these types. 3. Click a new (empty) row to add a new code. 4. Enter a Code. 5. Enter a Meaning for the code. 6. Enter an optional Description. 7. Enter an Effective date range. The From date defaults to the current date. 8. The Enabled indicator defaults to Enabled. 3-10
Setting Up Equipment Reason Codes
You must add equipment reason codes prior to adding events. Reason codes define the Equipment Down event types with associated reasons.
Equipment can be down and unavailable due to planned preventive maintenance activities. MOC updates the equipment shift for each equipment item, taking into account planned downtime.
MOC captures the expected uptime for each equipment item when the equipment is down due to unplanned downtime, or when equipment is idle. The application helps to identify equipment availability for production.
To set up equipment reason codes:
1. Navigate to the Equipment Reason Code Setup page. Use the Equipment Reason Code Setup page to set up equipment downtime reason codes. You can define the following reasons for equipment: • Downtime Reasons and Expected Uptime • Idle Time Reasons and Expected Uptime
• Scrap Reasons 2. Select an Equipment Hierarchy from the List of Values (LOV). 3. Select a Level Name from the LOV.. 4. Select a Level Instance. 5. You can optionally select an Equipment Criticality value from the LOV. 6. Click Go to perform your search. Based on the search criteria, the page displays the Level Instance and equipment for the selected Level in the Equipment Hierarchy. 7. Select one or more equipment rows and click the Update Sequentially button to navigate to the Update Equipment Reason Code Sequentially page. You can add Downtime reasons, Idle Time reason, and Scrap reasons for your equipment. You can also define Expected Uptime for each Downtime and Idle Time reason code. To add or update equipment reason code sequentially:
1. From the Update Equipment Reason Code Sequentially page, select the Downtime tab to add or update equipment downtime reason codes and expected uptime. 3-12

2. Enter a Downtime Reason Code, or select a code from the search page. 3. Enter a value for Expected Uptime (Hours). 4. Click the Next button to enter Downtime reasons for the next equipment item that you selected, or click Apply to save your work. 5. Select the Idle Time tab to enter equipment idle time reason and expected uptime. 6. Enter an idle time Reason Code, or select a code from the search page. 7. Enter a value for Expected Uptime (Hours). 8. Click the Next button to enter Idle Time reasons for the next equipment item that you selected, or click Apply to save your work. 9. Select the Scrap tab to enter equipment scrap reasons. 13
10. Click Add to enter a new scrap reason. 11. Enter a Reason Code, or select a code from the search page. 12. Click the Next button to enter Scrap reasons for the next equipment item that you selected, or click Apply to save your work. Setting Up Events
Oracle Manufacturing Operations Center (MOC) provides a workbench to generate and process events based on event types. The events are created based on Oracle Warehouse Builder pluggable mapping, and is defined as an event type. Based on the event type, action is taken by PL/SQL.
MOC supports collection of data from external OPC systems, and by using Event Management Framework, the application routes events and takes appropriate actions.
Update Equipment Event Action Sequentially Page
Use this page to add and update Event Types and Event Actions. You can also add notifications when events occur. You can add and update event types and actions for equipment items in order of selection from the Events Setup page. You can also view event actions previously added for equipment items (rows).
To set up events:
1. Navigate to the Event Setup page. Use the Event Setup page to set up event actions for event types. You can select the following actions against an event type by equipment items: • Seeded action such as creating work requests in eAM • Calling custom APIs or PL/SQL scripts • Sending e-mail notifications 3-14
• Sending mobile alerts 2. Select an Equipment Hierarchy from the List of Values (LOV). 3. Select a Level Name from the LOV. 4. Select a Level Instance. 5. You can optionally select an Equipment Criticality value from the LOV. 6. Click the Go button to perform your search. Based on the search criteria, the page displays the Level Instance and equipment for the selected Level in the Equipment Hierarchy. 7. Select one or more equipment rows and click the Update Sequentially button to navigate to the Update Equipment Event Action Sequentially. You can add or update event actions for each equipment row selected. To add or update equipment event actions:
1. From the Update Equipment Event Action Sequentially page, click the Add button in the Event Types region to add a new Event Type. If an event action was previously defined for an event type and you return to this page, then the earlier definition appears and you can modify the actions, if required. 15
2. Select an Event Type from the LOV. 3. Select a Reason Code from the LOV (if applicable.) The Reason Code LOV is enabled only for the Equipment Down event type. 4. Click the Add button to add Event Types. 5. Select the Event Action tab. The Seeded Actions region appears. 6. Click the Add button to add a seeded event action. 7. Select a seeded Event Action from the LOV. 8. Select the Name and the appropriate indicators for the notification method. 9. Click the Add button in the Custom Actions region to add custom event actions 10. Select the Notification tab to add event notifications. 3-16
11. Click the Add button to add new notifications. 12. Enter notification details for the selected event. 13. Click Finish to save your work. 14. Click the Next button to add event actions for the next equipment item that you selected, or click Finish to save your work. Setting Up Extensible Attributes for MOC Entities
Oracle Manufacturing Operations Center supports an extensible attributes framework to capture specific attributes for manufacturing entities. The extensible attributes framework helps in setting up and capturing parameters that are unique for your business environment, plant, equipment, items, work orders, batch operations and user-defined entities. The extensible attributes setup consists of the following steps:
• Setting up profile options for item and equipment entity classifications • Defining classifications for Others entity type • Creating attribute groups • Creating attributes • Associating attribute groups to classifications • Creating attribute pages 17
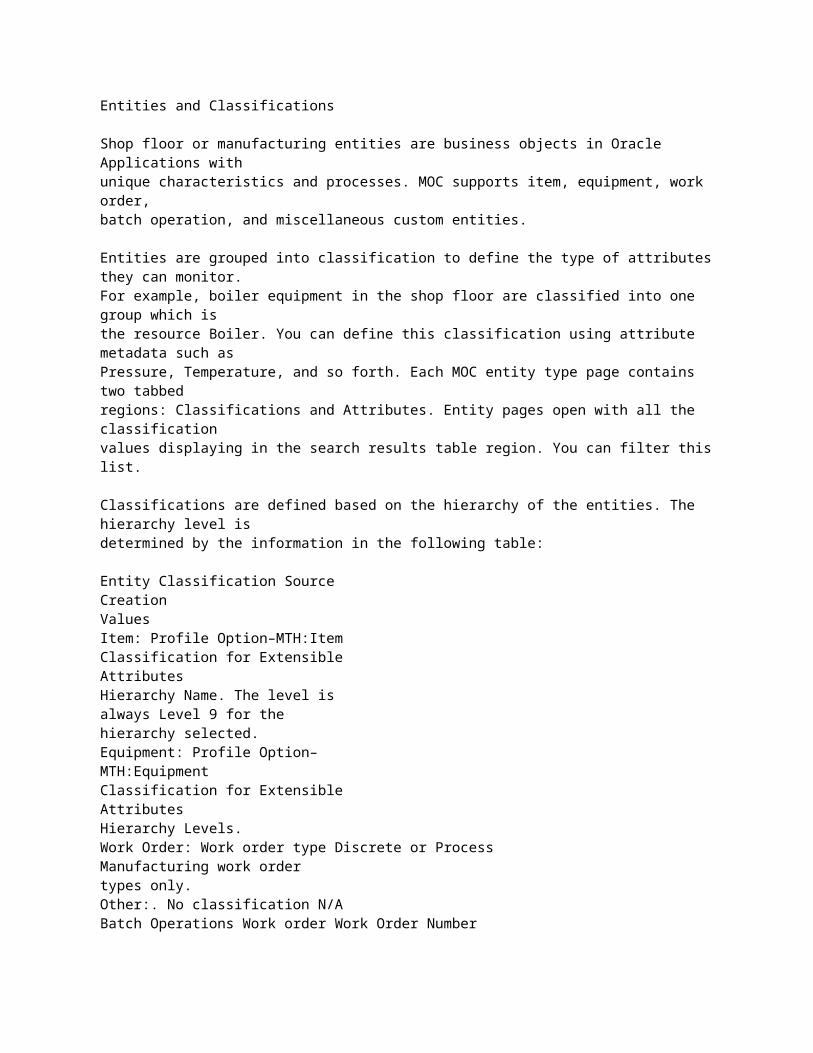
Entities and Classifications
Shop floor or manufacturing entities are business objects in Oracle Applications with unique characteristics and processes. MOC supports item, equipment, work order, batch operation, and miscellaneous custom entities.
Entities are grouped into classification to define the type of attributes they can monitor. For example, boiler equipment in the shop floor are classified into one group which is the resource Boiler. You can define this classification using attribute metadata such as Pressure, Temperature, and so forth. Each MOC entity type page contains two tabbed regions: Classifications and Attributes. Entity pages open with all the classification values displaying in the search results table region. You can filter this list.
Classifications are defined based on the hierarchy of the entities. The hierarchy level is determined by the information in the following table:
Entity Classification Source Creation Values Item: Profile Option–MTH:Item Classification for Extensible Attributes Hierarchy Name. The level is always Level 9 for the hierarchy selected. Equipment: Profile Option– MTH:Equipment Classification for Extensible Attributes Hierarchy Levels. Work Order: Work order type Discrete or Process Manufacturing work order types only. Other:. No classification N/A Batch Operations Work order Work Order Number
Attributes and Attribute Groups
Attribute groups are a grouping of similar attributes used to monitor an entity. For example, Specifications is a seeded attribute group for the Equipment entity containing the attributes Parameter, Upper Control Limit, and Lower Control Limit. Oracle

Product Information Management functionality is used for attribute creation.
Similar attributes can be categorized in an attribute group, such as a collection of items similar in type or function. You can:
• Group attributes based on business functions 3-18
Viewing Classifications for Shop Floor Entities
Manufacturing Operation Center entities are grouped into classifications, and associated to attributes that define specific characteristics for items in your organization. MOC supports item, equipment, work order, user-defined entities, batch operation, and other miscellaneous entities:
• Equipment classifications can designate the machine or plant location where manufacturing activity is performed on the shop floor. • Item entity classifications can be group by categories such as product or line type, ABC classes, or cost structure. • Other entity classifications are created on the Extensible Attributes Workbench per your requirements for miscellaneous categories in your organization. • Work Order classifications designate Work in Process work order types, choices are discrete or process types. To view entity classifications:
1. Navigate to the specific Entity page. MOC provides Entity: Batch Operation, Entity: Equipment, Entity: Item, Entity:
Others, Entity: User Defined and Entity: Work Order.

There are two tabbed regions: Classifications and Attributes. The page opens with all the classification values displaying in the search results table region. Classifications are created in several different areas depending on the entity type,
You can filter your list by entering a value in the Classification field and selecting Go.
2. Select a value link in the Classification column to navigate to the Classifications Details page. This page displays the following values in the Basic Information and Other Details regions:
• Classification—name for this grouping • Entity—type of entity • Classification Code This page enables you to navigate to associated attribute groups and attribute pages for this item classification.
3-20
To create and update Others entity classifications:
1. Navigate to the Entity: Others page. The page opens with all the Classification values displaying in the search results table region.
2. Select Create to create a new classification record. 3. On the Create Classification page— enter values in the Name and, optionally, Description fields. 21
Viewing and Creating Attribute Group Data for Entities
Manufacturing Operation Center Equipment entities are associated to attributes that capture specific characteristics for functional areas in your organization. Similar attributes can be categorized in an attribute group, and you can define an unlimited number of attribute groups that fit your business environment.
To view all attribute groups created for specific entities:
1. In the specific Entity page, select the Attributes tabbed region. This includes the Entity: Batch Operation, Entity: Equipment, Entity: Item, Entity: Others, Entity: User Defined, and Entity: Work Order pages.
All the existing attribute groups for the specific entity type selected appear in the results table.
You can filter the display by using a combination of values and conditional qualifiers in the following fields: Attribute Group Display, Attribute Group Description, Attribute Group Descriptions, Behavior, Business Entity, Database View, and Internal Name.
This page enables you to select:
• A record link in the Display Name column to navigate to the Attribute Group Details page • Create to navigate to the Create Attribute Group for Equipments page • Copy to create a new attribute group using information in an existing record To view and add attribute groups to a shop floor entity:
1. On the specific Entity Classification Details page, select Attribute Groups to display the Attribute Groups for an entity page. All attribute groups associated to this equipment entity appear.
You can filter the results by using values for Display Name or Description. This page enables you to:
• Navigate to the Attribute Group Details page. Select an attribute group value link. 23
• Add attribute groups to this specific entity. 2. Select Add Attribute Groups to associate attribute groups to the entity selected. Depending on the entity is selected, the following pages appear: • Add Attribute Groups for Batch Operation • Add Attribute Groups for Equipment • Add Attribute Groups for Item • Add Attribute Groups for Others • Add Attribute Groups for User Defined Entities • Add Attribute Groups for Work Order On the Add Attribute Groups page you can filter the display by using a combination of Attribute Group Type, Behavior, Display Name, Description, and Internal Name.
3-24
Viewing and Creating Attribute Pages for Entities
Attribute pages can be created for each entity for ease of use in data entry and viewing. You can assign multiple attribute pages to a specific entity attribute group. For each page, you can choose the attributes displayed and the specific order listed.
To view and create Attribute Group Pages:
1. Select Pages to display attribute pages created for this entity classification. This includes Batch Operation Pages, Equipment Pages, Items Pages, Others Pages, User Defined pages, and Work Order Pages.
The attribute group pages for the specific entity selected appear in the results table. You can search records on the entity Pages by Display Name or Description.
2. Select Create to create a new page for this entity. The Add Pages for the select entity type appears. 3-26
3. Enter the following data in the Basic Information region: • Display Name—name displayed on the page. • Description—a description of the attribute category. • Internal Name—internal name for the page, this value cannot be updated once a page has been created. • Sequence—sequence number for each page associated with an attribute group, the sequence number determines the order pages are listed. 4. In the Attribute Groups region, select Add Another Row to add attributes groups to this page. To add an existing attribute group: • Enter a Sequence number • Select an existing Display Name value 5. Select Apply to save your work. The attributes for this entity, and the display sequence appear in the Pages region. 27

Related Topics
Setting Up Extensible Attributes for MOC Entities, page 3-17 Viewing Classifications for Shop Floor Entities, page 3-19 Viewing and Creating Attribute Group Data for Entities, page 3-22
3-28
User Role
Overview of the User Role
The Manufacturing Operations Center (MOC) User role is used to integrate shop floor devices in manufacturing plants to the Manufacturing Operations Center for the purpose of data collection and reporting. The MOC User role consists of three functional areas - Tag Data Workbench, Extensible Attributes Data, and Manufacturing Operations Center Analytics.
• Tag Data Workbench includes: 1. Manual Contextualization page - use this page to view or update business context for data that has the context method as Manual Contextualization. 2. Equipment Downtime Reason page - use this page to provide Downtime Reasons for the downtime event. 3. Equipment Scrap Reasons page - use this page to provide scrap reasons for the scrap event. • Extensible Attributes Data - used to view and add data to entities such as Items, Equipment, Work Orders, Batch Operations, and miscellaneous custom entities. • Manufacturing Operations Center Analytics - provides analytical tools and reporting using the Manufacturing Operations Center Catalog and the Plant Manager, Facilities Manager, and Adhoc Dashboards. • Shift Exceptions - use this page to edit shifts for exceptions. Refer to the topic "Editing Shifts for Exceptions" in the Setting Up Time Dimension Hierarchies chapter of the Oracle Manufacturing Operations Center Implementation Guide for more information. • Actual Meters Data Entry- Use this page to enter meter readings manually using the User Role 4-1

Using the Manual Contextualization Method
Use the Manual Contextualization page to manually enter and edit context for all active tags that have not been summarized to the equipment summary tables, and whose contextualization method is either schedule-based or manual-based. If you use the manual contextualization method, then the application will not apply any logic to get the context, other than equipment and shift, and you can manually enter the work order, segment, or item context in the Manual Contextualization page.
For the schedule-based contextualization method, you must update the Equipment Production Schedule to get the context of shift, work order, segment, and item. Using Manual Contextualization page, mark the rows for reprocessing to get the updated context for the tag from Equipment Production Schedule.
To manually enter and edit context:
1. Navigate to the Manual Contextualization page. 2. Select a Plant. You can refine your search further by selecting a value in the Equipment field and Tag field. 3. Enter From and To Dates to refine your search to a specific date range. 4. Click Go. 5. You can display your search results by Missing Mandatory Context Only, Missing Optional Context Only, or All Context. The Missing Mandatory Context Only option displays tag rows that do not have the context, but were set as mandatory context for the equipment. The Missing Optional Context Only option displays tag rows which do not have the context but were set as optional context for the equipment. All context displays rows from both Missing Mandatory and Optional Context options.
To update context detail:
You can update context detail for each row, or update context detail for multiple rows in a batch.
1. To update context within a single row, click the search icon for a context field. The Search and Select window appears. 2. Enter your search criteria and click Go. A list of results displays. Select a value and click Select. 3. To update context for multiple rows in a batch, select rows that you want to update and click the Enter Context in Batch button. The Batch Contextualization Update page appears. 4. Enter each context and click the Enter in Batch button. Each context field for the selected rows are updated. 5. Save your work. Related Topics
Creating Equipment Contextualization Information, page 3-6
User Role 4-3
Viewing and Adding Reason Codes
From the Tag Data Workbench, you can add or view reasons for equipment downtime or equipment scrap quantity.
To view and add reason codes from the Tag Data Workbench:
1. Navigate to the Equipment Downtime Reason page or the Scrap Reason page. The Tag Data Workbench appears. Note: The following steps apply to both Equipment Downtime Reasons and Equipment Scrap Reasons.
2. Select a Plant from the List of Values (LOV). 3. Enter a valid value for Equipment, or search for a value. 4. Specify a date range for viewing or adding equipment downtime or scrap reason. 5. Click Go. The page displays the equipment downtime or scrap reading. 6. Select rows to view and add one or more reasons. 7. Click the View Reason button to view existing reasons for the date range specified. 8. Click the Enter Downtime Reason button to add a downtime reason to your equipment. The Downtime Reasons Entry page appears. Note: If you are adding Equipment Scrap Reasons, then the
4-4

Equipment Scrap Reasons page appears.
9. In the Downtime Reason field or Scrap Reason field, enter a value, or search for a valid reason. You can add multiple reasons to selected equipment downtime or scrap reading rows. 10. Save your work. You can now click the View Reason button to verify that the reason code is now attached to the selected downtime or scrap reading rows. Extensible Attributes Data for Entities
Equipment and other manufacturing entities are business objects in the shop floor with unique characteristics and processes. MOC supports the collection of attributes for item, equipment, work order, batch operation, and miscellaneous custom entities. You can update or view attributes for manufacturing entities from the Manufacturing Operations Center User responsibility.
To view extensible attributes data for entities:
1. Navigate to the entity-specific page. The entity-specific attributes display. User Role 4-5
2. You can further refine your display by searching on the Entity Name. 3. Click on an Entity Name link to view details. The Overview page appears and displays entity-specific details. Note: The MOC User Role allows you to enter the values for the attributes. A typical example would be defining specification attributes and comparing with actual attribute values for the entities.
The Entity Instance Attribute Details page of the MOC Administrator Role appears in the MOC User Role for the entity, and allows you to enter or view the attribute values.
Actual Meters Data Entry
You can enter meter readings manually using the Actual Meters Data Entry page and also view the history of readings for a meter.
4-6

To enter meter readings manually:
1. Navigate to the Actual Meter Data Entry page. 2. Enter Sustainability Aspect to find a meter using its sustainability aspect. 3. Enter the following criteria to search for a meter: • Meter Type to find a meter using its type. • Entity Hierarchy to find a meter using its entity hierarchy • Entity and Entity Name to find a meter by its entity. 4. Click Go. The page displays a list of all the actual meters for which you can enter data readings. 5. The following fields display for each meter: • Meter Code • Meter Name 6. Enter the time period for which you want to enter the readings in the From Time and To Time fields. 7. Enter the value of the sustainability aspect usage in the Usage Value field. Usage UOM is the unit of measure in which the sustainability aspect usage is expressed. User Role 4-7

Manufacturing Operations Center Catalog
Overview of the MOC Catalog
The Manufacturing Operations Center Catalog provides the Plant Manager Dashboard, Facilities Manager Dashboard, and Ad hoc Dashboard with performance areas related to manufacturing operations. It uses the ISA-95 (Instrumentation, Systems and Automation Society) structure to integrate Enterprise Resource Planning (ERP) and shop floor manufacturing equipment and systems transactions. This combination enables the catalog to provide operational analytics visibility. The catalog uses data from multiple sources and builds a logical data model providing industry-rich operational metrics to be analyzed by multiple dimensions and hierarchies. The manufacturing performance areas include the following:
Performance Areas Description Agility Responsiveness Used to analyze flexibility related measures by system, plant, item, time and equipment. Batch Analyzer Used to analyze usage and production variance and other work order related measures by system, item, plant and time. Equipment Attributes Data Attributes associated to equipment entities. Equipment Down Time Analysis Used to analyze the downtime duration of equipment. Equipment Scrap Analysis Used to analyze the scrap quantity reported for the equipment at different points of time.
1

Performance Areas Description Manufacturing Asset Performance Used to analyze overall equipment effectiveness and production loss analysis by system, plant, item, time, and equipment. Plant Maintenance Used to analyze maintenance related downtime measures by system, time, and equipment. Production Performance Used to analyze operation cycle time and its components of run, down, and idle time contributing to cycle time. Quality Used to analyze first pass yield, scrap, reject, and rework measures by system, plant, time, and equipment. Schedule Adherence Used to analyze production to performance and backlog related measures by system, plant, item, time, and equipment. Service Level Used to analyze manufacturing performance relative to pegged sales orders shipped using request and promise dates by system, plant, item and time. Sustainability Performance This performance area contains metrics that measures sustainability performance of manufacturing and non-manufacturing companies. It contains metrics that a company can use to monitor and reduce energy consumption, its cost, and associated Green House Gas emissions. Production Sustainability Performance Used to analyze sustainability performance of production organizations. Contains normalized sustainability metrics by production activity. Equipment Sustainability Analysis used to analyze sustainability characteristics of manufacturing equipments. Contains metrics that contextualizes manufacturing activity and consumption data.
5-2
Performance Areas Description Ad hoc Analysis It is used to analyze electricity consumption, pressure, and temperature for an entity and specific time -period.
Key Performance Indicators (KPIs)
The MOC Catalog provides KPIs based on the analytics layer of Oracle Business Intelligence. These KPIs are industry-rich metrics used in managing the plant operations. Since these metrics are available on the metadata-driven Oracle Business Intelligence tool, you can personalize and modify existing reports and the Plant Manager and Facilities Manager Dashboards. It also enables flexibility to add new and modify existing KPIs in the catalog.
Performance Area: Batch Analyzer
KPI Description Work Order Quantity variance Variance of actual produced quantity compared to the planned production quantity in units. Work Order Quantity variance % Variance of actual produced quantity compared to the planned production quantity in percentage. Work in Progress Planned Quantity WIP Planned Quantity for OPM batches. The quantity that is planned during the release of process batch for production. Material Usage Variance Cost of variance of actual usage quantity compared to the planned usage quantity for components Resource Usage Variance Cost of variance of actual usage quantity compared to the planned usage quantity for resources Work order or Batch Cycle Time (Hours) Cycle time between start and end of a work order or batch
3

KPI Description First Time Quality % Ratio of the total production that is good the first time without any rejection or scrap PPM on completed Work Orders Parts per Million - estimated rejected and scrapped quantity for every million units of production. Work Order Planned Start Date Work Order Planned Start Date Work Order Planned Completion Date Work Order Planned Completion Date Work Order Actual Start Date Work Order Actual Start Date Work Order Actual Completion Date Work Order Actual Completion Date Work Order Actual Completion Quantity Work Order Actual completed quantity without reject or scrap Work Order Planned Completion Quantity Work Order Planned Completion Quantity Work Order Planned Material Usage Quantity Planned material usage quantity for the work order Work Order Actual Material Usage Quantity Actual material usage quantity for the work order Work Order Planned Resource Usage Quantity Planned resource usage quantity for the work order Work Order Actual Resource Usage Quantity Actual resource usage quantity for the work order Work Order First Time Good Quantity Work Order Output Quantity that has not been reworked or scrapped Work Order Total Rejected Quantity Work Order Total Rejected Quantity which includes rework and scrap Production Material Consumed Scrap Quantity Planned Scrap quantity based on scrap factor associated with ingredients in process batches
5-4
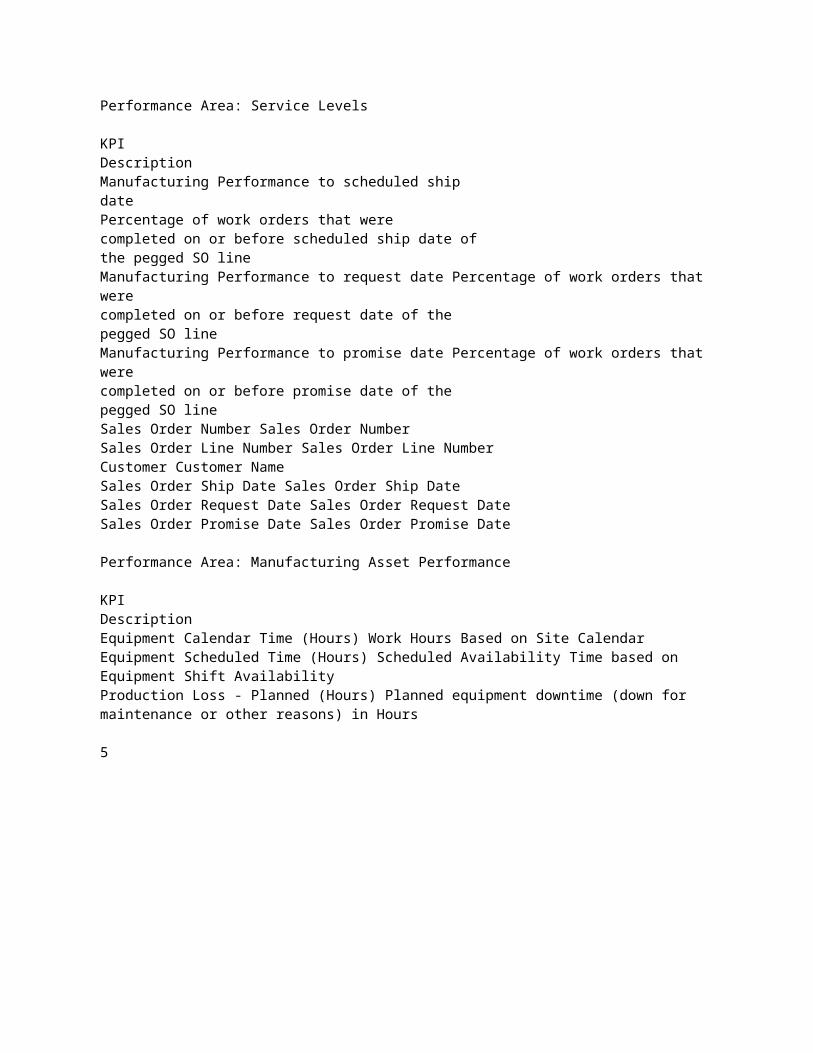
Performance Area: Service Levels
KPI Description Manufacturing Performance to scheduled ship date Percentage of work orders that were completed on or before scheduled ship date of the pegged SO line Manufacturing Performance to request date Percentage of work orders that were completed on or before request date of the pegged SO line Manufacturing Performance to promise date Percentage of work orders that were completed on or before promise date of the pegged SO line Sales Order Number Sales Order Number Sales Order Line Number Sales Order Line Number Customer Customer Name Sales Order Ship Date Sales Order Ship Date Sales Order Request Date Sales Order Request Date Sales Order Promise Date Sales Order Promise Date
Performance Area: Manufacturing Asset Performance
KPI Description Equipment Calendar Time (Hours) Work Hours Based on Site Calendar Equipment Scheduled Time (Hours) Scheduled Availability Time based on Equipment Shift Availability Production Loss - Planned (Hours) Planned equipment downtime (down for maintenance or other reasons) in Hours
5

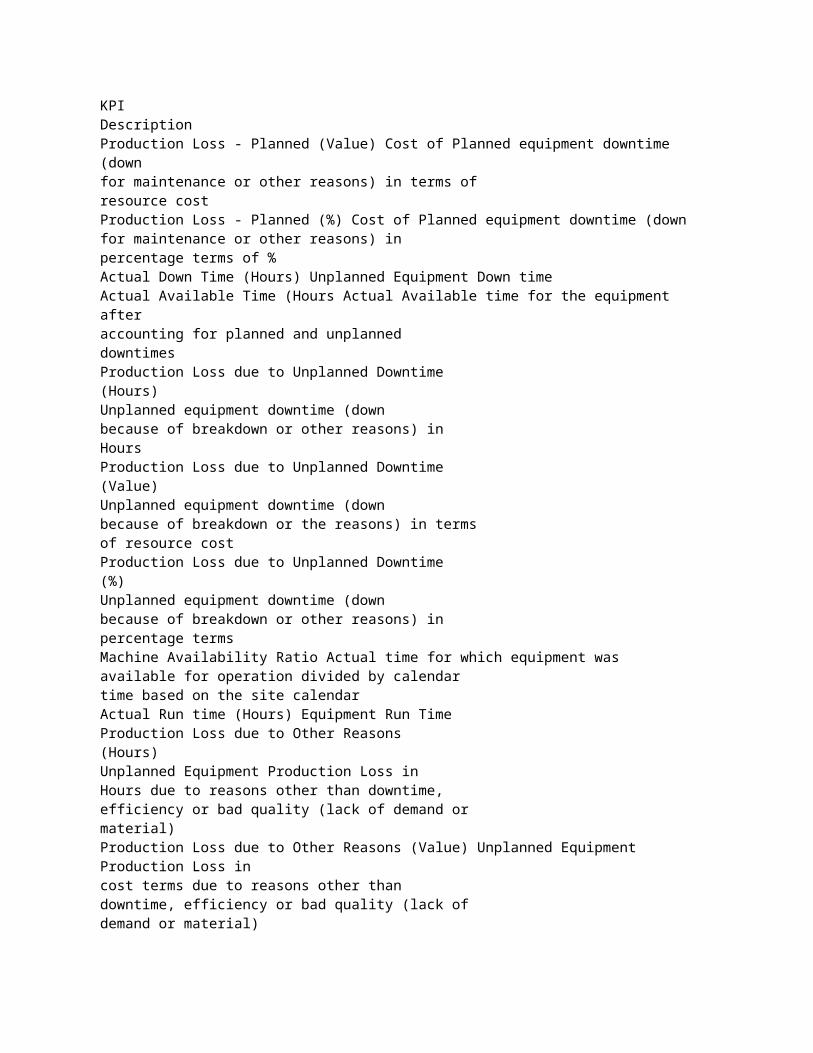
KPI Description Production Loss - Planned (Value) Cost of Planned equipment downtime (down for maintenance or other reasons) in terms of resource cost Production Loss - Planned (%) Cost of Planned equipment downtime (down for maintenance or other reasons) in percentage terms of % Actual Down Time (Hours) Unplanned Equipment Down time Actual Available Time (Hours Actual Available time for the equipment after accounting for planned and unplanned downtimes Production Loss due to Unplanned Downtime (Hours) Unplanned equipment downtime (down because of breakdown or other reasons) in Hours Production Loss due to Unplanned Downtime (Value) Unplanned equipment downtime (down because of breakdown or the reasons) in terms of resource cost Production Loss due to Unplanned Downtime (%) Unplanned equipment downtime (down because of breakdown or other reasons) in percentage terms Machine Availability Ratio Actual time for which equipment was available for operation divided by calendar time based on the site calendar Actual Run time (Hours) Equipment Run Time Production Loss due to Other Reasons (Hours) Unplanned Equipment Production Loss in Hours due to reasons other than downtime, efficiency or bad quality (lack of demand or material) Production Loss due to Other Reasons (Value) Unplanned Equipment Production Loss in cost terms due to reasons other than downtime, efficiency or bad quality (lack of demand or material)
5-6

KPI Description
Production Loss due to Other Reasons (%) Unplanned Equipment Production Loss in percentage terms due to reasons other than downtime, efficiency or bad quality (lack of demand or material)
Machine Efficiency Actual rate of production compared to the ideal rate of production
Effective Run Time (Hours) Effective Equipment Run time after taking machine efficiency into account
Performance Ratio Ratio of effective run time to actual available time
Production Loss due to Efficiency (Hours) Unplanned Equipment Production Loss in Hours Due to Machine inefficiency when compared to ideal rate of production
Production Loss due to Efficiency in % Unplanned Equipment Production Loss in cost terms Due to Machine inefficiency when compared to ideal rate of production
Production Loss due to Efficiency (Value) Unplanned Equipment Production Loss in percentage terms Due to Machine inefficiency when compared to ideal rate of production
Equipment Output Quantity Total Equipment output quantity including good and bad quantities
Equipment Standard Rate Equipment Standard production rate in units per hour
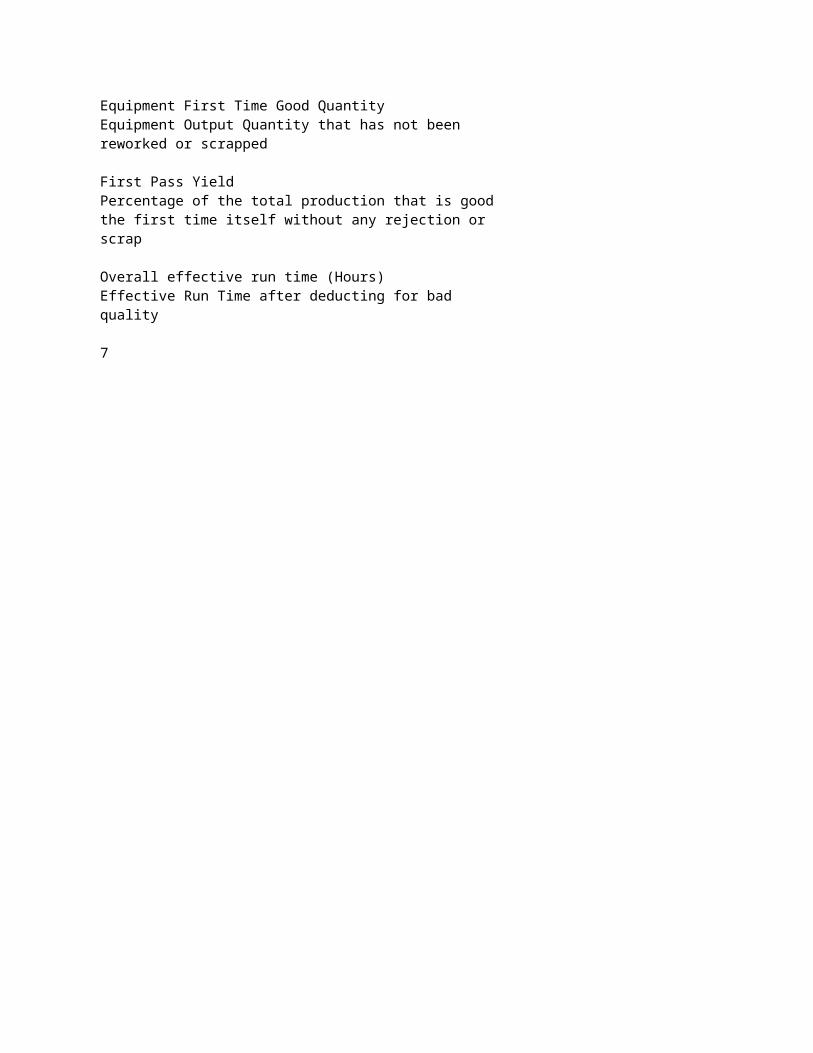
Equipment First Time Good Quantity Equipment Output Quantity that has not been reworked or scrapped
First Pass Yield Percentage of the total production that is good the first time itself without any rejection or scrap
Overall effective run time (Hours) Effective Run Time after deducting for bad quality
7

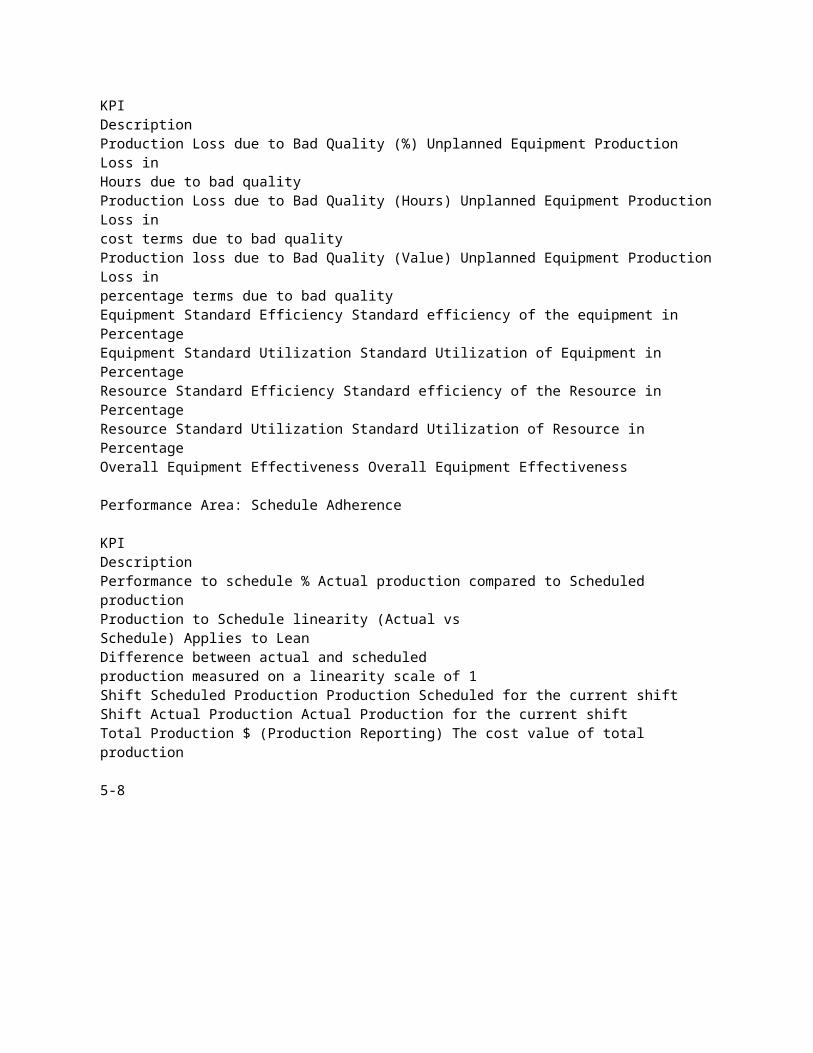
KPI Description Production Loss due to Bad Quality (%) Unplanned Equipment Production Loss in Hours due to bad quality Production Loss due to Bad Quality (Hours) Unplanned Equipment Production Loss in cost terms due to bad quality Production loss due to Bad Quality (Value) Unplanned Equipment Production Loss in percentage terms due to bad quality Equipment Standard Efficiency Standard efficiency of the equipment in Percentage Equipment Standard Utilization Standard Utilization of Equipment in Percentage Resource Standard Efficiency Standard efficiency of the Resource in Percentage Resource Standard Utilization Standard Utilization of Resource in Percentage Overall Equipment Effectiveness Overall Equipment Effectiveness
Performance Area: Schedule Adherence
KPI Description Performance to schedule % Actual production compared to Scheduled production Production to Schedule linearity (Actual vs Schedule) Applies to Lean Difference between actual and scheduled production measured on a linearity scale of 1 Shift Scheduled Production Production Scheduled for the current shift Shift Actual Production Actual Production for the current shift Total Production $ (Production Reporting) The cost value of total production
5-8
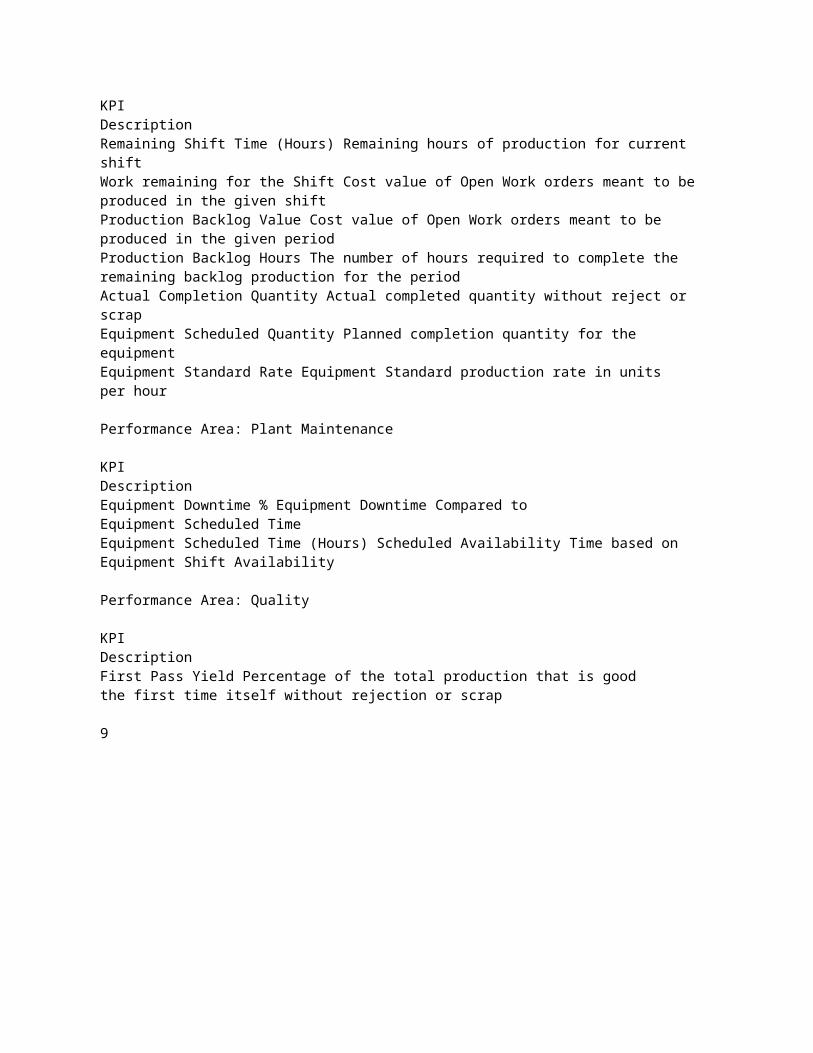
KPI Description Remaining Shift Time (Hours) Remaining hours of production for current shift Work remaining for the Shift Cost value of Open Work orders meant to be produced in the given shift Production Backlog Value Cost value of Open Work orders meant to be produced in the given period Production Backlog Hours The number of hours required to complete the remaining backlog production for the period Actual Completion Quantity Actual completed quantity without reject or scrap Equipment Scheduled Quantity Planned completion quantity for the equipment Equipment Standard Rate Equipment Standard production rate in units per hour
Performance Area: Plant Maintenance
KPI Description Equipment Downtime % Equipment Downtime Compared to Equipment Scheduled Time Equipment Scheduled Time (Hours) Scheduled Availability Time based on Equipment Shift Availability
Performance Area: Quality
KPI Description First Pass Yield Percentage of the total production that is good the first time itself without rejection or scrap
9
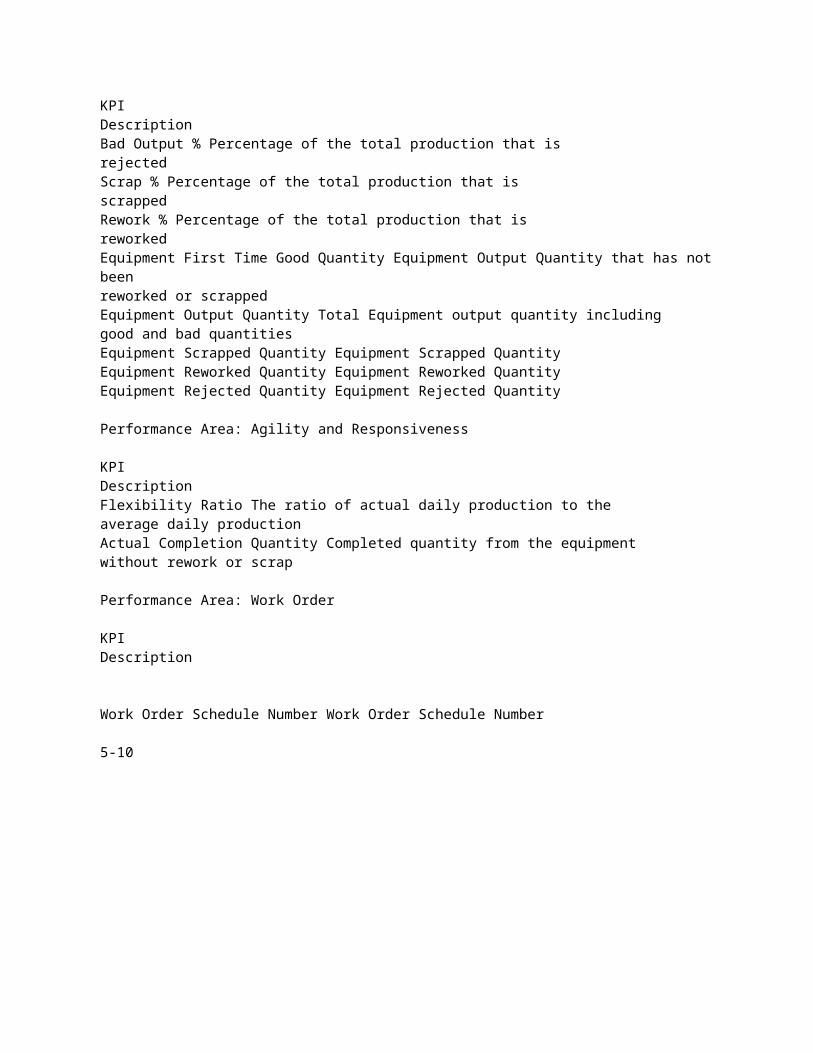
KPI Description Bad Output % Percentage of the total production that is rejected Scrap % Percentage of the total production that is scrapped Rework % Percentage of the total production that is reworked Equipment First Time Good Quantity Equipment Output Quantity that has not been reworked or scrapped Equipment Output Quantity Total Equipment output quantity including good and bad quantities Equipment Scrapped Quantity Equipment Scrapped Quantity Equipment Reworked Quantity Equipment Reworked Quantity Equipment Rejected Quantity Equipment Rejected Quantity
Performance Area: Agility and Responsiveness
KPI Description Flexibility Ratio The ratio of actual daily production to the average daily production Actual Completion Quantity Completed quantity from the equipment without rework or scrap
Performance Area: Work Order
KPI Description
Work Order Schedule Number Work Order Schedule Number
5-10
KPI Description Work Order Status Work Order Status Work Order Type Work Order Type
Performance Area: Production Performance
KPI Description Average Cycle Time Average Cycle time for an Equipment to process a Work Order Operation in a Shift Cycle Time Cycle Time for an Equipment to process a Work Order Operation in a Shift Down Time during Cycle Down Time during Cycle Idle Time during Cycle Idle Time during Cycle Run Time during Cycle Run Time during Cycle
11
Performance Area: Sustainability Performance
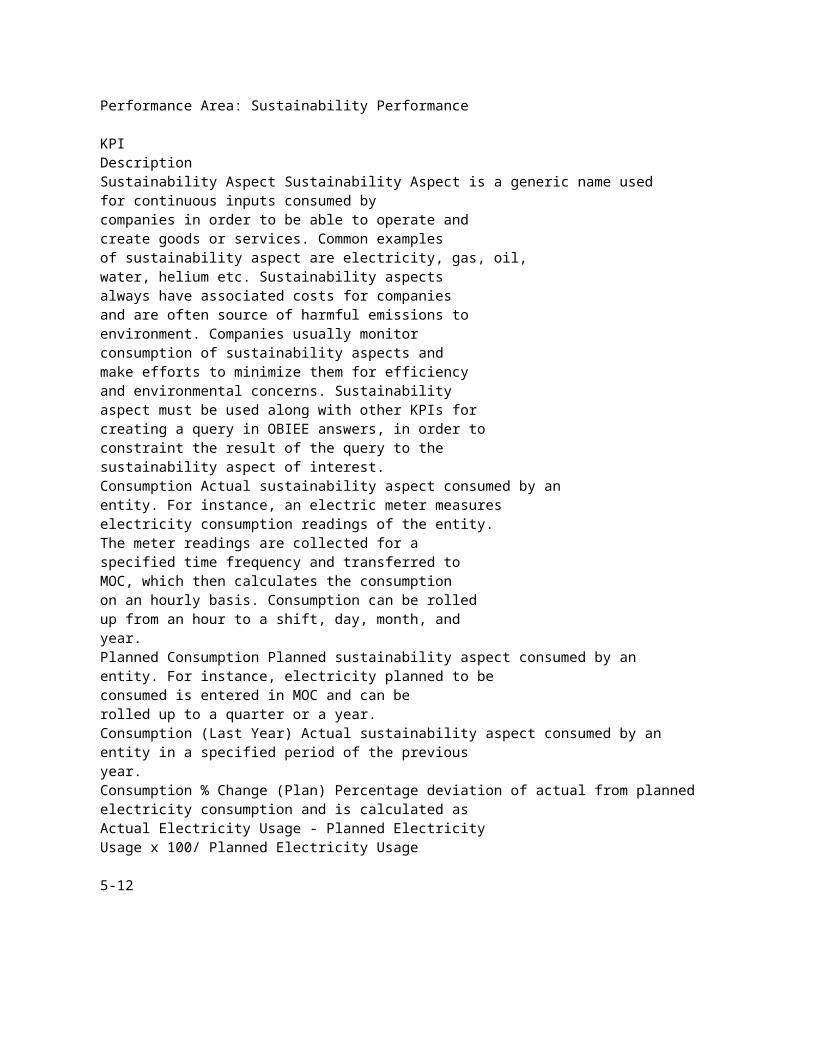
KPI Description Sustainability Aspect Sustainability Aspect is a generic name used for continuous inputs consumed by companies in order to be able to operate and create goods or services. Common examples of sustainability aspect are electricity, gas, oil, water, helium etc. Sustainability aspects always have associated costs for companies and are often source of harmful emissions to environment. Companies usually monitor consumption of sustainability aspects and make efforts to minimize them for efficiency and environmental concerns. Sustainability aspect must be used along with other KPIs for creating a query in OBIEE answers, in order to constraint the result of the query to the sustainability aspect of interest. Consumption Actual sustainability aspect consumed by an entity. For instance, an electric meter measures electricity consumption readings of the entity. The meter readings are collected for a specified time frequency and transferred to MOC, which then calculates the consumption on an hourly basis. Consumption can be rolled up from an hour to a shift, day, month, and year. Planned Consumption Planned sustainability aspect consumed by an entity. For instance, electricity planned to be consumed is entered in MOC and can be rolled up to a quarter or a year. Consumption (Last Year) Actual sustainability aspect consumed by an entity in a specified period of the previous year. Consumption % Change (Plan) Percentage deviation of actual from planned electricity consumption and is calculated as Actual Electricity Usage - Planned Electricity Usage x 100/ Planned Electricity Usage
5-12

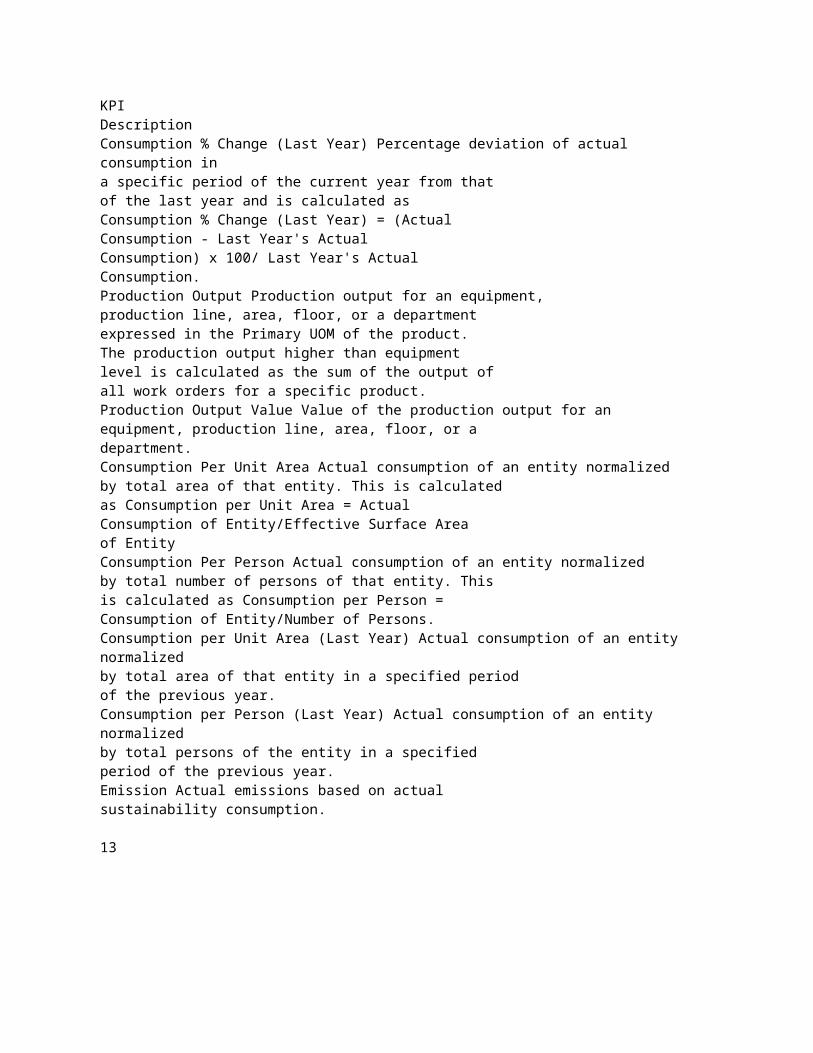
KPI Description Consumption % Change (Last Year) Percentage deviation of actual consumption in a specific period of the current year from that of the last year and is calculated as Consumption % Change (Last Year) = (Actual Consumption - Last Year's Actual Consumption) x 100/ Last Year's Actual Consumption. Production Output Production output for an equipment, production line, area, floor, or a department expressed in the Primary UOM of the product. The production output higher than equipment level is calculated as the sum of the output of all work orders for a specific product. Production Output Value Value of the production output for an equipment, production line, area, floor, or a department. Consumption Per Unit Area Actual consumption of an entity normalized by total area of that entity. This is calculated as Consumption per Unit Area = Actual Consumption of Entity/Effective Surface Area of Entity Consumption Per Person Actual consumption of an entity normalized by total number of persons of that entity. This is calculated as Consumption per Person = Consumption of Entity/Number of Persons. Consumption per Unit Area (Last Year) Actual consumption of an entity normalized by total area of that entity in a specified period of the previous year. Consumption per Person (Last Year) Actual consumption of an entity normalized by total persons of the entity in a specified period of the previous year. Emission Actual emissions based on actual sustainability consumption.
13

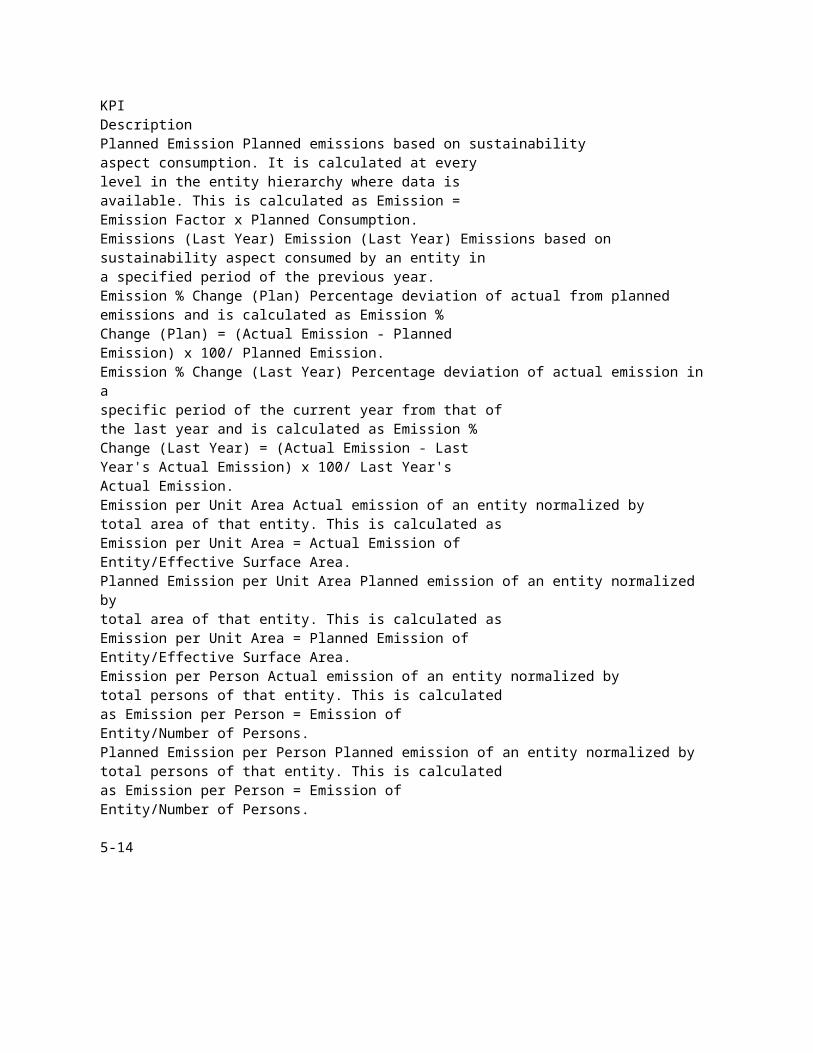
KPI Description Planned Emission Planned emissions based on sustainability aspect consumption. It is calculated at every level in the entity hierarchy where data is available. This is calculated as Emission = Emission Factor x Planned Consumption. Emissions (Last Year) Emission (Last Year) Emissions based on sustainability aspect consumed by an entity in a specified period of the previous year. Emission % Change (Plan) Percentage deviation of actual from planned emissions and is calculated as Emission % Change (Plan) = (Actual Emission - Planned Emission) x 100/ Planned Emission. Emission % Change (Last Year) Percentage deviation of actual emission in a specific period of the current year from that of the last year and is calculated as Emission % Change (Last Year) = (Actual Emission - Last Year's Actual Emission) x 100/ Last Year's Actual Emission. Emission per Unit Area Actual emission of an entity normalized by total area of that entity. This is calculated as Emission per Unit Area = Actual Emission of Entity/Effective Surface Area. Planned Emission per Unit Area Planned emission of an entity normalized by total area of that entity. This is calculated as Emission per Unit Area = Planned Emission of Entity/Effective Surface Area. Emission per Person Actual emission of an entity normalized by total persons of that entity. This is calculated as Emission per Person = Emission of Entity/Number of Persons. Planned Emission per Person Planned emission of an entity normalized by total persons of that entity. This is calculated as Emission per Person = Emission of Entity/Number of Persons.
5-14
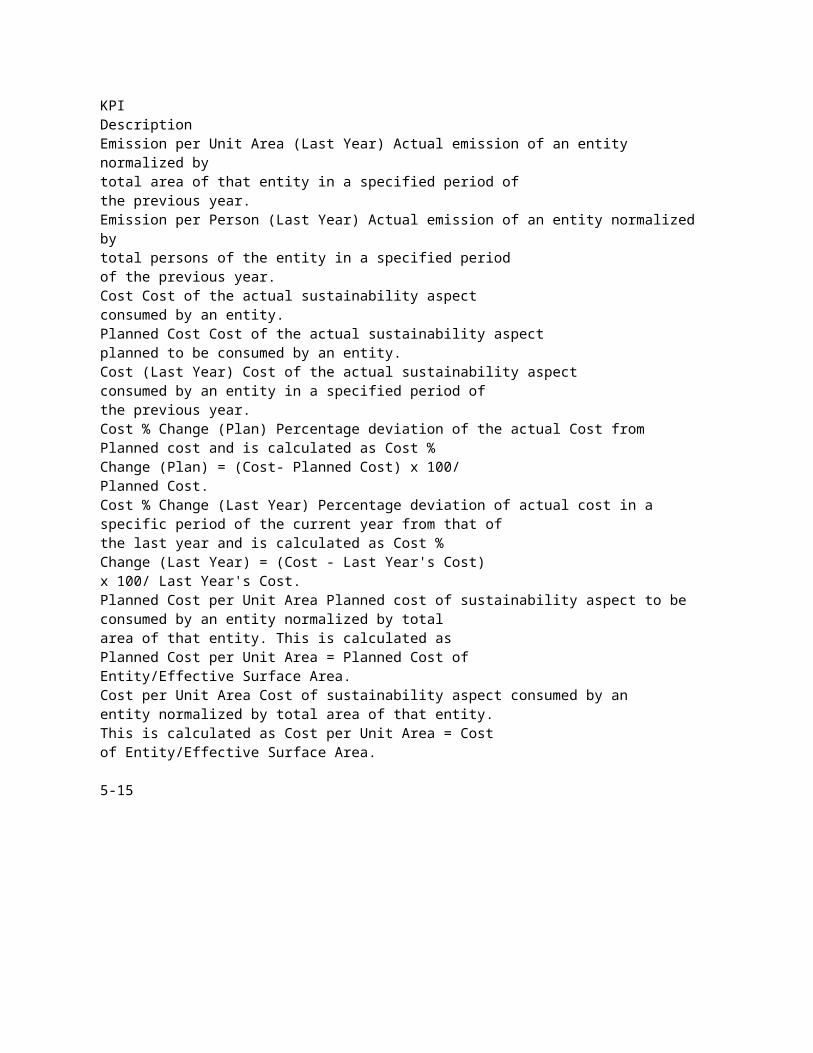
KPI Description Emission per Unit Area (Last Year) Actual emission of an entity normalized by total area of that entity in a specified period of the previous year. Emission per Person (Last Year) Actual emission of an entity normalized by total persons of the entity in a specified period of the previous year. Cost Cost of the actual sustainability aspect consumed by an entity. Planned Cost Cost of the actual sustainability aspect planned to be consumed by an entity. Cost (Last Year) Cost of the actual sustainability aspect consumed by an entity in a specified period of the previous year. Cost % Change (Plan) Percentage deviation of the actual Cost from Planned cost and is calculated as Cost % Change (Plan) = (Cost- Planned Cost) x 100/ Planned Cost. Cost % Change (Last Year) Percentage deviation of actual cost in a specific period of the current year from that of the last year and is calculated as Cost % Change (Last Year) = (Cost - Last Year's Cost) x 100/ Last Year's Cost. Planned Cost per Unit Area Planned cost of sustainability aspect to be consumed by an entity normalized by total area of that entity. This is calculated as Planned Cost per Unit Area = Planned Cost of Entity/Effective Surface Area. Cost per Unit Area Cost of sustainability aspect consumed by an entity normalized by total area of that entity. This is calculated as Cost per Unit Area = Cost of Entity/Effective Surface Area.
5-15
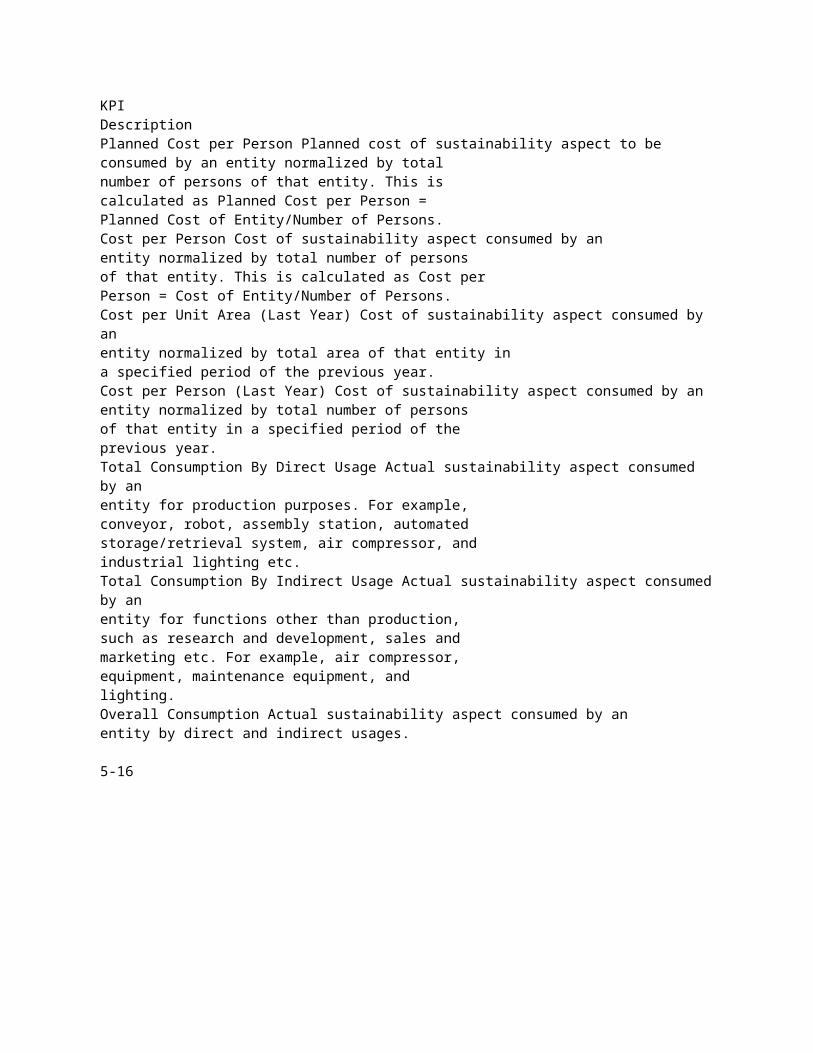
KPI Description Planned Cost per Person Planned cost of sustainability aspect to be consumed by an entity normalized by total number of persons of that entity. This is calculated as Planned Cost per Person = Planned Cost of Entity/Number of Persons. Cost per Person Cost of sustainability aspect consumed by an entity normalized by total number of persons of that entity. This is calculated as Cost per Person = Cost of Entity/Number of Persons. Cost per Unit Area (Last Year) Cost of sustainability aspect consumed by an entity normalized by total area of that entity in a specified period of the previous year. Cost per Person (Last Year) Cost of sustainability aspect consumed by an entity normalized by total number of persons of that entity in a specified period of the previous year. Total Consumption By Direct Usage Actual sustainability aspect consumed by an entity for production purposes. For example, conveyor, robot, assembly station, automated storage/retrieval system, air compressor, and industrial lighting etc. Total Consumption By Indirect Usage Actual sustainability aspect consumed by an entity for functions other than production, such as research and development, sales and marketing etc. For example, air compressor, equipment, maintenance equipment, and lighting. Overall Consumption Actual sustainability aspect consumed by an entity by direct and indirect usages.
5-16
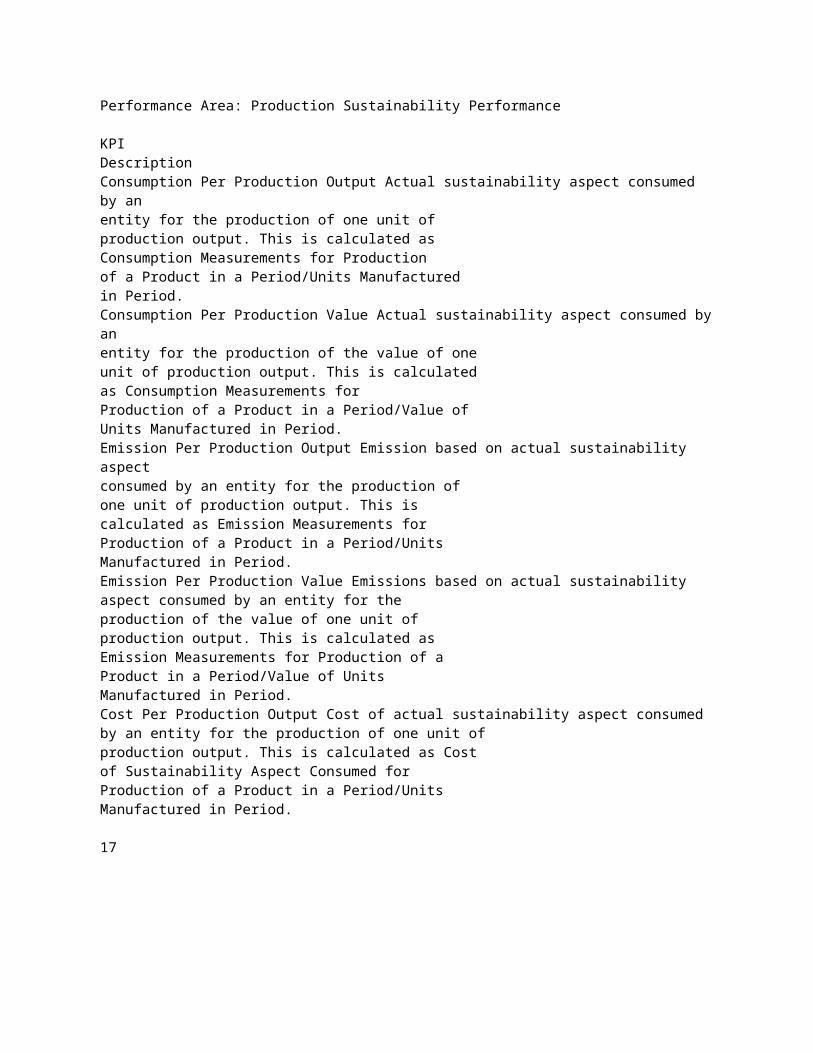
Performance Area: Production Sustainability Performance
KPI Description Consumption Per Production Output Actual sustainability aspect consumed by an entity for the production of one unit of production output. This is calculated as Consumption Measurements for Production of a Product in a Period/Units Manufactured in Period. Consumption Per Production Value Actual sustainability aspect consumed by an entity for the production of the value of one unit of production output. This is calculated as Consumption Measurements for Production of a Product in a Period/Value of Units Manufactured in Period. Emission Per Production Output Emission based on actual sustainability aspect consumed by an entity for the production of one unit of production output. This is calculated as Emission Measurements for Production of a Product in a Period/Units Manufactured in Period. Emission Per Production Value Emissions based on actual sustainability aspect consumed by an entity for the production of the value of one unit of production output. This is calculated as Emission Measurements for Production of a Product in a Period/Value of Units Manufactured in Period. Cost Per Production Output Cost of actual sustainability aspect consumed by an entity for the production of one unit of production output. This is calculated as Cost of Sustainability Aspect Consumed for Production of a Product in a Period/Units Manufactured in Period.
17
KPI Description Cost Per Production Value Cost of actual sustainability aspect consumed by an entity for the production of the value of one unit of production output. This is calculated as Cost of Sustainability Aspect Consumed for Production of a Product in a Period/Value of Units Manufactured in Period.
Performance Area: Equipment Sustainability Analysis
KPI Description Total Consumption (TC) Sum of Value Added Consumption and Non Value Added Consumption. Value Added Consumption (VAC) Actual sustainability aspect consumed by an entity in the RUN status. This is applicable to production entities only. Non Value Added Consumption Actual sustainability aspect consumed by an entity in the IDLE, DOWN, or OFF statuses. This is applicable to production entities only. Value Added Consumption% Percentage of the Value Added Consumption per the Total consumption for an entity. This can be calculated as (VAC X 100) / TC.
Dimensions
The KPIs in the performance areas can be analyzed by the dimensions seeded in the MOC Catalog. Each of the following dimension folders contain the dimensions, hierarchies and attributes to analyze the KPIs
• Attribute Group Metadata • Down Time Reason • Entity • Equipment • Equipment Attributes Data 5-18

• Equipment Standard Rate • Item • Plant • Scrap Reason • Shift • Sustainability Aspect • System • Time • Time - Period To Date • Time - Transaction Date • Time Sustainability • Time - Work Order Actual Completion Date • Time - Work Order Actual Start Date • Time - Work Order Planned Completion Date • Time - Work Order Planned Start Date • Time - Ad hoc • Work Order • Work Order Segment • Work Order Sub Segment Oracle Business Intelligence (BI)
The MOC Catalog is based on the analytics layer of the Oracle Business Intelligence (BI) platform from Oracle Fusion Middleware. The catalog uses this technology to organize data to analyze and provide the metrics required for measuring in the your business. The catalog interface consists of the Oracle BI Presentation Services and the MOC application. The interface is organized into pages with the following components:
• Answers
The Manufacturing Hub Catalog displays on this page and enables you to build 19
Overview of Oracle BI for End Users, Oracle Business Intelligence Answers, Delivers, and Interactive Dashboards User Guide
Performing Common Tasks in Oracle BI, Oracle Business Intelligence Answers, Delivers, and Interactive Dashboards User Guide
Using the Oracle BI My Account Page, Oracle Business Intelligence Answers, Delivers, and
Interactive Dashboards User Guide
Using the MOC Catalog
More than eighty KPIs are grouped in the Manufacturing Hub Catalog selection pane. These provide an aggregate level analysis on KPIs and enable you to drill down to detailed analysis.
To select catalog data for reporting:
1. Navigate to the MOC Catalog and select the Answers link. The Answers page contains two panes. The selection pane contains the Manufacturing Hub Catalog columns you select. The display workspace shows the columns selected for the request.
2. In the Selection pane, expand the specific columns for the areas you want on your report. Columns indicate the columns of data that your request will return.
3. Select details in the performance areas you want displayed on the report. Choices selected appear in the display workspace in the Criteria tabbed region. 21
The Criteria tab is used to view or change the columns and filters for the request. You can specify the order in which the results display, column subtotals, formatting, formulas. For each selection you can format the column data using the following:
• Value Format to override default settings such as font type and size • Edit Formula to change the formula for the column.
4. You have the option to control the output display by creating a filter. Choose the Create/Edit Filter icon to create a filter expression to display as a CASE statement. You can save this filter for other reports.
5. Select Display Results or the Results tabbed regions to display your report. 5-22
You can choose several different display views, and combine views and arrange them for display on the Plant Manager, Facilities Manager, and Ad hoc Dashboards.
6. To combine the results of multiple requests, choose Select Combine with Similar Requests. 23
Plant Manager Dashboard
This chapter covers the following topics:
• Overview of the Plant Manager Dashboard • Asset Performance (OEE) • Asset Performance (OEE) by Equipment • Equipment Downtime Analysis • Equipment Downtime Reasons • Production Slippage Trend • Equipment Scrap Analysis • Equipment Scrap Reasons • Equipment Efficiency Analysis • Equipment Efficiency Detail • Production Loss Analysis • Production Loss Detail • Production Performance • Batch Performance • Batch Performance Detail • Sustainability Performance by Department • Sustainability Performance by Equipment • Sustainability Performance Equipment Hourly Summary Page • Sustainability Performance Equipment Hourly Detail Page 1
Overview of the Plant Manager Dashboard
Overall Equipment Effectiveness (OEE) is a key metric that every plant manager monitors. The Plant Manager Dashboard provides a complete view of the equipment and helps the plant manager to assess where the source for production losses occur. The Plant Manager Dashboard and integrated reports provide the plant manager views of the production data for the plant in terms of overall equipment effectiveness, batch performance, schedule adherence, and production loss analysis for the departments and equipment on the shop floor
Oracle Manufacturing Operations Center collects data from disparate sources into this single role-based dashboard that allows Plant Managers and staff to view manufacturing operations efficiently and effectively. The open and flexible BI technology from Oracle Fusion Middleware makes it easy to build and modify KPIs and dashboards.
The Plant Manager Dashboard lets you report and analyze electricity consumption, electricity cost, and carbon emission for an entity You can view information for all the levels of entity hierarchy, plant, department, floor, floor section, and equipment.
The following table identifies the dashboard pages and the reports made available to the Plant Manager role:
Dashboard Pages Reports Asset Performance (OEE) Overall Equipment Effectiveness by Plant Overall Equipment Effectiveness By Department (Bottom Performers) Overall Equipment Effectiveness Details By Plant Overall Equipment Effectiveness Details By Department Overall Equipment Effectiveness Trend by Plant Overall Equipment Effectiveness Trend by Department Asset Performance (OEE) by Equipment Overall Equipment Effectiveness by Department Overall Equipment Effectiveness by Equipment (Bottom Performers)
6-2
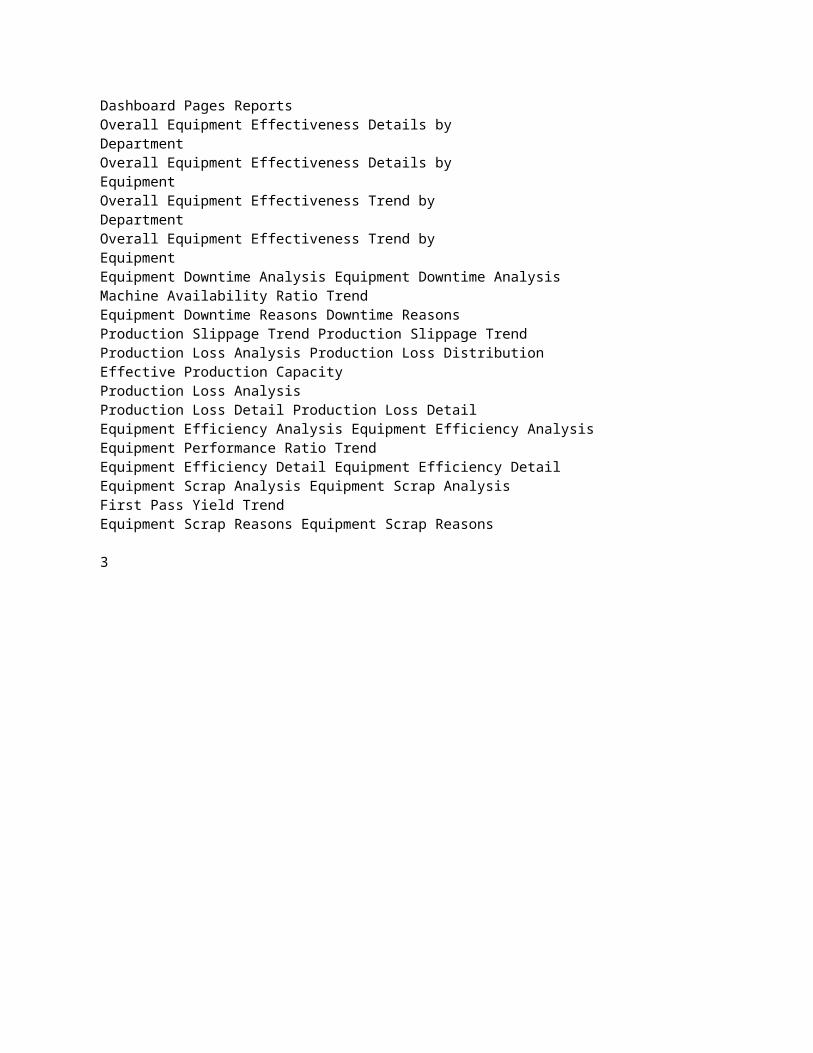
Dashboard Pages Reports Overall Equipment Effectiveness Details by Department Overall Equipment Effectiveness Details by Equipment Overall Equipment Effectiveness Trend by Department Overall Equipment Effectiveness Trend by Equipment Equipment Downtime Analysis Equipment Downtime Analysis Machine Availability Ratio Trend Equipment Downtime Reasons Downtime Reasons Production Slippage Trend Production Slippage Trend Production Loss Analysis Production Loss Distribution Effective Production Capacity Production Loss Analysis Production Loss Detail Production Loss Detail Equipment Efficiency Analysis Equipment Efficiency Analysis Equipment Performance Ratio Trend Equipment Efficiency Detail Equipment Efficiency Detail Equipment Scrap Analysis Equipment Scrap Analysis First Pass Yield Trend Equipment Scrap Reasons Equipment Scrap Reasons
3
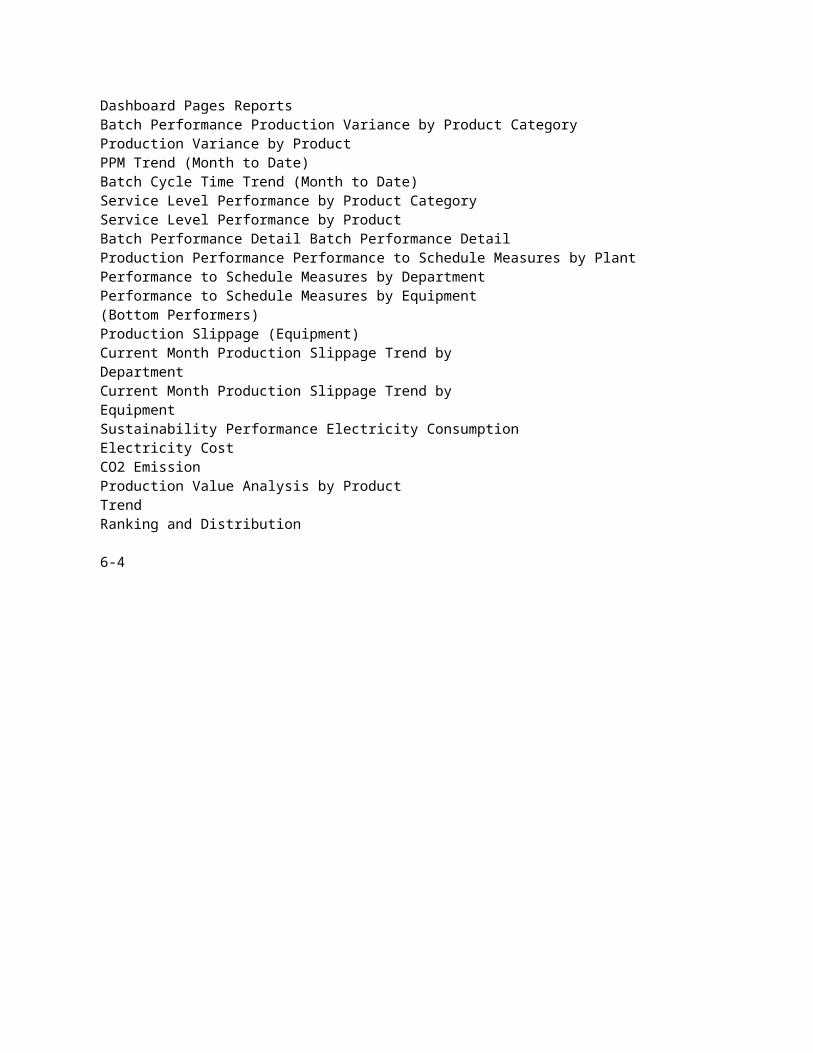
Dashboard Pages Reports Batch Performance Production Variance by Product Category Production Variance by Product PPM Trend (Month to Date) Batch Cycle Time Trend (Month to Date) Service Level Performance by Product Category Service Level Performance by Product Batch Performance Detail Batch Performance Detail Production Performance Performance to Schedule Measures by Plant Performance to Schedule Measures by Department Performance to Schedule Measures by Equipment (Bottom Performers) Production Slippage (Equipment) Current Month Production Slippage Trend by Department Current Month Production Slippage Trend by Equipment Sustainability Performance Electricity Consumption Electricity Cost CO2 Emission Production Value Analysis by Product Trend Ranking and Distribution
6-4

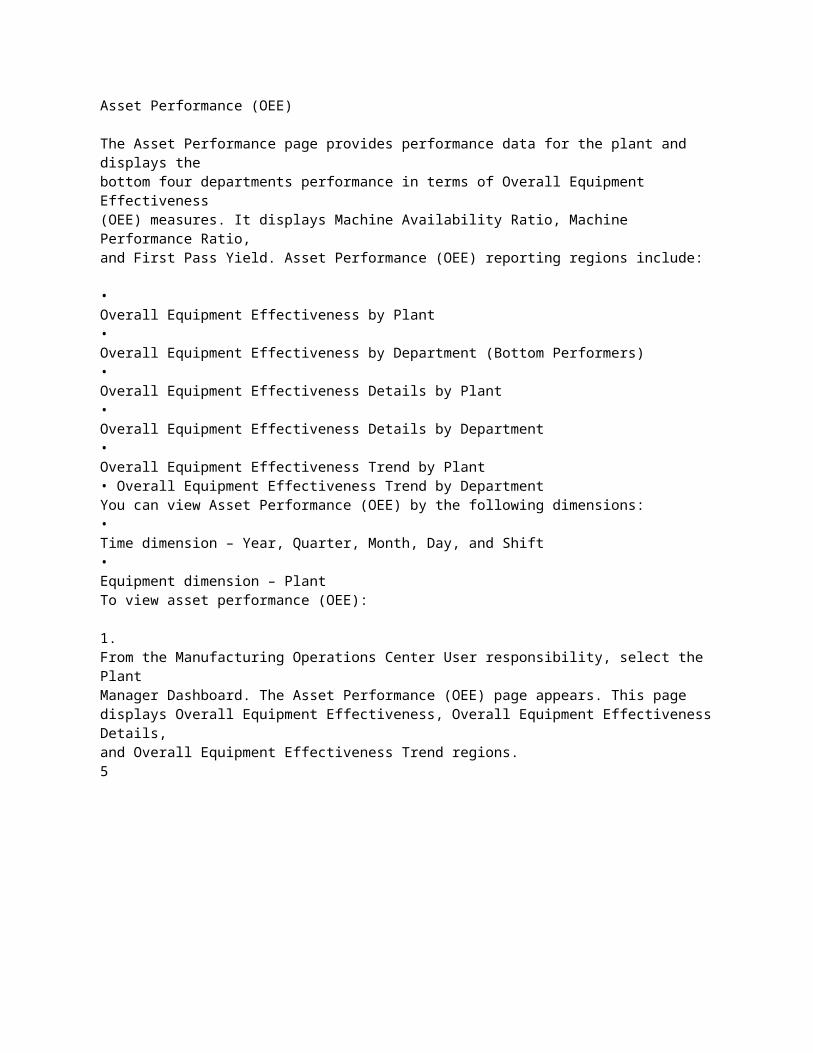
Asset Performance (OEE)
The Asset Performance page provides performance data for the plant and displays the bottom four departments performance in terms of Overall Equipment Effectiveness (OEE) measures. It displays Machine Availability Ratio, Machine Performance Ratio, and First Pass Yield. Asset Performance (OEE) reporting regions include:
• Overall Equipment Effectiveness by Plant • Overall Equipment Effectiveness by Department (Bottom Performers) • Overall Equipment Effectiveness Details by Plant • Overall Equipment Effectiveness Details by Department • Overall Equipment Effectiveness Trend by Plant • Overall Equipment Effectiveness Trend by Department You can view Asset Performance (OEE) by the following dimensions: • Time dimension – Year, Quarter, Month, Day, and Shift • Equipment dimension – Plant To view asset performance (OEE):
1. From the Manufacturing Operations Center User responsibility, select the Plant Manager Dashboard. The Asset Performance (OEE) page appears. This page displays Overall Equipment Effectiveness, Overall Equipment Effectiveness Details, and Overall Equipment Effectiveness Trend regions. 5
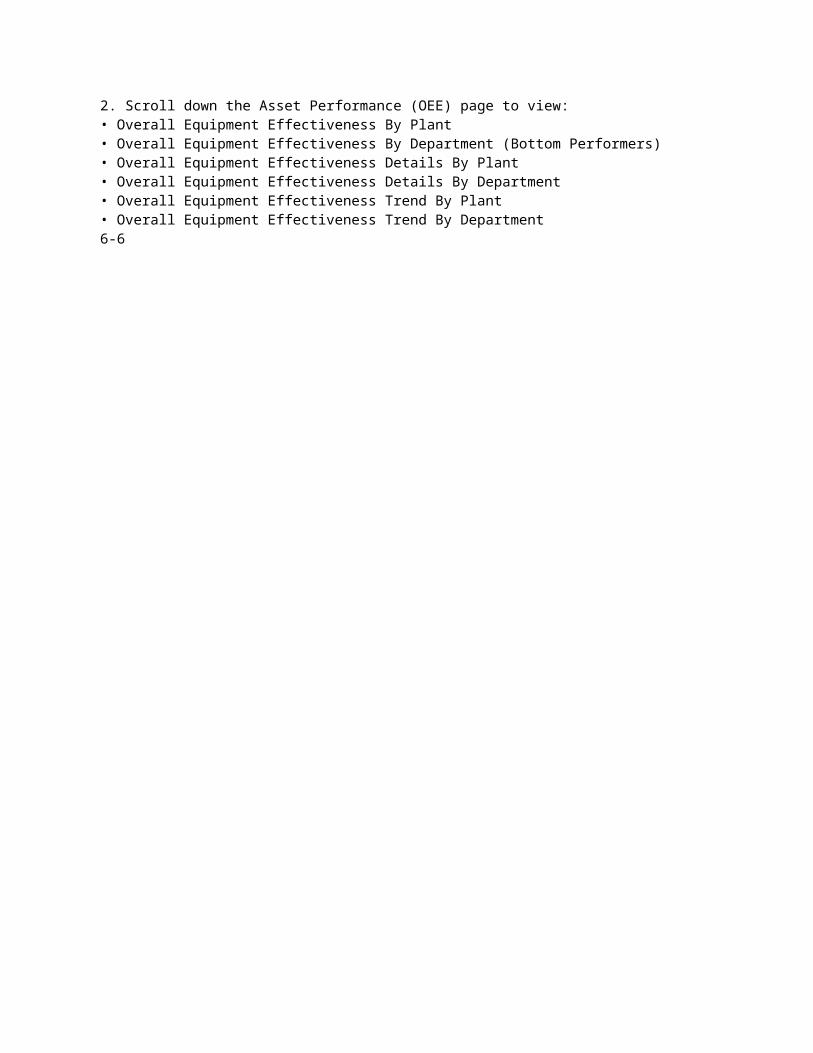
2. Scroll down the Asset Performance (OEE) page to view: • Overall Equipment Effectiveness By Plant • Overall Equipment Effectiveness By Department (Bottom Performers) • Overall Equipment Effectiveness Details By Plant • Overall Equipment Effectiveness Details By Department • Overall Equipment Effectiveness Trend By Plant • Overall Equipment Effectiveness Trend By Department 6-6
Asset Performance (OEE) by Equipment
The Asset Performance page provides performance data for equipment and displays the bottom four equipment performance in terms of Overall Equipment Effectiveness (OEE) measures. It displays Machine Availability Ratio, Machine Performance Ratio, and First Pass Yield. Reporting regions include:
• Overall Equipment Effectiveness by Department • Overall Equipment Effectiveness by Equipment (Bottom Performers) • Overall Equipment Effectiveness Details by Department • Overall Equipment Effectiveness Details by Equipment • Overall Equipment Effectiveness Trend by Department • Overall Equipment Effectiveness Trend by Equipment You can view Asset Performance (OEE) by Equipment by the following dimensions: • Time dimension – Year, Quarter, Month, Day and Shift • Equipment dimension – Plant and Department
To view Asset Performance (OEE) by Equipment:
1. From the Asset Performance (OEE) page, click on a Department gauge in the Overall Equipment Effectiveness By Department (Bottom Performers) region. For example, click on the Paint Shop (SM1) gauge to drill down and display details of low OEE contribution. The Asset Performance (OEE) by Equipment page displays the Overall Equipment Effectiveness (OEE) for Equipment belonging to the Paint Shop department. 2. Scroll down the page to view Overall Equipment Effectiveness Details by Department and by Equipment regions. The page displays Machine Availability Ratio, Machine Performance Ratio, and First Pass Yield by Department and by Equipment. 3. Change the View by to: Table 6-8
5. Scroll further to view Overall Equipment Effectiveness Trend by Department and by Equipment regions. Related Topics
Asset Performance (OEE), page 6-5
Equipment Downtime Analysis
You can use the Equipment Downtime Analysis page to analyze the equipment downtime by downtime reasons. Reporting regions include:
• Equipment Downtime Analysis • Machine Availability Ratio Trend • Equipment Downtime Detail You can view equipment downtime by the following dimensions: • Time dimension – Year, Quarter, Month, and Day • Equipment dimension – Plant, Department, and Equipment To view equipment downtime details:
1. From the Asset Performance (OEE) by Equipment page, you can navigate to the Equipment Downtime Analysis page to view equipment downtime details. Scroll down to Overall Equipment Effectiveness Details by Equipment region. 2. Change the View by to: Table 3. Select a link from the Machine Availability column. 4. The Equipment Downtime Analysis page appears. This page displays Equipment Downtime Reasons and Machine Availability Ratio Trend graphs. 6-10

Equipment Downtime Reasons
The Equipment Downtime Reasons report lets you view the downtime reasons for a particular day selected from the Equipment Downtime Analysis page. The report displays Downtime Hours and Reasons for the equipment by Shift level for the day.
To view Equipment Downtime Reasons:
1. Navigate to the Equipment Downtime Analysis page and scroll down to the Equipment Downtime details region. 2. Select a link from the Actual Down Time (Hours) column. The Downtime Reasons page appears and displays Equipment Downtime reasons by Shift for the day. 3. Click the Return link to return to the Equipment Downtime Analysis page. Related Topics
Equipment Downtime Analysis, page 6-10
Production Slippage Trend
The Production Slippage Trend report displays the production slippage and trend by equipment and shift for a monthly period.
6-12
Equipment Scrap Analysis
You can use the Equipment Scrap Analysis page to analyze the scrap transactions by scrap reasons. Reporting regions include:
• Equipment Scrap Analysis
• First Pass Yield Trend • Equipment Scrap Detail You can view scrap transactions by the following dimensions: • Time dimension – Year, Quarter, Month and Day • Equipment dimension – Plant, Department, and Equipment To view Equipment Scrap Analysis:
1. Navigate to the Asset Performance (OEE) by Equipment page. 2. Scroll down to the Overall Equipment Effectiveness Details - By Equipment region. 3. Change the View by to: Table 4. Select a value in the First Pass Yield column. The Equipment Scrap Analysis page appears where you can view quality details. This page displays Equipment Scrap Analysis and First Pass Yield Trend graphs. 6-14
Equipment Scrap Reasons
The Scrap Reasons report lets you view the scrap reasons for a particular day. Select Scrap Reasons from the Equipment Scrap Analysis page. The report displays the Scrap Quantity and Reasons for the equipment at shift level for the day.
To view Equipment Scrap Reasons:
1. Navigate to the Equipment Scrap Analysis page. 2. Scroll down to the Equipment Scrap Analysis Details region. 3. Select a value in the Scrapped Quantity column to view scrap details and reasons by shift for the day. The Scrap Reasons report appears. 4. Select the Return link to return to the Equipment Scrap Analysis page. Related Topics
Equipment Scrap Analysis, page 6-13
Equipment Efficiency Analysis
The Equipment Efficiency Analysis page displays production loss due to inefficiency of the equipment. Reporting regions include:
6-16
• Equipment Efficiency Analysis • Machine Performance Ratio Trend • Equipment Efficiency Detail You can view Equipment Efficiency Analysis by the following dimensions: • Time dimension – Year, Quarter, Month, and Day • Equipment dimension – Plant, Department, and Equipment To view the Equipment Efficiency Analysis page:
1. Navigate to the Asset Performance (OEE) by Equipment page. 2. Scroll down to the Overall Equipment Effectiveness Details by Equipment region. 3. Change View by to: Table. 4. Select a value from the Machine Performance column for an equipment item. The Equipment Efficiency Analysis page appears. This page displays and reports the production loss due to inefficiency. 17

Equipment Efficiency Detail
The Equipment Efficiency Detail report lets you view the Equipment Efficiency for a particular day, and is selected from the Equipment Efficiency Analysis report. The report displays the Efficiency for the equipment at shift level for the day.
To view Equipment Efficiency Detail:
1. Navigate to the Equipment Efficiency Analysis page. 2. Scroll down the page to the details region. 3. Select a value in the Machine Efficiency column. The Equipment Efficiency Details report appears. 4. Select the Return link to return to the Equipment Efficiency Analysis page. Related Topics
Equipment Efficiency Analysis, page 6-16
Production Loss Analysis
You can use the Production Loss Analysis page to analyze production loss by equipment. Reporting regions include:
• Production Loss Distribution • OEE Time Analysis • Production Loss Analysis You can view Production Loss by the following dimensions: 19
• Time dimension – Year, Quarter, Month, and Day • Equipment dimension – Plant, Department, and Equipment To view Production Loss Analysis:
1. Navigate to the Asset Performance (OEE) by Equipment page. 2. Select the Production Loss Analysis link. The Production Loss Analysis page appears. 6-20

3. The page displays the distribution of production loss as well as the OEE time metrics for the equipment. 4. The page provides the Production Loss detail and can be defined as: • Planned • Unplanned • Due to Other Reasons • Due to Inefficiency • Due to Bad Quality 5. Scroll down the page to view Production Loss Analysis. This includes Total Production Loss in hours and Overall Effective Run Time in hours. 21

Production Loss Detail
The Production Loss Detail page lets you view the Production Loss for a particular day, and is selected from the Production Loss Analysis page. The page displays the Production Loss and details for the equipment at the shift level for the day.
You can view Production Loss Detail page by the following dimensions:
• Time dimension – Year, Quarter, Month, Day and Shift • Equipment dimension – Plant, Department, and Equipment To view Production Loss Detail:
1. Navigate to the Production Loss Analysis page and scroll down to the Production Loss Analysis region.
2. Select a value in the Total Production Loss column to analyze the Production Loss by day and shift. The Production Loss Detail page appears. 3. This report displays the Production Loss detail as well as the OEE Time Analysis for equipment. 4. Select the Return link to return to the Production Loss Analysis page. 23
Related Topics
Production Loss Analysis, page 6-19
Production Performance
The Production Performance page provides the performance to schedule measures by plant, department, and bottom performing equipment. It also displays production slippage in comparison to different shifts and the current month production slippage trend. Reporting regions include:
• Performance to Schedule Measures by Plant • Performance to Schedule Measures by Department • Performance to Schedule Measures by Equipment (Bottom Performers) • Production Slippage by Equipment • Current Month Production Slippage Trend by Department • Current Month Production Slippage Trend by Equipment You can view Production Performance by the following dimensions: • Time dimension – Year, Quarter, Month, Day, and Shift • Equipment dimension – Plant and Department To view Production Performance:
1. Navigate to the Production Performance page. The page displays Performance to Schedule Measures By Plant, By Department, and By Equipment Bottom Performers. 6-24
2. Scroll down the Production Performance page to view the Production Slippage (Equipment) region. 3. You can scroll down the page further to view Current Month Production Slippage Trend by Department and by Equipment. 25
Related Topics
Production Slippage Trend, page 6-12
Batch Performance
The Batch Performance page displays performance metrics that include Work Order Quantity Variance, PPM, Batch Cycle Time Trend, and Service Level Performance. Reporting regions include:
• Production Variance by Product Category • Production Variance by Product • PPM Trend (Month to Date) • Batch Cycle Time Trend (Month to Date) • Service Level Performance by Product Category • Service Level Performance by Product You can view Batch Performance by the following dimensions: • Time dimension – Year, Quarter, Month, and Day • Equipment dimension – Plant and Product Category To view Batch Performance:
1. Navigate to the Batch Performance page to view production variance. You can view production variance by Product Category and by Product. 6-26
2. In the Production Variance By Product region, you can click on a Work Order Quantity Variance Percent bar within the bar graph to view work order contributing details. 3. Scroll down the Batch Performance page to view PPM Trend (Month to Date) and Batch Cycle Time Trend (Month to Date) regions. 4. Continue to scroll down the page to also view Service Level Performance by Product Category and by Product. 27
Batch Performance Detail
The Batch Performance page allows you to navigate to the Batch Performance Detail page. From the Batch Performance Details page, you can view details of specific work orders that are contributing to the production variance.
To view Batch Performance Detail:
1. Navigate to the Batch Performance page.

2. In the Production Variance By Product region, you can click on a Work Order Quantity Variance Percent bar within the bar graph to view work order contributing details. The page displays details of work orders that contribute to the production variance for the product. 3. Select the Batch Performance link at the bottom of the page to navigate back to the Batch Performance page. Related Topics
Batch Performance, page 6-26
29
Sustainability Performance by Department
The Sustainability Performance by Department page displays the electricity consumption, electricity cost, and carbon emission for all departments in a plant.
To view the Sustainability Performance by Department page :
1. Navigate to the Plant Manager dashboard using the Manufacturing Operations Center User responsibility. Select the Sustainability Aspect tab. 2. Select the time period for which you want to view the details. Choose the Year, Quarter, Period, Week, and Date. All Choices displays as the default value for all the time period fields. 3. Select the Plant for which you want to display the reports. All production sites from the Site master display in the list of values. The first site in ascending alphabetical order of Sites is the default value. 4. Click Go. The Sustainability Performance by Department Appears. The following Plant Characteristics display: • Plant • Business Function is the business function of the plant. • Headcount is the number of employees in the plant • Area is the area of the plant. • Area UOM is the unit of measure in which Area is expressed. 5. Scroll down the page to view the following reports for each department in the plant: • Electricity Consumption • Electricity Cost • CO2 Emission • Production Value Analysis by Product • Trend •
Ranking and Distribution Electricity Consumption:
6-30

• Department is the name of the department of the plant. You can click on a department to view reports on the equipment in the department. • Business Function is the business function of the department • Area is the area of the department. • Headcount is the number of employees working in the department. • Direct Actual Consumption- Period to Date is the actual electricity consumed by the department in a specific time period for production purposes. • Indirect Actual Consumption- Period to Date is the actual electricity consumed by the department in a specific time period for non-production purposes. For example, lighting, air-conditioning, and water treatment systems. • Total Actual Consumption – Period to Date is the sum of Direct and Indirect Actual Consumption. • Plan Consumption- Period to Date is the planned electricity to be consumed by the department. • Last Year Consumption – Period Date is the electricity consumed by the department in the same time period of the previous year. • % Change (Plan) is the percentage deviation of actual consumption from planned electricity consumption by the department. A red flag displays when the value is more than zero. • % Change (Last Year) is the percentage deviation of actual electricity usage by the department in the period of the current year from that of the last year. A red flag displays when the value is more than zero. • Actual Consumption Per Unit Area is the actual electricity consumed per unit area of the department. • Actual Consumption Per Person is the actual electricity consumed per person in the department. • Electricity Consumption UOM is the unit of measure in which electricity consumption is expressed. •

Area UOM is the unit of measure in which the department area is expressed. Electricity Cost:
• Actual Cost -Period to Date is the cost of actual electricity consumed by the department in a specific time period. 31

• Plan Cost- Period to Date is the cost of planned electricity to be consumed by the department in a specific time period. • Last Year Cost – Period Date is the cost of electricity consumed by the department in the same time period of the previous year. • % Change (Plan) is the percentage deviation of cost of actual electricity consumption from planned electricity consumption by the department. A red flag displays when the value is more than zero. • % Change (Last Year) is the percentage deviation of cost of actual electricity usage by the department in the period of the current year from that of the last year. A red flag displays when the value is more than zero. • Actual Cost Per Unit Area is the cost of actual electricity consumed per unit area of the department. • Actual Cost Per Person is the cost of actual electricity consumed per person in the department. CO2 Emission
• Actual Emission-Period to Date is the carbon emission based on electricity consumption by the department in a specific time period. • Plan Emission-Period to Date is planned emissions based on electricity consumption by the department. • Last Year Emission-Period Date is emission based on electricity consumed by the department in the same time period of the previous year. • % Change (Plan) is the percentage deviation of actual from planned emissions by the department. A red flag displays when the value is more than zero. • % Change (Last Year) is the percentage deviation of actual emission by the department in the period of the current year from that of the last year. A red flag displays when the value is more than zero. • Actual Emission Per Unit Area is the actual emission per unit area of the department. • Actual Emission Per Person is the emission per person in the department. 6-32
Production Value Analysis by Product:
The Production Value Analysis by Product report provides information on the actual electricity consumed, cost of electricity consumed, and carbon emissions due to the consumption per production output of the department.
• Product is the product name. • Production Value is the value of the produced product. • Actual Electricity Consumption-Period to Date is the actual electricity consumed for producing the product. • Actual Electricity Cost-Period to Date is the cost of the actual electricity consumed for producing the product. • Actual CO2 Emission – Period to Date is carbon emission based on electricity consumption by the department in a specific time period. • Actual Electricity Consumption per Unit Production Value is the actual electricity consumed by the department for the production of the value of one unit of production output. 33
• Actual Electricity Cost Per Unit Production Value is the cost of actual electricity consumed by the department for the production of the value of one unit of production output. • Actual CO2 Emission Per Unit Production Value is the CO2 emission based on actual electricity consumed by an entity for the production of the value of one unit of production output. • Electricity Consumption UOM is the unit of measure in which the electricity consumption is expressed. • CO2 Emission UOM is the unit of measure in which the CO2 emission is expressed. • Currency UOM is the currency in which the Production Value is expressed. Trend:
The Trend graph report provides a graphical representation of the electricity consumption, electricity cost, and CO2 emission for:
• All departments in a plant by the Trend by Period-All Departments report. • Each department in a plant by the Trend by Period-By Department report To view the trend graph report, select the report you want to view in the Measure field from the following options.
• Electricity Consumption • Electricity Consumption Per Unit Area • Electricity Consumption Per Person • Electricity Cost • Electricity Cost Per Unit Area • Electricity Cost Per Person • CO2 Emission 6-34

• CO2 Emission Per Unit Area • CO2 Emission Per Person Ranking and Distribution:
The Ranking and Distribution report provides a graphical representation of the department rankings and distributions based on electricity consumption, cost, and CO2 emission.
To view the Ranking and Distribution report select any one of the following KPIs in the Measure field for which you want to view the report:
• Electricity Consumption • Electricity Consumption Per Unit Area • Electricity Consumption Per Person • Electricity Cost • Electricity Cost Per Unit Area • Electricity Cost Per Person • CO2 Emission • CO2 Emission Per Unit Area • CO2 Emission Per Person Site Ranking report displays the top five departments in the descending order for the selected measure.
Distribution by Department report displays the distribution of the selected measure across all departments of the plant.
Distribution by Usage Category displays the distribution of the selected measure across various usage categories for all departments at the plant, for example,
35
electricity consumption for air conditioning, lighting, production equipment etc.
Sustainability Performance by Equipment
You can view the electricity consumption, electricity cost, and carbon emission for all equipments in a department using the Sustainability Performance by Equipment page.
To view the sustainability performance by equipment page:
1. Navigate to the Sustainability Performance page. 2. Select a department from the Department column of the Electricity Consumption report. The Sustainability Performance page by Equipment displays. You can also change the time period and the Department for which you want to view the report or select All Choices to view the reports for all departments. 3. The following reports display: • Distribution and Trend region displays the following graph reports: • Distribution by Usage Categories graph provides the distribution of the selected measure across various usage categories for all equipment in the department. You can choose to view the report for the Measures, Electricity Consumption, CO2 Emission, and Electricity Cost. • Trend by Period- By Equipment graph provides the trend in electricity consumption, CO2 emission, and electricity cost by all equipments in a department over a specific time period. 6-36

• Department Summary region displays the following information for the department: • Equipment is the name of the equipment. • Department is the department in which the equipment is present. • Scrap % is the percentage of scrap expected for equipment. • Total Electricity Consumption is the actual electricity consumed by the equipment in the RUN, IDLE, DOWN, and OFF statuses. • Value Added Electricity Consumption is the actual electricity consumed by the equipment in the RUN status. • Non- Value Added Electricity Consumption is the electricity consumed by the equipment in the IDLE, DOWN, or OFF statuses. • Value Added Electricity % is the percentage of the Value Added Consumption per Total consumption for an entity. • CO2 Emission is the actual CO2 emission by the equipment. • Overall Equipment Effectiveness is calculated by multiplying Availability Ratio, Performance Ratio, and First Pass Yield for an equipment. Sustainability Performance Equipment Hourly Summary Page
You can view the electricity consumption, electricity cost, equipment output, and
37
carbon emission for hourly time periods for equipment in a plant using the Sustainability Performance Equipment Hourly Summary Page.
To view the sustainability performance equipment hourly summary page:
1. Navigate to the Sustainability Performance tab. The Sustainability Performance by Department displays. 2. Select a department from the Department column of the Electricity Consumption report. The Sustainability Performance page by Equipment displays. 3. Select equipment in the Equipment Summary report. The Sustainability Performance by Equipment Hourly Summary displays. You can also change the time period and the Equipment for which you want to view the reports or select All Choices to view the reports for all equipments. 4. The following reports display for the equipment: • Electricity Consumption Trend report is a graphical representation of the trend in electricity consumption of the equipment in hourly time intervals. • Equipment Output Trend report is a graphical representation of the trend in output production and the scrap quantity recorded for the equipment during shifts. • Parameter Monitoring report is a graphical representation of the measures of parameters like temperature and pressure over hourly time periods. 6-38
• Equipment Status Trend is a graphical representation of the trend in which an equipment is in Idle, Run, Down, and Off statuses over hourly time periods. You can choose to display a Bar or Area Graph. • Equipment Summary report is a tabular representation of the durations for which the equipment is in the Idle, Run, Down and Off statuses over hourly time periods. Sustainability Performance Equipment Hourly Detail Page
You can view the detailed information on electricity consumption, electricity cost, equipment output, and carbon emission for an equipment in a specific hourly time period using the Sustainability Performance Equipment Hourly Detail Page.
39

To view the Sustainability Performance Equipment Hourly Detail page:
1. Navigate to the Equipment Summary region of the Equipment Hourly Summary page. 2. Click the From Time to view the equipment detail reports for the equipment within a specific hour. The Equipment Hourly Detail page appears. 3. The following reports display for the equipment within the selected hour: • Electricity Consumption Detail Trend graphically displays the electricity consumption by the equipment within the selected hour. • CO2 Emission Detail Trend graphically displays the carbon emission by the equipment within the selected hour. • Equipment Status Trend graphically displays the times for which the equipment is in the Up, Idle, Down, and Off Statuses within the selected hour. • Production Output Trend graphically displays the product output quantity and scrap quantity produced by the equipment within the selected hour. 6-40
Facilities Manager Dashboard
Overview of the Facilities Manager Dashboard
Oracle Manufacturing Operations Center provides new capabilities to accelerate sustainability improvements of companies focusing on manufacturing, innovation, or services.
Oracle Manufacturing Operations Center can directly connect to smart meters and environmental management systems to collect real time energy consumption and green house gases emission data in both manufacturing and non-manufacturing facilities of enterprises across all industries.
The Sustainability Sensor Data Management system of Oracle MOC provides the Facilities Manager dashboard with built-in Key Performance Indicators (KPIs) that help you:
• Monitor and analyze energy consumption, energy cost, and carbon emissions. • Identify specific opportunities for improving energy efficiency and reducing carbon emissions. • Directly integrate with smart meters, environmental management systems, and building automation systems, and collect energy consumption, and emissions data. • Leverage as a certifiable data repository for reporting energy usage. • Upload data through spreadsheets at any desired frequency and at any level of granularity, in cases where energy information is not available through meters or other sensors. The Facilities Manager dashboard and the integrated reports provide the facility manager with information on the electricity consumption, electricity cost, and carbon emissions at the following five seeded levels of a facility hierarchy:
• Site Facilities Manager Dashboard 7-1

• Building • Floor • Floor Section • Equipment You can also define hierarchies based on your requirements. Understanding the Summary Page
The Summary page displays the electricity consumption, electricity cost, and carbon emission for all the sites in an enterprise.
To view the Summary page:
1. Navigate to the Facilities Manager dashboard using the Manufacturing Operations Center User responsibility. The Summary page displays. 2. Select the time period for which you want to view the details. Choose the Year, Quarter, Period, Week, and Date. All Choices displays as the default value for all the time period fields. Click Go. The following regions display for the enterprise: Electricity Consumption
• Site is the name of the site in the enterprise. You can click on a site to view the Site reports. Refer to the "Understanding Site Page" topic for a detailed description of the site page. • Plan vs Actual-Period to Date is the difference in the planned electricity consumption and actual electricity in a specific time period. A dial displays as red when the difference is greater than zero and as green when the difference is lesser than or equal to zero • Business Function is the business function of the site. • Area is the area of the site. • Headcount is the number of employees working at the site • Actual Consumption- Period to Date is the actual electricity consumed by the site in a specific time period. •

Plan Consumption- Period to Date is the planned electricity to be consumed by the site for the time period. • Last Year Consumption – Period Date is the electricity consumed by the site in 7-2
the same time period of the previous year.
• % Change (Plan) is the percentage deviation of actual consumption from planned electricity consumption by the site. A red flag displays when the value is more than zero. • % Change (Last Year) is the percentage deviation of actual electricity usage by the site in the period of the current year from that of the last year. A red flag displays when the value is more than zero. • Actual Consumption Per Unit Area is the actual electricity consumed per unit area of the site. • Actual Consumption Per Person is the actual electricity consumed per person in the site. • Electricity Consumption UOM is the unit of measure in which electricity is consumed. • Area UOM is the unit of measure for the site area. Electricity Cost
• Actual Cost - Period to Date is the cost of the actual electricity consumed by the site in a specific time period. • Plan Cost- Period to Date is the cost of planned electricity to be consumed by the site in a specific time period. • Last Year Consumption – Period Date is the cost of electricity consumed by the site in the same time period of the previous year. • % Change (Plan) is the percentage deviation of cost of actual electricity consumption from planned electricity consumption by the site. A red flag displays when the value is more than zero. • % Change (Last Year) is the percentage deviation of cost of actual electricity Facilities Manager Dashboard 7-3
usage by the site in the period of the current year from that of the last year. A red flag displays when the value is more than zero.
• Actual Cost Per Unit Area is the cost of actual electricity consumed per unit area of the site. • Actual Cost Per Person is the cost of actual electricity consumed per person in the site. CO2 Emission
• Actual Emission-Period to Date is the carbon emission based on electricity consumption by the site in a specific time period. • Plan Emission- Period to Date is planned emissions based on electricity consumption by the site. • Last Year Emission-Period Date is emission based on electricity consumed by the site in a specified period of the previous year. • % Change (Plan) is the percentage deviation of actual from planned emissions by the site. A red flag displays when the value is more than zero. • % Change (Last Year) is the percentage deviation of actual emission by the site in the period of the current year from that of the last year. A red flag displays when the value is more than zero. • Actual Emission Per Unit Area is the actual emission per unit area of the site. • Actual Emission Per Person is the emission per person in the site. 7-4

Trend
The Trend graph reports provide a graphical representation of the electricity consumption, electricity cost, and CO2 emission of all sites in an enterprise and also for each site of the enterprise for a specific time period.
To view the Trend Graph Report:
1. Scroll down the Summary page. You can view the following reports: • Trend by Period- All Sites displays the report for all sites of the enterprise. • Trend by Period- By Site displays the report for each site of the enterprise. 2. To view the Trend by Period- All Sites, select the Period for which you want to view the reports. Options are: Year, Quarter, Period, Week, and Date. 3. Select the report you want to view in the Measure field. Options are: Electricity Consumption, Electricity Cost, and CO2 Emission. 4. To view the Trend by Period- By Site, select the Period for which you want to view the reports. Options are: Year, Quarter, Period, Week, and Date. 5. Select the report you want to view in the Measure field: • Electricity Consumption • Electricity Cost • CO2 Emission Facilities Manager Dashboard 7-5
Ranking and Distribution
The Ranking and Distribution report provides a graphical representation of the site rankings and distributions based on electricity consumption, cost, and CO2 emission.
To view the Ranking and Distribution report:
1. Scroll down the Summary page to the Ranking and Distribution region. Select any one of the following KPIs in the Measure field for which you want to view the report: • Electricity Consumption • Electricity Consumption Per Unit Area • Electricity Consumption Per Person • Electricity Cost • Electricity Cost Per Unit Area • Electricity Cost Per Person • CO2 Emission • CO2 Emission Per Unit Area • CO2 Emission Per Person 2. The Site Ranking report displays the top five sites in a descending order for the selected measure. 3. The Distribution by Site report displays the distribution of the selected measure across all sites of the enterprise. 4. The Distribution by Usage Category displays the distribution of the selected 7-6

measure across various usage categories at all sites, for example, electricity consumption for air conditioning, lighting, production equipment etc.
Understanding the Site Page
The Site page displays the electricity consumption, electricity cost, and carbon emission for all the buildings of a site. You can also choose to view information for a single building.
To view the Site page:
1. Navigate to the Facilities Manager dashboard using the Manufacturing Operations Center User responsibility. The Summary page displays. 2. Select the Site tab or click on a site in the Site field of the Summary page. The Site page appears. 3. Select the time period for which you want to view the details. Options are: Year, Quarter, Period, Week, and Date. Year displays the current year by default. All Choices displays as the default value for Quarter, Period, Week, and Date time periods. 4. Select the Site for which you want to view reports. A list of sites from the Site Master displays. If you navigate to the site page using the Site tab, then the first Site in ascending alphabetical order of Site names displays as the default value. 5. Select the Building for which you want to view report from a list of buildings of the site. 6. Click Go. The header region of the page displays the following Site Characteristics: • Building • Business Function is business function of the building. • Area is the area of the building. Facilities Manager Dashboard 7-7
• Headcount is the number of employees working in the building. 7. The following information displays for a site: Electricity Consumption
• Actual Consumption- Period to Date is the actual electricity consumed by the building in a specific time period. • Plan Consumption- Period to Date is the planned electricity to be consumed by the building in the specific time period. • Last Year Consumption – Period Date is the electricity consumed by the building in the same time period of the previous year. • % Change (Plan) is the percentage deviation of actual consumption from planned electricity consumption by the building. A red flag displays when the value is more than zero. • % Change (Last Year) is the percentage deviation of actual electricity usage by the building in the period of the current year from that of the last year. A red flag displays when the value is more than zero. • Actual Consumption Per Unit Area is the actual electricity consumed per unit area of the building. • Actual Consumption Per Person is the actual electricity consumed per person in the building. • Electricity Consumption UOM is the unit of measure in which electricity is consumed. • Area UOM is the unit of measure for the building area. Electricity Cost
• Actual Cost-Period to Date is the cost of the actual electricity consumed by the building in a specific time period. • Plan Cost-Period to Date is the cost of planned electricity to be consumed by the building in a specific time period. •
Last Year Consumption-Period Date is the cost of electricity consumed by the building in the same time period of the previous year. • % Change (Plan) is the percentage deviation of cost of actual electricity consumption from planned electricity consumption by the building. A red flag displays when the value is more than zero. 7-8
• % Change (Last Year) is the percentage deviation of cost of actual electricity usage by the building in the period of the current year from that of the last year. A red flag displays when the value is more than zero. • Actual Cost Per Unit Area is the cost of actual electricity consumed per unit area of the building. • Actual Cost Per Person is the cost of actual electricity consumed per person in the building. CO2 Emission
• Actual Emission - Period to Date is the carbon emission based on electricity consumption by the building in a specific time period. • Plan Emission- Period to Date is planned emissions based on electricity consumption by the building. • Last Year Emission – Period Date is emission based on electricity consumed by the building in a specified period of the previous year. • % Change (Plan) is the percentage deviation of actual from planned emissions by the building. A red flag displays when the value is more than zero. • % Change (Last Year) is the percentage deviation of actual emission by the building in the period of the current year from that of the last year. A red flag displays when the value is more than zero. • Actual Emission Per Unit Area is the actual emission per unit area of the building. • Actual Emission Per Person is the emission per person in the building. Trend Graph Reports
The Trend graph reports provide a graphical representation of the electricity consumption, electricity cost, and CO2 emission of all buildings at a site and also for each building of the site for a specific time period.
To view the Trend Graph Report:
1. Navigate to the Site page. You can view the following reports:
• Trend by Period- All Buildings displays the report for all buildings of the site. • Trend by Period- By Building displays the report for each building of the site. 2. To view the Trend by Period- All Buildings and Trend by Period-By Building Facilities Manager Dashboard 7-9
reports, select the Period for which you want to view the reports. Options are: Year, Quarter, Period, Week, and Date.
3. Select the report you want to view in the Measure field: • Electricity Consumption • Electricity Consumption Per Unit Area • Electricity Consumption Per Person • Electricity Cost • Electricity Cost Per Unit Area • Electricity Cost Per Person • CO2 Emission • CO2 Emission Per Unit Area • CO2 Emission Per Person Ranking and Distribution
The Ranking and Distribution report provides a graphical representation of the building rankings and distributions based on electricity consumption, cost, and CO2 emission.
To view the Ranking and Distribution report:
1. Navigate to the Site page. 2. Scroll down to the Ranking and Distribution page. Select any one of the following KPIs in the Measure field for which you want to view the report: • Electricity Consumption • Electricity Consumption Per Unit Area • Electricity Consumption Per Person • Electricity Cost • Electricity Cost Per Unit Area • Electricity Cost Per Person • CO2 Emission
7-10

• CO2 Emission Per Unit Area • CO2 Emission Per Person 3. The Building Ranking report displays the top five buildings in a descending order for the selected measure. 4. The Distribution by Building report displays the distribution of the selected measure across all buildings of the site. 5. The Distribution by Usage Category displays the distribution of the selected measure across various usage categories for all the buildings at the site, for example, electricity consumption for air conditioning, lighting, production equipment etc. Understanding the Building Page
The Building page displays the electricity consumption, electricity cost, and carbon emission for all the floors in a building. You can also choose to view information for a single floor.
To view the Building page:
1. Navigate to the Facilities Manager dashboard using the Manufacturing Operations Center User responsibility. The Summary page displays. 2. Select the Building tab or click on a building in the Building field of the Site page. The Building page appears. 3. Select the time period for which you want to view the details. Choose the Year, Quarter, Period, Week, and Date. Year displays the current year by default. All Choices displays as the default value for Quarter, Period, Week, and Date time periods. 4. Select the Site, Building, and Floor for which you want to view reports. All the floors in the building display in the list of values of the Floor field. 5. Click Go. The header region of the page displays the Building Characteristics. The following information displays for the building:
• Building • Business Function is business function of the floor. • Area is the area of the floor. Facilities Manager Dashboard 7-11
• Area UOM is the unit of measure in which the building area is expressed. • Headcount is the number of employees working on the floor. Electricity Consumption
• Floor is the name of the floor. • Actual Consumption- Period to Date is the actual electricity consumed by the floor in a specific time period. • Plan Consumption- Period to Date is the planned electricity to be consumed by the floor in the specific time period. • Last Year Consumption – Period Date is the electricity consumed by the floor in the same time period of the previous year. • % Change (Plan) is the percentage deviation of actual consumption from planned electricity consumption by the floor. A red flag displays when the value is more than zero. • % Change (Last Year) is the percentage deviation of actual electricity usage by the floor in the period of the current year from that of the last year. A red flag displays when the value is more than zero. • Actual Consumption Per Unit Area is the actual electricity consumed per unit area of the floor. • Actual Consumption Per Person is the actual electricity consumed per person in the floor. Electricity Cost
• Actual Cost - Period to Date is the cost of the actual electricity consumed by the floor in a specific time period. • Plan Cost- Period to Date is the cost of planned electricity to be consumed by the floor in a specific time period. • Last Year Consumption – Period Date is the cost of electricity consumed by the floor in the same time period of the previous year. •
% Change (Plan) is the percentage deviation of cost of actual electricity consumption from planned electricity consumption by the floor. A red flag displays when the value is more than zero. • % Change (Last Year) is the percentage deviation of cost of actual electricity usage by the floor in the period of the current year from that of the last year. A 7-12

red flag displays when the value is more than zero.
• Actual Cost Per Unit Area is the cost of actual electricity consumed per unit area of the floor. • Actual Cost Per Person is the cost of actual electricity consumed per person in the floor. CO2 Emission
• Actual Emission -Period to Date is the carbon emission based on electricity consumption by the floor in a specific time period. • Plan Emission- Period to Date is planned emissions based on electricity consumption by the floor. • Last Year Emission – Period Date is emission based on electricity consumed by the floor in a specified period of the previous year. • % Change (Plan) is the percentage deviation of actual from planned emissions by the floor. A red flag displays when the value is more than zero. • % Change (Last Year) is the percentage deviation of actual emission by the floor in the period of the current year from that of the last year. A red flag displays when the value is more than zero. • Actual Emission Per Unit Area is the actual emission per unit area of the floor. • Actual Emission Per Person is the emission per person in the floor. Trend
The Trend graph reports provide a graphical representation of the electricity consumption, electricity cost, and CO2 emission of all floors at a building and also for each floor of the building for a specific time period.
To view the Trend Graph Report:
1. Scroll down to the Trend region. You can view the following reports: • Trend by Period- All Floors displays the report for all floors of the building. • Trend by Period- By Floor displays the report for each floor of the building.
2. To view the Trend by Period- All Floors and Trend by Period-By Floor reports, select the Period for which you want to view the reports. Options are: Year, Quarter, Period, Week, and Date. Facilities Manager Dashboard 7-13

3. Select the report you want to view in the Measure field: • Electricity Consumption • Electricity Consumption Per Unit Area • Electricity Consumption Per Person • Electricity Cost • Electricity Cost Per Unit Area • Electricity Cost Per Person • CO2 Emission • CO2 Emission Per Unit Area • CO2 Emission Per Person Ranking and Distribution
The Ranking and Distribution report provides a graphical representation of the floor rankings and distributions based on energy consumption, cost, and CO2 emission.
To view the Ranking and Distribution report:
1. Scroll down to the Ranking and Distribution page. Select any one of the following KPIs in the Measure field for which you want to view the report: • Electricity Consumption • Electricity Consumption Per Unit Area • Electricity Consumption Per Person • Electricity Cost • Electricity Cost Per Unit Area • Electricity Cost Per Person • CO2 Emission • CO2 Emission Per Unit Area • CO2 Emission Per Person 7-14

2. The Building Ranking report displays the top five floors in a descending order for the selected measure. 3. The Distribution by Building report displays the distribution of the selected measure across all floors of the building. 4. The Distribution by Usage Category displays the distribution of the selected measure across various usage categories at all floors of the building, for example, electricity consumption for air conditioning, lighting, production equipment etc. Understanding the Floor Page
The Floor page displays the electricity consumption, electricity cost, and carbon emission for all the floor sections on a floor. You can also choose to view information for a single floor section.
To view the Floor page:
1. Navigate to the Facilities Manager dashboard using the Manufacturing Operations Center User responsibility. The Summary page displays. 2. Select the Floor tab or click on a floor in the Floor field of the Building page. The Floor page appears. 3. Select the time period for which you want to view the details. Choose the Year, Quarter, Period, Week, and Date. Year displays the current year by default. All Choices displays as the default value for Quarter, Period, Week, and Date time periods. 4. Select the Site, Building, Floor, and Floor Section for which you want to view reports. All the floor sections of the floor display in the list of values of the Floor Section field. 5. Click Go. The header region of the page displays the Floor Characteristics. The following information displays for the building: • Floor •
Business Function is business function of the floor. • Area is the area of the floor. • Area UOM is the unit of measure in which the floor area is expressed. • Headcount is the number of employees working on the floor. Electricity Consumption
Facilities Manager Dashboard 7-15

• Floor Section is the name of the floor section. • Actual Consumption- Period to Date is the actual electricity consumed by the floor section in a specific time period. • Plan Consumption- Period to Date is the planned electricity to be consumed by the floor section in the specific time period. • Last Year Consumption – Period Date is the electricity consumed by the floor section in the same time period of the previous year. • % Change (Plan) is the percentage deviation of actual consumption from planned electricity consumption by the floor section. A red flag displays when the value is more than zero. • % Change (Last Year) is the percentage deviation of actual electricity usage by the floor section in the period of the current year from that of last year. A red flag displays when the value is more than zero. • Actual Consumption Per Unit Area is the actual electricity consumed per unit area of the floor section. • Actual Consumption Per Person is the actual electricity consumed per person in the floor section. Electricity Cost
• Actual Cost -Period to Date is the cost of the actual electricity consumed by the floor section in a specific time period. • Plan Cost- Period to Date is the cost of planned electricity to be consumed by the floor section in a specific time period. • Last Year Consumption – Period Date is the cost of electricity consumed by the floor section in the same time period of the previous year. • % Change (Plan) is the percentage deviation of cost of actual electricity consumption from planned electricity consumption by the floor section. A red flag displays when the value is more than zero. •
% Change (Last Year) is the percentage deviation of cost of actual electricity usage by the floor section in the period of the current year from that of the last year. A red flag displays when the value is more than zero. • Actual Cost Per Unit Area is the cost of actual electricity consumed per unit area of the floor section. 7-16
• Actual Cost Per Person is the cost of actual electricity consumed per person in the floor section. CO2 Emission
• Actual Emission - Period to Date is the carbon emission based on electricity consumption by the floor section in a specific time period. • Plan Emission- Period to Date is planned emissions based on electricity consumption by the floor section. • Last Year Emission – Period Date is emission based on electricity consumed by the floor section in a specified period of the previous year. • % Change (Plan) is the percentage deviation of actual from planned emissions by the floor section. A red flag displays when the value is more than zero. • % Change (Last Year) is the percentage deviation of actual emission by the floor section in the period of the current year from that of the last year. A red flag displays when the value is more than zero. • Actual Emission Per Unit Area is the actual emission per unit area of the floor section. • Actual Emission Per Person is the emission per person in the floor section. Trend
The Trend graph reports provide a graphical representation of the electricity consumption, electricity cost, and CO2 emission of all floors sections on a floor and also for each floor section of the floor for a specific time period.
To view the Trend Graph Report:
1. Scroll down to the Trend region. You can view the following reports: • Trend by Period- All Floor Sections displays the report for all floor sections of the floor. • Trend by Period- By Floor section displays the report for each floor section of
the floor. 2. To view the Trend by Period- All Floor Sections and Trend by Period – By Floor Section reports, select the Period for which you want to view the reports. Options are: Year, Quarter, Period, Week, and Date. 3. Select the report you want to view in the Measure field: Facilities Manager Dashboard 7-17
• Electricity Consumption • Electricity Cost • CO2 Emission Ranking and Distribution
The Ranking and Distribution report provides a graphical representation of the floor section rankings and distributions based on energy consumption, cost, and CO2 emission.
To view the Ranking and Distribution report:
1. Scroll down to the Ranking and Distribution page. Select any one of the following KPIs in the Measure field for which you want to view the report: • Electricity Consumption • Electricity Consumption Per Unit Area • Electricity Consumption Per Person • Electricity Cost • Electricity Cost Per Unit Area • Electricity Cost Per Person • CO2 Emission • CO2 Emission Per Unit Area • CO2 Emission Per Person 2. The Floor Ranking report displays the top five floors in a descending order for the selected measure. 3. The Distribution by Floor report displays the distribution of the selected measure across all floors of the building. 4. The Distribution by Usage Category displays the distribution of the selected measure across various usage categories on all the floor sections of the floor, for example, electricity consumption for air conditioning, lighting, production equipment etc.
7-18
Understanding the Floor Section Page
The Floor Section page displays the electricity consumption, electricity cost, and carbon emission for all equipments in a floor section. You can also choose to view information for single equipment.
To view the Floor Section page:
1. Navigate to the Facilities Manager dashboard using the Manufacturing Operations Center User responsibility. The Summary page displays. 2. Select the Floor Section tab or click on a floor section in the Floor Section field of the Floor page. The Floor Section page appears. 3. Select the time period for which you want to view the details. Choose the Year, Quarter, Period, Week, and Date. Year displays the current year by default. All Choices displays as the default value for Quarter, Period, Week, and Date time periods. 4. Select the Site, Building, Floor, Floor Section, and Equipment for which you want to view reports. All the equipment on the floor section display in the list of values of the Equipment field. 5. Click Go. The header region of the page displays the Floor Section Characteristics. The following information displays for the floor section: • Floor Section • Business Function is business function of the floor section. • Area is the area of the floor section. • Area UOM is the unit of measure in which the floor section area is expressed. • Headcount is the number of employees working on the floor section. Equipment Summary
• Equipment is the name of the equipment. • Actual Consumption- Period to Date is the actual electricity consumed by the

equipment in a specific time period. • Plan Consumption- Period to Date is the planned electricity to be consumed by the equipment in the specific time period. • Last Year Consumption – Period Date is the electricity consumed by the Facilities Manager Dashboard 7-19

equipment in the same time period of the previous year.
• % Change (Plan) is the percentage deviation of actual consumption from planned electricity consumption by the equipment. A red flag displays when the value is more than zero. • % Change (Last Year) is the percentage deviation of actual electricity usage by the equipment in the period of the current year from that of the last year. A red flag displays when the value is more than zero. • Actual Emission -Period to Date is the carbon emission based on electricity consumption by the equipment in a specific time period. • Plan Emission- Period to Date is planned emissions based on electricity consumption by the equipment. • Last Year Emission – Period Date is emission based on electricity consumed by the equipment in a specified period of the previous year. Trend
The Trend graph reports provide a graphical representation of the electricity consumption, electricity cost, and CO2 emission of all equipments on a floor and also for a single equipment of the floor section for a specific time period.
To view the Trend Report:
1. Scroll down to the Trend region. You can view the following reports: • Trend by Period- All Equipments displays the report for all equipments of the floor section. • Trend by Period- By Equipment displays the report for an equipment of the floor section. 2. To view the Trend by Period- All Equipments and Trend by Period – By Equipment reports, select the Period for which you want to view the reports. Options are: Year, Quarter, Period, Week, and Date. 3. Select the report you want to view in the Measure field: • Electricity Consumption
• Electricity Cost • CO2 Emission Ranking and Distribution
7-20

The Ranking and Distribution report provides a graphical representation of the equipment rankings and distributions based on energy consumption, cost, and CO2 emission.
To view the Ranking and Distribution report:
1. Scroll down to the Ranking and Distribution page. Select any one of the following KPIs in the Measure field for which you want to view the report: • Electricity Consumption • Electricity Cost • CO2 Emission 2. The Equipment Ranking report displays the top five equipments in a descending order for the selected measure. 3. The Distribution by Equipment report displays the distribution of the selected measure across all equipments of the floor section. 4. The Distribution by Usage Category displays the distribution of the selected measure across various usage categories for all equipments on a floor section, for example, electricity consumption for air conditioning, lighting, production equipment etc. Equipment Hourly Summary Page
You can view the electricity consumption, electricity cost, equipment output, and carbon emission for hourly time periods for equipment using the Equipment Hourly Summary Page.
To view the Equipment Hourly Summary page:
1. Navigate to the Equipment Summary region of the Floor Section page. Click in the Equipment field to view reports for an equipment. The Equipment Hourly Summary page appears. 2. Select the report you want to view using the following options for time and entity: • Year, Quarter, Period, Week, and Date
• Site, Building, Floor, Floor Section, and Equipment 3. The following reports display for the equipment: Facilities Manager Dashboard 7-21
• Electricity Consumption Trend report is a graphical representation of the trend in electricity consumption of the equipment in hourly time intervals. • Parameter Monitoring report is a graphical representation of the measures of parameters like temperature and pressure over hourly time periods. To view the report:
• Select Actual as Temperature or Pressure • Select Specification as Temperature or Pressure. If you select Actual as Pressure, then you must also select the Specification as Pressure. The graph report displays the values of measured parameter over specified time periods with respect to the graphs of the Upper and Lower limits of the specifications. Refer to the topic "Creating Attribute Groups" in the Oracle Manufacturing Operations Center Implementation Guide for more information on specifications. 7-22
• Equipment Status Trend is a graphical representation of the trend in which an equipment is in Idle, Run, Down, and Off statuses over hourly time periods. You can choose to display a Bar or Area Graph. • Equipment Summary report is a tabular representation of the durations for which the equipment is in the Idle, Run, Down and Off statuses over hourly time periods. The report displays the following information:
• From Time and To Time is the hourly time period • Run Time (Hrs) is the time in hours for which the equipment is in Run status. • Idle Time (Hrs) is the time in hours for which the equipment is in Idle status. Facilities Manager Dashboard 7-23

• Down Time (Hrs) is the time in hours for which the equipment is in Down status. • Off Time (Hrs) is the time in hours for which the equipment is in Off status. • Electricity Consumption is electricity consumed by the equipment for the time range. Equipment Hourly Detail Page
You can view the detailed information on electricity consumption, electricity cost, equipment output, and carbon emission for an equipment in a specific hourly time period using the Sustainability Performance Equipment Hourly Detail Page.
To view the Equipment Hourly Detail page:
1. Navigate to the Equipment Summary region of the Equipment Hourly Summary page. 2. Click the From Time to view the equipment detail reports for the equipment within a specific hour. The Equipment Hourly Detail page appears. 3. The following reports display for the equipment within the selected hour: • Electricity Consumption Detail Trend graphically displays the electricity consumption by the equipment within the selected hour. • CO2 Emission Detail Trend graphically displays the carbon emission by the equipment within the selected hour. • Equipment Status Trend graphically displays the times for which the equipment is in the Up, Idle, Down, and Off Statuses within the selected hour. 7-24
MOC and Oracle Enterprise Asset Management (eAM) Integration
This chapter covers the following topics:
• Overview Overview
Oracle Manufacturing Operations Center (MOC) and Oracle Enterprise Asset Management (eAM) integration provides effective coordination between production and maintenance departments to achieve greater utilization of equipment on the shop floor. This is achieved by the rapid exchange of information related to equipment. Examples include down or idle condition of equipment, or equipment exceeding control parameters. MOC initiates actions based on events and alerts captured from shop floor equipment and passes the actions to the specific roles, such as the Maintenance Supervisor. MOC also receives the expected and actual uptime from the maintenance department that assists the planner or scheduler to modify the production schedules according to equipment availability.
MOC and eAM integration:
• Reduces reaction time between event occurrence and the action/response • Improves scheduling based on equipment availability MOC and eAM integration supports:
• Configuration and collection of eAM specific objects including meter readings, events, and alarms from actual equipment in MOC • Process integration between MOC and eAM to meet the principles of Condition Based Maintenance (CBM) • Dashboards and KPI's designed for maintenance specific users and roles MOC and Oracle Enterprise Asset Management (eAM) Integration 8-1
• Manual or automatic actions based on events using Event Management Framework MOC and eAM integration is illustrated by the following process flow. It illustrates the integration of data coming from Shop floor devices using Event Management Framework.
Data coming from shop floor is collected using the OPC server provided by device partners (Kepware, Matricon or ILS).
MOC processes the data internally and externally. Processing data internally occurs when the data is collected from the OPC server into MOC, and is then processed. Within MOC, rules are defined using Oracle Warehouse Builder (OWB) pluggable mapping to generate events and allow users to acknowledge and manually trigger actions from the role-based dashboard. External processing of data does not involve MOC, and actions occur outside the boundary of MOC. However, the actions are the same for both internal and external processed events.
Actions include creating work requests, and sending email or mobile alert notifications.
8-2
Ad hoc Reports
Using Ad hoc Reports
Oracle Manufacturing Operations Center (MOC) enables you to build custom reports for analyzing process parameters like electricity consumption, pressure, temperature, etc. that are captured for equipments based on specifications setup. Oracle MOC provides the following seeded reports for ad hoc analysis and enables you to analyze electricity consumption and parameters like temperature or pressure for single or multiple entities in a specific time period or over multiple time periods:
• Single Entity Ad hoc Analysis Report • Multiple Entity Ad hoc Analysis Report • Compare Periods Ad hoc Analysis Report Single Entity Ad hoc Analysis Report
The Single Entity Ad hoc Analysis report enables you to analyze electricity consumption with parameters, Temperature or Pressure for a single entity and a single time period.
To run a single entity ad hoc analysis report:
1. Using the Manufacturing Operations Center User responsibility, click Ad hoc Analysis menu option. The Ad hoc Analysis page displays. 2. In the Single Entity tab, enter the following fields: • From Date and To Date to specify the time period for which you want to analyze the electricity consumption. • Entity Type. Options are: Building, Department, Equipment, Floor, Floor Ad hoc Reports 9-1
Section, Resource, Resource Group, and Site.
• Entity for which you want to analyze the electricity consumption. All entities of the selected entity type display. • Parameter as Temperature or Pressure. 3. Click Go. The Electricity Consumption and Parameter Monitoring graphical report displays electricity consumption and the parameter recordings Multiple Entities Ad hoc Analysis Report
The Multiple Entities Ad hoc Analysis report enables you to analyze electricity consumption or monitor temperature or pressure for multiple entities in a specified time period.
To run the Multiple Entities Ad hoc Analysis Report:
1. Using the Manufacturing Operations Center User responsibility, click Ad hoc Analysis menu option. The Ad hoc Analysis page displays. 2. Select the Multiple Entities tab and enter the following fields: • From Date and To Date to specify the time period for which you want to analyze the electricity consumption or monitor temperature or pressure. • Entity Type. Options are: Building, Department, Equipment, Floor, Floor Section, Resource, Resource Group, and Site. • Entities for which you want to analyze the electricity consumption or a parameter. All entities of the selected entity type display. • Parameter as Temperature, Pressure, or Electricity Consumption. 3. Click Go. The Electricity Consumption or Parameter Monitoring graphical report displays the electricity consumption or parameter readings for the selected entities for the specified time period. Compare Periods Ad hoc Analysis Report
The Compare Period Ad hoc Analysis report enables you to analyze electricity consumption and monitor temperature and pressure for an entity for multiple time periods.
9-2

To run the Compare Periods Ad hoc Analysis Report:
1. Using the Manufacturing Operations Center User responsibility, click Ad hoc Analysis menu option. The Ad hoc Analysis page displays. 2. Select the Compare Period tab and enter the following fields • Choose the time period. Options are Year, Quarter, Period, Week, and Day. • Entity Type. Options are: Building, Department, Equipment, Floor, Floor Section, Resource, Resource Group, and Site. • Entities for which you want to analyze the electricity consumption or a parameter. All entities of the selected entity type display. • Parameter as Temperature, Pressure, or Electricity Consumption. 3. Click Go. The Electricity Consumption or Parameter Monitoring graphical report displays the electricity consumption or parameter readings for the entity in the selected time period. Ad hoc Reports 9-3
A
Navigation
Brackets ([ ]) indicate a button or link.
Page Name Navigation Path Actual Meters Data Entry MOC User > Data Entry > Actual Meters Data Entry Add Attribute Groups for Batch Operation MOC Administrator > Extensible Attributes Workbench > Batch Operations > [select Entity Name link] > Classifications tab [Attribute Groups] > [Add Attribute Groups] Add Attribute Groups for Equipment MOC Administrator > Extensible Attributes Workbench > Equipment > [select Entity Name link] > Classifications tab [Attribute Groups] > [Add Attribute Groups] Add Attribute Groups for Item MOC Administrator > Extensible Attributes Workbench > Items > [select Entity Name link] > Classifications tab [Attribute Groups] > [Add Attribute Groups]
1

Page Name Navigation Path Add Attribute Groups for Others MOC Administrator > Extensible Attributes Workbench > Others > [select Entity Name link] > Classifications tab [Attribute Groups] > [Add Attribute Groups] Add Attribute Groups for Work Order MOC Administrator > Extensible Attributes Workbench > Work Orders > [select Entity Name link] > Classifications tab [Attribute Groups] > [Add Attribute Groups] Add Pages for Batch Operation MOC Administrator > Extensible Attributes Workbench > Batch Operations > [select Entity Name link] > Classifications tab [Pages] > [Add Pages for Batch Operation] > [Create Page] Add Pages for Equipment MOC Administrator > Extensible Attributes Workbench > Equipment > [select Entity Name link] > Classifications tab [Pages] > [Add Pages for Equipment] > [Create Page] Add Pages for Item MOC Administrator > Extensible Attributes Workbench > Items > [select Entity Name link] > Classifications tab [Pages] > [Add Pages for Item] > [Create Page] Add Pages for Others MOC Administrator > Extensible Attributes Workbench > Others > [select Entity Name link] > Classifications tab [Pages] > [Add Pages for Others] > [Create Page] Add Pages for Work Order MOC Administrator > Extensible Attributes Workbench >Work Orders > [select Entity Name link] > Classifications tab [Pages] > [Add Pages for Work Order] > [Create Page] Application Object Library Lookups Development Manager Responsibility > Lookups Asset Performance (OEE) MOC User > Manufacturing Operations Center Analytics > Plant Manager Dashboard
A-2
Page Name Navigation Path Asset Performance (OEE) by Equipment MOC User > Manufacturing Operations Center Analytics > Plant Manager Dashboard > [select a Bottom Performers Equipment Gauge] Attribute Group Details MOC Administrator > Extensible Attributes Workbench > [select Entity type] > [select Entity Name link] > Classifications tab [Attribute Groups] > [Add Attribute Groups] > [Display Name link] Attribute Groups for Batch Operation MOC Administrator > Extensible Attributes Workbench > Batch Operations > [select Entity Name link] > Classifications tab [Attribute Groups] Attribute Groups for Equipment MOC Administrator > Extensible Attributes Workbench > Equipment > [select Entity Name link] > Classifications tab [Attribute Groups] Attribute Groups for Item MOC Administrator > Extensible Attributes Workbench > Items > [select Entity Name link] >Classifications tab [Attribute Groups] Attribute Groups for Others MOC Administrator > Extensible Attributes Workbench > Others > [select Entity Name link] > Classifications tab [Attribute Groups] Attribute Groups for Work Order MOC Administrator > Extensible Attributes Workbench > Work Orders > [select Entity Name link] > Classifications tab [Attribute Groups] Batch Equipment Contextualization Update MOC Administrator > Setup > Contextualization Setup > [select records] > [Enter Context in Batch] Batch Operations Segments Overview MOC User > Extensible Attributes Data > Batch Operations > [select an Entity Name link] > Entity: Batch Operation select [Entity Name link]
3
Page Name Navigation Path Batch Operation Pages MOC Administrator > Extensible Attributes Workbench > Batch Operations > [select Entity Name link] > Classifications tab [Page] Batch Performance MOC User > Manufacturing Operations Center Analytics > Plant Manager Dashboard > [Batch Performance] Batch Performance Detail MOC User > Manufacturing Operations Center Analytics > Plant Manager Dashboard > [Batch Performance] > Production Variance by Product region > [select a Work Order Quantity Variance Bar within bar graph] Create Classification MOC Administrator > Extensible Attributes Workbench > Others > [Create] Downtime Reasons Entry MOC User > Tag Data Workbench > Equipment Downtime Reasons > [select data on Equipment Downtime Reason] > [select records] > [Enter Downtime Reason] Entity: Batch Operation MOC Administrator > Extensible Attributes Workbench > Batch Operations MOC User > Extensible Attributes Data > Batch Operations Entity: Batch Operation Classifications MOC Administrator > Extensible Attributes Workbench > Batch Operations > Entity: Batch Operation > [select Entity Name link] Entity: Equipment MOC Administrator > Extensible Attributes Workbench > Equipment MOC User > Extensible Attributes Data > Equipment Entity: Equipment Classifications MOC Administrator > Extensible Attributes Workbench > Equipment > Entity: Equipment > [select Entity Name link]
A-4
Page Name Navigation Path Entity: Item MOC Administrator > Extensible Attributes Workbench > Items MOC User > Extensible Attributes Data > Items Entity: Item Classifications MOC Administrator > Extensible Attributes Workbench > Items > Entity: Item > [select Entity Name link] Entity: Others MOC Administrator > Extensible Attributes Workbench > Others MOC User > Extensible Attributes Data > Others Entity: Others Classifications MOC Administrator > Extensible Attributes Workbench > Others > Entity: Others > [select Entity Name link] Entity: Work Order MOC Administrator > Extensible Attributes Workbench > Work Orders MOC User > Extensible Attributes Data > Work Orders Entity: Work Order Classifications MOC Administrator > Extensible Attributes Workbench > Work Orders > Entity: Work Order > [select Entity Name link] Equipment Contextualization Setup MOC Administrator > Setup > Contextualization Setup Equipment Downtime Analysis MOC User > Manufacturing Operations Center Analytics > Plant Manager Dashboard > [select a Bottom Performers Equipment Gauge] > [Overall Equipment Effectiveness Details Region] > [select a Machine Availability Value]
5
Page Name Navigation Path Equipment Downtime Reasons MOC User > Manufacturing Operations Center Analytics > Plant Manager Dashboard > [select a Bottom Performers Equipment Gauge] > Overall Equipment Effectiveness Details Region > [select Machine Availability Value] > [select Actual Downtime Hours value] Equipment Downtime Reason MOC User > Tag Data Workbench > Equipment Downtime Reasons Equipment Downtime Reasons Entry MOC User > Tag Data Workbench > Equipment Downtime Reasons > [Enter Downtime Reason] Equipment Downtime Reasons [View] MOC User > Tag Data Workbench > Equipment Downtime Reasons > [select data on Equipment Downtime Reason] > [select records] > [View Reason] Equipment Efficiency Analysis MOC User > Manufacturing Operations Center Analytics > Plant Manager Dashboard > [select a Bottom Performers Equipment Gauge] > [Overall Equipment Effectiveness Details Region] > [select a Machine Performance Value] Equipment Efficiency Detail MOC User > Manufacturing Operations Center Analytics > Plant Manager Dashboard > [select a Bottom Performers Equipment Gauge] > [Overall Equipment Effectiveness Details Region] > [select a Machine Performance Value] > [select a Machine Efficiency value] Equipment Overview MOC User > Extensible Attributes Data > Equipment > Entity: Equipment [select Entity Name link] Equipment Pages MOC Administrator > Extensible Attributes Workbench > Equipment > [select Entity Name link] > Classifications tab [Pages]
A-6
Page Name Navigation Path Equipment Reason Code Setup MOC Administrator > Equipment Reason Code Setup Equipment Scrap Analysis MOC User > Manufacturing Operations Center Analytics > Plant Manager Dashboard > [select a Bottom Performers Equipment Gauge] > [Overall Equipment Effectiveness Details Region] > [select a First Pass Yield Value] Equipment Scrap Reason MOC User > Tag Data Workbench > Equipment Scrap Reasons Equipment Scrap Reasons Entry MOC User > Tag Data Workbench > Equipment Scrap Reasons > [Enter Scrap Reason] Equipment Scrap Reasons View MOC User > Tag Data Workbench > Equipment Scrap Reasons > [select data on Equipment Scrap Reason] > [select records] > [View Reason] Equipment Scrap Reasons MOC User > Manufacturing Operations Center Analytics > Plant Manager Dashboard > [select a Bottom Performers Equipment Gauge] > [Overall Equipment Effectiveness Details Region] > [select a First Pass Yield Value] > [select a Scrapped Quantity value] Event Setup MOC Administrator > Event Setup Extensible Attributes Data MOC User > Extensible Attributes Data Facilities Manager MOC User > Manufacturing Operations Center Analytics > Facilities Manager Items Overview MOC User > Extensible Attributes Data > Items > [select an Entity Name link] > Entity: Item [Entity Name link] Item Pages MOC Administrator > Extensible Attributes Workbench > Items > [select Entity Name link] > Pages
7

Page Name Navigation Path Manual Contextualization MOC User >Tag Data Workbench > Manual Contextualization Manufacturing Operations Center Catalog MOC User > Manufacturing Operations Center Analytics > Manufacturing Operations Center Catalog Others Overview MOC User > Extensible Attributes Data > Others > [select an Entity Name link] > Entity: Others [select Entity Name link] Others Pages MOC Administrator > Extensible Attributes Workbench > Others > [select Entity Name link] > Classifications tab [Pages] Parameters MOC Administrator > Setup > Run Requests > Submit Request Plant Manager Dashboard MOC User > Manufacturing Operations Center Analytics > Plant Manager Dashboard Production Loss Analysis MOC User > Manufacturing Operations Center Analytics > Plant Manager Dashboard > [select a Bottom Performers Equipment Gauge] > [Production Loss Analysis] Production Loss Detail MOC User > Manufacturing Operations Center Analytics > Plant Manager Dashboard > [select a Bottom Performers Equipment Gauge] > [Production Loss Analysis] > [select a Total Production Loss value] Production Performance MOC User > Manufacturing Operations Center Analytics > Plant Manager Dashboard > [Production Performance] Production Slippage Trend MOC User > Manufacturing Operations Center Analytics > Plant Manager Dashboard > [Production Performance] Scrap Reason MOC User > Tag Data Workbench > Scrap Reasons
A-8

Page Name Navigation Path Scrap Reasons Entry MOC User > Tag Data Workbench > Equipment Scrap Reasons > [select data on Equipment Scrap Reason] > [select records] > [Enter Scrap Reason] Scrap Reasons [View] MOC User > Tag Data Workbench > Equipment Scrap Reasons > [select data on Equipment Scrap Reason] > [select records] > [View Reason Sustainability Performance MOC User > Manufacturing Operations Center Analytics > Plant Manager Dashboard > Sustainability Performance Tag Mapping MOC Administrator > Entity Hierarchy Home Page > Equipment Setup> Tag Mapping Tag Setup MOC Administrator > Setup > Tag Setup Update Classification MOC Administrator > Extensible Attributes Workbench > Others > Entity: Others [select Entity Name link] > [Update] Update Equipment Event Action Sequentially MOC Administrator > Event Setup > [Update Sequentially] Update Equipment Reason Code Sequentially MOC Administrator > Equipment Reason Code Setup > [Update Sequentialy] Work Orders Order Type MOC User > Extensible Attributes Data > Work Orders > Entity: Work Order [select Entity Name link] > Order Type Work Orders Overview MOC User > Extensible Attributes Data > Work Orders > Entity: Work Order [select Entity Name link] Work Order Pages MOC Administrator > Extensible Attributes Workbench > Work Orders > [select Entity Name link] > Classifications tab [Pages]
9


![UG-25 Governor (P3 version)szenasy/VILLVONT/vill és DV vont/UG25+26579_D[1]ww.pdf · UG-25+ Governor Installation and Operation Manual 26579 iv Woodward Warnings and Notices Important](https://img.pdfslide.us/doc/110x75/5e6fbd72824331000a79312c/ug-25-governor-p3-version-szenasyvillvontvill-s-dv-vontug2526579d1wwpdf.jpg)