Embed Size (px)
Citation preview
On edge
Dr Hamish Campbell
GNS Science

GNS Science
GNS Science
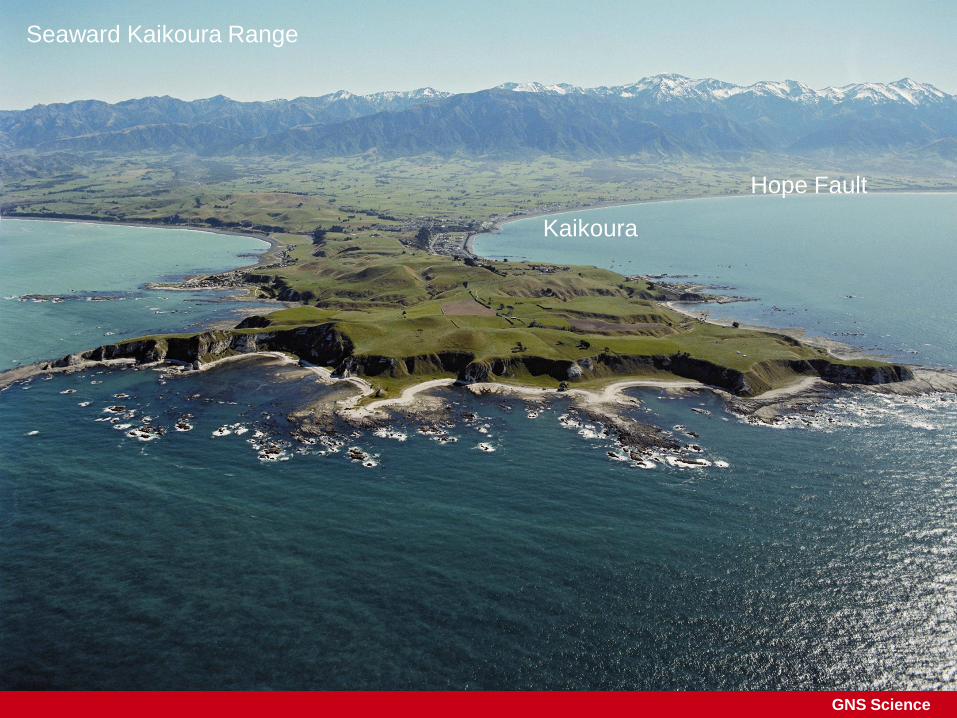
Seaward Kaikoura Range
Hope Fault
Kaikoura
GNS Science
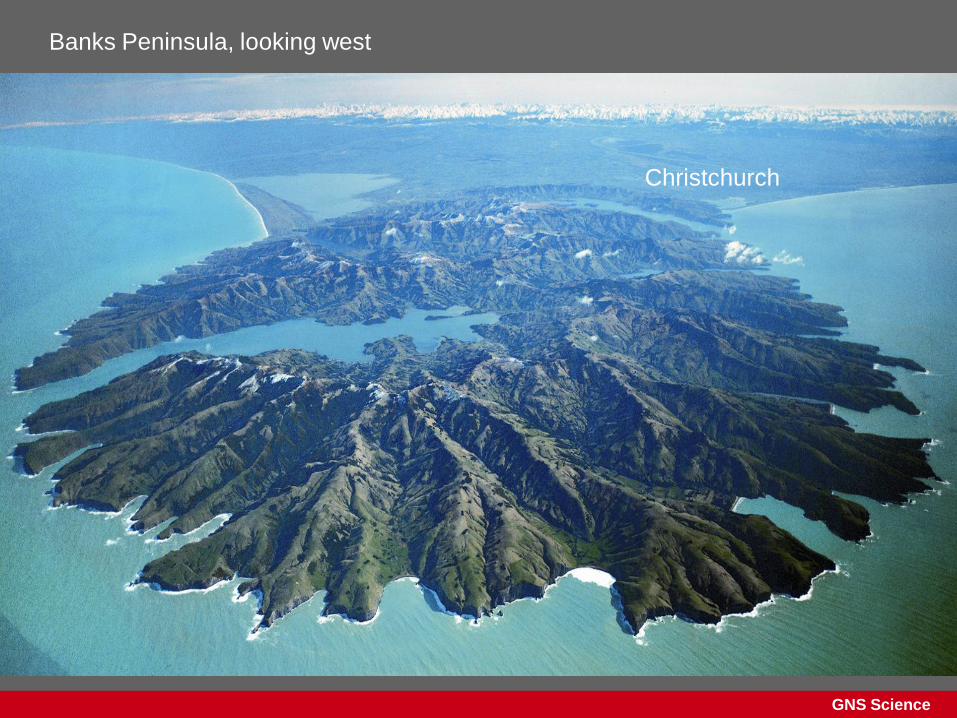
Banks Peninsula, looking west
Christchurch
GNS Science
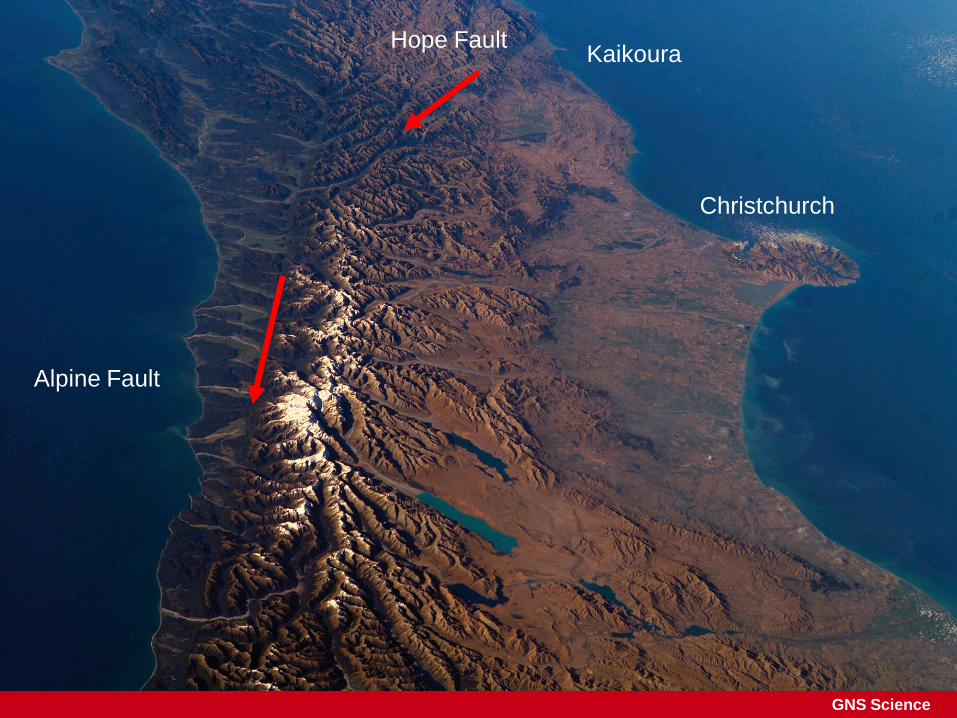
Kaikoura
Christchurch
Alpine Fault
Hope Fault
GNS Science
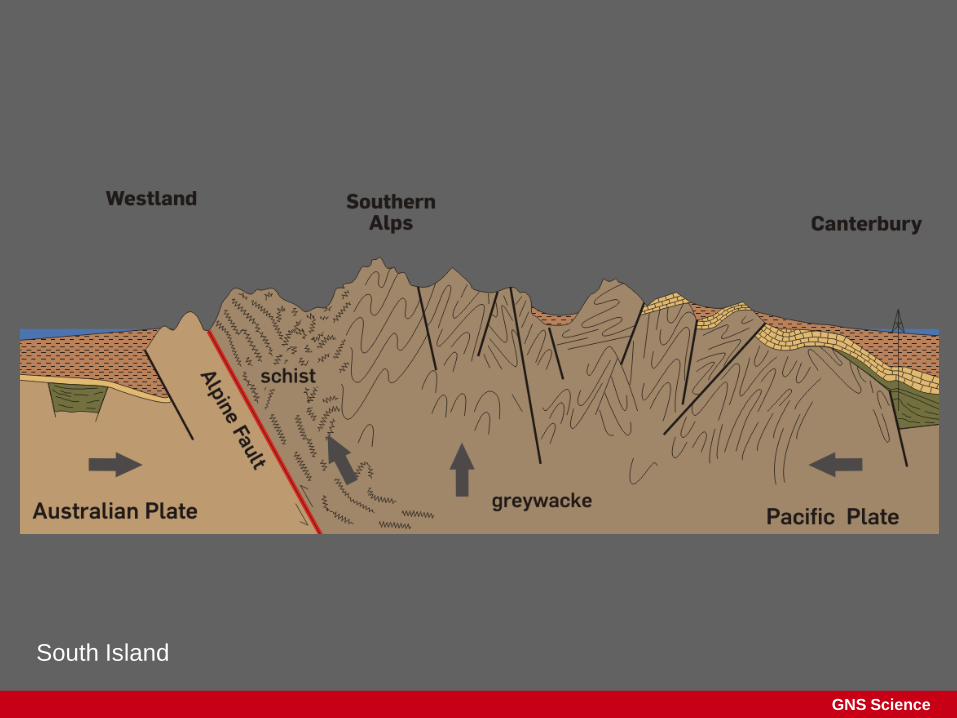
South Island

GNS Science
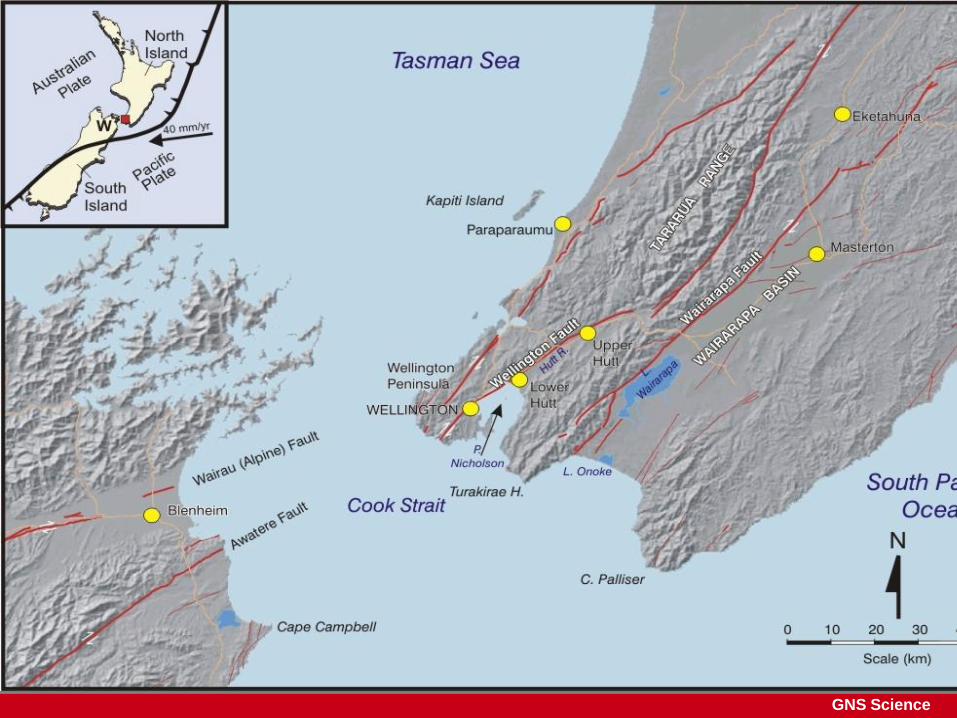
Regional Context
GNS Science
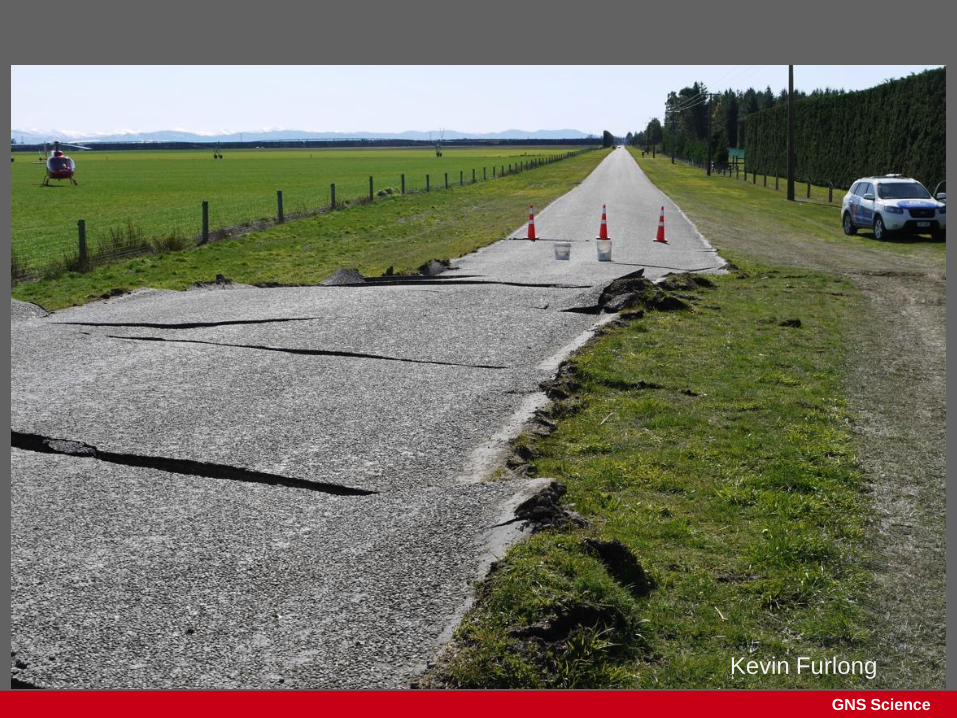
Kevin Furlong

GNS Science Photo: Nicola Litchfield, GNS Science

GNS Science
Darfield Earthquake
7.1
Saturday 4 September
4:36 am

GNS Science
Acceleration records from Greendale
-5
-4
-3
-2
-1
0
1
0 5 10 15 20 25 30
Time (s)
Ac
ce
lera
tio
n (
g)
305
215
VERT
`

GNS Science
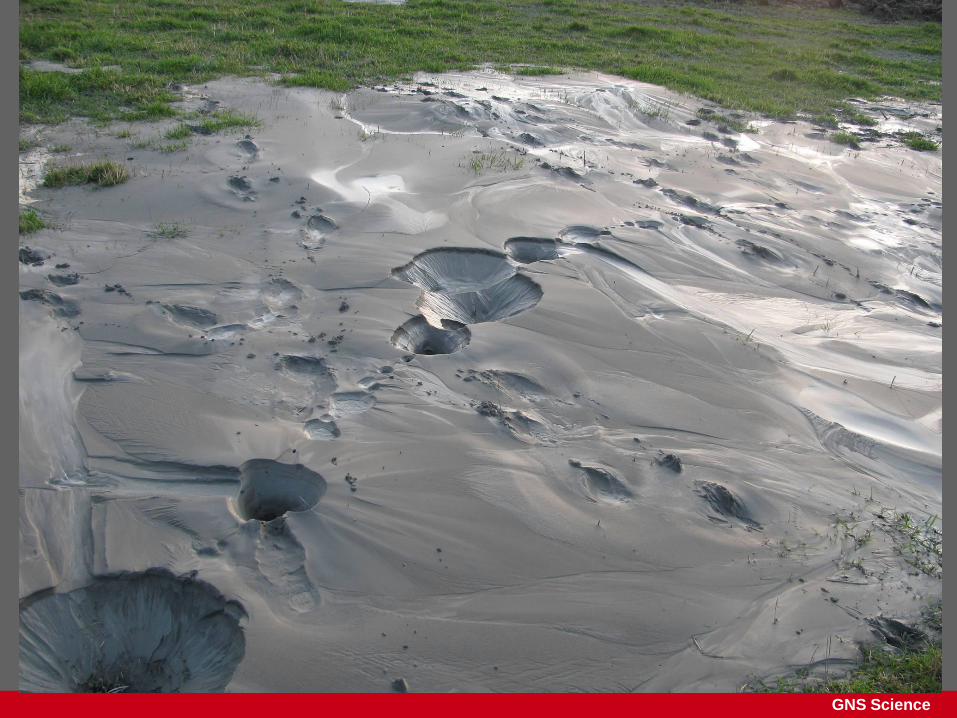
“There’s a sandhill in the middle of my house… it’s wrecked.”
GNS Science

GNS Science
GNS Science
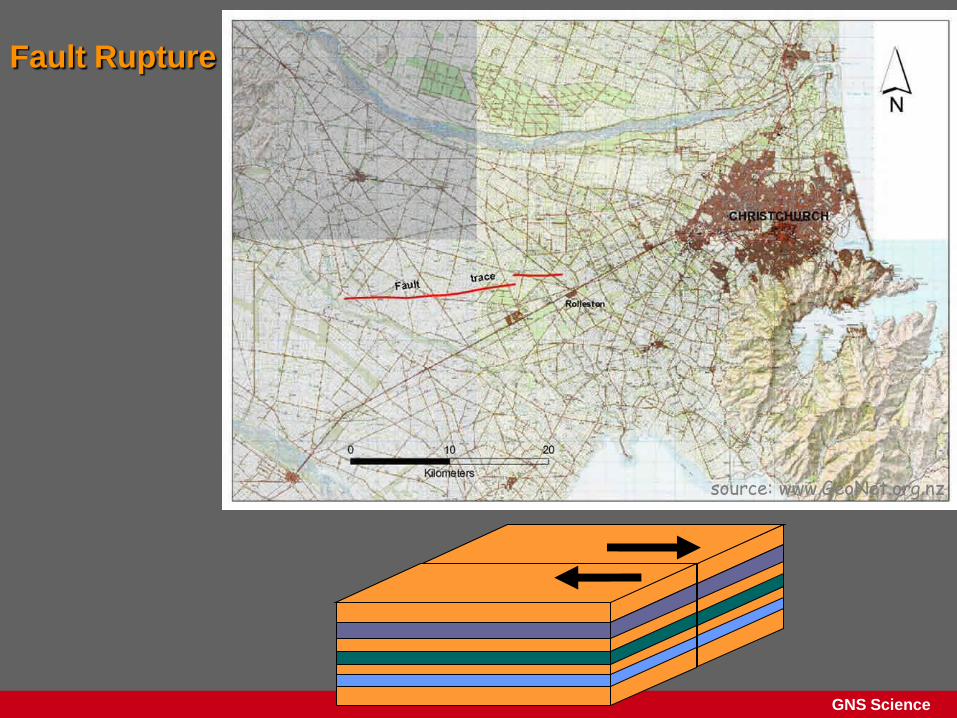
Fault Rupture (breakage)
source: www.GeoNet.org.nz
GNS Science

GNS Science
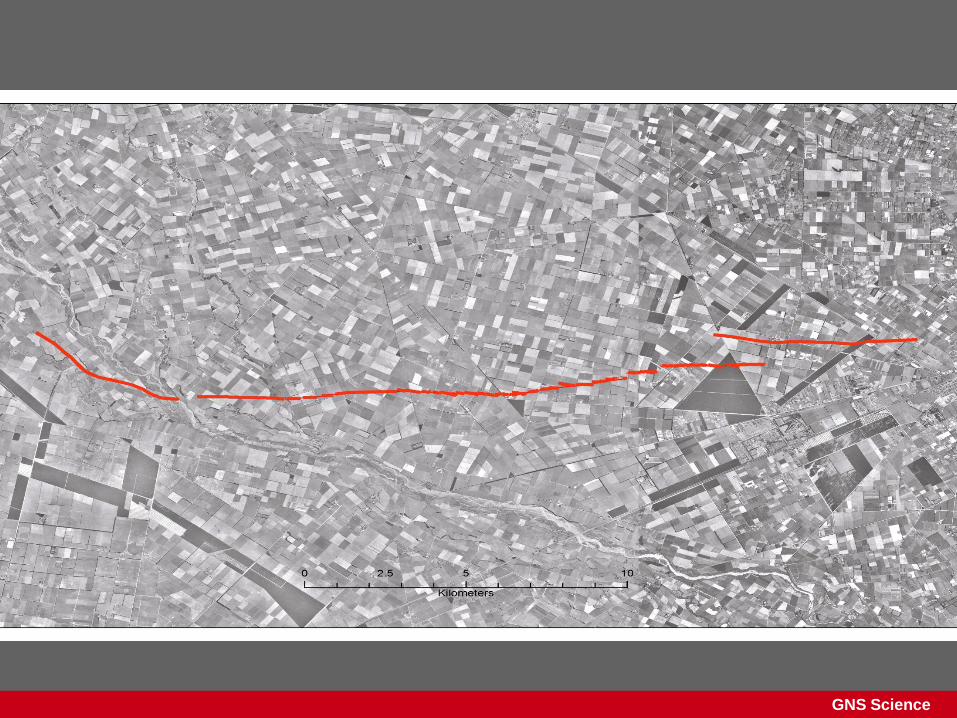
Greendale Fault Surface Rupture Displacement

GNS Science
GNS Science
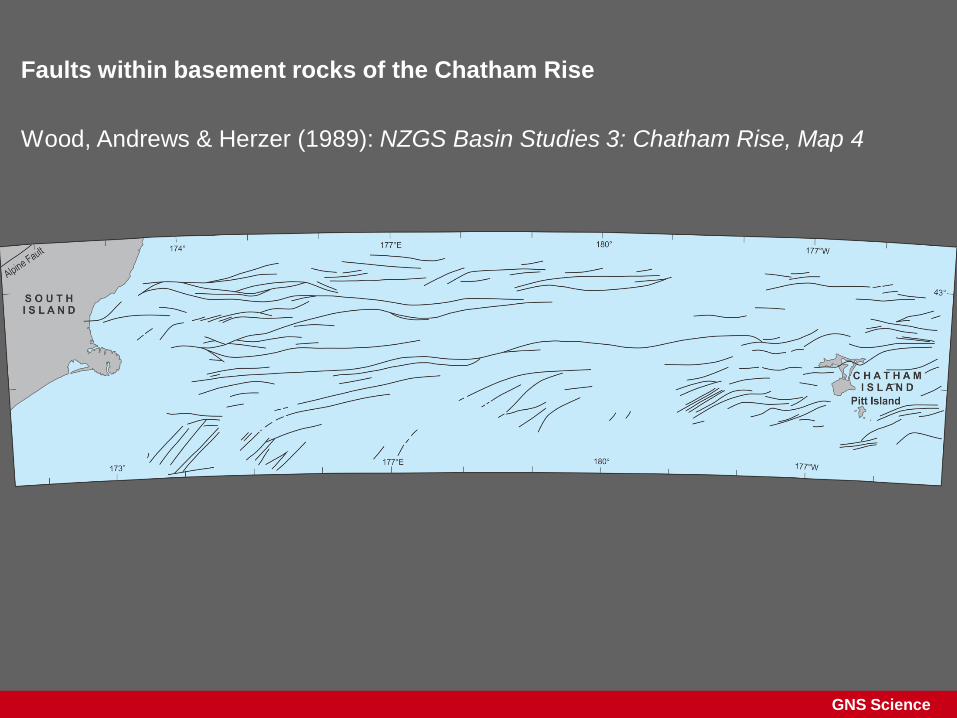
Faults within basement rocks of the Chatham Rise
Wood, Andrews & Herzer (1989): NZGS Basin Studies 3: Chatham Rise, Map 4

GNS Science
90 Ma
(million years ago)

GNS Science
Bathymetric map
GNS Science

GNS Science
GNS Science
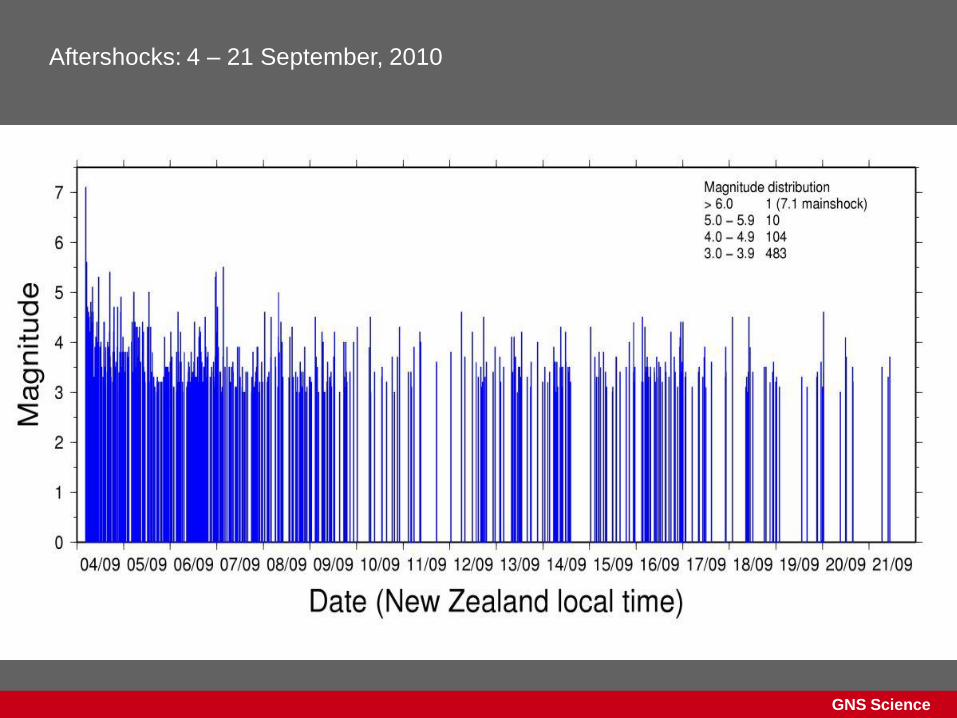
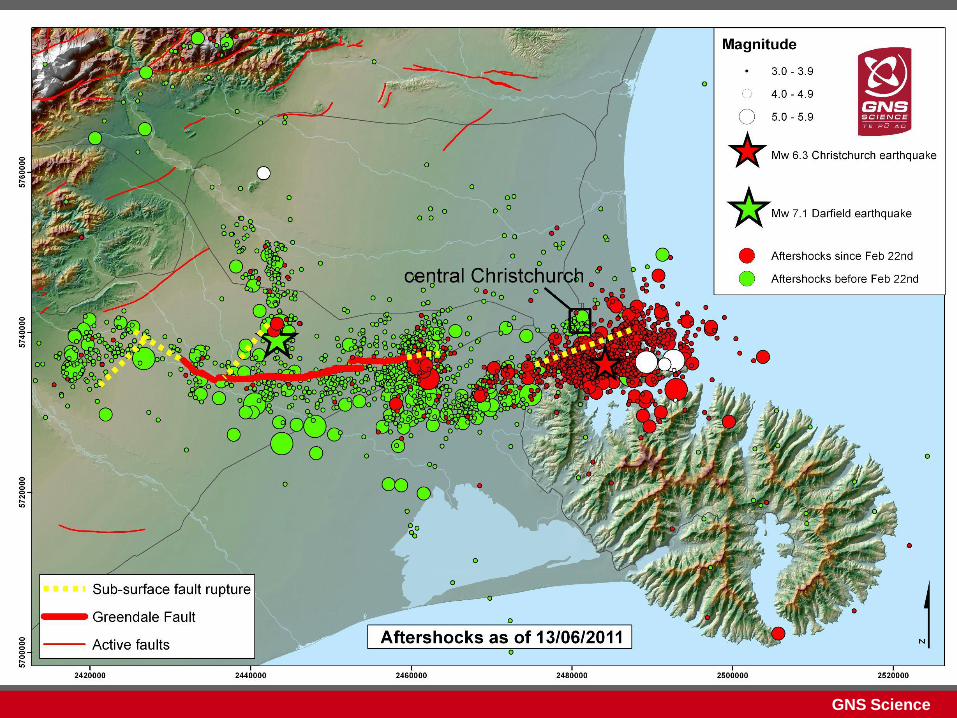
Aftershocks: 4 – 21 September, 2010
GNS Science
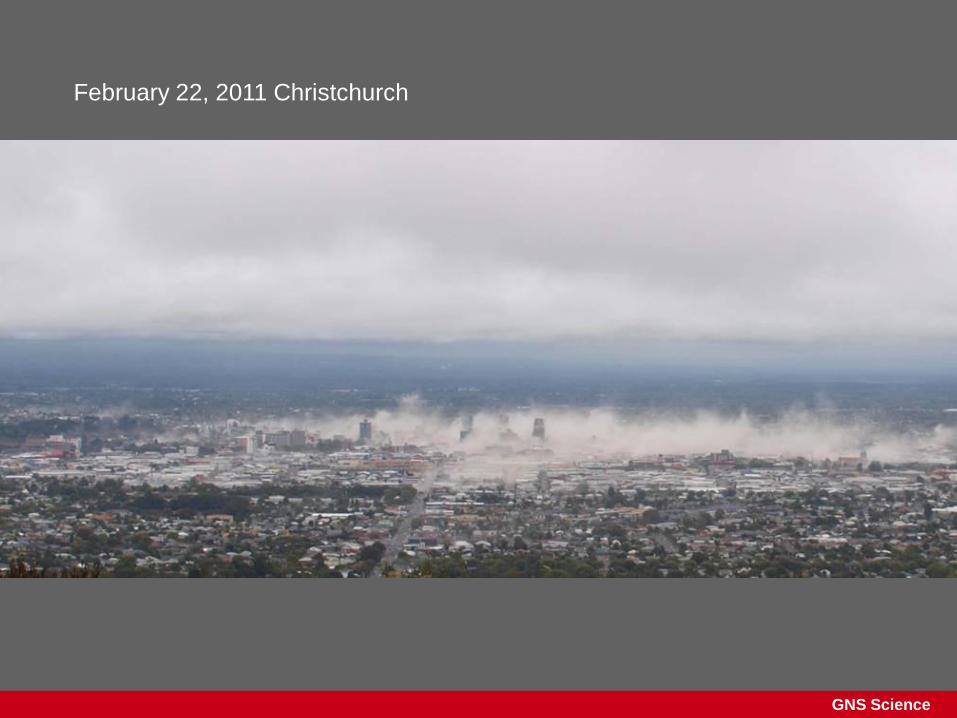
February 22, 2011 Christchurch

GNS Science
Comparison of Vertical and Horizontal Ground
Shaking
Vertical
Horizontal
500 yr code 0.30g
2,500 year 0.54g
GNS Science
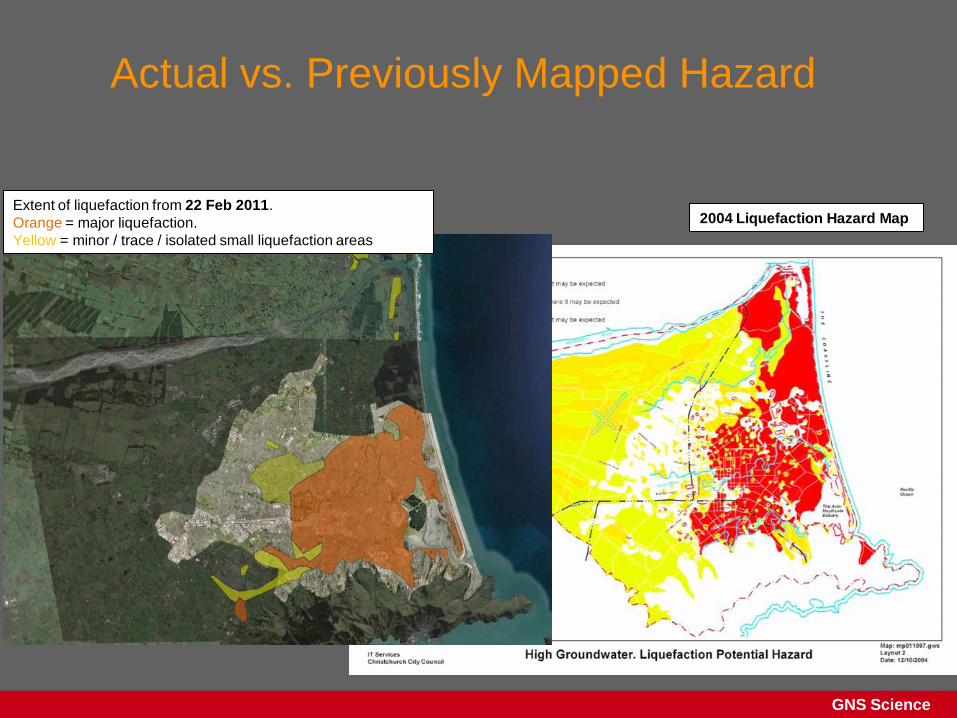
Actual vs. Previously Mapped Hazard
Extent of liquefaction from 22 Feb 2011.
Orange = major liquefaction.
Yellow = minor / trace / isolated small liquefaction areas
2004 Liquefaction Hazard Map

GNS Science
Predicted vertical contours and fault slip model (transparent)
Subsidence
up to 15 cm
along much of
the Avon, with
uplift >30 cm
of river mouth
and estuary

GNS Science
New Zealand Historical Atlas 1997 p.55
GNS Science
GNS Science

GNS Science
GNS Science

GNS Science
GNS Science
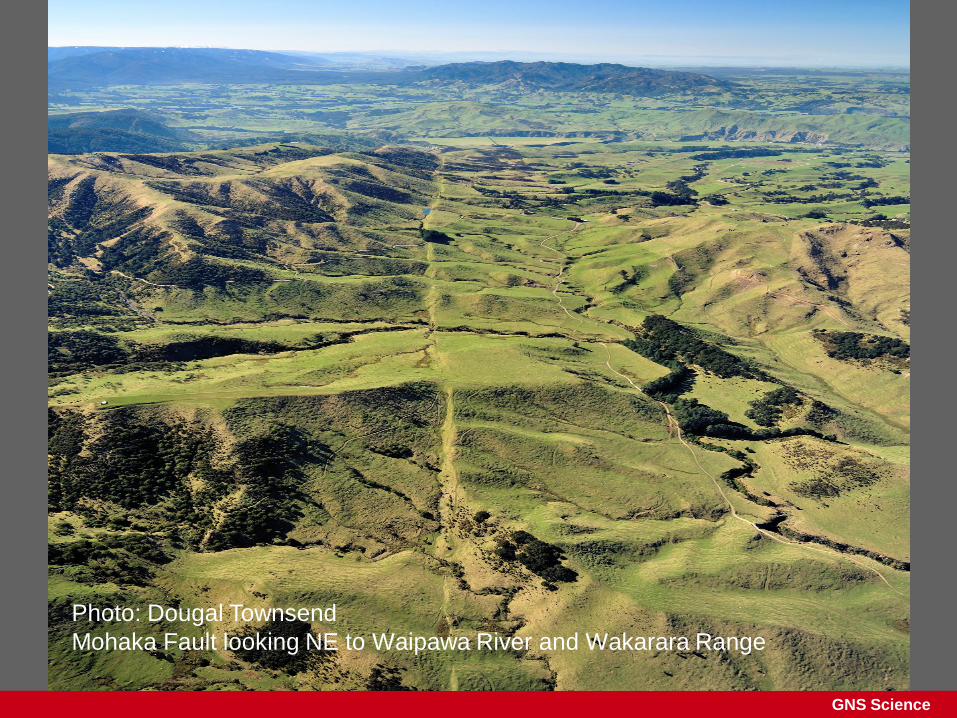
Photo: Dougal Townsend
Mohaka Fault looking NE to Waipawa River and Wakarara Range

GNS Science
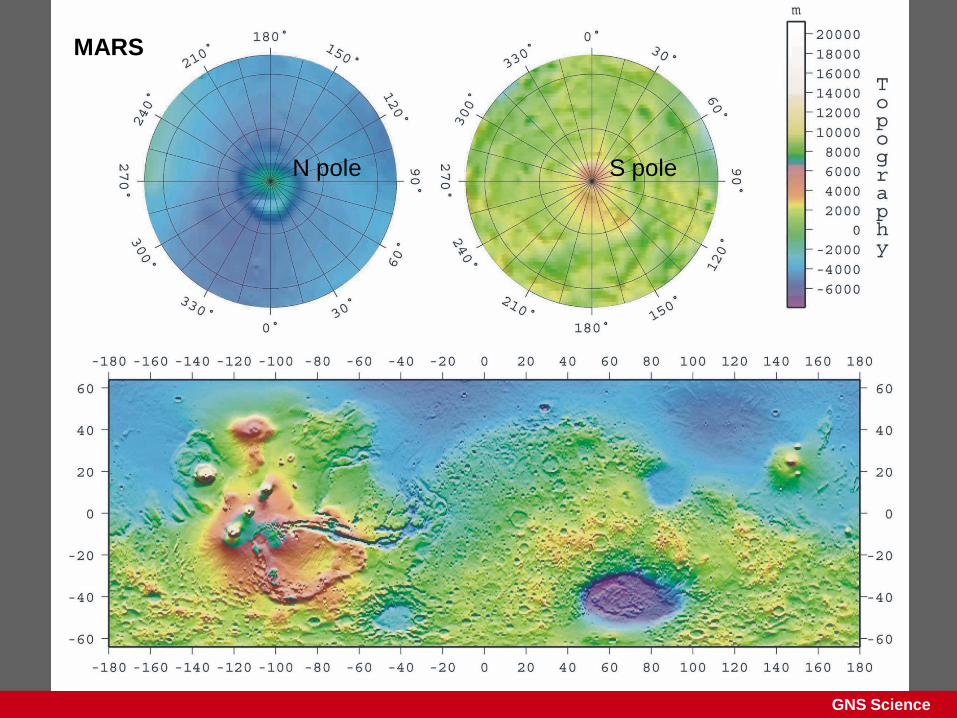
Mars and its faults: normal (red) and reverse (black)
Lada Dimitrova (PhD, Stony Brook, USA)
GNS Science
MARS
S pole N pole

GNS Science
Full moon

GNS Science
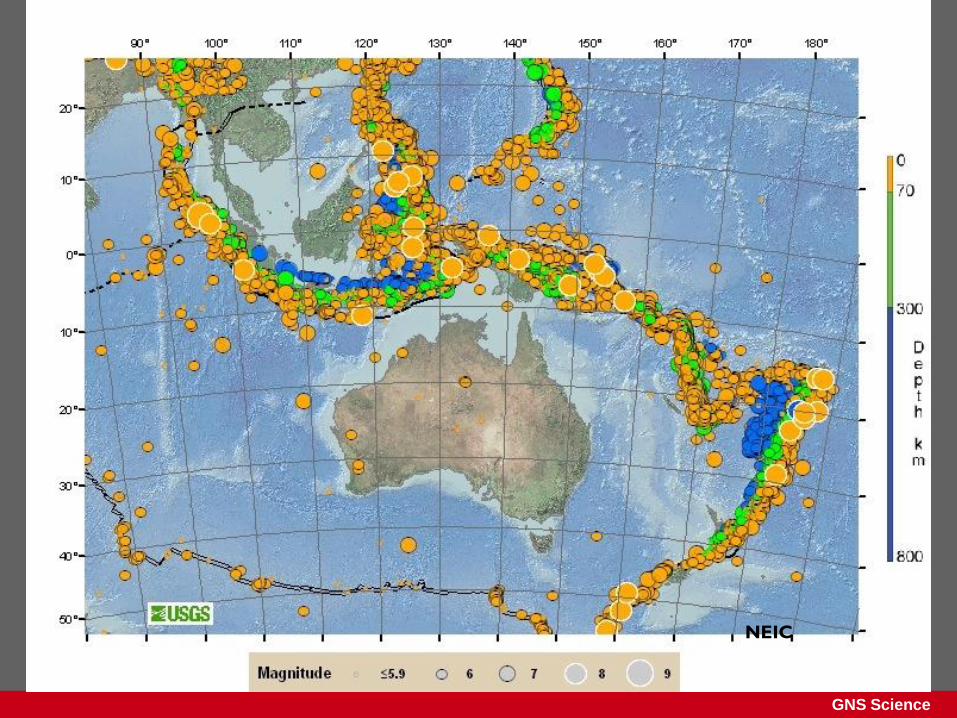
Earthquakes occur on plate boundaries
GNS Science
NEIC

GNS Science
IRIS
22 Feb
Japan - 20000 x more energy
4 Sept - 30 x more energy
Globally there‟s about one/year M>8.0

GNS Science
Globally, the 5th largest earthquake since 1900.
Magnitude 8.9 NEAR THE EAST COAST OF HONSHU, JAPAN Friday, March 11, 2011 at 05:46:23 UTC
7.8
8
8.2
8.4
8.6
8.8
9
9.2
9.4
9.6
1900 1920 1940 1960 1980 2000 2020
Ma
gn
itu
de
Year
Great (M > 8) Earthquakes Since 1900 Chile 1960
Alaska 1964
Sumatra 2004
Chile 2010
Japan 2011
GNS Science
GNS Science

GNS Science
Wairarapa Fault
Featherston

GNS Science
Wairarapa Fault
raised beaches
at
Cape Turakirae
Cook Strait

GNS Science
Wellington Fault

GNS Science
Wellington Fault
GNS Science
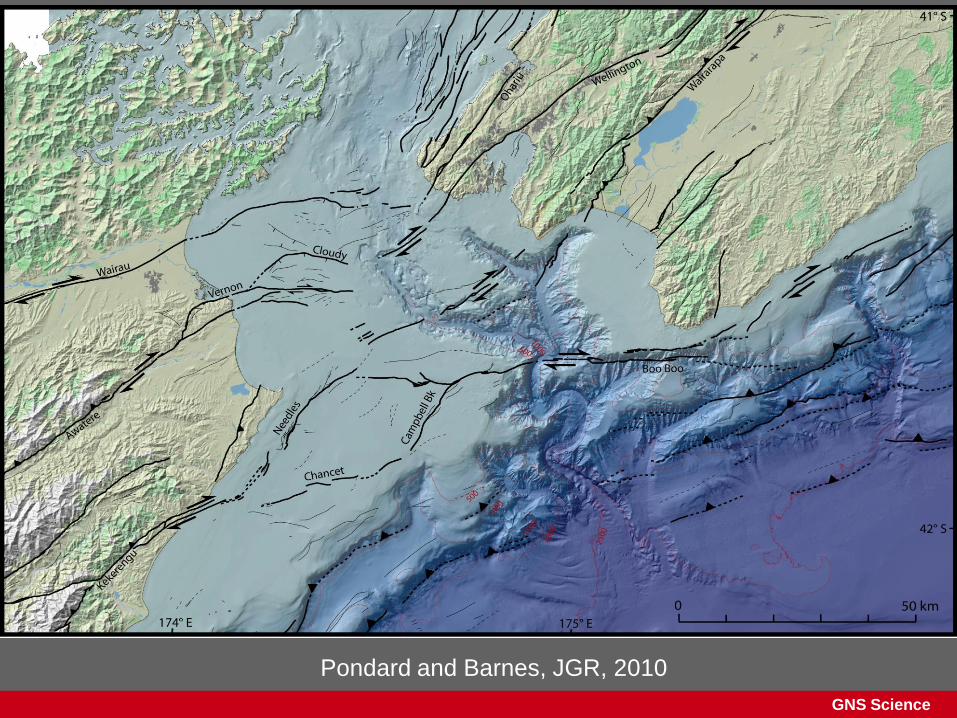
Pondard and Barnes, JGR, 2010
GNS Science
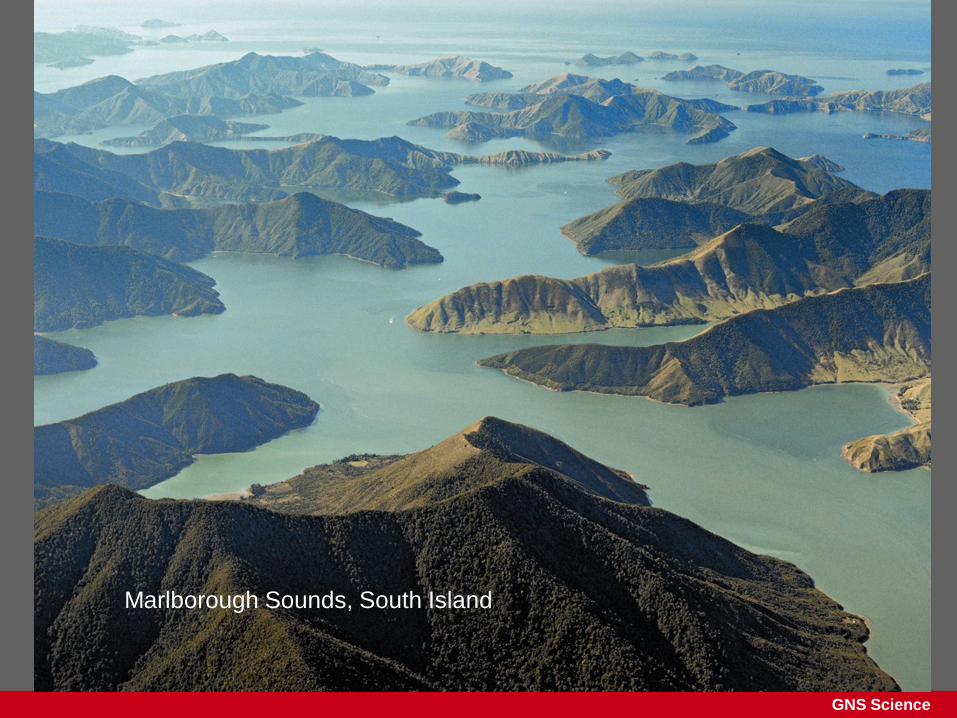
Marlborough Sounds, South Island

GNS Science
Wanganui Basin
Cook Strait
Marlborough Sounds
„lithospheric sag‟

GNS Science
GNS Science
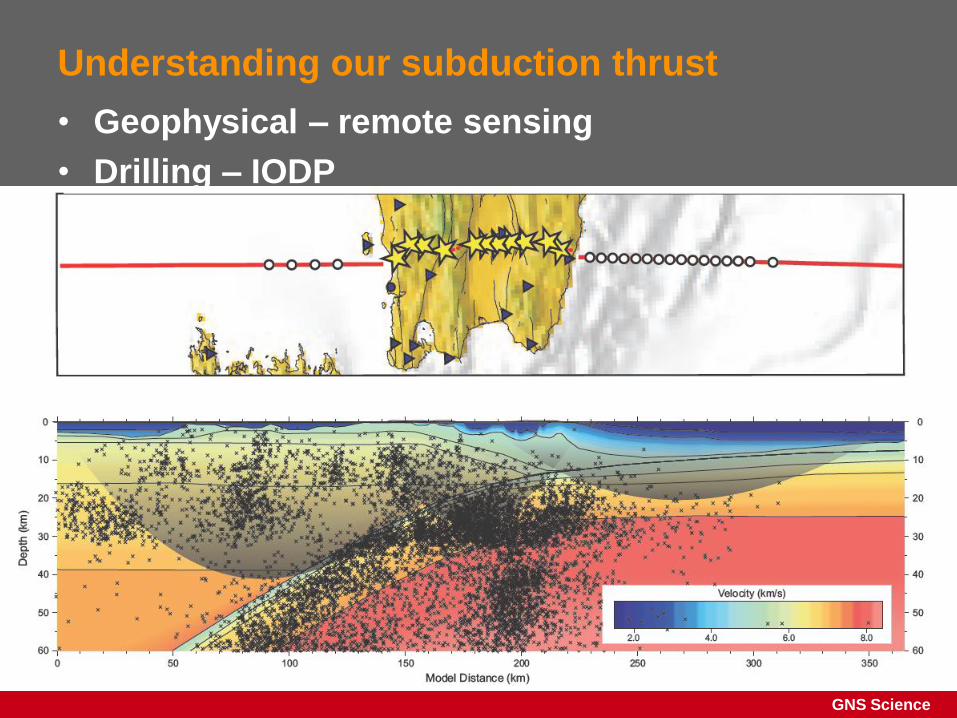
Understanding our subduction thrust
• Geophysical – remote sensing
• Drilling – IODP
GNS Science
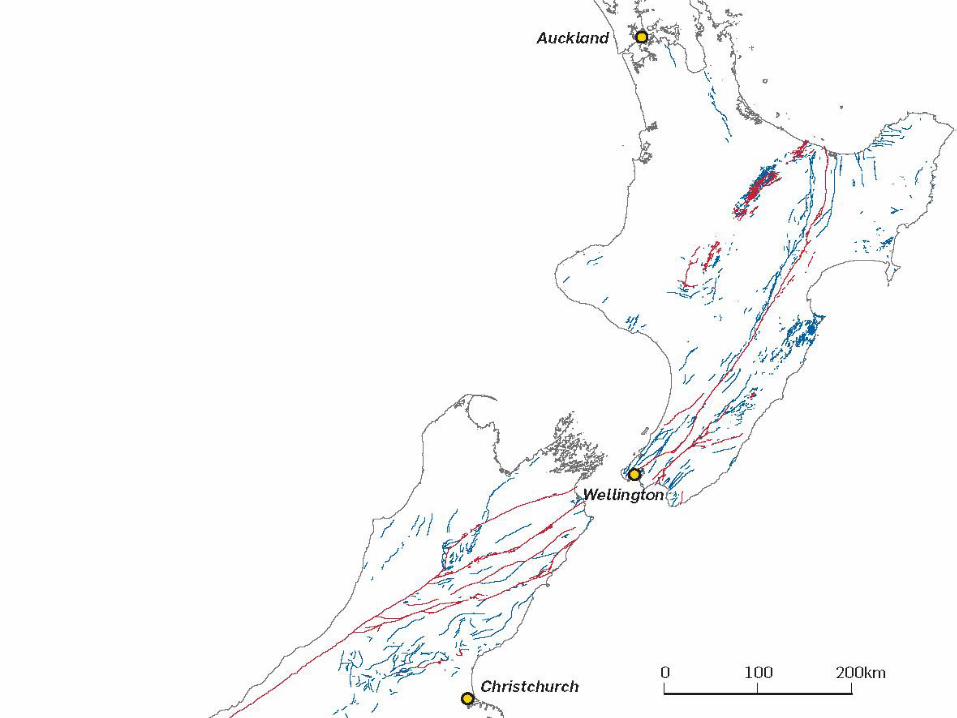
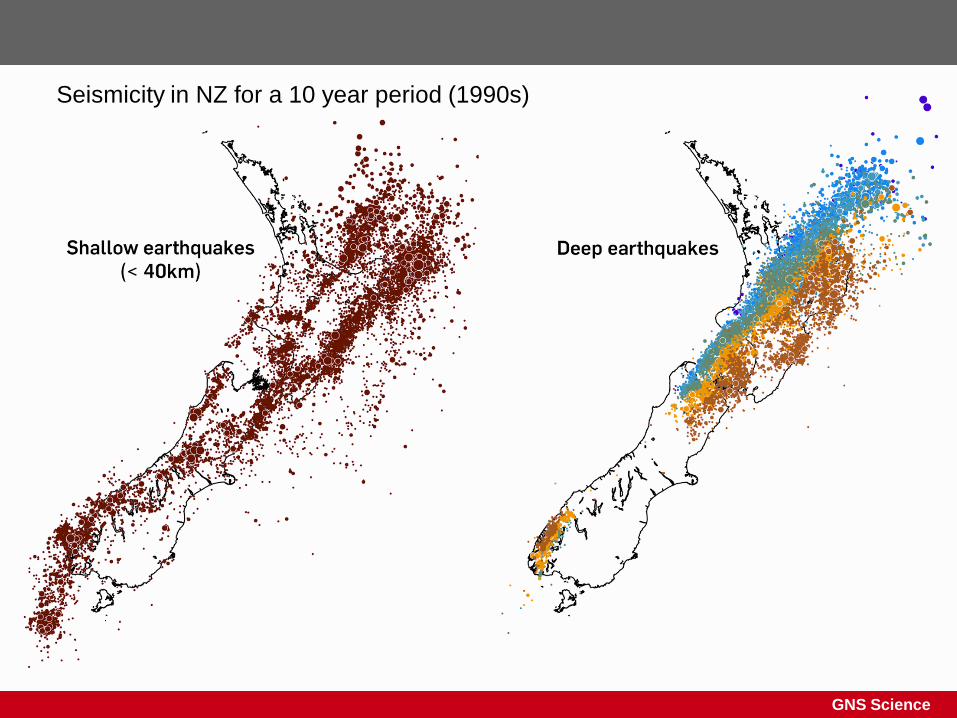
Seismicity in NZ for a 10 year period (1990s)

GNS Science
GPS: Global Positioning System
satellite receiver

GNS Science

GNS Science

GNS Science
Total slip in the Kapiti 2003 and Manawatu 2004/2005
SSEs was equivalent to Mw 7.26, and occurred along the
down-dip edges of inter-seismic coupling

GNS Science

GNS Science
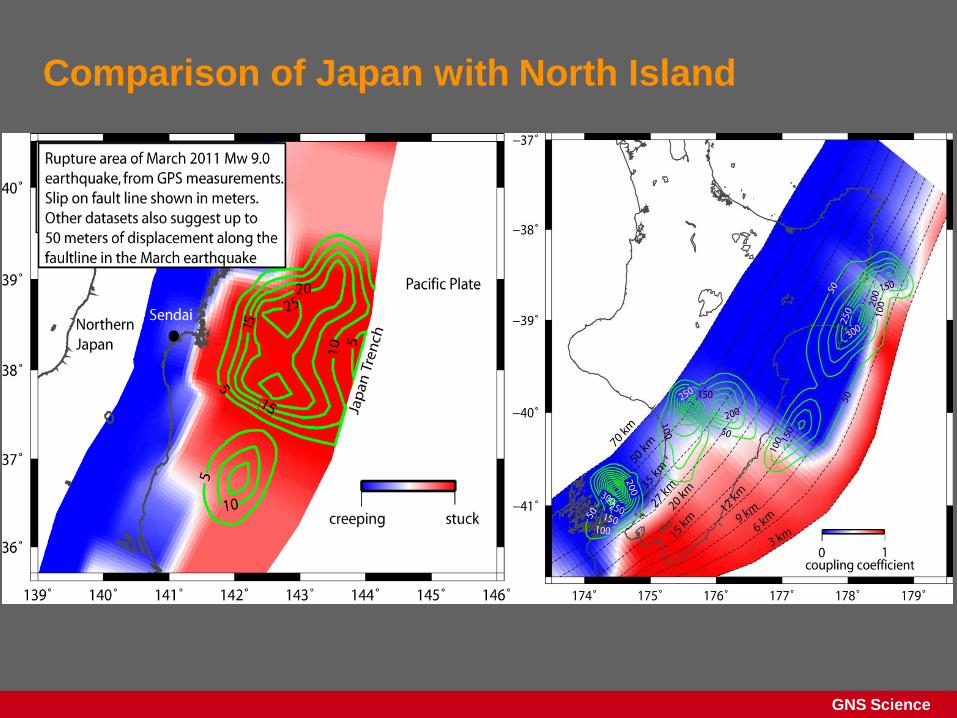
Comparison of Japan with North Island
GPS tells us where the subduction zone is “stuck”
– building up stress to be relieved in a future earthquake
GNS Science
Comparison of Japan with North Island

GNS Science
Edgecumbe Earthquake February 1987: looking NE

GNS Science
Taupo Volcanic Zone
(TVZ)
A rift with at least 8
calderas or
super-volcanoes
E-W stretching of
>9.0 mm per year
at Rotorua
GNS Science
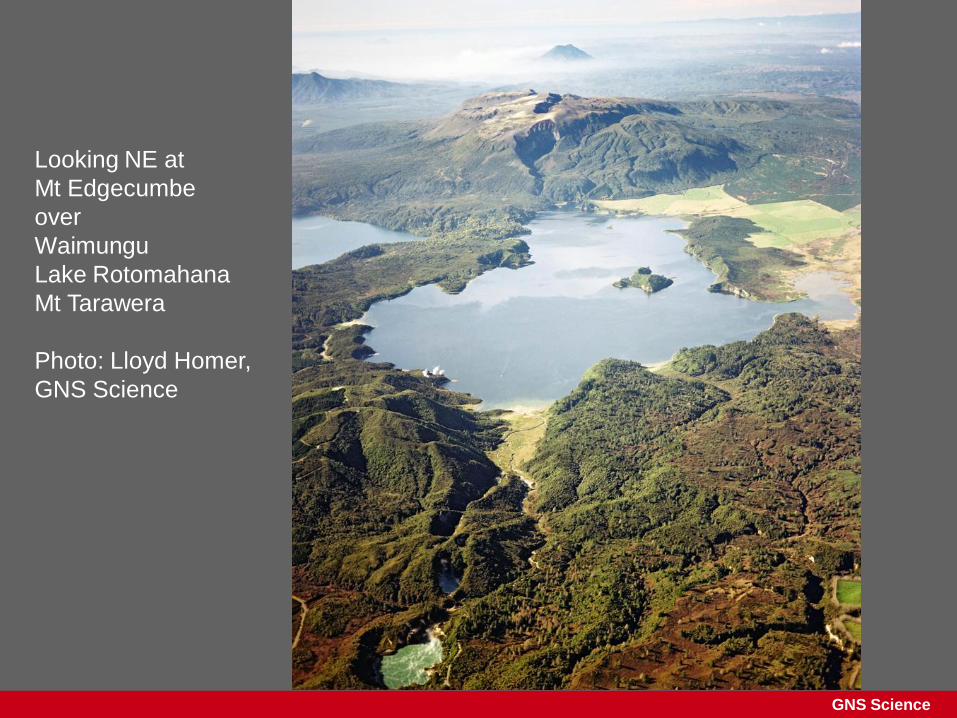
Looking NE at
Mt Edgecumbe
over
Waimungu
Lake Rotomahana
Mt Tarawera
Photo: Lloyd Homer,
GNS Science

GNS Science
Tarawera, Ruawahia, Wahanga (domes)
Photo: Lloyd Homer, GNS Science

GNS Science
Kaharoa Eruption
of Mt Tarawera
1314 AD +/- 12
by David Lowe,
Waikato University

GNS Science
GNS Science
Acknowledgements • Helen Anderson
• Phil Barnes (NIWA)
• John Beavan (GNS Science)
• John Begg (GNS Science)
• Neil Campbell (Kiwi Rail)
• Russ van Dissen (GNS Science)
• Kevin Furlong (Penn. State, USA)
• Ken Gledhill (GeoNet, GNS Science)
• Gavin Hayes (USGS)
• Stuart Henrys (GNS Science)
• Lloyd Homer
• James Jackson (Cambridge University)
• Graeme McVerry (GNS Science)
• Andy Nichol (GNS Science)
• Nico Pondard (GNS Science)
• Martin Reyners (GNS Science)
• Warwick Smith (GeoNet, GNS Science)
• Mark Stirling (GNS Science)
• Dougal Townsend (GNS Science)

GNS Science

GNS Science

GNS Science
National Seismic
Hazard Model
PGA = peak ground
acceleration