Embed Size (px)
Citation preview

Anomaly Detection –from basic concepts to application cases at Microsoft
Bo Thiesson [email protected] http://people.cs.aau.dk/~thiesson
Aalborg University – 1996
Microsoft Research, Redmond USA (1996 – 2013)
Aalborg University (2013 –

Bo Thiesson
Outline Basic setup & motivation
• 1 class ↔ 2 class • Application examples
Standard algorithms • Parametric - Gaussian modeling, Replicator Neural Networks • Non-parametric - NN modeling (distance & density based, LOF) • Clustering
Contextual detection The development process
• Feature selection & model validation
Microsoft applications • Excel (conditional formatting rules) • OSD (Bing, MSN, AdCenter) – Capacity prediction • OSD, Azure – Latent Fault Detection in Data Centers • Corporate Security – Insider Threats
Future (and current) challenges 2 InfinIT seminar, March 2015
Bo Thiesson
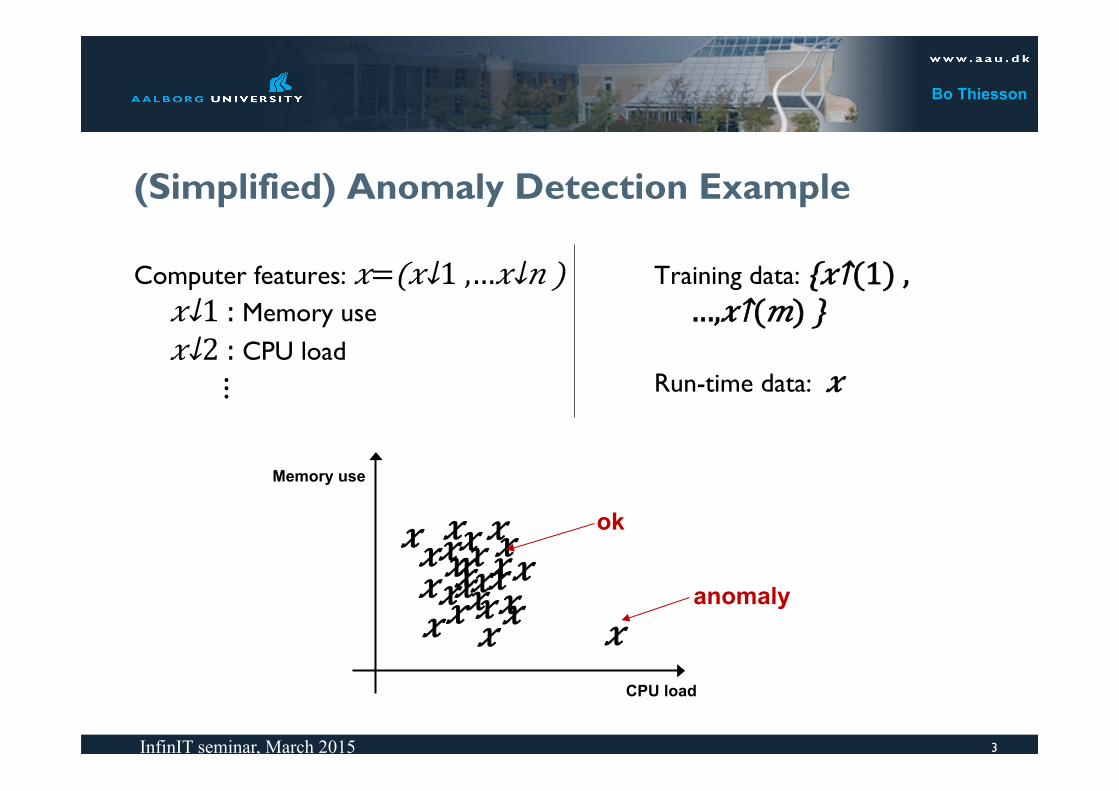
(Simplified) Anomaly Detection Example
Computer features: 𝑥=(𝑥↓1 ,…𝑥↓𝑛 ) 𝑥↓1 : Memory use 𝑥↓2 : CPU load ⋮
3 InfinIT seminar, March 2015
Training data: {𝑥↑(1) ,…, 𝑥↑(𝑚) }
Run-time data: 𝑥
CPU load
Memory use
𝑥 𝑥 𝑥 𝑥
𝑥
𝑥 𝑥 𝑥 𝑥 𝑥
𝑥
𝑥
𝑥 𝑥
𝑥 𝑥 𝑥 𝑥 𝑥 𝑥
𝑥
𝑥
𝑥 𝑥 𝑥
ok
𝑥 anomaly

Bo Thiesson
What is an anomaly
• Anomaly is a pattern in the data that does not conform to the expected behaviour
• Also referred to as outliers, exceptions, peculiarities, surprises, etc.
• Definition of Hawkins [Hawkins 1980]: “An outlier is an observation which deviates so much from the other observations as to arouse suspicions that it was generated by a different mechanism”
4 InfinIT seminar, March 2015

Bo Thiesson
(Simplified) Anomaly Detection Example
Computer features: 𝑥=(𝑥↓1 ,…𝑥↓𝑛 ) 𝑥↓1 : Memory use 𝑥↓2 : CPU load ⋮
5 InfinIT seminar, March 2015
Training data: ok: {𝑥↑(1) ,…, 𝑥↑(𝑚) } not-ok: {𝑥↑(1) ,…, 𝑥↑(𝑘) }
Run-time data: 𝑥
CPU load
Memory use
𝑥 𝑥 𝑥 𝑥
𝑥
𝑥 𝑥 𝑥 𝑥 𝑥
𝑥
𝑥
𝑥 𝑥
𝑥 𝑥 𝑥 𝑥 𝑥 𝑥
𝑥
𝑥
𝑥 𝑥 𝑥
ok
𝑥
anomaly 𝑥 𝑥 𝑥 𝑥 𝑥
𝑥
𝑥 𝑥

Bo Thiesson
Two Scenarios
Supervised scenario (standard classification) • Training data with both normal and abnormal data objects are
provided • There may be multiple normal and/or abnormal classes • Often, the classification problem is highly imbalanced
• Up-sample abnormal data or down-sample normal data
• Future anomalies must look like the abnormal class(es) of training objects
6 InfinIT seminar, March 2015

Bo Thiesson
Two Scenarios (cont.)
Semi-supervised Scenario (anomaly detection) • Training data for only the normal class(es) is provided • There may be multiple normal classes • Many times no (explicit) class label given, but data assumed (mostly)
normal • Relies on anomalies being very rare compared to normal data
• Sometimes a very small number of anomalies included in training data (0 to 20 is common), but not enough to learn abnormal class(es)
• Future anomalies may look nothing like any previously observed anomaly
7 InfinIT seminar, March 2015
Focus

Bo Thiesson
Where to look for anomalies
w Anomalous events occur relatively infrequently
w However, when they do occur, their consequences can be quite dramatic and quite often in a negative sense
8 InfinIT seminar, March 2015
Some applications:
w Fraud: Banking, Insurance, Health care, Click,..
w Cyber intrusion: Insider/outsider, machine or network level
w Medicine and health: abnormal test results, disease patterns (e.g. geo-spatial)
w (Anti) terrorism w Data cleaning (measurement errors)
w …
Bo Thiesson
Outline Basic setup & motivation
• 1 class ↔ 2 class • Application examples
Standard algorithms • Parametric - Gaussian modeling, Replicator Neural Networks • Non-parametric - NN modeling (distance & density based, LOF) • Clustering
Contextual detection The development process
• Feature selection & model validation
Microsoft applications • Excel (conditional formatting rules) • OSD (Bing, MSN, AdCenter) – Capacity prediction • OSD, Azure – Latent Fault Detection in Data Centers • Corporate Security – Insider Threats
Future (and current) challenges 9 InfinIT seminar, March 2015

Bo Thiesson
Modeling paradigms Parametric
• Learn (parametric) model representing normal data • Outliers deviate strongly from this model • Data represented by sufficient statistics (estimating model parameters) • Space efficient & fast run-time (usually) • Depends on parametric structure (shape) of the model, also restricts number
of normal classes
Non-parametric • All data kept around - the “model” defines a distance measure between data –
and sometimes a kernel • Distance-based approach: outlier have large distance to other data • (Kernel) density-based approach: density around outlier is significantly smaller
than for its neighbors • Space demanding & not as fast run-time (usually) • No structural model constraints nor restrictions on number of normal classes
10 InfinIT seminar, March 2015
Bo Thiesson
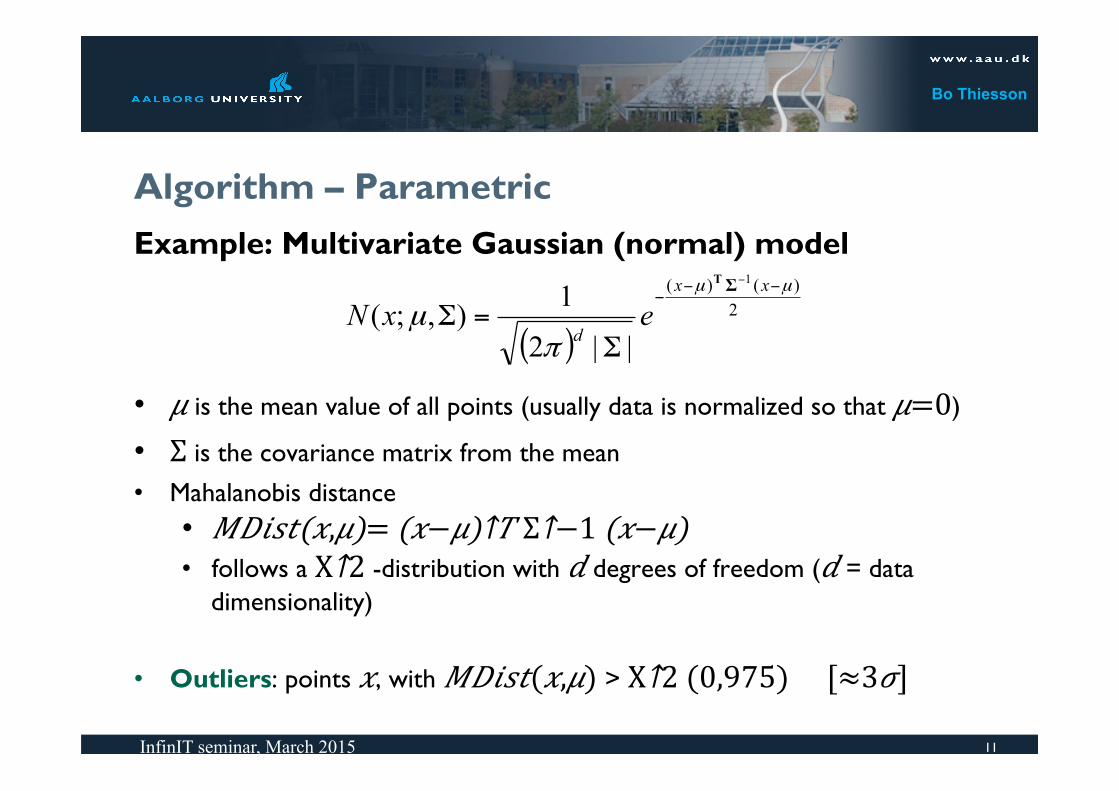
Algorithm – Parametric Example: Multivariate Gaussian (normal) model • 𝜇 is the mean value of all points (usually data is normalized so that 𝜇=0)
• Σ is the covariance matrix from the mean • Mahalanobis distance
• 𝑀𝐷𝑖𝑠𝑡(𝑥,𝜇)= (𝑥−𝜇)↑𝑇 Σ↑−1 (𝑥−𝜇) • follows a Χ↑2 -distribution with 𝑑 degrees of freedom (𝑑 = data
dimensionality)
• Outliers: points 𝑥, with 𝑀𝐷𝑖𝑠𝑡(𝑥,𝜇) > Χ↑2 (0,975) [≈3𝜎]
11 InfinIT seminar, March 2015
( )2
)()( 1
||2
1),;(µµ
πµ
−−−
−
Σ=Σ
xx
dexN
ΣT

Bo Thiesson
Parametric algorithm – Multivariate Gaussian
Tan, P.-N., Steinbach, M., and Kumar, V. 2006. Introduction to Data Mining. Addison Wesley.
12 InfinIT seminar, March 2015
( )2
)()( 1
||2
1),;(µµ
πµ
−−−
−
Σ=Σ
xx
dexN
ΣT
Parameters
Data object
Bo Thiesson
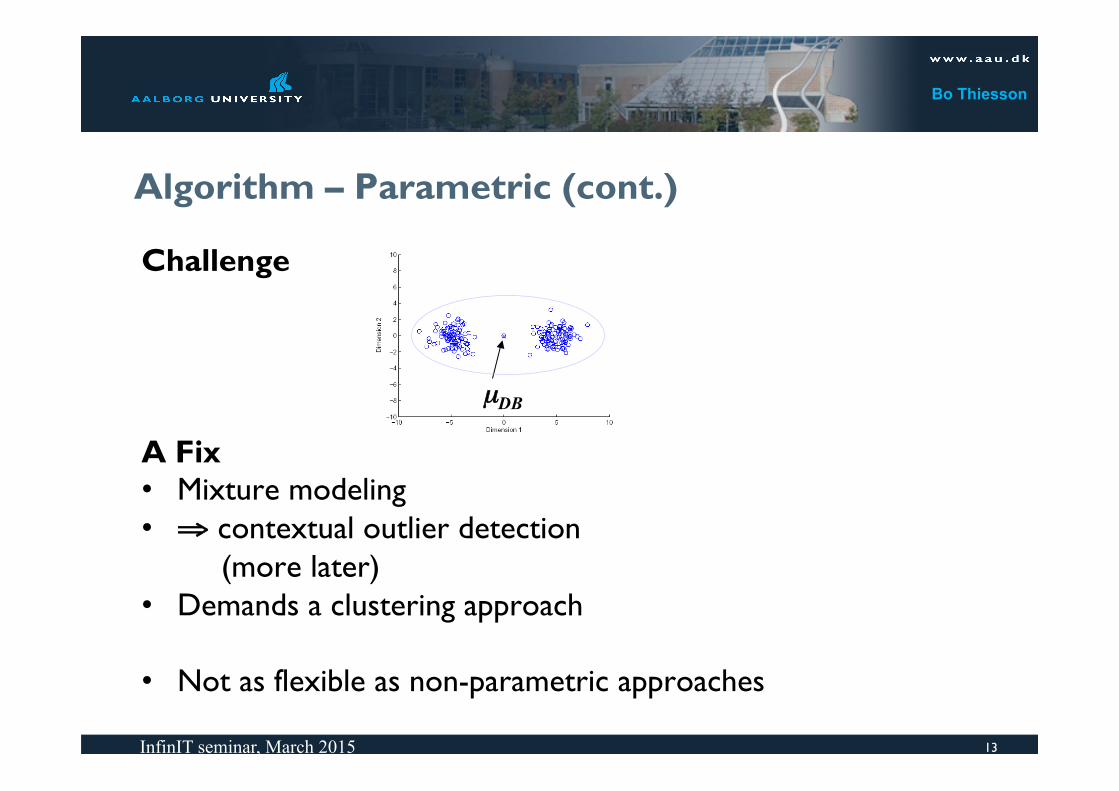
Algorithm – Parametric (cont.)
Challenge A Fix • Mixture modeling • ⇒ contextual outlier detection (more later) • Demands a clustering approach
• Not as flexible as non-parametric approaches
13 InfinIT seminar, March 2015
µDB

Bo Thiesson
Replicator Neural Networks S. Hawkins, et al. Outlier detection using replicator neural networks, DaWaK02 (2002)
• Use a replicator 4-layer feed-forward neural network (RNN) with the same number of input and output nodes
• Input variables are the output variables so that RNN forms a compressed model of the data during training
• A measure of anomaly is the reconstruction error of individual data points
14 InfinIT seminar, March 2015
Target variables Input
Bo Thiesson
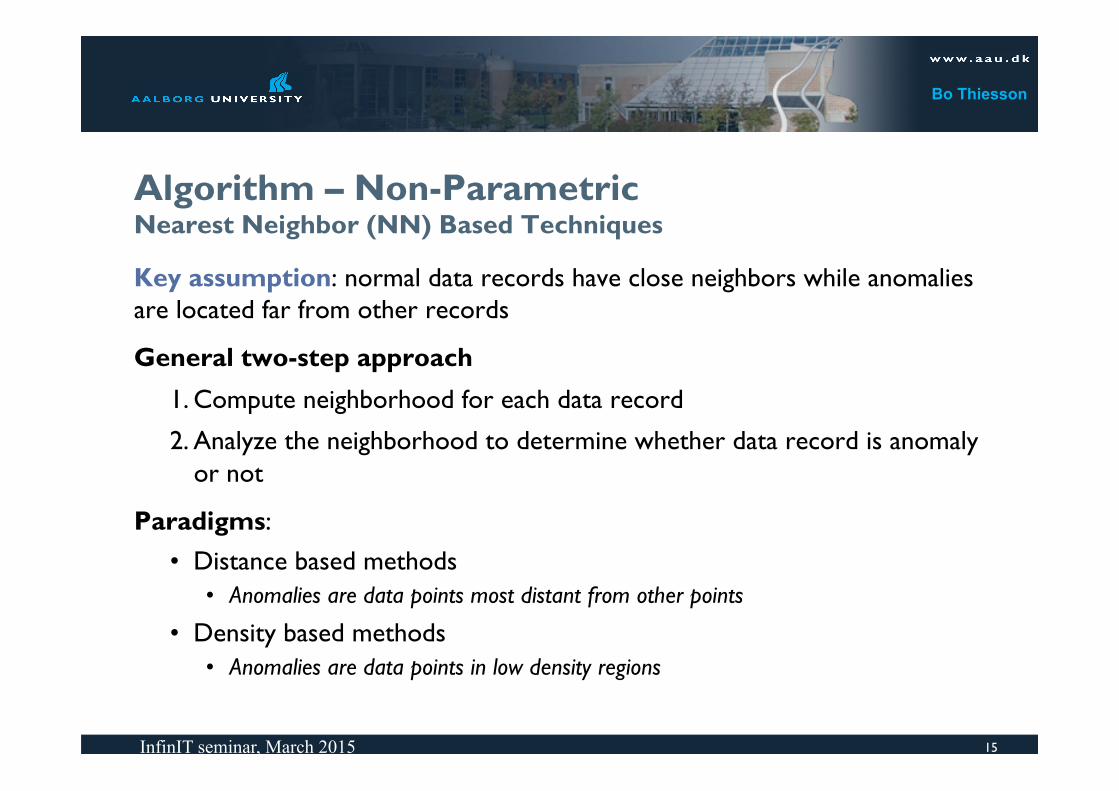
Algorithm – Non-Parametric Nearest Neighbor (NN) Based Techniques Key assumption: normal data records have close neighbors while anomalies are located far from other records
General two-step approach
1. Compute neighborhood for each data record
2. Analyze the neighborhood to determine whether data record is anomaly or not
Paradigms: • Distance based methods
• Anomalies are data points most distant from other points
• Density based methods • Anomalies are data points in low density regions
15 InfinIT seminar, March 2015

Bo Thiesson
NN Distance-based Anomaly Detection Knorr & Ng, Algorithms for Mining Distance-Based Outliers in Large Datasets, VLDB98
Algorithm
• For each data record 𝑑 compute the distance to the k-th nearest neighbor 𝑑↓𝑘
• The distance measure is the important design choice
• Sort all data records according to the distance 𝑑↓𝑘 • Outliers are records that have the largest distance 𝑑↓𝑘 and therefore are
located in the more sparse neighborhoods
• Usually data records that have top 𝑛% distance 𝑑↓𝑘 are identified as outliers
• Multiple normal classes is not a problem • Not suitable for datasets that have modes with varying density
16 InfinIT seminar, March 2015

Bo Thiesson
Advantages of Density-based Techniques
Anomalies: • Distance-based: 𝒑↓𝟏 , 𝒑↓𝟑 ,…
• Density-based: 𝒑↓𝟏 , 𝒑↓𝟐 , …
17 InfinIT seminar, March 2015
p2 × p1
×
× p3
Distance from p3 to nearest neighbor
Distance from p2 to nearest neighbor
Fixes problem with different local densities
Bo Thiesson
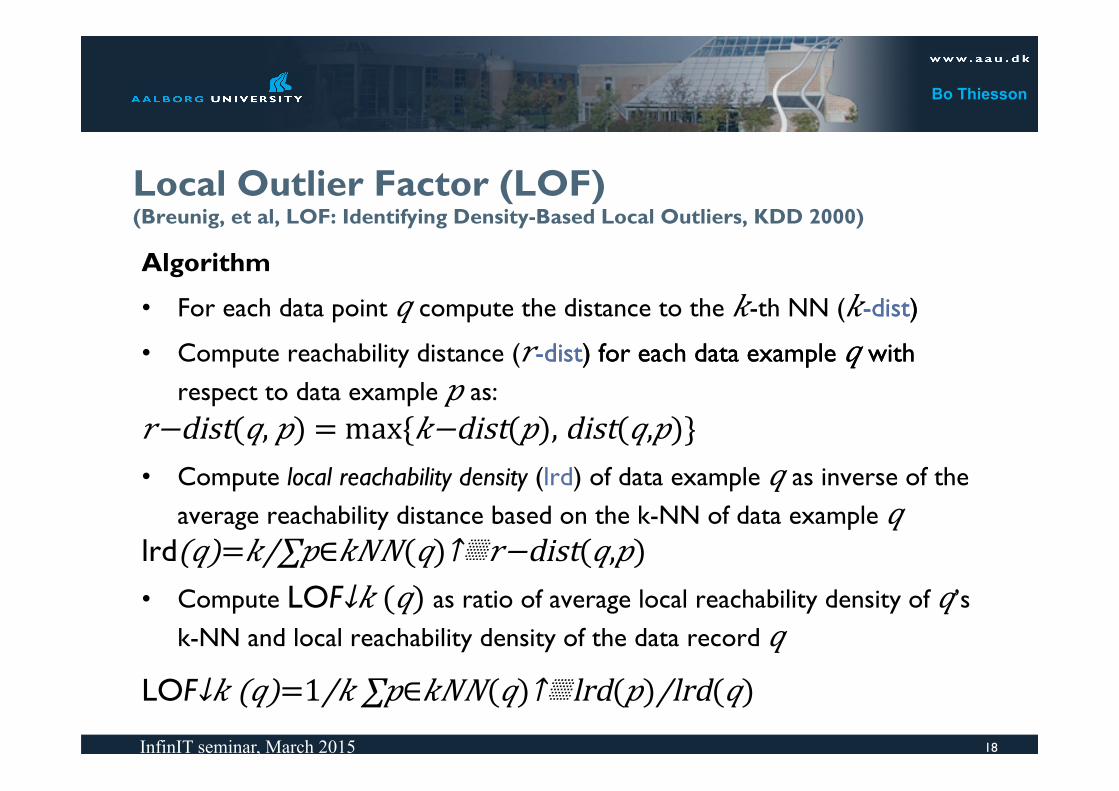
Local Outlier Factor (LOF) (Breunig, et al, LOF: Identifying Density-Based Local Outliers, KDD 2000)
Algorithm
• For each data point 𝑞 compute the distance to the 𝑘-th NN (𝑘-dist) -dist)
• Compute reachability distance (𝑟-dist) for each data example 𝑞 with -dist) for each data example 𝑞 with respect to data example 𝑝 as:
𝑟−dist(𝑞, 𝑝) = max{𝑘−dist(𝑝), dist(𝑞,𝑝)} • Compute local reachability density (lrd) of data example 𝑞 as inverse of the
average reachability distance based on the k-NN of data example 𝑞 lrd(𝑞)= 𝑘/∑𝑝∈𝑘𝑁𝑁(𝑞)↑▒𝑟−dist(𝑞,𝑝) • Compute LO F↓𝑘 (𝑞) as ratio of average local reachability density of 𝑞’s
k-NN and local reachability density of the data record 𝑞
LO F↓𝑘 (𝑞)= 1/𝑘 ∑𝑝∈𝑘𝑁𝑁(𝑞)↑▒lrd(𝑝)/lrd(𝑞) 18 InfinIT seminar, March 2015

Bo Thiesson
Local Outlier Factor (LOF)
Properties • LOF ≈ 1: point is in a cluster (region with homogeneous
density around the point and its neighbors) • LOF >> 1: point is an anomaly
19 InfinIT seminar, March 2015

Bo Thiesson
Clustering Based Techniques
Key Assumption: Normal data instances belong to large and dense clusters, while anomalies do not belong to any significant cluster.
General Approach: • Cluster data into a finite number of clusters. • Analyze each data instance with respect to its closest cluster. • Anomalous Instances
• Data instances that do not fit into any cluster (residuals from clustering) .• Data instances in small clusters. • Data instances that are far from other points within the same cluster.
20 InfinIT seminar, March 2015
Bo Thiesson
Outline Basic setup & motivation
• 1 class ↔ 2 class • Application examples
Standard algorithms • Parametric - Gaussian modeling, Replicator Neural Networks • Non-parametric - NN modeling (distance & density based, LOF) • Clustering
Contextual detection The development process
• Feature selection & model validation
Microsoft applications • Excel (conditional formatting rules) • OSD (Bing, MSN, AdCenter) – Capacity prediction • OSD, Azure – Latent Fault Detection in Data Centers • Corporate Security – Insider Threats
Future (and current) challenges 21 InfinIT seminar, March 2015

Bo Thiesson
Contextual Anomaly Detection
Key Assumption: All normal objects within a context will be similar (in terms of behavioral attributes), while the anomalies will be different from other objects within the context.
General Approach:
• Identify a context around a data object (using a set of contextual attributes).
• Determine if the test data objects is anomalous within the context (using a set of behavioral attributes).
22 InfinIT seminar, March 2015

Bo Thiesson
Contextual Attributes
Contextual attributes define a neighborhood (context) for each instance
For example: • Spatial Context
• Latitude, Longitude
• Graph Context • Edges, Weights
• Sequential Context • Position, Time
• Profile Context • User demographics
• Behavioral context (mixture modeling) • Contextual = behavioral attributes
23 InfinIT seminar, March 2015

Bo Thiesson
Contextual Anomaly Detection Techniques
Reduction to global anomaly detection • Segment or influence data using contextual attributes • Apply a traditional anomaly outlier within each context using behavioral
attributes • Often, contextual attributes cannot be segmented easily – use favourite
clustering technique (from standard machine learning) A “softer” alternative
• Conditional anomaly detection*
24 InfinIT seminar, March 2015
* X. Song, M. Wu, C. Jermaine & S. Ranka, Conditional Anomaly Detection, IEEE Transactions on Data and Knowledge Engineering, 2006.

Bo Thiesson
Outline Basic setup & motivation
• 1 class ↔ 2 class • Application examples
Standard algorithms • Parametric - Gaussian modeling, Replicator Neural Networks • Non-parametric - NN modeling (distance & density based, LOF) • Clustering
Contextual detection The development process
• Feature selection & model validation
Microsoft applications • Excel (conditional formatting rules) • OSD (Bing, MSN, AdCenter) – Capacity prediction • OSD, Azure – Latent Fault Detection in Data Centers • Corporate Security – Insider Threats
Future (and current) challenges 25 InfinIT seminar, March 2015

Bo Thiesson
The development process
The importance of real-number evaluation When developing a learning algorithm (choosing features, etc.), making decisions is much easier if we have a way of evaluating our learning algorithm.
Data • Assume we have some labeled data, of normal and very few
anomalous examples. • Split data into
• Training set, with only normal examples • Validation set, with both normal and half of the
anomalous examples • Test set with both normal and other half of the
anomalous examples
26 InfinIT seminar, March 2015
Training Data
Validation Data
Test Data

Bo Thiesson
Example
Data • 100.000 snapshots of well (normal) running machines • 20 snapshots of (latent) failing machines
Training data: 60K well-running machines Validation data: 20K well-running machines, 10 failing machines Test data: 20K well-running machines, 10 failing machines
27 InfinIT seminar, March 2015

Bo Thiesson
The development process (cont.)
Algorithm evaluation
• Fit normal model 𝑀(𝑥) on the training data
• On validation/test data example 𝑥, predict
𝑦 =𝑀(𝑥)={█■normal&−𝑜𝑟−@not normal& and compare to true value 𝑦
Possible evaluation metrics:
– True positive, false positive, false negative, true negative – Precision/Recall – F1-score
Use to compare algorithms with different features, tuning parameters, etc.
28 InfinIT seminar, March 2015

Bo Thiesson
false positive (Type I Error)
We want to avoid…
false negative (Type II Error)
You’re not
pregnant You’re
pregnant
InfinIT seminar, March 2015
29
29
Bo Thiesson
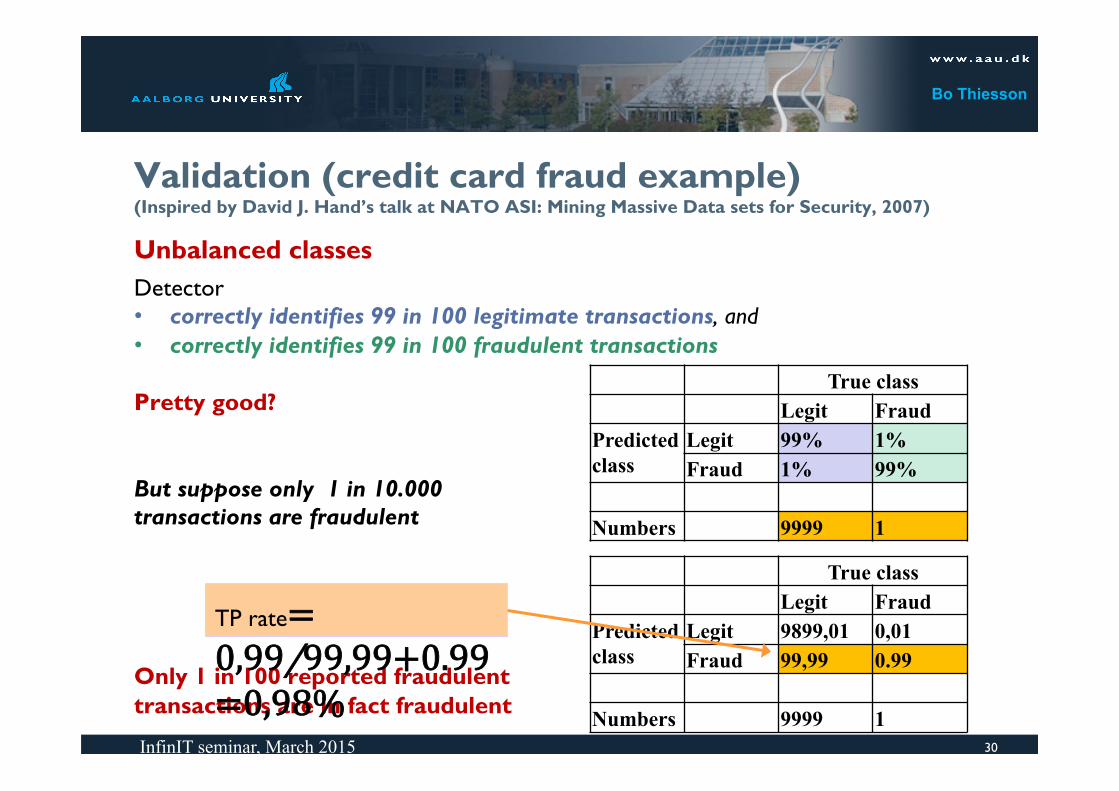
Validation (credit card fraud example) (Inspired by David J. Hand’s talk at NATO ASI: Mining Massive Data sets for Security, 2007) Unbalanced classes Detector • correctly identifies 99 in 100 legitimate transactions, and • correctly identifies 99 in 100 fraudulent transactions Pretty good? But suppose only 1 in 10.000 transactions are fraudulent
Only 1 in 100 reported fraudulent transactions are in fact fraudulent
30 InfinIT seminar, March 2015
True class Legit Fraud
Predicted class
Legit 99% 1% Fraud 1% 99%
Numbers 9999 1
True class Legit Fraud
Predicted class
Legit 9899,01 0,01 Fraud 99,99 0.99
Numbers 9999 1
TP rate= 0,99/99,99+0.99 =0,98%

Bo Thiesson
“The boy who cried wolf”
>99% of suspected frauds are in fact legitimate
This matters because: • operational decisions must be made (stop card?) • good customers must not be irritated
Same challenge for other anomaly detection systems – cyber intrusion detection, detecting latent machine failures, industrial damage detection, etc.
31 InfinIT seminar, March 2015

Bo Thiesson
Outline Basic setup & motivation
• 1 class ↔ 2 class • Application examples
Standard algorithms • Parametric - Gaussian modeling, Replicator Neural Networks • Non-parametric - NN modeling (distance & density based, LOF) • Clustering
Contextual detection The development process
• Feature selection & model validation
Microsoft applications • Excel (conditional formatting rules) • OSD (Bing, MSN, AdCenter) – Capacity prediction • OSD, Azure – Latent Fault Detection in Data Centers • Corporate Security – Insider Threats
Future (and current) challenges 32 InfinIT seminar, March 2015

Bo Thiesson
Excel (conditional formatting rules) (Max Chickering, Allan Folting, David Heckerman, Eric Vigessa & Bo Thiesson)
33 InfinIT seminar, March 2015
Drill across Region (outlier)

Bo Thiesson
Excel (conditional formatting rules)
34
InfinIT seminar, March 2015
Drill into cat3 (outlier)

Bo Thiesson
Excel (conditional formatting rules)
35
InfinIT seminar, March 2015

Bo Thiesson
Capacity Prediction (Alexei Bocharov & Bo Thiesson)
Capacity prediction = prediction of traffic to sets of MSN web pages • “How many impressions can we sell on a property between certain start and end
dates in the future?” • Over-prediction = oversell (customer dissatisfaction, make good items,…) • Under-prediction = undersell (loss of revenue, dilution of product, …) • Microsoft adCenter essentially sells web page traffic futures to advertisers across
>20,000 MSN page groups Forecast future from past data
Many existing forecasting methods
• One series: ARIMA, Exponential Smoothing methods (e.g. Holt-Winters), ART,… • Multiple series: VARIMA, ARTxp , Neural nets,…
Gradually forgt the past

Bo Thiesson
Breaking the forecasting models
• Transient events • Cyclical (recurring, but not
periodic) • FOMC-meetings (interest rates)
• Periodic (long periodicities with few data)
• E.g., April 15th is Tax day • CPS only has 2-3 yrs of data, not
enough!
• Sporadic • E.g., earthquake in Chile
37

Bo Thiesson
Seasonal and Floating Patterns TSF provides basis for predicting future traffic with
• trend, • seasonality, and • floating calendar patterns
For trend and seasonality: • TSF model selection + spectral analysis • Industry-strength seasonal pattern prediction and superior seasonal
pattern detection
For floating patterns: • a calendar of future events is needed (such as used by MSN Channel
editorial team → next slide) • Custom calendar event forecasters improve prediction accuracy by
factor of 2 or more (compared to traditional forecasters)

Bo Thiesson Example: MSN Editorial Calendar

Bo Thiesson
The OSD Data Quality (DQ) system
• Single source of Data Quality reports across the entire OSD • Reports are basis for investigating (abnormal) incidents with both user-facing Bing
properties and Bing infrastructure • Alert generator from online KPI measures (based on TSF, in parts)
• Alerts are ranked: • Severity of anomaly (deviation from predicted value) + • importance of KPI • Involves the (un)certainty of prediction
• Number of alerts can be matched human resources (for report investigations)
40 InfinIT seminar, March 2015
Bo Thiesson
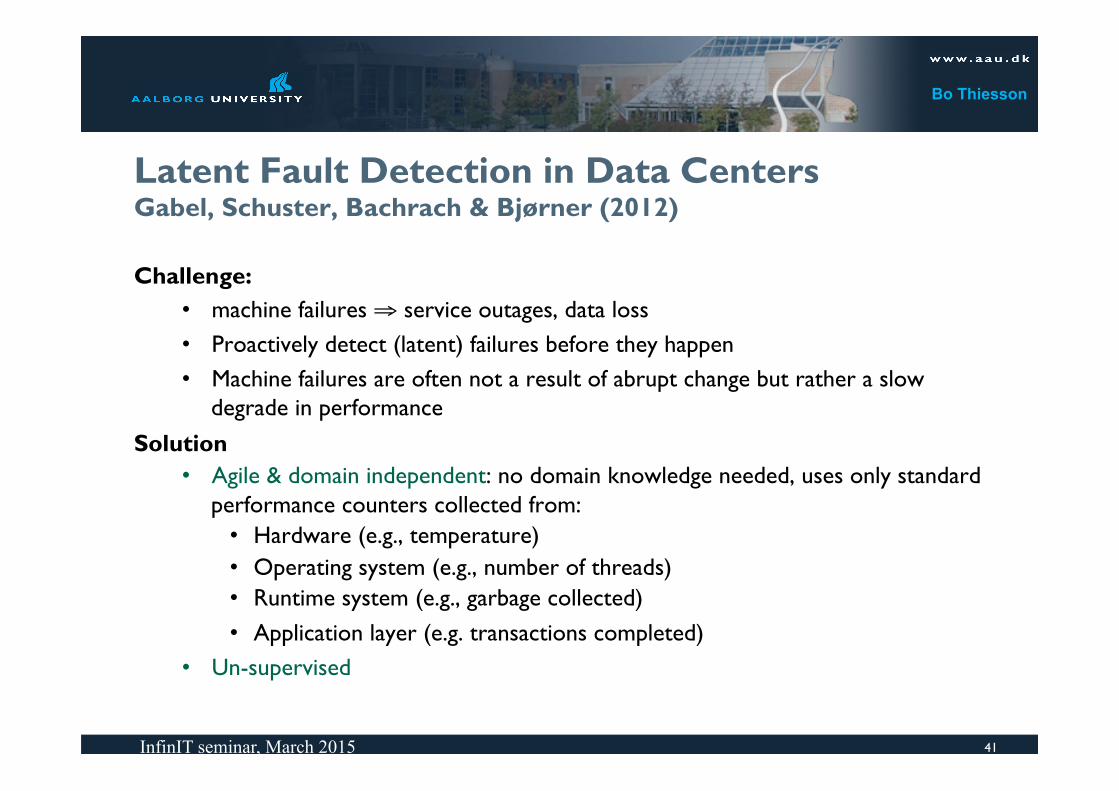
Latent Fault Detection in Data Centers Gabel, Schuster, Bachrach & Bjørner (2012)
Challenge: • machine failures ⇒ service outages, data loss • Proactively detect (latent) failures before they happen • Machine failures are often not a result of abrupt change but rather a slow
degrade in performance Solution
• Agile & domain independent: no domain knowledge needed, uses only standard performance counters collected from:
• Hardware (e.g., temperature) • Operating system (e.g., number of threads) • Runtime system (e.g., garbage collected) • Application layer (e.g. transactions completed)
• Un-supervised
41 InfinIT seminar, March 2015

Bo Thiesson
Latent Fault Detection in Data Centers (cont.)
Assumptions: • Many machines, majority working properly at any point in
time • Machines are homogeneous (perform similar tasks on similar
hardware and software) • On average, workload is balanced across machines
• Counters are ordinal and reported at same rate • Counters are memoryless
42 InfinIT seminar, March 2015
Standard for (groups of) machines in big data centers
Technical assumptions that (I believe) can be softened with some thought

Bo Thiesson
Latent Fault Detection in Data Centers (cont.)
Anomaly detection framework (slightly simplified):
• 𝑥(𝑚, 𝑡): vector of performance counters for machine
𝑚∈𝑀 at time 𝑡 in epoch 𝑇.
• 𝑥(𝑡): collection of all 𝑥(𝑚, 𝑡) at time 𝑡 • For each machine 𝑚 compute:
• 𝑆(𝑚,𝑥(𝑡))= 1/|𝑀|−1 ∑𝑚≠𝑚′↑▒𝑥(𝑚,𝑡)−𝑥( 𝑚↑′ ,𝑡)/‖𝑥(𝑚,𝑡)−𝑥( 𝑚↑′ ,𝑡)‖
• Machine measure: 𝑣(𝑚)= 1/|𝑇|−1 ∑𝑡∈𝑇↑▒𝑆(𝑚,𝑥(𝑡))
• Compute centroid measure across all machines: 𝑣 • For each machine 𝑚, use statistical test 𝐹(e.g. sign-test,
Tukey-test, LOF-test)* to determine if deviance:
• 𝐹(|𝑣(𝑚)− 𝑣 |)>𝛼
43 InfinIT seminar, March 2015
*: See details in: Latent Fault Detection in Large Scale Services; Gabel, Schuster, Bachrach & Bjørner (2012)

Bo Thiesson
Latent Fault Detection in Data Centers (cont.)
Results – detection of latent faults: • 4500 machines • Considered fault latencies: 1 day, 7 days, 14 days • Incomplete health information labeled according to current
system “watchdogs” • True failure not reported by “watchdog” → counted as
false positive • Abrupt failure without proceeding latent faulting →
counted as false negative
44 InfinIT seminar, March 2015
⇒ Conservative result claims

Bo Thiesson
Corporate Security – Insider Threats (Xiang Wang, Jay Stokes,& Bo Thiesson)
• User/machine “social” network of • Approx. 100K users • Approx ½M machines
• Rich contextual information: • User: name, location, organization,
title,… • Machine: name, IP address,
services,,…
45 InfinIT seminar, March 2015

Bo Thiesson
Corporate Network Security (cont.)
46 InfinIT seminar, March 2015

Bo Thiesson
Corporate Network Security (cont.)
47 InfinIT seminar, March 2015
User-user similarity matrix User-user constraint matrix

Bo Thiesson
Corporate Network Security (cont.)
Anomalies over time -- visualization
48 InfinIT seminar, March 2015

Bo Thiesson
Corporate Network Security (cont.)
Who did we catch?
49 InfinIT seminar, March 2015
Bo Thiesson
Outline Basic setup & motivation
• 1 class ↔ 2 class • Application examples
Standard algorithms • Parametric - Gaussian modeling, Replicator Neural Networks • Non-parametric - NN modeling (distance & density based, LOF) • Clustering
Contextual detection The development process
• Feature selection & model validation
Microsoft applications • Excel (conditional formatting rules) • OSD (Bing, MSN, AdCenter) – Capacity prediction • OSD, Azure – Latent Fault Detection in Data Centers • Corporate Security – Insider Threats
Future (and current) challenges 50 InfinIT seminar, March 2015

Bo Thiesson
Future (and current) challenges – “Big Data” Volume • many transactions - billions - algorithms must be efficient
- [cannot just take sample] Velocity • Streaming data – efficient online, adaptive algorithms
- [reactive to drift] Variety • Data from many sources – mixed variable types, large number
of variables (many irrelevant), network data - [very demanding on distance measure & modeling process]
Other issues - different misclassification costs - unbalanced class sizes - delay in labeling (e.g., in credit card fraud) - mislabeled classes
51 InfinIT seminar, March 2015