Embed Size (px)
Citation preview
Motorola Solutions
1
Penang Technical Expo
[Reducing Cycle Time for iDEN Releases – A Development and Test
Perspective]
Praveen Srivastava
Leena V, Gyanesh K
* Engineering Manager in iDEN
Motorola Solutions, Bangalore, India
*Email: *[email protected]
Keywords: Cycle time, Changing customer requirements, Lean, Optimization, Quality
Abstract
iDEN system releases have been taking
longer time from M8 (System Requirements
allocated and project scope is baseline) to
M3 (Ready For Controlled Introduction)
when it is first commercially deployed. For
a typical iDEN system release, the duration
between M8 and M3 is close to 18 months.
The current releases are posing new
challenges to product development and
requires comparatively shorter cycle time.
This paper talks about such an iDEN release
which was done and ready for deployment in
less than 9 months. This paper analyzes the
techniques and strategy used by
development and test team to achieve this
and proposes techniques & strategies which
can be used by future iDEN releases.
1. Introduction
1.1 iDEN Product development in M –
Gate framework.
iDEN system releases follows M-Gate
framework to drive a new product from idea
to launch. At M8 start, system architecture
document ( SAD ) is ready and available for
sub-system requirement (REQ) creation.
This is followed by completion of
component design specifications (DD) and
test specification. Coding and unit testing
(UT) at task level is done after that.
Component Integration Testing (CIT) is
done to validate task level interactions. Box
test (BT) validates the functional box
requirement and interactions with other
network elements (NE) in simulated
environment. BT completion ensures
software quality is sufficient to start system
test (ST) .
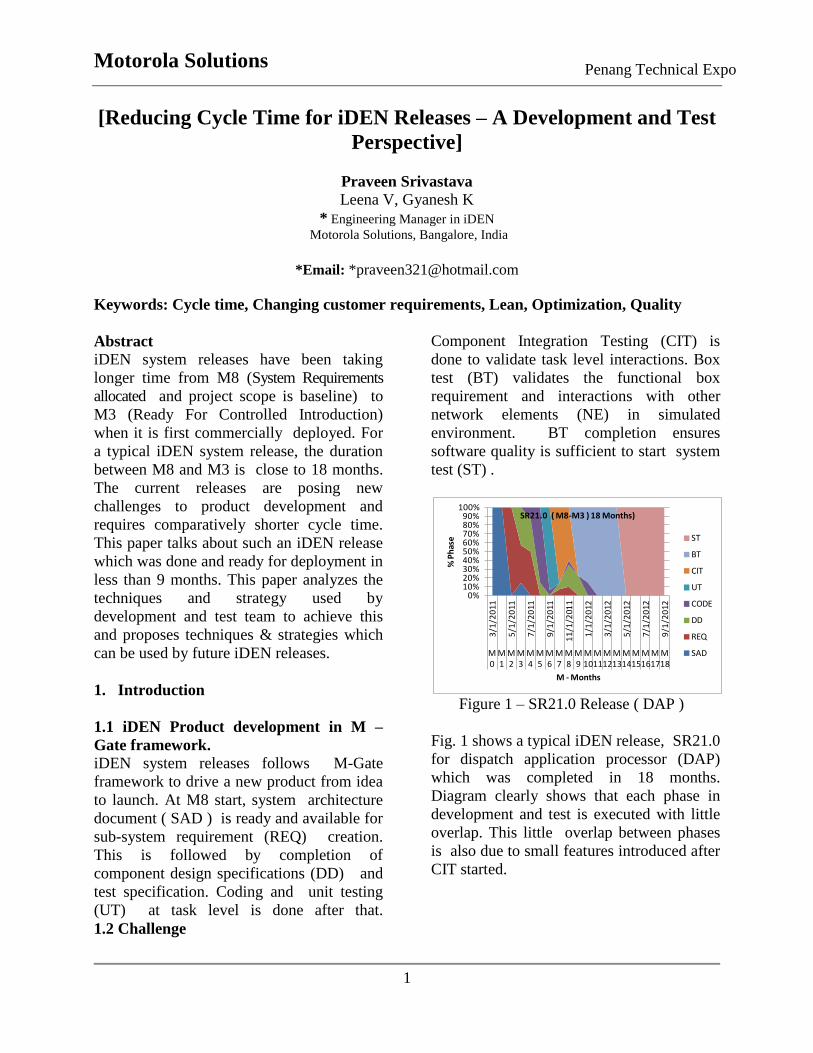
Figure 1 – SR21.0 Release ( DAP )
Fig. 1 shows a typical iDEN release, SR21.0
for dispatch application processor (DAP)
which was completed in 18 months.
Diagram clearly shows that each phase in
development and test is executed with little
overlap. This little overlap between phases
is also due to small features introduced after
CIT started.
1.2 Challenge
0%10%20%30%40%50%60%70%80%90%
100%
3/1
/20
11
5/1
/20
11
7/1
/20
11
9/1
/20
11
11
/1/2
011
1/1
/20
12
3/1
/20
12
5/1
/20
12
7/1
/20
12
9/1
/20
12
M 0
M 1
M 2
M 3
M 4
M 5
M 6
M 7
M 8
M 9
M 10
M 11
M 12
M 13
M 14
M 15
M 16
M 17
M 18
% P
has
e
M - Months
SR21.0 ( M8-M3 ) 18 Months)
ST
BT
CIT
UT
CODE
DD
REQ
SAD
Motorola Solutions
2
Penang Technical Expo
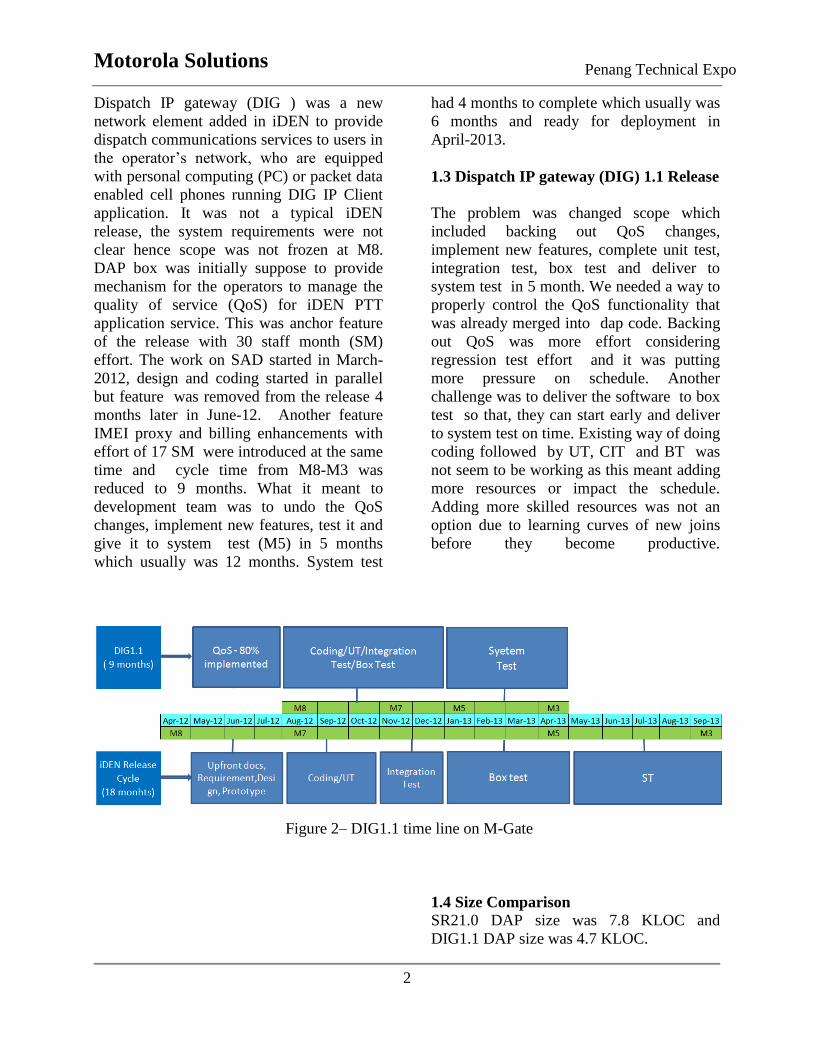
Dispatch IP gateway (DIG ) was a new
network element added in iDEN to provide
dispatch communications services to users in
the operator’s network, who are equipped
with personal computing (PC) or packet data
enabled cell phones running DIG IP Client
application. It was not a typical iDEN
release, the system requirements were not
clear hence scope was not frozen at M8.
DAP box was initially suppose to provide
mechanism for the operators to manage the
quality of service (QoS) for iDEN PTT
application service. This was anchor feature
of the release with 30 staff month (SM)
effort. The work on SAD started in March-
2012, design and coding started in parallel
but feature was removed from the release 4
months later in June-12. Another feature
IMEI proxy and billing enhancements with
effort of 17 SM were introduced at the same
time and cycle time from M8-M3 was
reduced to 9 months. What it meant to
development team was to undo the QoS
changes, implement new features, test it and
give it to system test (M5) in 5 months
which usually was 12 months. System test
had 4 months to complete which usually was
6 months and ready for deployment in
April-2013.
1.3 Dispatch IP gateway (DIG) 1.1 Release
The problem was changed scope which
included backing out QoS changes,
implement new features, complete unit test,
integration test, box test and deliver to
system test in 5 month. We needed a way to
properly control the QoS functionality that
was already merged into dap code. Backing
out QoS was more effort considering
regression test effort and it was putting
more pressure on schedule. Another
challenge was to deliver the software to box
test so that, they can start early and deliver
to system test on time. Existing way of doing
coding followed by UT, CIT and BT was
not seem to be working as this meant adding
more resources or impact the schedule.
Adding more skilled resources was not an
option due to learning curves of new joins
before they become productive.
Figure 2– DIG1.1 time line on M-Gate
1.4 Size Comparison
SR21.0 DAP size was 7.8 KLOC and
DIG1.1 DAP size was 4.7 KLOC.
Motorola Solutions
3
Penang Technical Expo
2.1 Response to Challenge
DIG1.1 ST was to start from Jan 14, 2013,
FOA was in April -13, so we started looking
for ways to reduce development and test
cycle time. Obvious choice was to opt for
design requiring less regression, do things in
parallel and reduce duplicates wherever
possible.
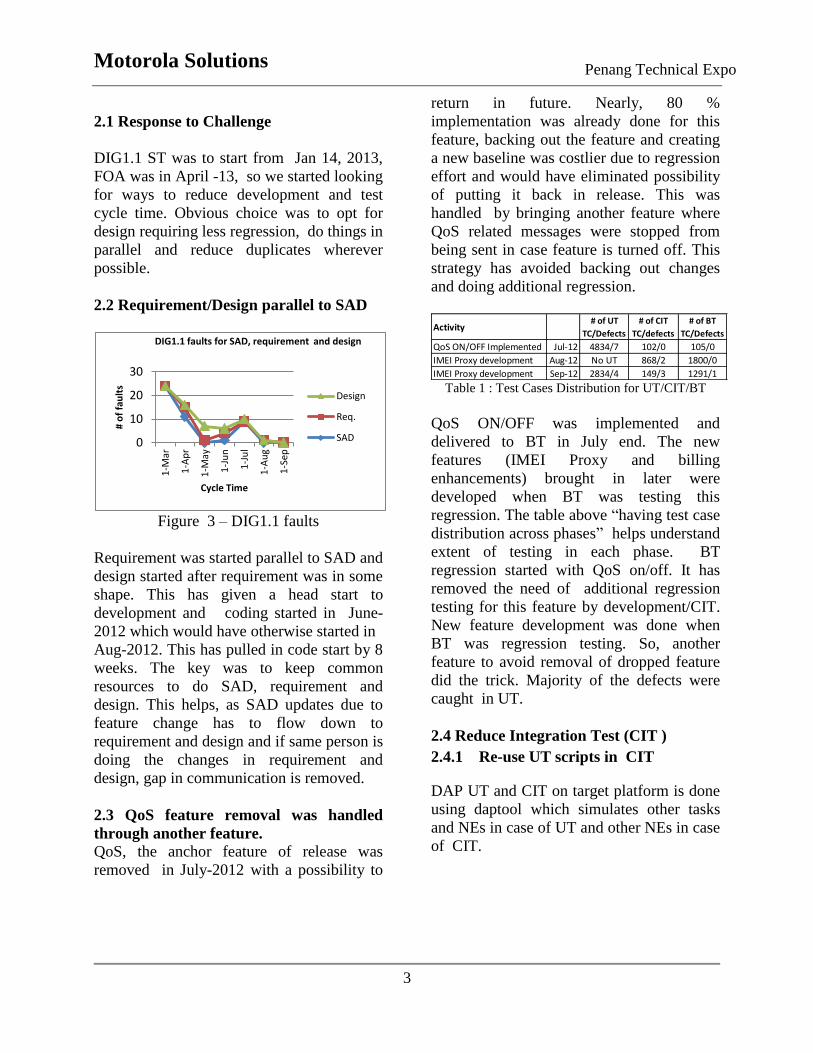
2.2 Requirement/Design parallel to SAD
Figure 3 – DIG1.1 faults
Requirement was started parallel to SAD and
design started after requirement was in some
shape. This has given a head start to
development and coding started in June-
2012 which would have otherwise started in
Aug-2012. This has pulled in code start by 8
weeks. The key was to keep common
resources to do SAD, requirement and
design. This helps, as SAD updates due to
feature change has to flow down to
requirement and design and if same person is
doing the changes in requirement and
design, gap in communication is removed.
2.3 QoS feature removal was handled
through another feature.
QoS, the anchor feature of release was
removed in July-2012 with a possibility to
return in future. Nearly, 80 %
implementation was already done for this
feature, backing out the feature and creating
a new baseline was costlier due to regression
effort and would have eliminated possibility
of putting it back in release. This was
handled by bringing another feature where
QoS related messages were stopped from
being sent in case feature is turned off. This
strategy has avoided backing out changes
and doing additional regression.
Activity# of UT
TC/Defects
# of CIT
TC/defects
# of BT
TC/Defects
QoS ON/OFF Implemented Jul-12 4834/7 102/0 105/0
IMEI Proxy development Aug-12 No UT 868/2 1800/0
IMEI Proxy development Sep-12 2834/4 149/3 1291/1
Table 1 : Test Cases Distribution for UT/CIT/BT
QoS ON/OFF was implemented and
delivered to BT in July end. The new
features (IMEI Proxy and billing
enhancements) brought in later were
developed when BT was testing this
regression. The table above “having test case
distribution across phases” helps understand
extent of testing in each phase. BT
regression started with QoS on/off. It has
removed the need of additional regression
testing for this feature by development/CIT.
New feature development was done when
BT was regression testing. So, another
feature to avoid removal of dropped feature
did the trick. Majority of the defects were
caught in UT.
2.4 Reduce Integration Test (CIT )
2.4.1 Re-use UT scripts in CIT
DAP UT and CIT on target platform is done
using daptool which simulates other tasks
and NEs in case of UT and other NEs in case
of CIT.
0
10
20
30
1-M
ar
1-A
pr
1-M
ay
1-J
un
1-J
ul
1-A
ug
1-S
ep
# o
f fa
ult
s
Cycle Time
DIG1.1 faults for SAD, requirement and design
Design
Req.
SAD
Motorola Solutions
4
Penang Technical Expo
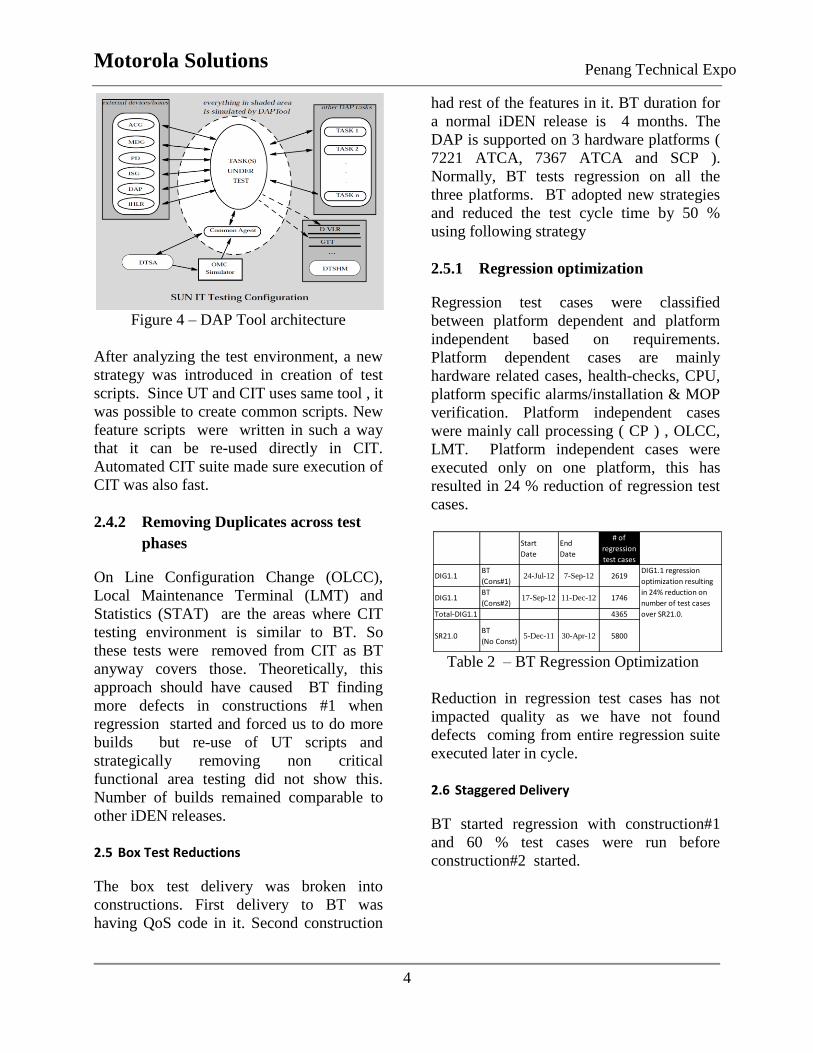
Figure 4 – DAP Tool architecture
After analyzing the test environment, a new
strategy was introduced in creation of test
scripts. Since UT and CIT uses same tool , it
was possible to create common scripts. New
feature scripts were written in such a way
that it can be re-used directly in CIT.
Automated CIT suite made sure execution of
CIT was also fast.
2.4.2 Removing Duplicates across test
phases
On Line Configuration Change (OLCC),
Local Maintenance Terminal (LMT) and
Statistics (STAT) are the areas where CIT
testing environment is similar to BT. So
these tests were removed from CIT as BT
anyway covers those. Theoretically, this
approach should have caused BT finding
more defects in constructions #1 when
regression started and forced us to do more
builds but re-use of UT scripts and
strategically removing non critical
functional area testing did not show this.
Number of builds remained comparable to
other iDEN releases.
2.5 Box Test Reductions
The box test delivery was broken into
constructions. First delivery to BT was
having QoS code in it. Second construction
had rest of the features in it. BT duration for
a normal iDEN release is 4 months. The
DAP is supported on 3 hardware platforms (
7221 ATCA, 7367 ATCA and SCP ).
Normally, BT tests regression on all the
three platforms. BT adopted new strategies
and reduced the test cycle time by 50 %
using following strategy
2.5.1 Regression optimization
Regression test cases were classified
between platform dependent and platform
independent based on requirements.
Platform dependent cases are mainly
hardware related cases, health-checks, CPU,
platform specific alarms/installation & MOP
verification. Platform independent cases
were mainly call processing ( CP ) , OLCC,
LMT. Platform independent cases were
executed only on one platform, this has
resulted in 24 % reduction of regression test
cases.
Table 2 – BT Regression Optimization
Reduction in regression test cases has not
impacted quality as we have not found
defects coming from entire regression suite
executed later in cycle.
2.6 Staggered Delivery
BT started regression with construction#1
and 60 % test cases were run before
construction#2 started.
Start
Date
End
Date
# of
regression
test cases
DIG1.1BT
(Cons#1)24-Jul-12 7-Sep-12 2619
DIG1.1BT
(Cons#2)17-Sep-12 11-Dec-12 1746
Total-DIG1.1 4365
SR21.0BT
(No Const)5-Dec-11 30-Apr-12 5800
DIG1.1 regression
optimization resulting
in 24% reduction on
number of test cases
over SR21.0.
Motorola Solutions
5
Penang Technical Expo
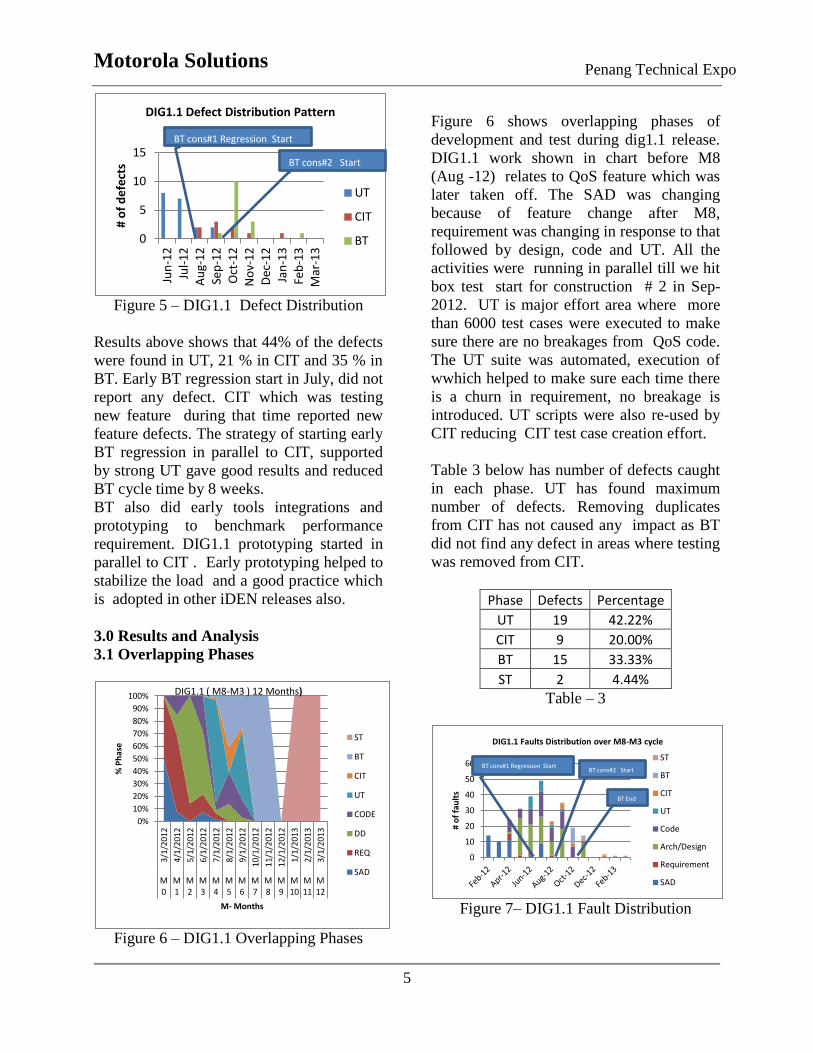
Figure 5 – DIG1.1 Defect Distribution
Results above shows that 44% of the defects
were found in UT, 21 % in CIT and 35 % in
BT. Early BT regression start in July, did not
report any defect. CIT which was testing
new feature during that time reported new
feature defects. The strategy of starting early
BT regression in parallel to CIT, supported
by strong UT gave good results and reduced
BT cycle time by 8 weeks.
BT also did early tools integrations and
prototyping to benchmark performance
requirement. DIG1.1 prototyping started in
parallel to CIT . Early prototyping helped to
stabilize the load and a good practice which
is adopted in other iDEN releases also.
3.0 Results and Analysis
3.1 Overlapping Phases
Figure 6 – DIG1.1 Overlapping Phases
Figure 6 shows overlapping phases of
development and test during dig1.1 release.
DIG1.1 work shown in chart before M8
(Aug -12) relates to QoS feature which was
later taken off. The SAD was changing
because of feature change after M8,
requirement was changing in response to that
followed by design, code and UT. All the
activities were running in parallel till we hit
box test start for construction # 2 in Sep-
2012. UT is major effort area where more
than 6000 test cases were executed to make
sure there are no breakages from QoS code.
The UT suite was automated, execution of
wwhich helped to make sure each time there
is a churn in requirement, no breakage is
introduced. UT scripts were also re-used by
CIT reducing CIT test case creation effort.
Table 3 below has number of defects caught
in each phase. UT has found maximum
number of defects. Removing duplicates
from CIT has not caused any impact as BT
did not find any defect in areas where testing
was removed from CIT.
Phase Defects Percentage
UT 19 42.22%
CIT 9 20.00%
BT 15 33.33%
ST 2 4.44%
Table – 3
Figure 7– DIG1.1 Fault Distribution
0
5
10
15 Ju
n-1
2
Jul-
12
A
ug-
12
Se
p-1
2
Oct
-12
N
ov-
12
D
ec-1
2
Jan
-13
Fe
b-1
3
Mar
-13
# o
f d
efe
cts
DIG1.1 Defect Distribution Pattern
UT
CIT
BT
BT cons#1 Regression Start
BT cons#2 Start
0%
10%
20%
30%
40%
50%
60%
70%
80%
90%
100%
3/1
/20
12
4/1
/20
12
5/1
/20
12
6/1
/20
12
7/1
/20
12
8/1
/20
12
9/1
/20
12
10
/1/2
01
2
11
/1/2
01
2
12
/1/2
01
2
1/1
/20
13
2/1
/20
13
3/1
/20
13
M 0
M 1
M 2
M 3
M 4
M 5
M 6
M 7
M 8
M 9
M 10
M 11
M 12
% P
has
e
M- Months
DIG1.1 ( M8-M3 ) 12 Months)
ST
BT
CIT
UT
CODE
DD
REQ
SAD
0
10
20
30
40
50
60
# o
f fa
ult
s
DIG1.1 Faults Distribution over M8-M3 cycle
ST
BT
CIT
UT
Code
Arch/Design
Requirement
SAD
BT cons#1 Regression Start BT cons#2 Start
BT End
Motorola Solutions
6
Penang Technical Expo
Script re-use of UT has worked well. CIT
did find defects from re-used scripts as tests
were now done with real tasks. So this
strategy also worked very well. Figure 7
shows the fault distribution which need to be
seen along with figure 6 where activities are
shown in that period. Faults were coming
from each areas during the development and
test going in parallel. It stopped after BT end
and very few defects were reported from ST.
This proves strategy of minimizing CIT and
optimizing BT worked very well w/o any
compromise on quality.
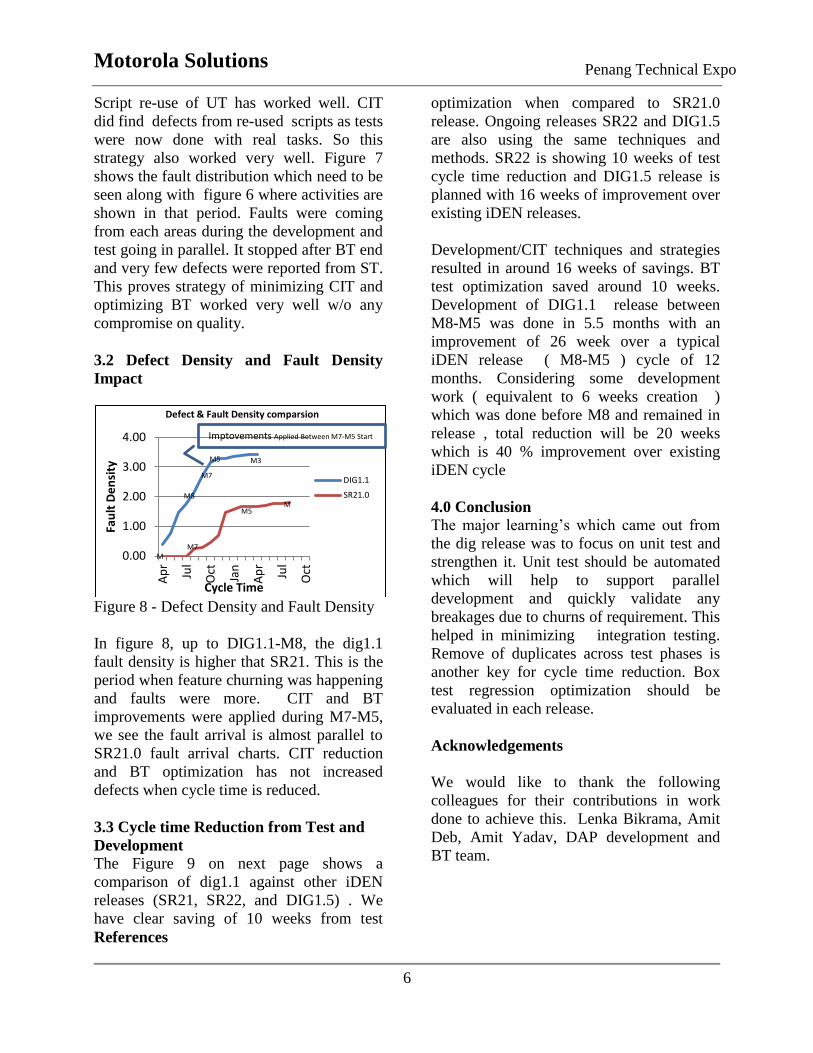
3.2 Defect Density and Fault Density
Impact
Figure 8 - Defect Density and Fault Density
In figure 8, up to DIG1.1-M8, the dig1.1
fault density is higher that SR21. This is the
period when feature churning was happening
and faults were more. CIT and BT
improvements were applied during M7-M5,
we see the fault arrival is almost parallel to
SR21.0 fault arrival charts. CIT reduction
and BT optimization has not increased
defects when cycle time is reduced.
3.3 Cycle time Reduction from Test and
Development
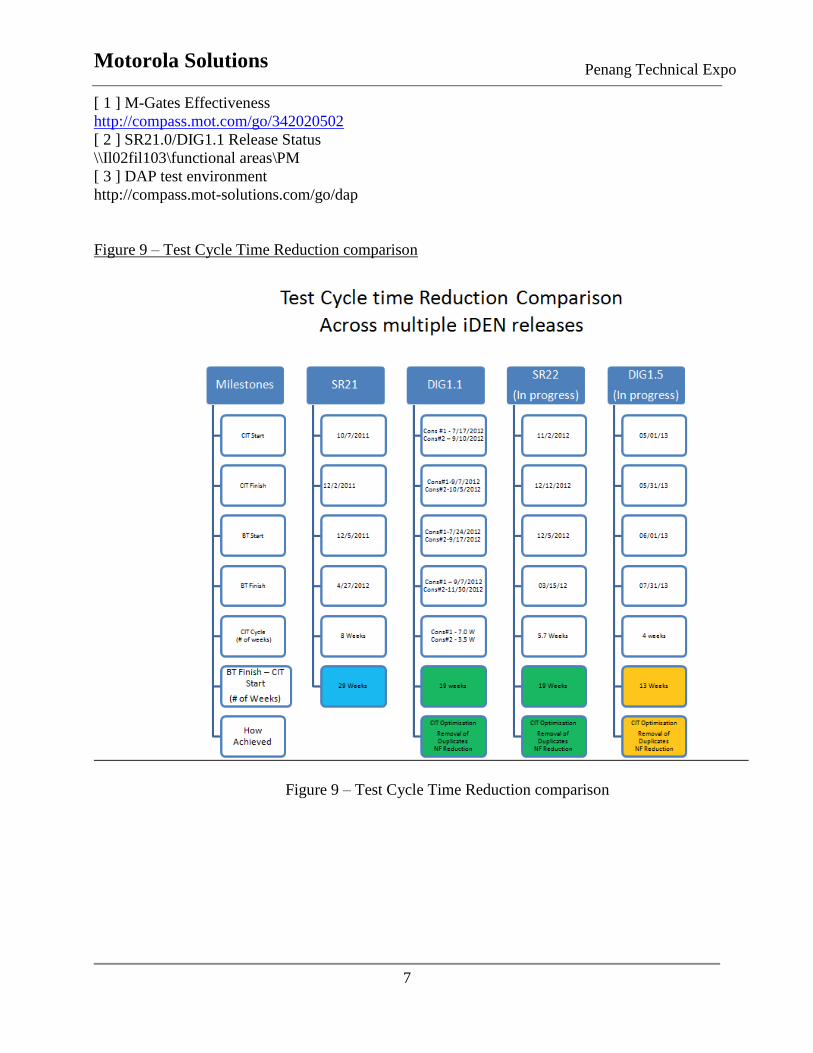
The Figure 9 on next page shows a
comparison of dig1.1 against other iDEN
releases (SR21, SR22, and DIG1.5) . We
have clear saving of 10 weeks from test
optimization when compared to SR21.0
release. Ongoing releases SR22 and DIG1.5
are also using the same techniques and
methods. SR22 is showing 10 weeks of test
cycle time reduction and DIG1.5 release is
planned with 16 weeks of improvement over
existing iDEN releases.
Development/CIT techniques and strategies
resulted in around 16 weeks of savings. BT
test optimization saved around 10 weeks.
Development of DIG1.1 release between
M8-M5 was done in 5.5 months with an
improvement of 26 week over a typical
iDEN release ( M8-M5 ) cycle of 12
months. Considering some development
work ( equivalent to 6 weeks creation )
which was done before M8 and remained in
release , total reduction will be 20 weeks
which is 40 % improvement over existing
iDEN cycle
4.0 Conclusion
The major learning’s which came out from
the dig release was to focus on unit test and
strengthen it. Unit test should be automated
which will help to support parallel
development and quickly validate any
breakages due to churns of requirement. This
helped in minimizing integration testing.
Remove of duplicates across test phases is
another key for cycle time reduction. Box
test regression optimization should be
evaluated in each release.
Acknowledgements
We would like to thank the following
colleagues for their contributions in work
done to achieve this. Lenka Bikrama, Amit
Deb, Amit Yadav, DAP development and
BT team.
References
0.00
1.00
2.00
3.00
4.00
Ap
r
Jul
Oct
Jan
Ap
r
Jul
Oct
Fau
lt D
en
sity
Cycle Time
Defect & Fault Density comparsion
DIG1.1
SR21.0
M7
M5
M7
M5 M3
M
M
M8
Imptovements Applied Between M7-M5 Start
Motorola Solutions
7
Penang Technical Expo
[ 1 ] M-Gates Effectiveness
http://compass.mot.com/go/342020502
[ 2 ] SR21.0/DIG1.1 Release Status
\\Il02fil103\functional areas\PM
[ 3 ] DAP test environment
http://compass.mot-solutions.com/go/dap
Figure 9 – Test Cycle Time Reduction comparison
Figure 9 – Test Cycle Time Reduction comparison

Motorola Solutions
8
Penang Technical Expo