Embed Size (px)
Citation preview
GTTS-EHU systems for QUESST
at MediaEval 2014 Luis J. Rodriguez-Fuentes, A. Varona, M. Penagarikano,
G. Bordel, M. Diez University of the Basque Country UPV/EHU
http://gtts.ehu.es [email protected]
Overview• System design
• Feature extraction • Speech activity detection • DTW query matching • Calibration and fusion
• Results • GTTS-EHU systems • Computational costs • Cnxe and TWV performance
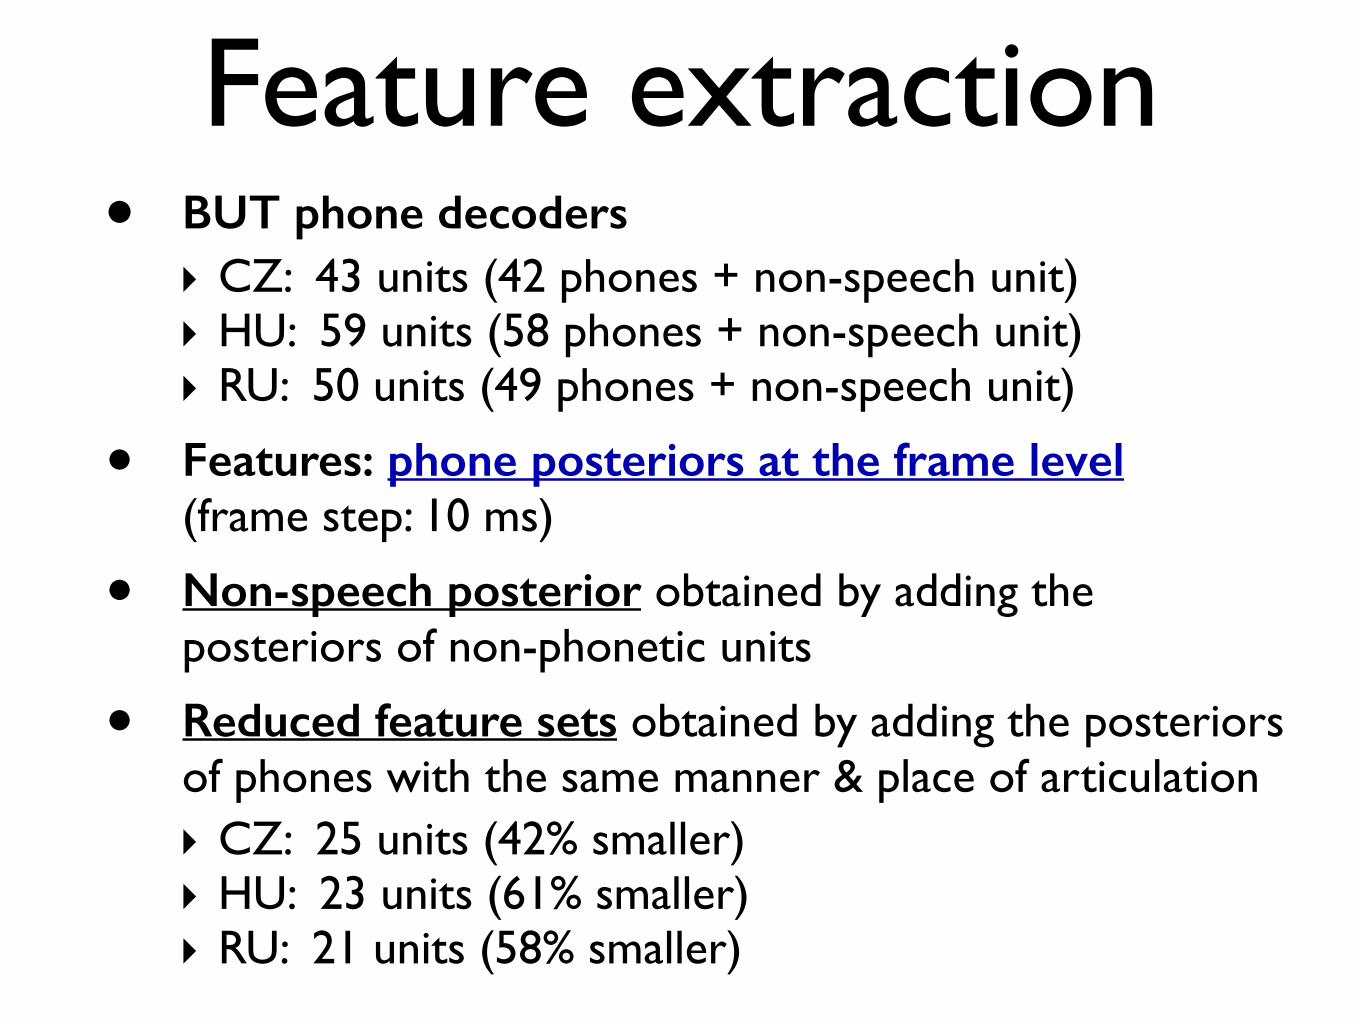
Feature extraction• BUT phone decoders
‣ CZ: 43 units (42 phones + non-speech unit) ‣ HU: 59 units (58 phones + non-speech unit) ‣ RU: 50 units (49 phones + non-speech unit)
• Features: phone posteriors at the frame level (frame step: 10 ms)
• Non-speech posterior obtained by adding the posteriors of non-phonetic units
• Reduced feature sets obtained by adding the posteriors of phones with the same manner & place of articulation ‣ CZ: 25 units (42% smaller) ‣ HU: 23 units (61% smaller) ‣ RU: 21 units (58% smaller)
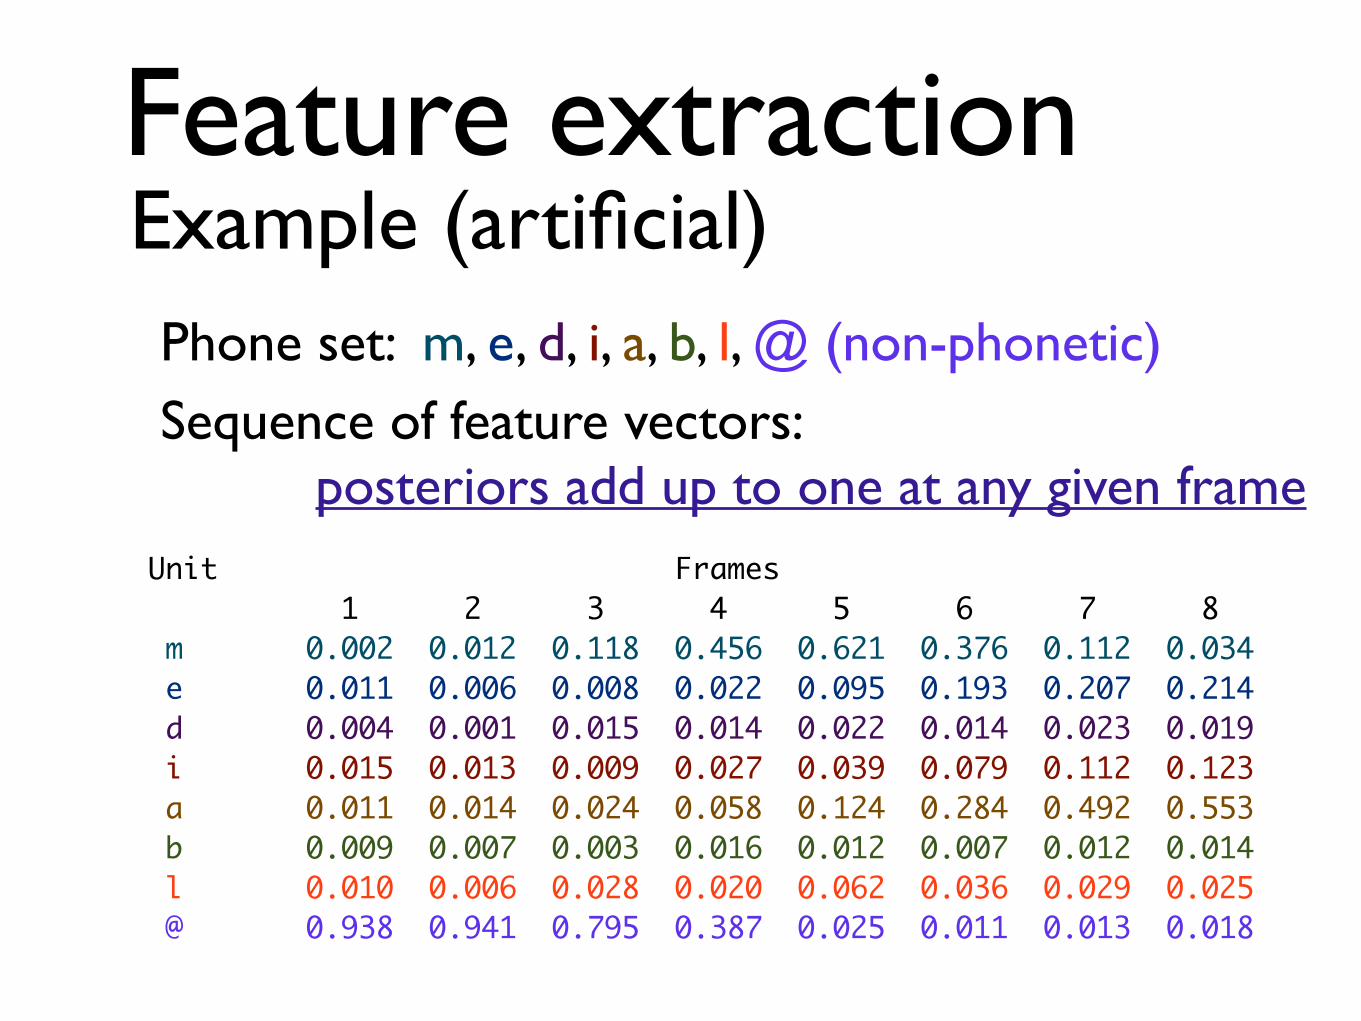
Feature extraction Example (artificial)
Phone set: m, e, d, i, a, b, l, @ (non-phonetic) Sequence of feature vectors: posteriors add up to one at any given frame
Unit Frames 1 2 3 4 5 6 7 8 m 0.002 0.012 0.118 0.456 0.621 0.376 0.112 0.034 e 0.011 0.006 0.008 0.022 0.095 0.193 0.207 0.214 d 0.004 0.001 0.015 0.014 0.022 0.014 0.023 0.019 i 0.015 0.013 0.009 0.027 0.039 0.079 0.112 0.123 a 0.011 0.014 0.024 0.058 0.124 0.284 0.492 0.553 b 0.009 0.007 0.003 0.016 0.012 0.007 0.012 0.014 l 0.010 0.006 0.028 0.020 0.062 0.036 0.029 0.025 @ 0.938 0.941 0.795 0.387 0.025 0.011 0.013 0.018
Speech Activity Detection
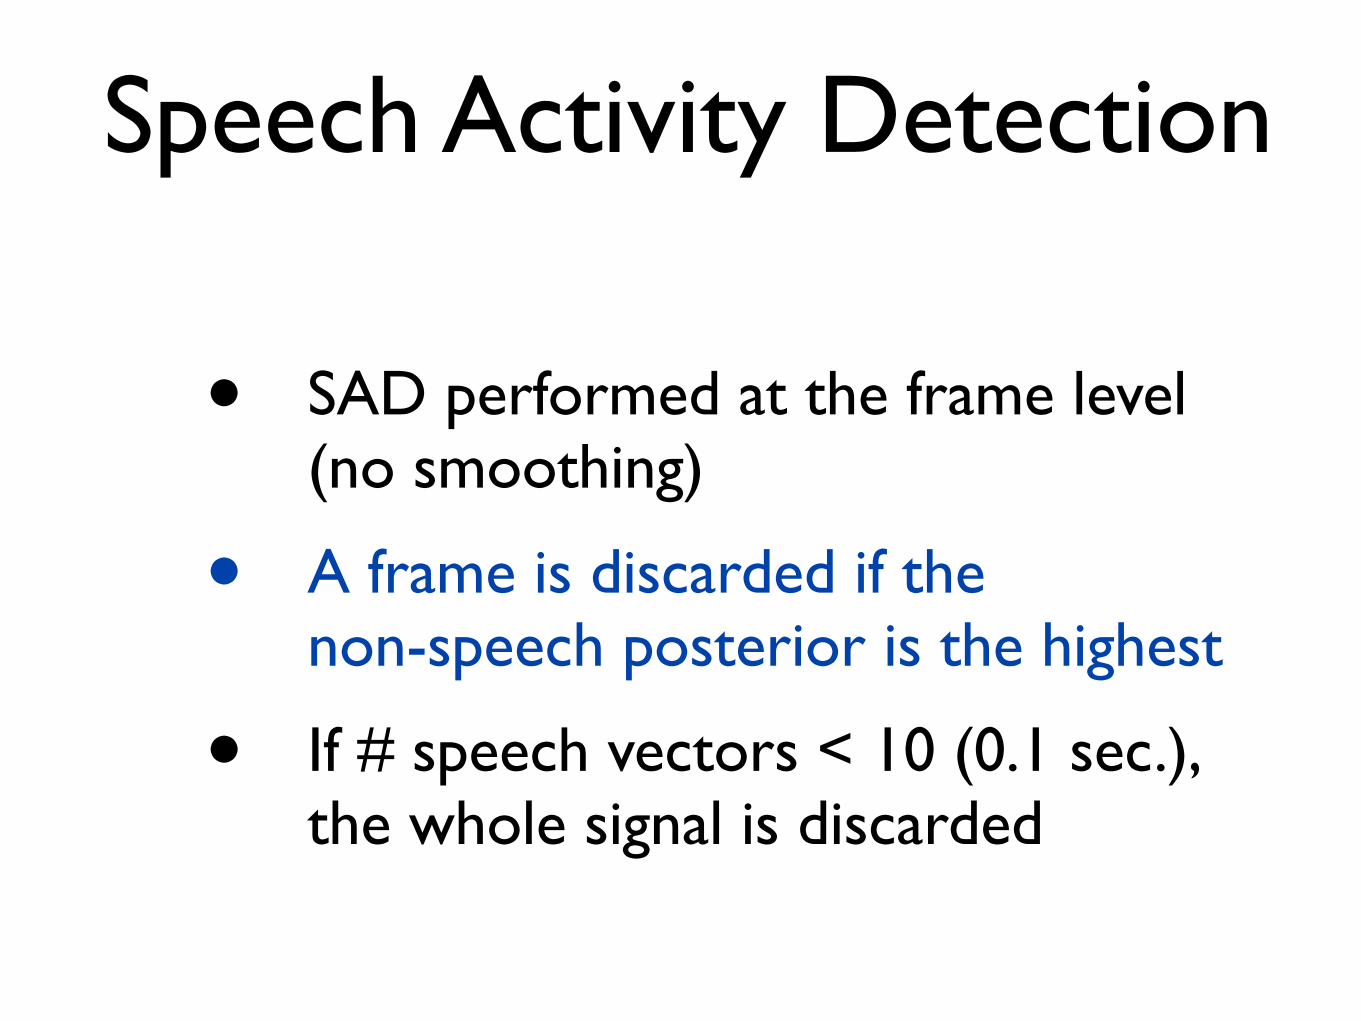
• SAD performed at the frame level (no smoothing)
• A frame is discarded if the non-speech posterior is the highest
• If # speech vectors < 10 (0.1 sec.), the whole signal is discarded
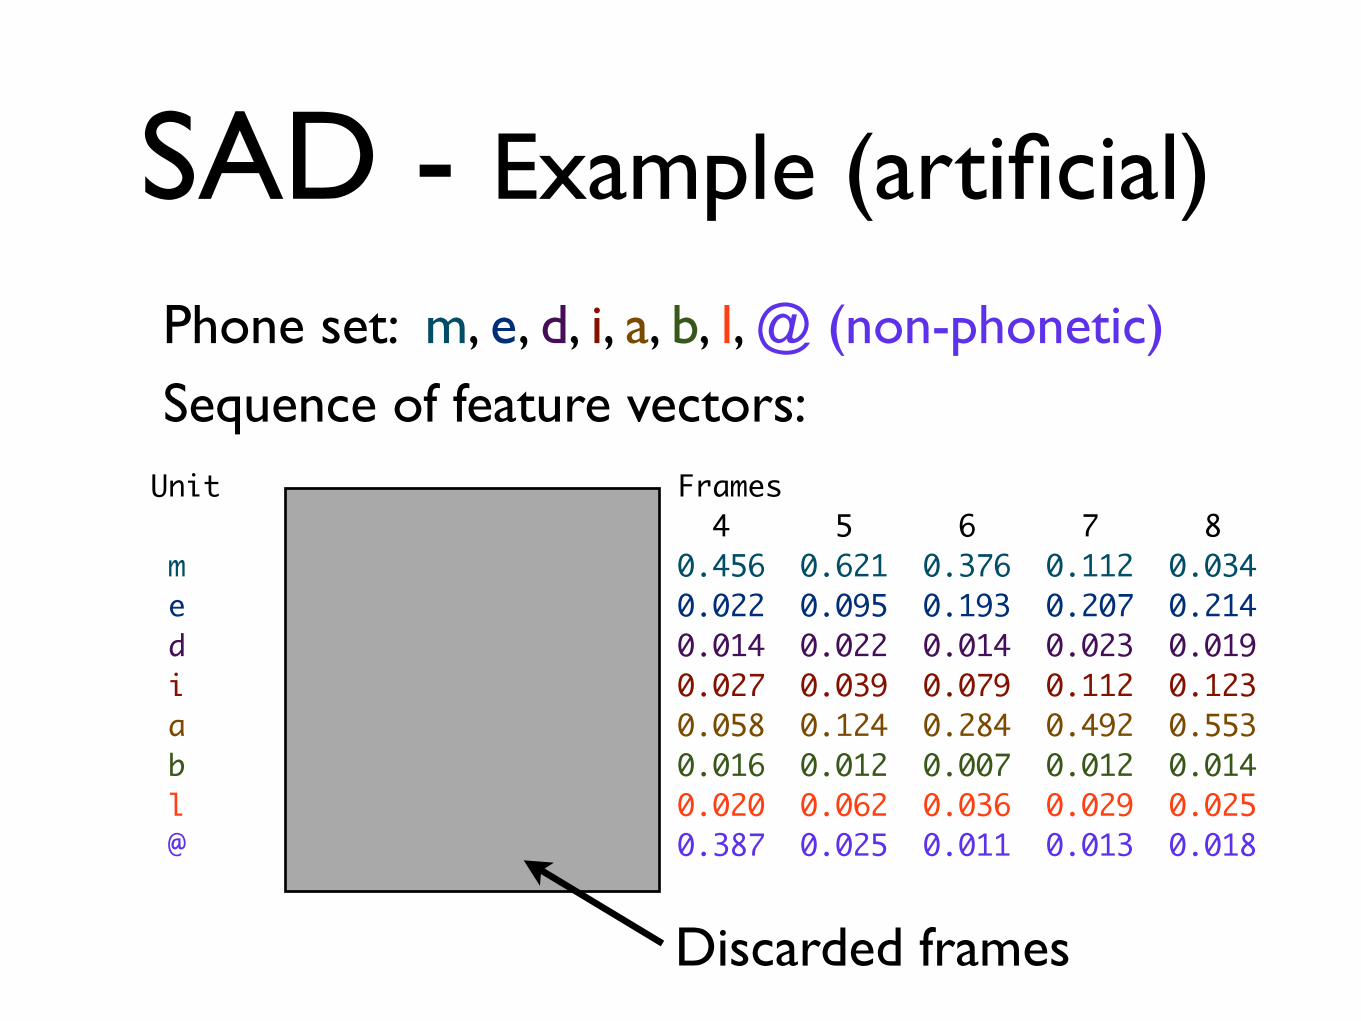
SAD - Example (artificial)
Phone set: m, e, d, i, a, b, l, @ (non-phonetic) Sequence of feature vectors:
Unit Frames 1 2 3 4 5 6 7 8 m 0.002 0.012 0.118 0.456 0.621 0.376 0.112 0.034 e 0.011 0.006 0.008 0.022 0.095 0.193 0.207 0.214 d 0.004 0.001 0.015 0.014 0.022 0.014 0.023 0.019 i 0.015 0.013 0.009 0.027 0.039 0.079 0.112 0.123 a 0.011 0.014 0.024 0.058 0.124 0.284 0.492 0.553 b 0.009 0.007 0.003 0.016 0.012 0.007 0.012 0.014 l 0.010 0.006 0.028 0.020 0.062 0.036 0.029 0.025 @ 0.938 0.941 0.795 0.387 0.025 0.011 0.013 0.018
Discarded frames
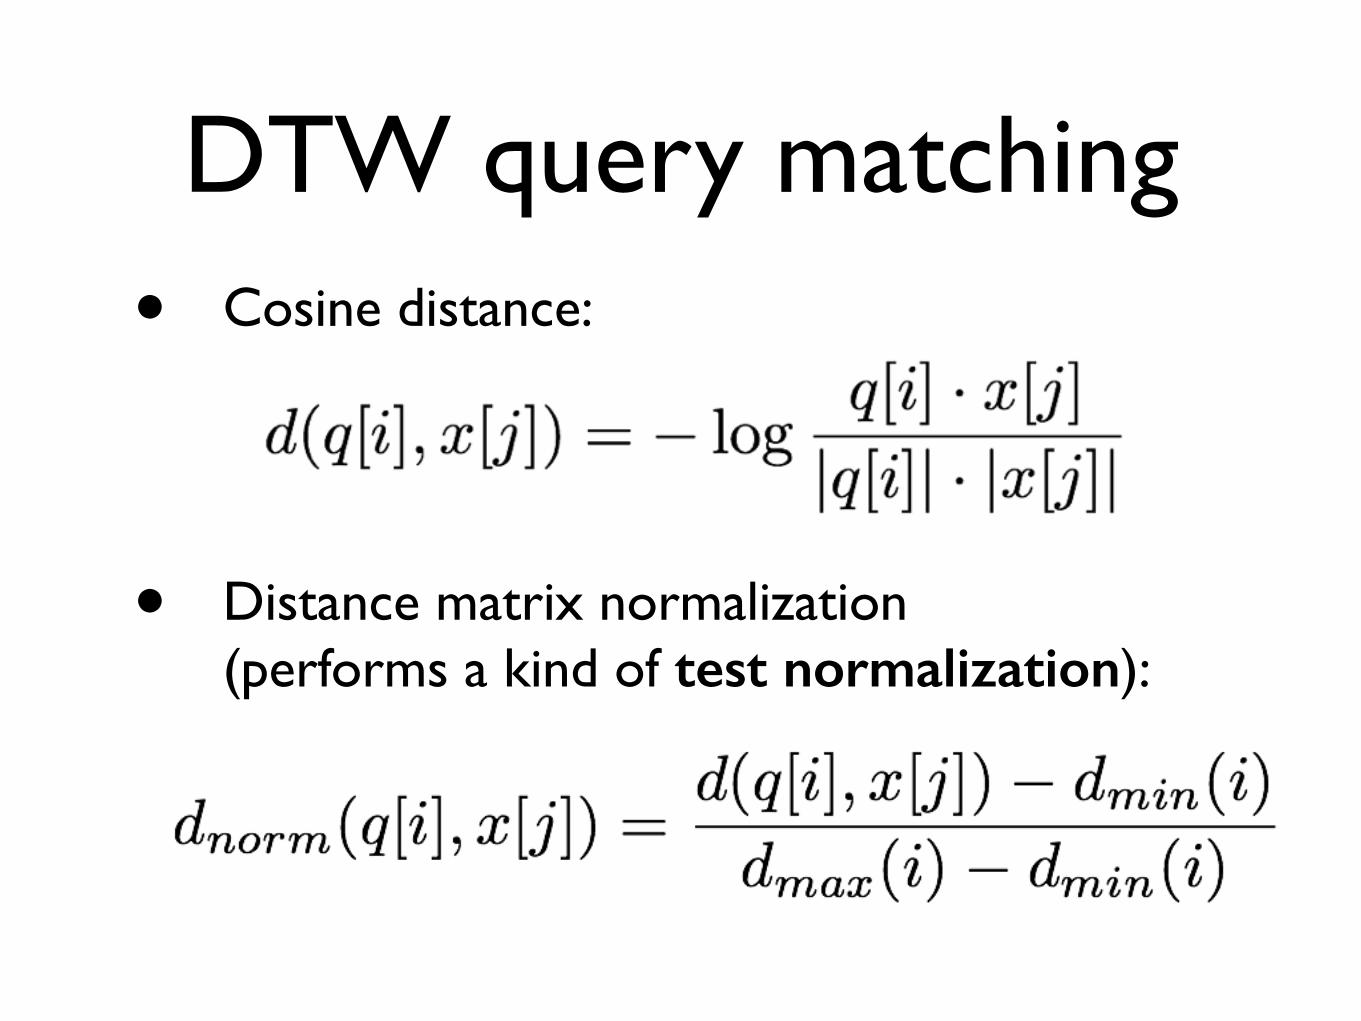
DTW query matching• Cosine distance:
!
!
• Distance matrix normalization (performs a kind of test normalization): !
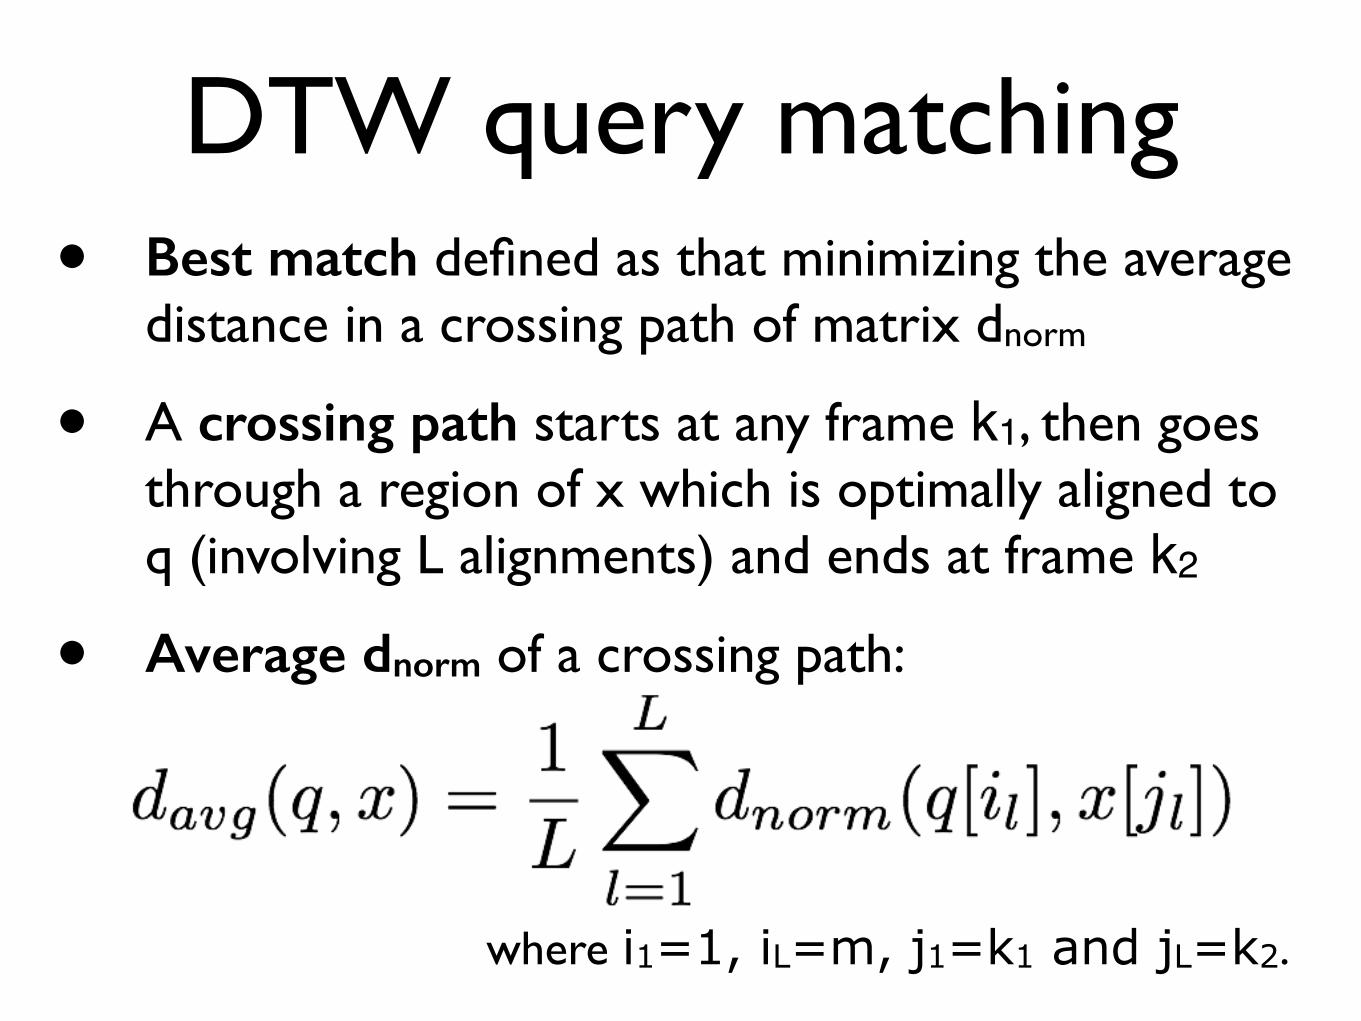
DTW query matching• Best match defined as that minimizing the average
distance in a crossing path of matrix dnorm
• A crossing path starts at any frame k1, then goes through a region of x which is optimally aligned to q (involving L alignments) and ends at frame k2
• Average dnorm of a crossing path:
!
!
where i1=1, iL=m, j1=k1 and jL=k2.
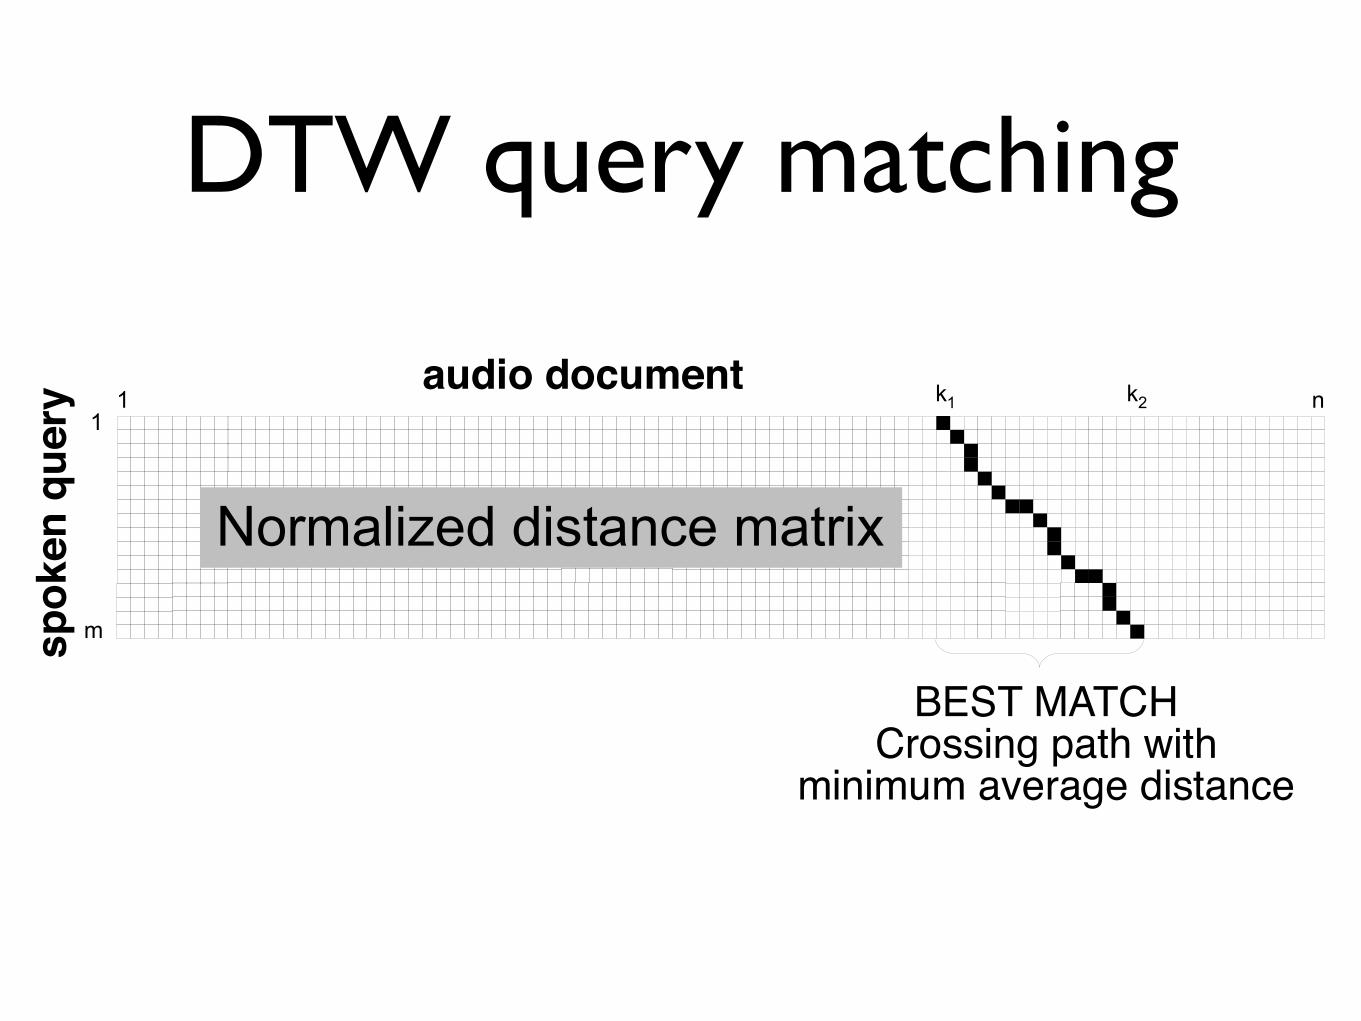
DTW query matching
BEST MATCHCrossing path with
minimum average distance
spok
en q
uery
audio document
Normalized distance matrix
1
m
1 nk1 k2
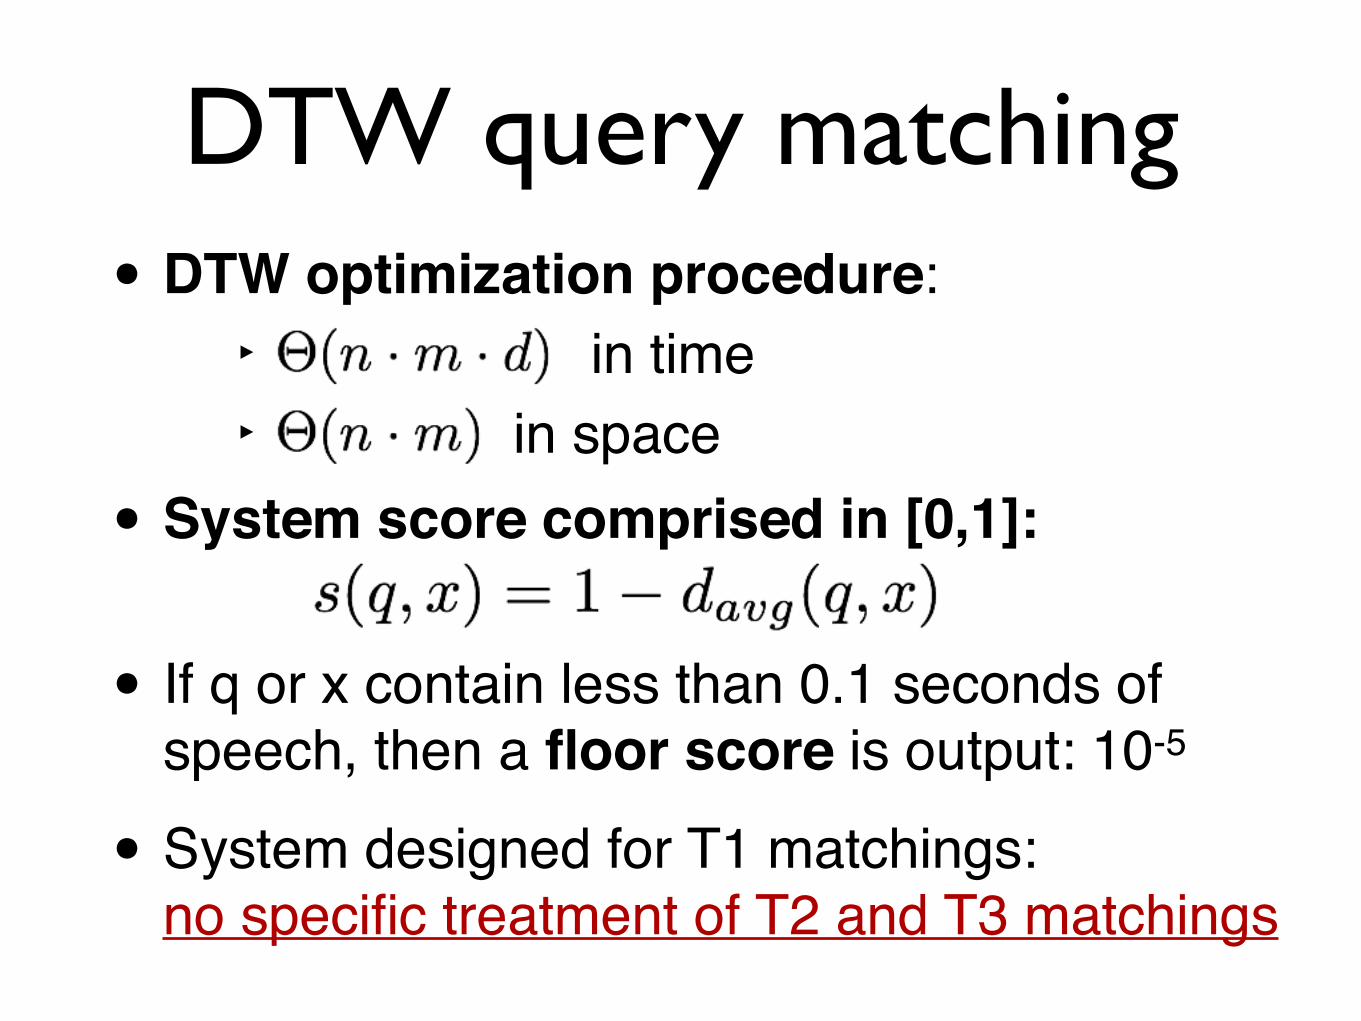
DTW query matching• DTW optimization procedure:!
‣ in time!‣ in space!
• System score comprised in [0,1]:!!
• If q or x contain less than 0.1 seconds of speech, then a floor score is output: 10-5!
• System designed for T1 matchings:no specific treatment of T2 and T3 matchings
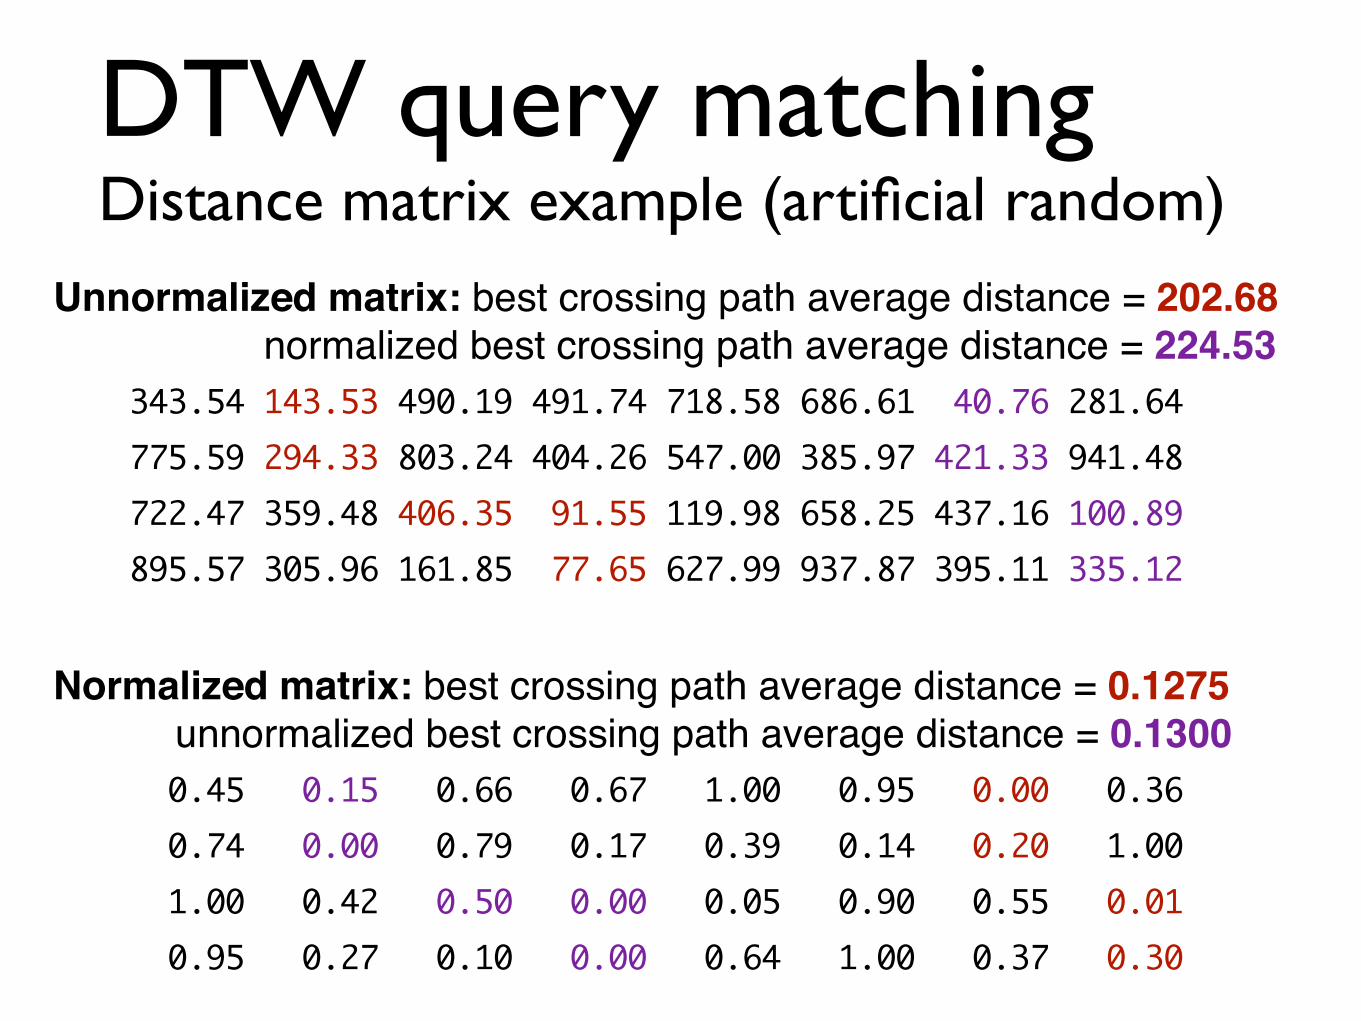
DTW query matching Distance matrix example (artificial random)
Unnormalized matrix: best crossing path average distance = 202.68! normalized best crossing path average distance = 224.53! 343.54 143.53 490.19 491.74 718.58 686.61 40.76 281.64 775.59 294.33 803.24 404.26 547.00 385.97 421.33 941.48 722.47 359.48 406.35 91.55 119.98 658.25 437.16 100.89 895.57 305.96 161.85 77.65 627.99 937.87 395.11 335.12!
Normalized matrix: best crossing path average distance = 0.1275! unnormalized best crossing path average distance = 0.1300! 0.45 0.15 0.66 0.67 1.00 0.95 0.00 0.36 0.74 0.00 0.79 0.17 0.39 0.14 0.20 1.00 1.00 0.42 0.50 0.00 0.05 0.90 0.55 0.01 0.95 0.27 0.10 0.00 0.64 1.00 0.37 0.30
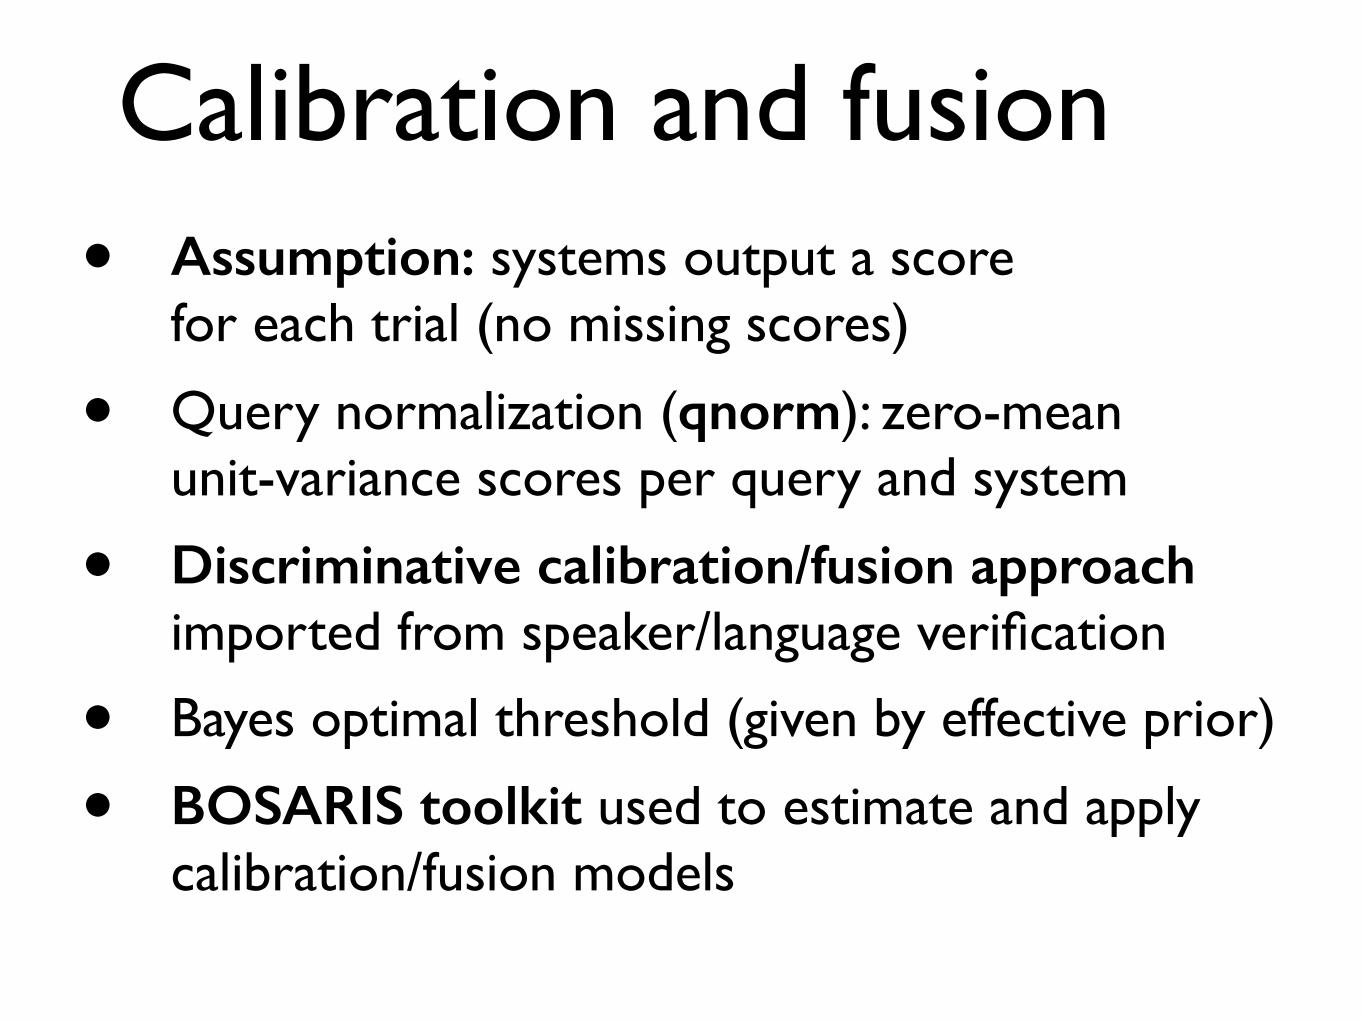
Calibration and fusion• Assumption: systems output a score
for each trial (no missing scores)
• Query normalization (qnorm): zero-mean unit-variance scores per query and system
• Discriminative calibration/fusion approach imported from speaker/language verification
• Bayes optimal threshold (given by effective prior)
• BOSARIS toolkit used to estimate and apply calibration/fusion models
Calibration and fusion
Details can be found in:!A. Abad, L. J. Rodriguez Fuentes, M. Penagarikano, A. Varona, M. Diez and G. Bordel. On the calibration and fusion of heterogeneous spoken term detection systems. In Interspeech 2013, Lyon, France, August 25-29, 2013.!!
Software and further info available at:!https://www.l2f.inesc-id.pt/wiki/index.php/STDfusion
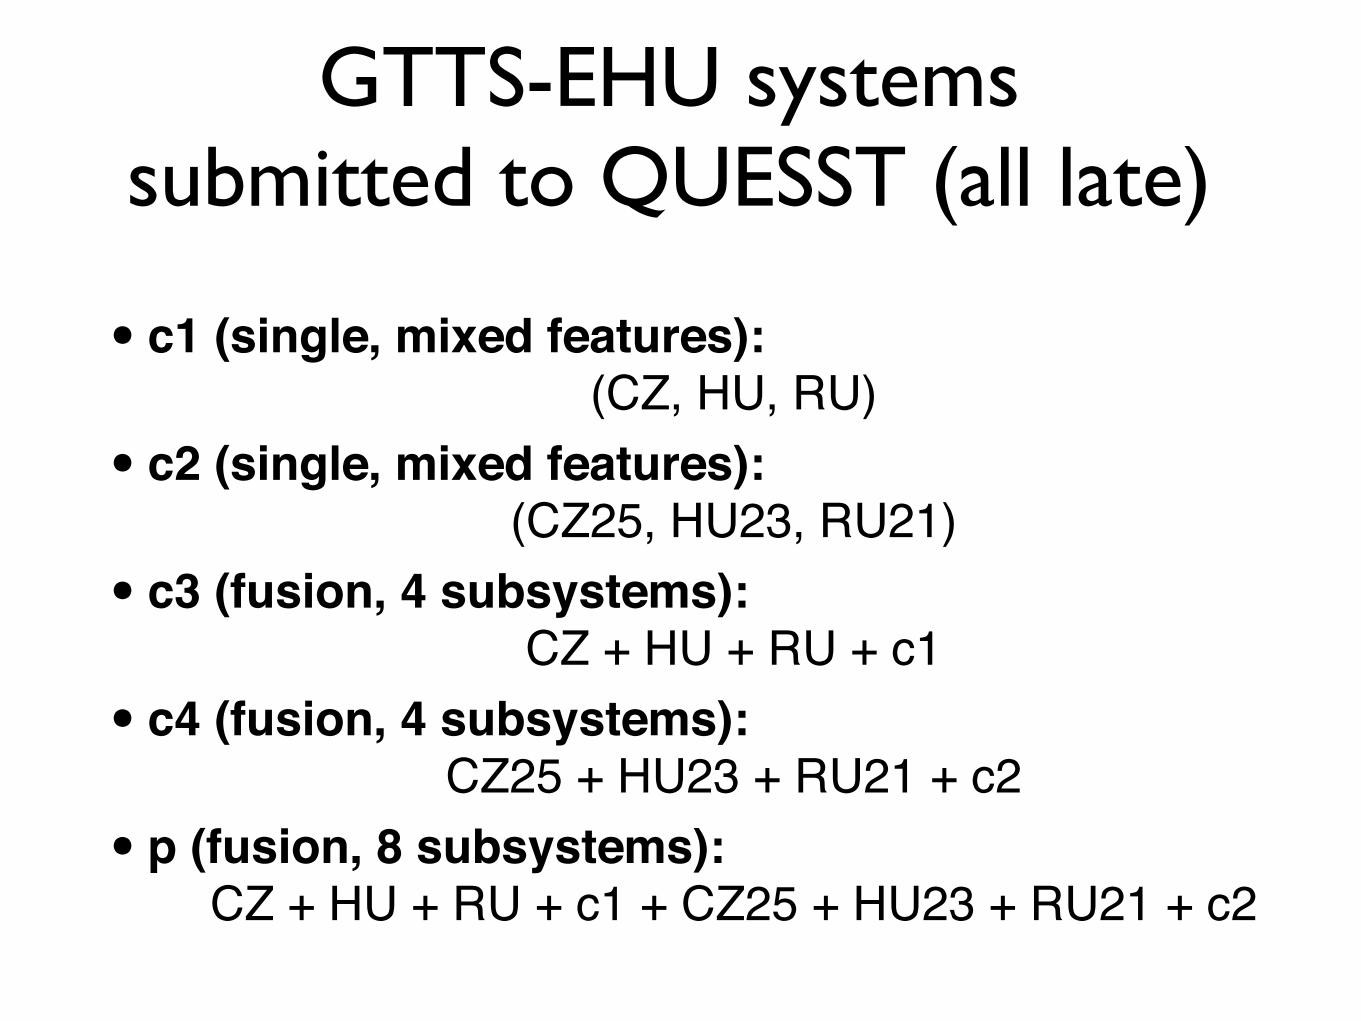
GTTS-EHU systems submitted to QUESST (all late)
• c1 (single, mixed features):!(CZ, HU, RU)!
• c2 (single, mixed features):!(CZ25, HU23, RU21)!
• c3 (fusion, 4 subsystems):!CZ + HU + RU + c1!
• c4 (fusion, 4 subsystems):!CZ25 + HU23 + RU21 + c2!
• p (fusion, 8 subsystems):!CZ + HU + RU + c1 + CZ25 + HU23 + RU21 + c2
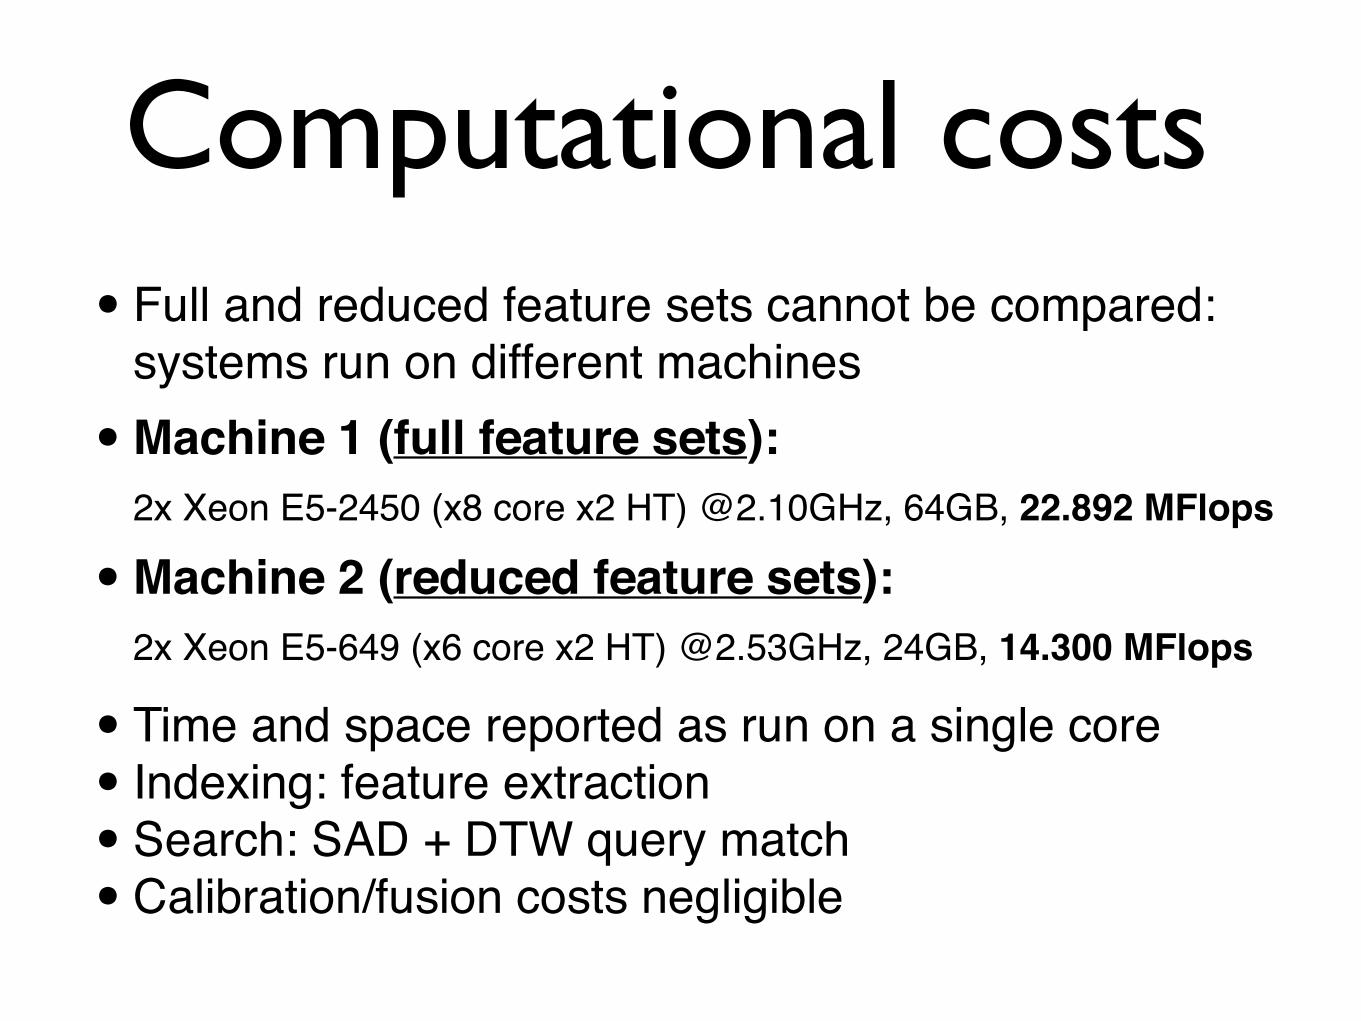
Computational costs • Full and reduced feature sets cannot be compared:
systems run on different machines!
• Machine 1 (full feature sets):!2x Xeon E5-2450 (x8 core x2 HT) @2.10GHz, 64GB, 22.892 MFlops!
• Machine 2 (reduced feature sets):!2x Xeon E5-649 (x6 core x2 HT) @2.53GHz, 24GB, 14.300 MFlops!
• Time and space reported as run on a single core!• Indexing: feature extraction!• Search: SAD + DTW query match!• Calibration/fusion costs negligible
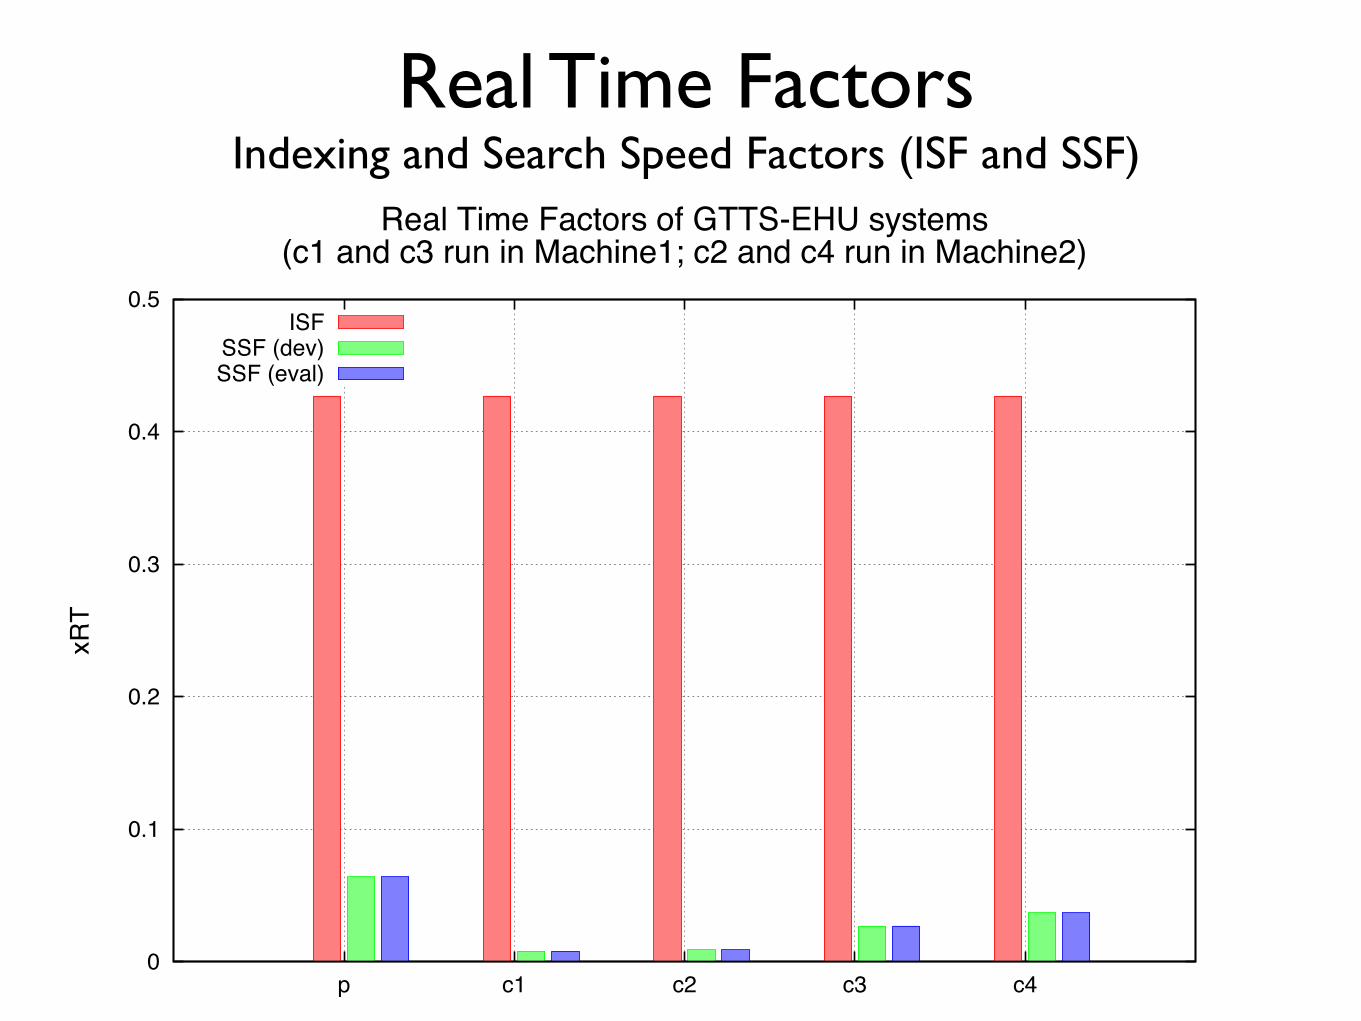
Real Time Factors Indexing and Search Speed Factors (ISF and SSF)
0
0.1
0.2
0.3
0.4
0.5
p c1 c2 c3 c4
xRT
Real Time Factors of GTTS-EHU systems(c1 and c3 run in Machine1; c2 and c4 run in Machine2)
ISFSSF (dev)SSF (eval)
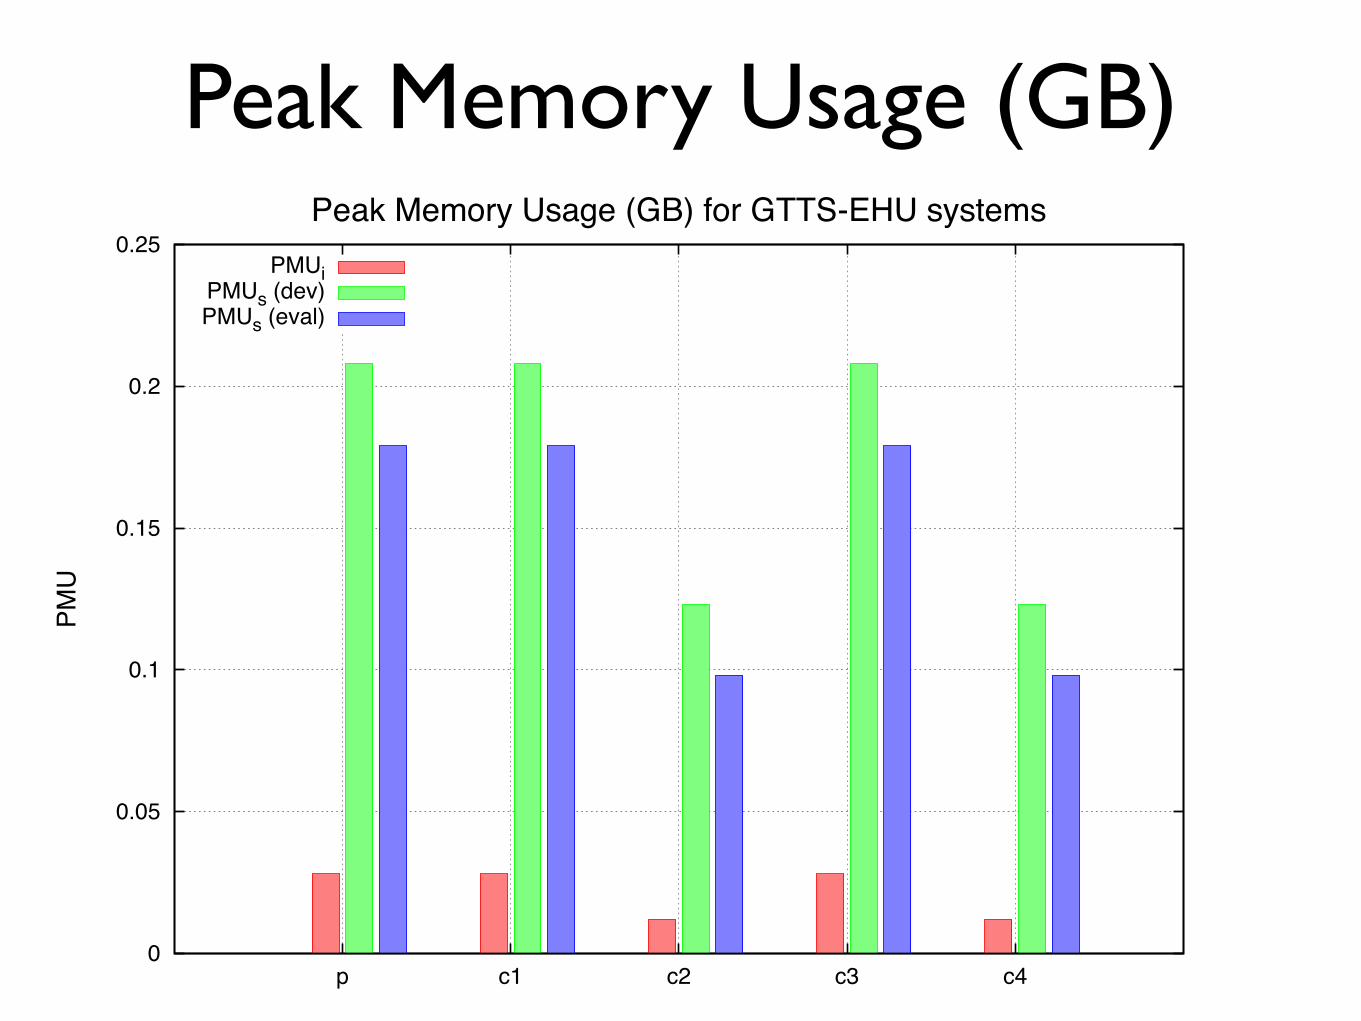
Peak Memory Usage (GB)
0
0.05
0.1
0.15
0.2
0.25
p c1 c2 c3 c4
PMU
Peak Memory Usage (GB) for GTTS-EHU systemsPMUi
PMUs (dev)PMUs (eval)
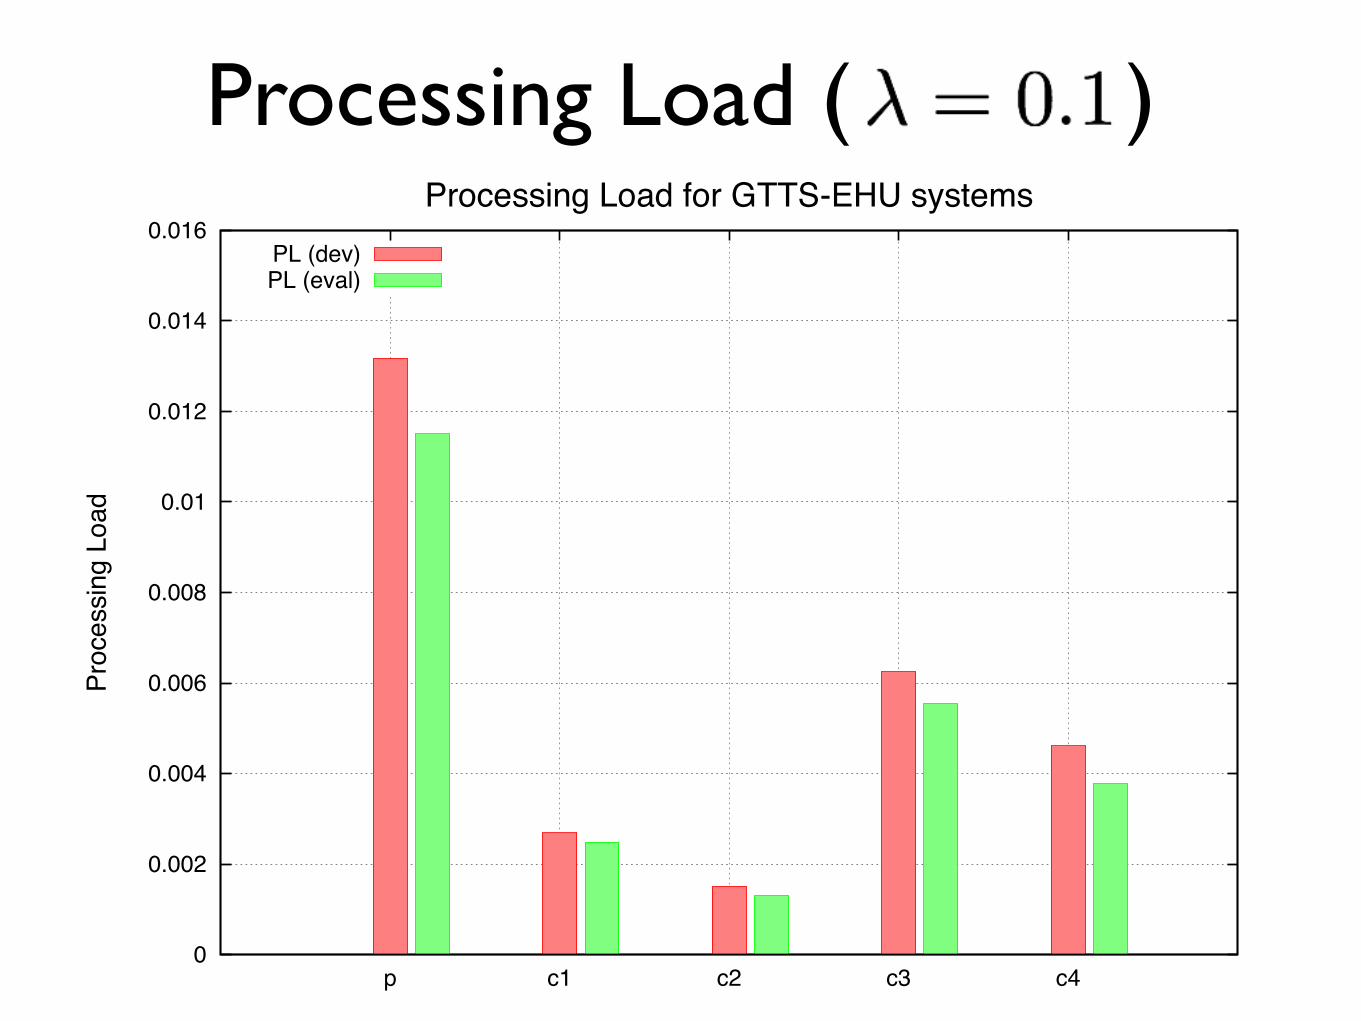
Processing Load ( )
0
0.002
0.004
0.006
0.008
0.01
0.012
0.014
0.016
p c1 c2 c3 c4
Proc
essi
ng L
oad
Processing Load for GTTS-EHU systemsPL (dev)PL (eval)
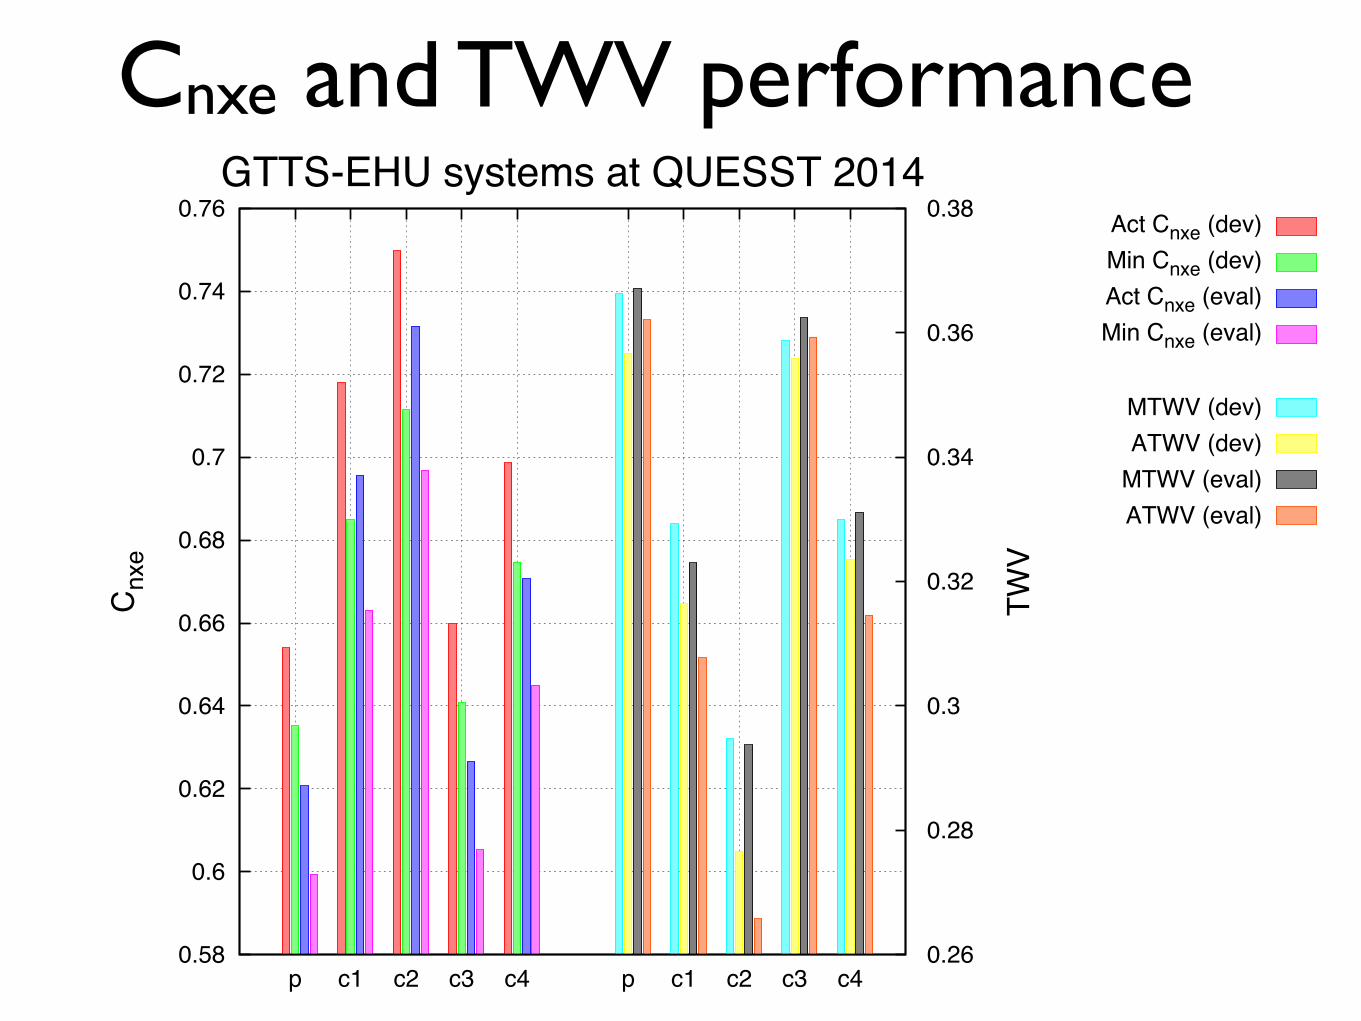
Cnxe and TWV performance
0.58
0.6
0.62
0.64
0.66
0.68
0.7
0.72
0.74
0.76
p c1 c2 c3 c4 p c1 c2 c3 c4 0.26
0.28
0.3
0.32
0.34
0.36
0.38
Cnx
e
TWV
GTTS-EHU systems at QUESST 2014Act Cnxe (dev)Min Cnxe (dev)Act Cnxe (eval)Min Cnxe (eval)
MTWV (dev)ATWV (dev)
MTWV (eval)ATWV (eval)
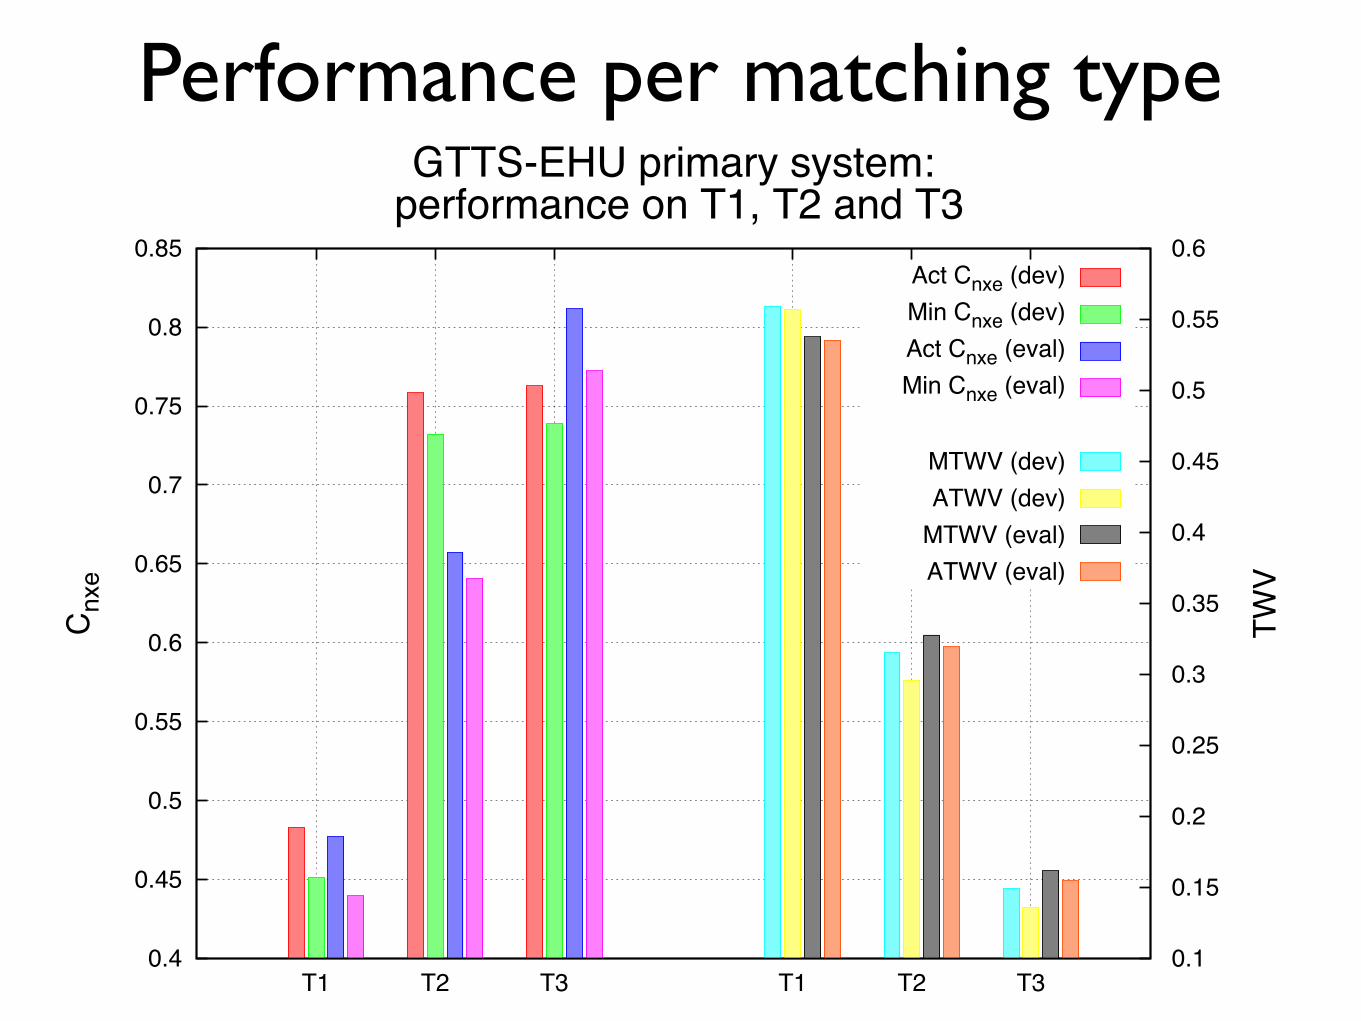
Performance per matching type
0.4
0.45
0.5
0.55
0.6
0.65
0.7
0.75
0.8
0.85
T1 T2 T3 T1 T2 T3 0.1
0.15
0.2
0.25
0.3
0.35
0.4
0.45
0.5
0.55
0.6
Cnx
e
TWV
GTTS-EHU primary system: performance on T1, T2 and T3
Act Cnxe (dev)Min Cnxe (dev)Act Cnxe (eval)Min Cnxe (eval)
MTWV (dev)ATWV (dev)
MTWV (eval)ATWV (eval)
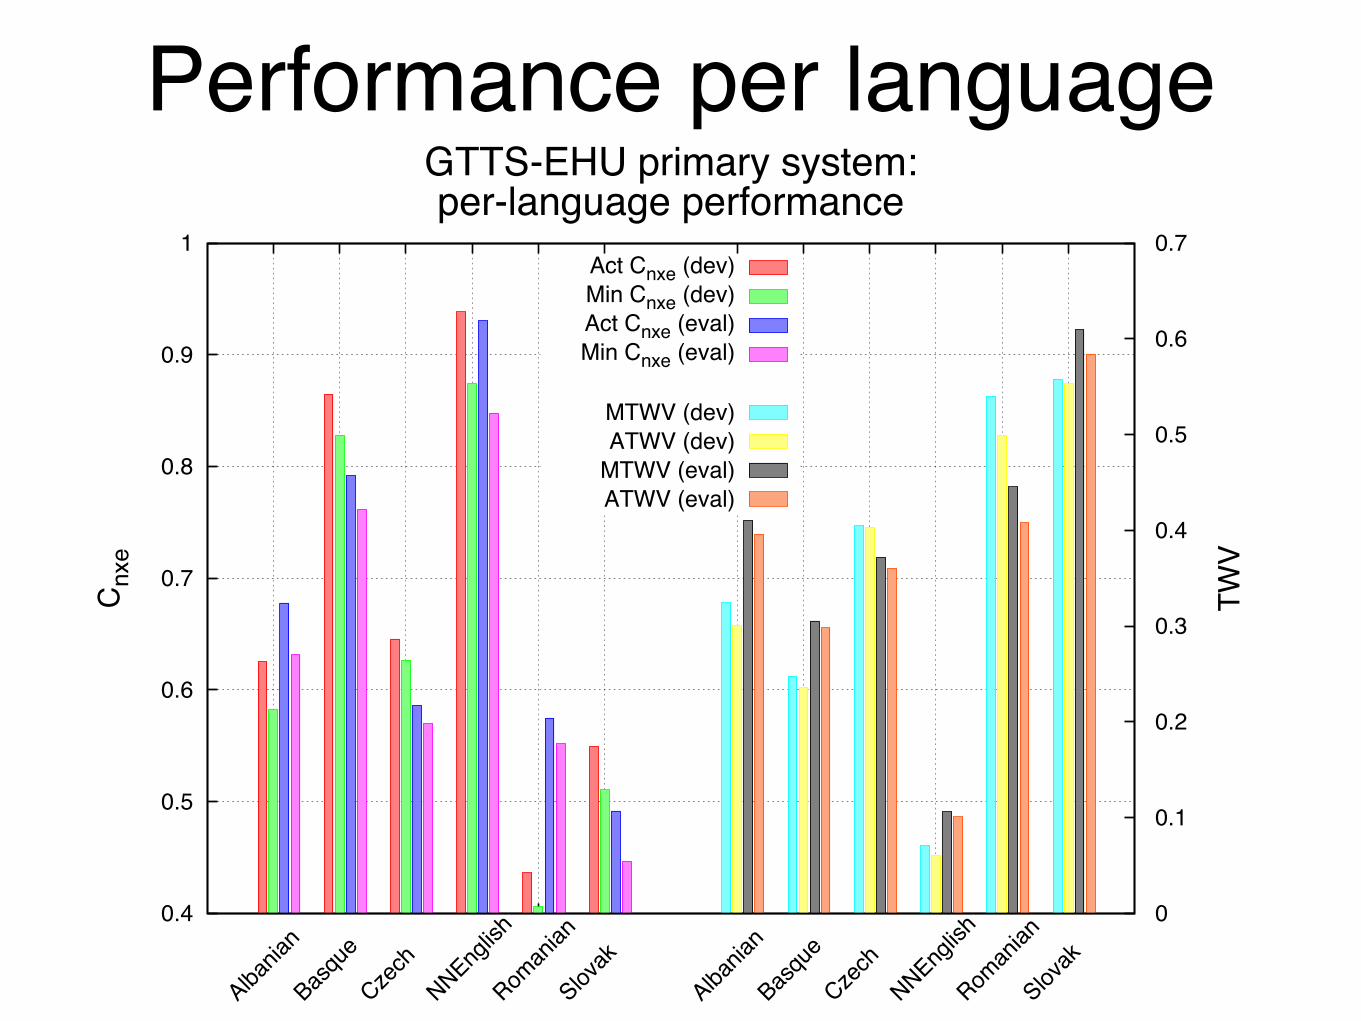
Performance per language
0.4
0.5
0.6
0.7
0.8
0.9
1
Albania
n
Basqu
e
Czech
NNEnglish
Roman
ian
Slovak
Albania
n
Basqu
e
Czech
NNEnglish
Roman
ian
Slovak
0
0.1
0.2
0.3
0.4
0.5
0.6
0.7
Cnx
e
TWV
GTTS-EHU primary system:per-language performance
Act Cnxe (dev)Min Cnxe (dev)Act Cnxe (eval)Min Cnxe (eval)
MTWV (dev)ATWV (dev)
MTWV (eval)ATWV (eval)
GTTS-EHU systems for QUESST
at MediaEval 2014 Luis J. Rodriguez-Fuentes, A. Varona, M. Penagarikano,
G. Bordel, M. Diez University of the Basque Country UPV/EHU
http://gtts.ehu.es [email protected]
Thanks !!!