Embed Size (px)
Citation preview

A Deep Dive into HPCM for Planning and Essbase Professionals
Mike Killeen, Sr. VP of Technology & Strategy
Alecsandra Mlynarzek, Principal Consultant
Edgewater Ranzal
Introduction to Ranzal
� Oracle Platinum Consulting Partner - 100% Focus on Oracle/Hyperion Business Analytics (EPM/BI)
● 195+ Full time EPM/BI Billable Consultants throughout the US, Canada and the United Kingdom
� EPM & BI Experience & Success
● 1,800+ Oracle EPM & BI projects for 850 clients successfully delivered since our founding in 1996● 1,800+ Oracle EPM & BI projects for 850 clients successfully delivered since our founding in 1996
� Depth & Breadth of EPM & BI Service Offerings
● Product Experts across the full EPM/BI Suite - Planning, HFM, HTP, FCM (ARM), HSF, HPCM, Essbase, BI/Endeca, DRM, FDMEE
● Visioning & Roadmaps, Full Life Cycle Implementations, Technical Review & Assessments, Staff
Augmentation
� Ranzal Oracle ACEs Across EPM/BI Platform
� Direct line to Oracle Development, Customer Advisory Boards, Beta Testing, Author Certification Exams
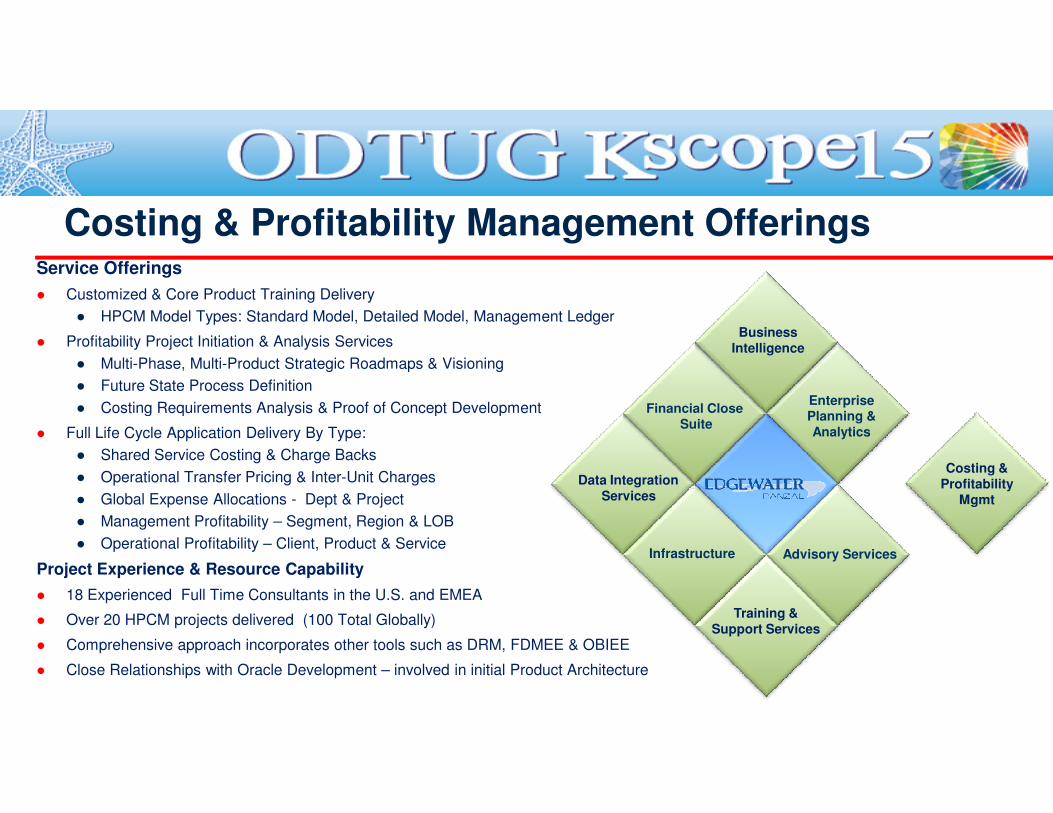
Service Offerings
� Customized & Core Product Training Delivery
● HPCM Model Types: Standard Model, Detailed Model, Management Ledger
� Profitability Project Initiation & Analysis Services
● Multi-Phase, Multi-Product Strategic Roadmaps & Visioning
● Future State Process Definition
● Costing Requirements Analysis & Proof of Concept Development
Costing & Profitability Management Offerings
Financial Close
BusinessIntelligence
Enterprise● Costing Requirements Analysis & Proof of Concept Development
� Full Life Cycle Application Delivery By Type:
● Shared Service Costing & Charge Backs
● Operational Transfer Pricing & Inter-Unit Charges
● Global Expense Allocations - Dept & Project
● Management Profitability – Segment, Region & LOB
● Operational Profitability – Client, Product & Service
Project Experience & Resource Capability
� 18 Experienced Full Time Consultants in the U.S. and EMEA
� Over 20 HPCM projects delivered (100 Total Globally)
� Comprehensive approach incorporates other tools such as DRM, FDMEE & OBIEE
� Close Relationships with Oracle Development – involved in initial Product Architecture
Financial Close Suite
EnterprisePlanning & Analytics
Data IntegrationServices
Training &Support Services
Advisory ServicesInfrastructure
Costing &Profitability
Mgmt
� What is HPCM and what does it do?
� Common points between HPCM and Planning & Essbase
� HPCM Modules
Agenda
● Standard Profitability
● Management Ledger
● Detailed Profitability
� HPCM vs Planning/Essbase
� Q&A
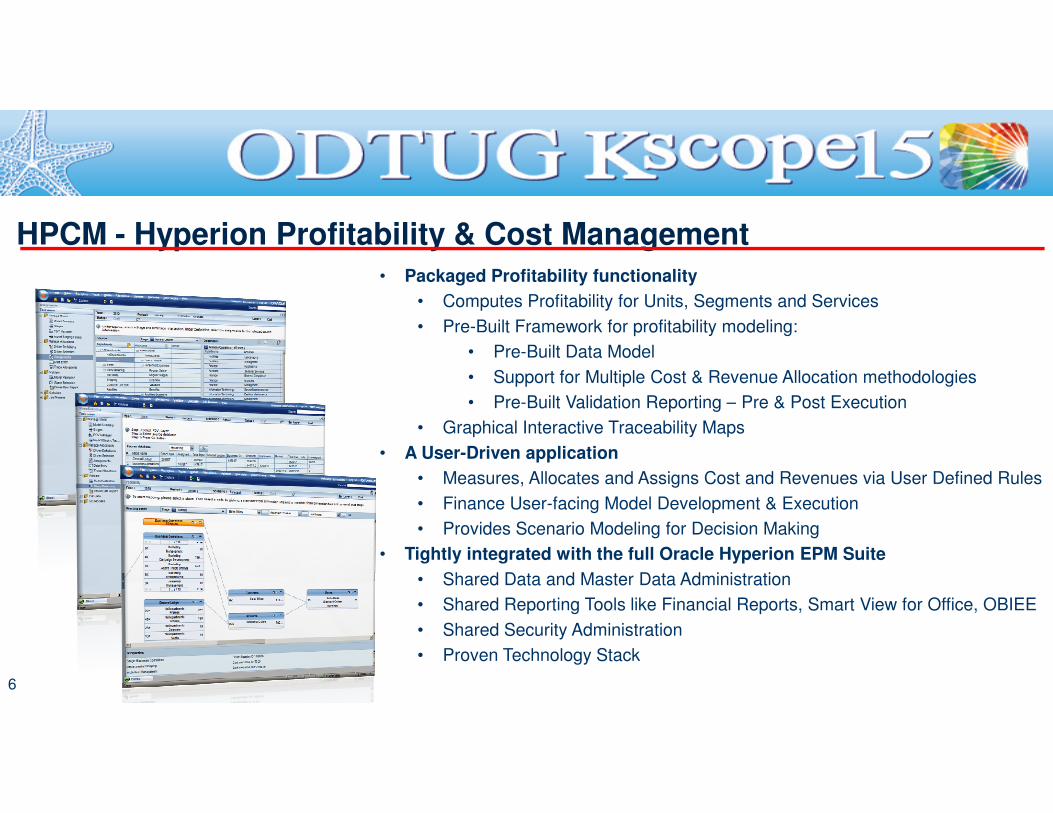
• Packaged Profitability functionality
• Computes Profitability for Units, Segments and Services
• Pre-Built Framework for profitability modeling:
• Pre-Built Data Model
• Support for Multiple Cost & Revenue Allocation methodologies
• Pre-Built Validation Reporting – Pre & Post Execution
HPCM - Hyperion Profitability & Cost Management
6
• Pre-Built Validation Reporting – Pre & Post Execution
• Graphical Interactive Traceability Maps
• A User-Driven application
• Measures, Allocates and Assigns Cost and Revenues via User Defined Rules
• Finance User-facing Model Development & Execution
• Provides Scenario Modeling for Decision Making
• Tightly integrated with the full Oracle Hyperion EPM Suite
• Shared Data and Master Data Administration
• Shared Reporting Tools like Financial Reports, Smart View for Office, OBIEE
• Shared Security Administration
• Proven Technology Stack
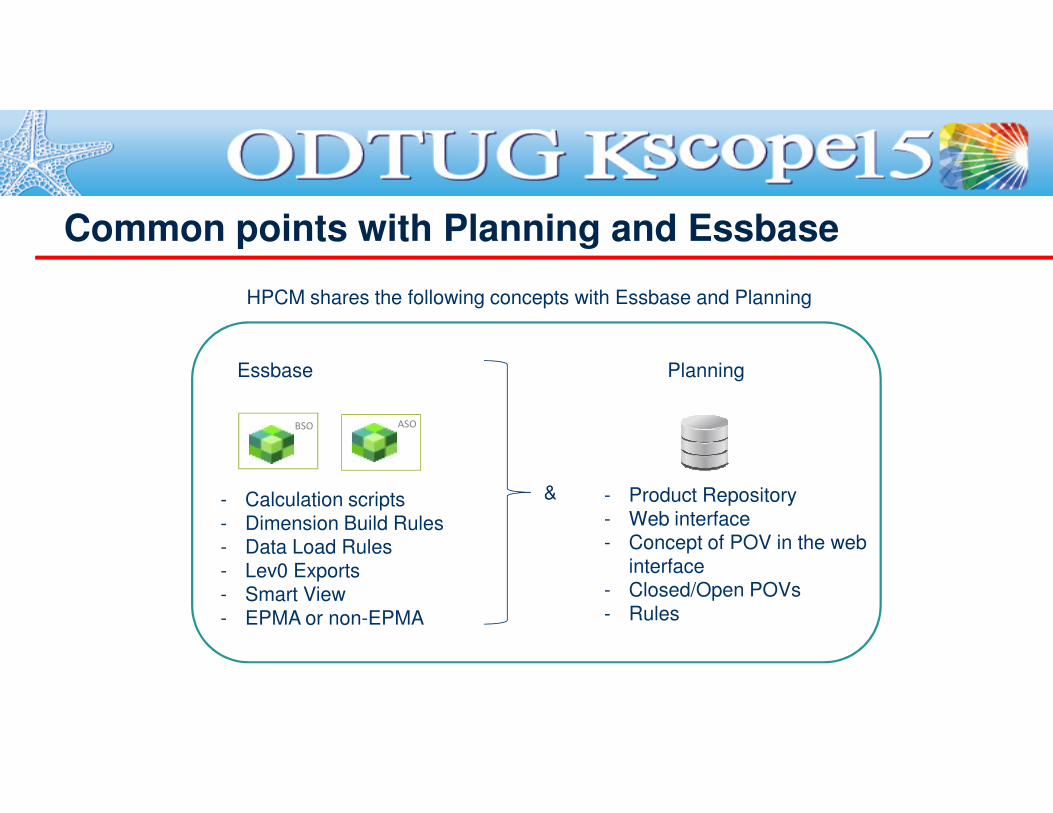
Common points with Planning and Essbase
Essbase Planning
HPCM shares the following concepts with Essbase and Planning
BSO ASO
- Calculation scripts
- Dimension Build Rules- Data Load Rules
- Lev0 Exports- Smart View
- EPMA or non-EPMA
- Product Repository
- Web interface- Concept of POV in the web
interface- Closed/Open POVs
- Rules
&
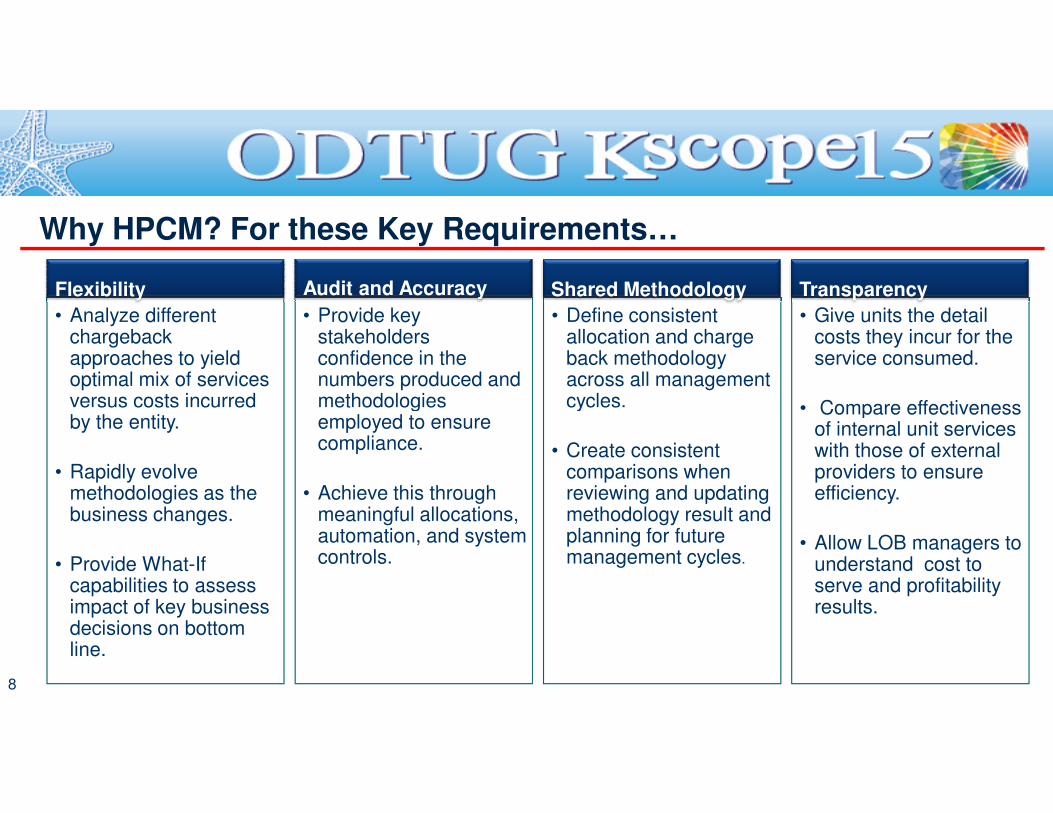
• Analyze different chargeback approaches to yield optimal mix of services versus costs incurred
• Provide key stakeholders confidence in the numbers produced and methodologies
• Define consistent allocation and charge back methodology across all management cycles.
Audit and Accuracy Shared Methodology
• Give units the detail costs they incur for the service consumed.
• Compare effectiveness
TransparencyFlexibility
Why HPCM? For these Key Requirements…
versus costs incurred by the entity.
• Rapidly evolve methodologies as the business changes.
• Provide What-If capabilities to assess impact of key business decisions on bottom line.
methodologies employed to ensure compliance.
• Achieve this through meaningful allocations, automation, and system controls.
cycles.
• Create consistent comparisons when reviewing and updating methodology result and planning for future management cycles.
• Compare effectiveness of internal unit services with those of external providers to ensure efficiency.
• Allow LOB managers to understand cost to serve and profitability results.
8
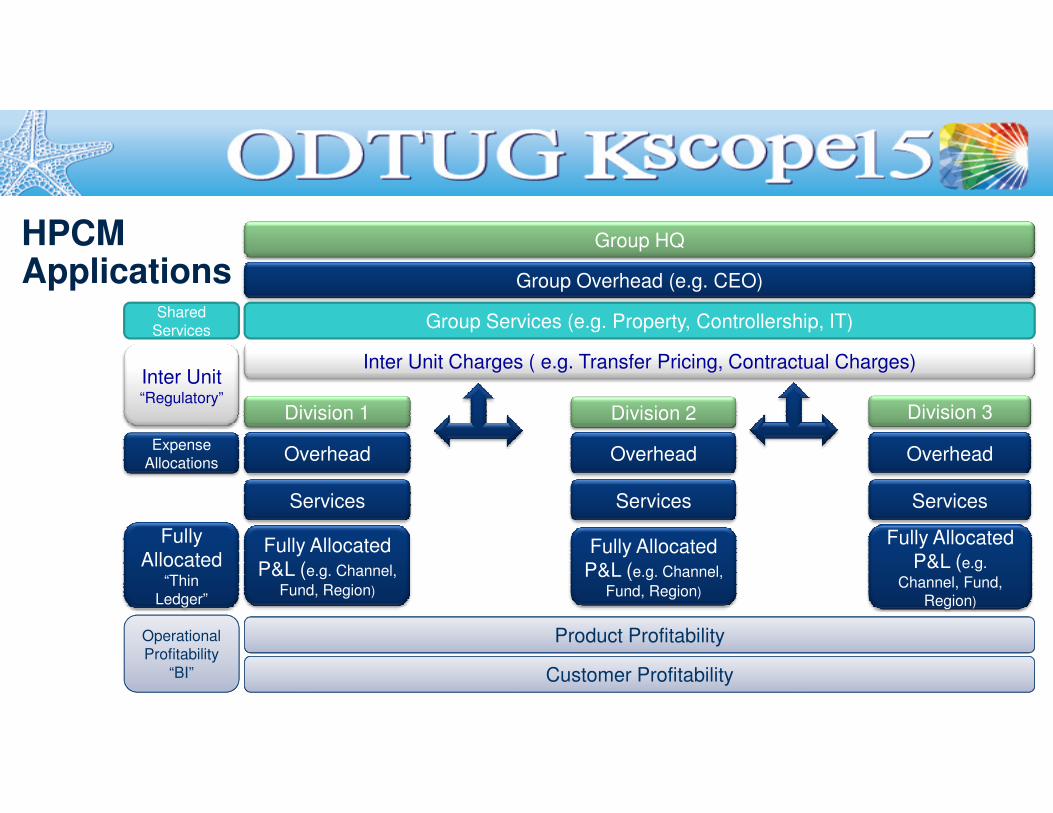
Group HQ
Group Overhead (e.g. CEO)
Group Services (e.g. Property, Controllership, IT)
Inter Unit Charges ( e.g. Transfer Pricing, Contractual Charges)Inter Unit “Regulatory”
Division 1
Shared Services
Division 2 Division 3
HPCMApplications
Division 1
Overhead
Services
Fully Allocated
P&L (e.g. Channel,
Fund, Region)
Expense Allocations
Fully
Allocated “Thin
Ledger”
Product Profitability
Customer Profitability
Operational Profitability
“BI”
Division 2
Overhead
Services
Fully Allocated
P&L (e.g. Channel,
Fund, Region)
Division 3
Overhead
Services
Fully Allocated
P&L (e.g.
Channel, Fund, Region)
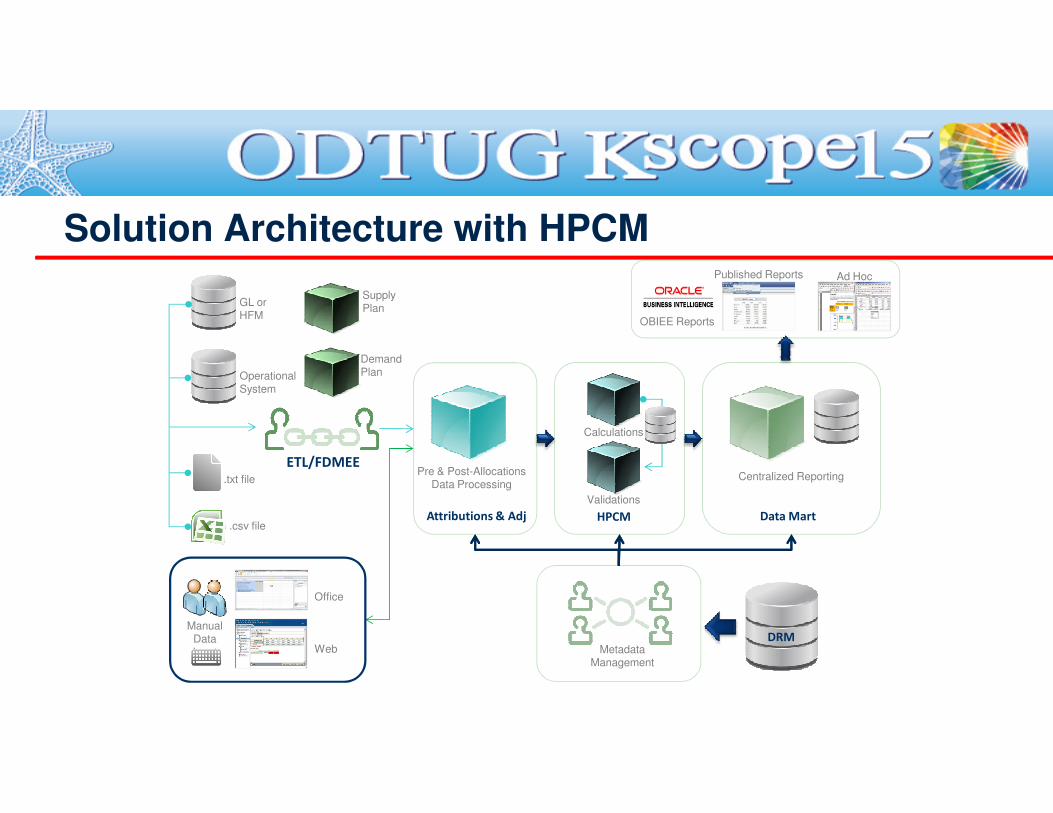
Solution Architecture with HPCMAd Hoc Published Reports
GL or HFM
OperationalSystem
Supply Plan
DemandPlan
OBIEE Reports
HPCM Data Mart
Metadata Management
Web
Office
Manual Data
Input
Pre & Post-Allocations Data Processing
Attributions & Adj
ETL/FDMEE.txt file
.csv file
Calculations
Validations
Centralized Reporting
DRM
� HPCM has currently 3 separate modules:
� Standard Profitability (since Version 11.1.1.1)
� Focuses on contribution analysis, following the flow of cost and revenue data through
multiple stages of the allocation process to determine where data is coming from, and where it is being allocated to.
HPCM Modules
it is being allocated to.
� Detailed Profitability (since Version 11.1.2.2)
� Provides a single-step allocation of pools or rates from a single source to a destination for
the purpose of analyzing profitability. Used for highly granular hierarchies and data sets.
� Management Ledger (since Version 11.1.2.4)
� Designed for use by analysts who have deep domain experience in the computation and reporting methods of management reporting, but who may not have much experience with
Essbase and scripting syntax or programming languages.
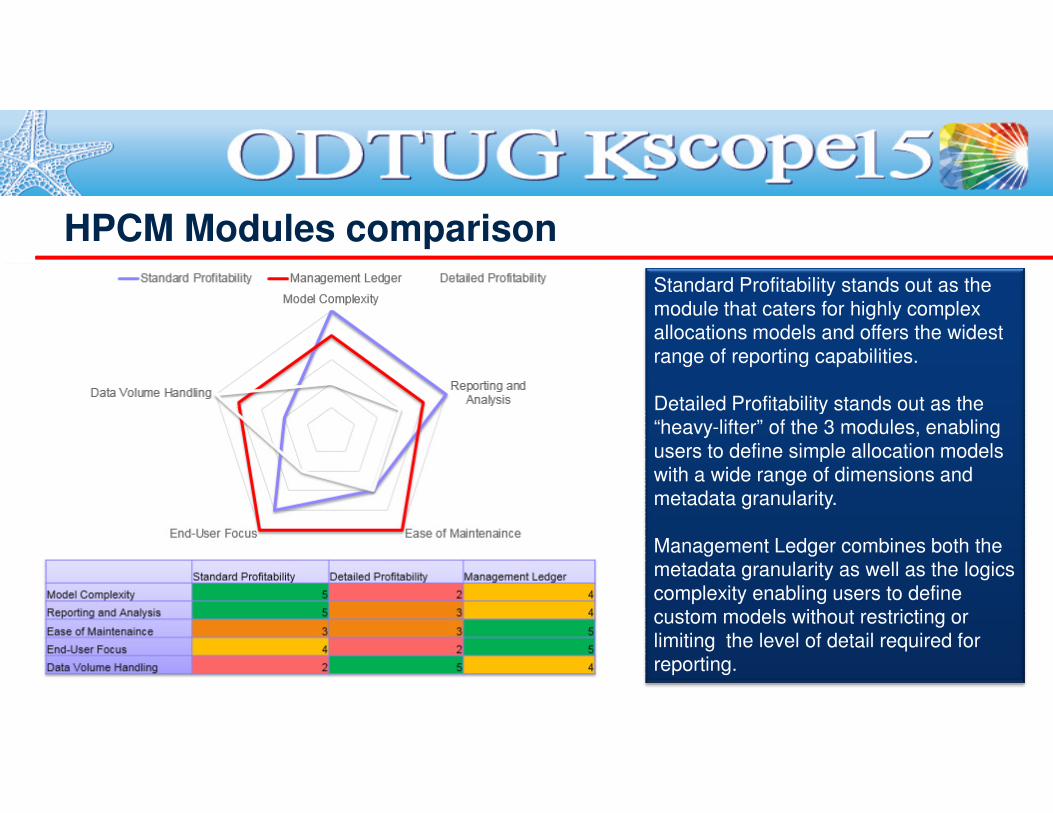
HPCM Modules comparison
Standard Profitability stands out as the
module that caters for highly complex allocations models and offers the widest
range of reporting capabilities.
Detailed Profitability stands out as the Detailed Profitability stands out as the “heavy-lifter” of the 3 modules, enabling
users to define simple allocation models with a wide range of dimensions and
metadata granularity.
Management Ledger combines both the metadata granularity as well as the logics
complexity enabling users to define custom models without restricting or
limiting the level of detail required for reporting.
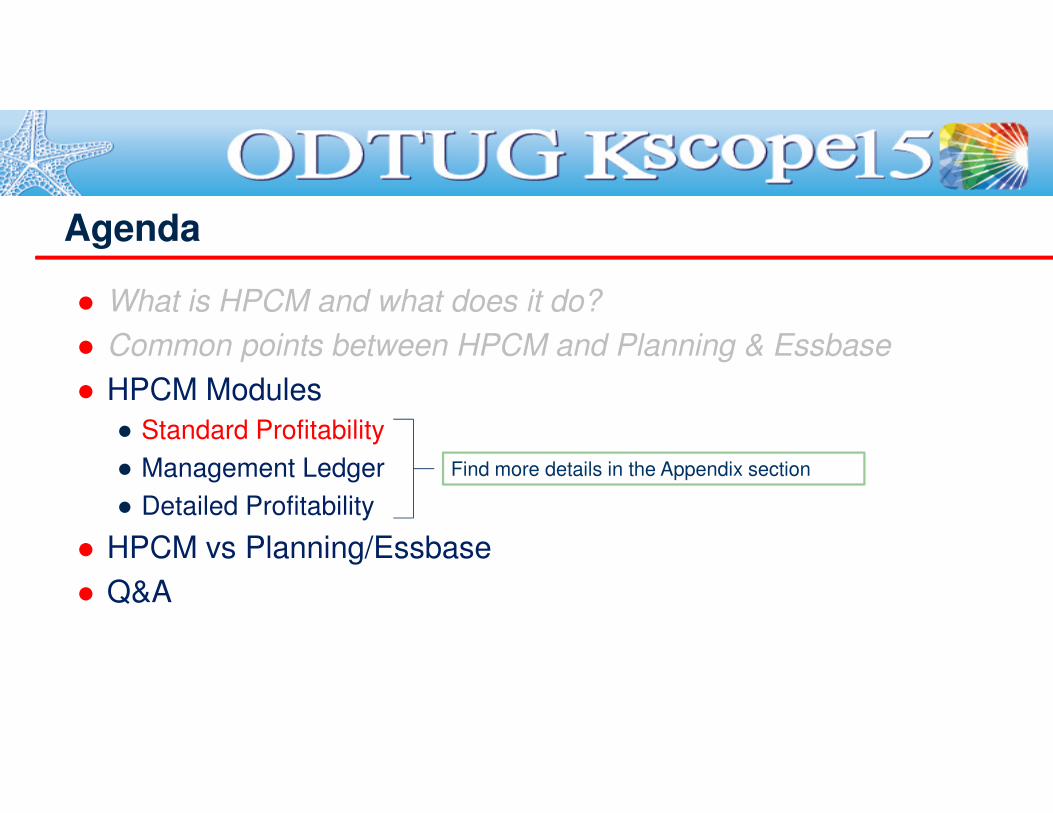
� What is HPCM and what does it do?
� Common points between HPCM and Planning & Essbase
� HPCM Modules
Agenda
● Standard Profitability
● Management Ledger
● Detailed Profitability
� HPCM vs Planning/Essbase
� Q&A
Find more details in the Appendix section
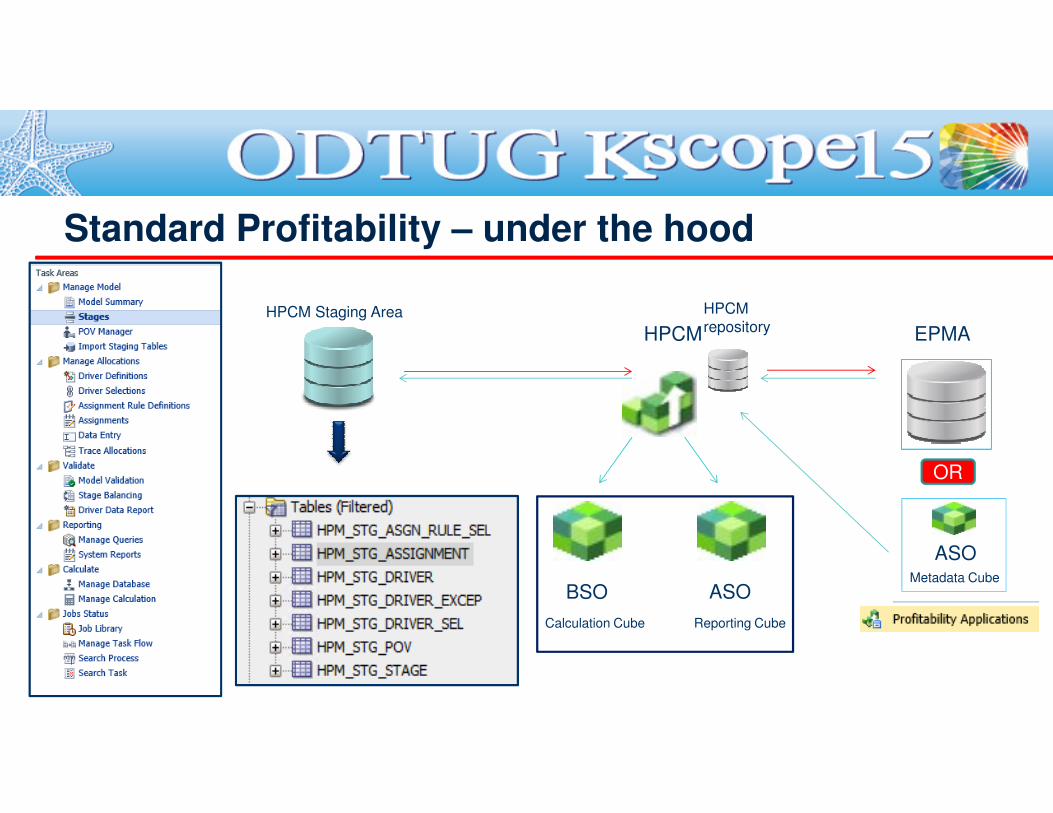
Standard Profitability – under the hood
EPMAHPCM
HPCM repository
HPCM Staging Area
BSO ASO
OR
Calculation Cube Reporting Cube
ASOMetadata Cube
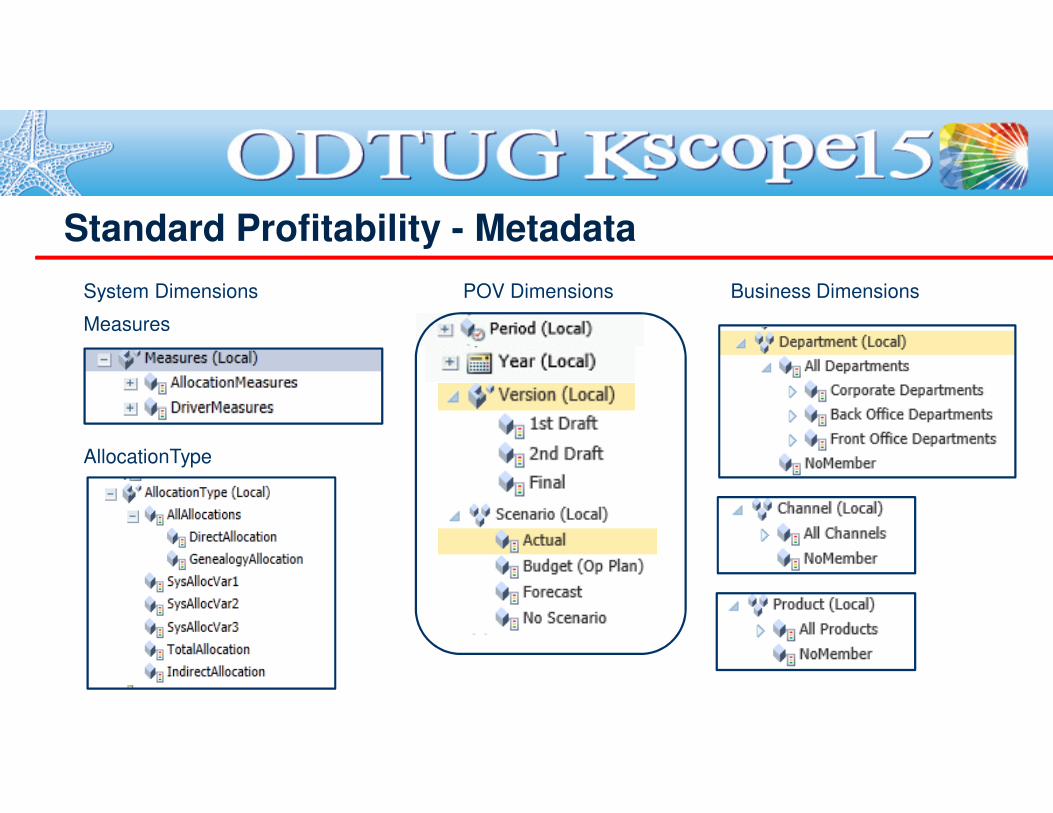
Standard Profitability - Metadata
POV DimensionsSystem Dimensions
Measures
Business Dimensions
AllocationType
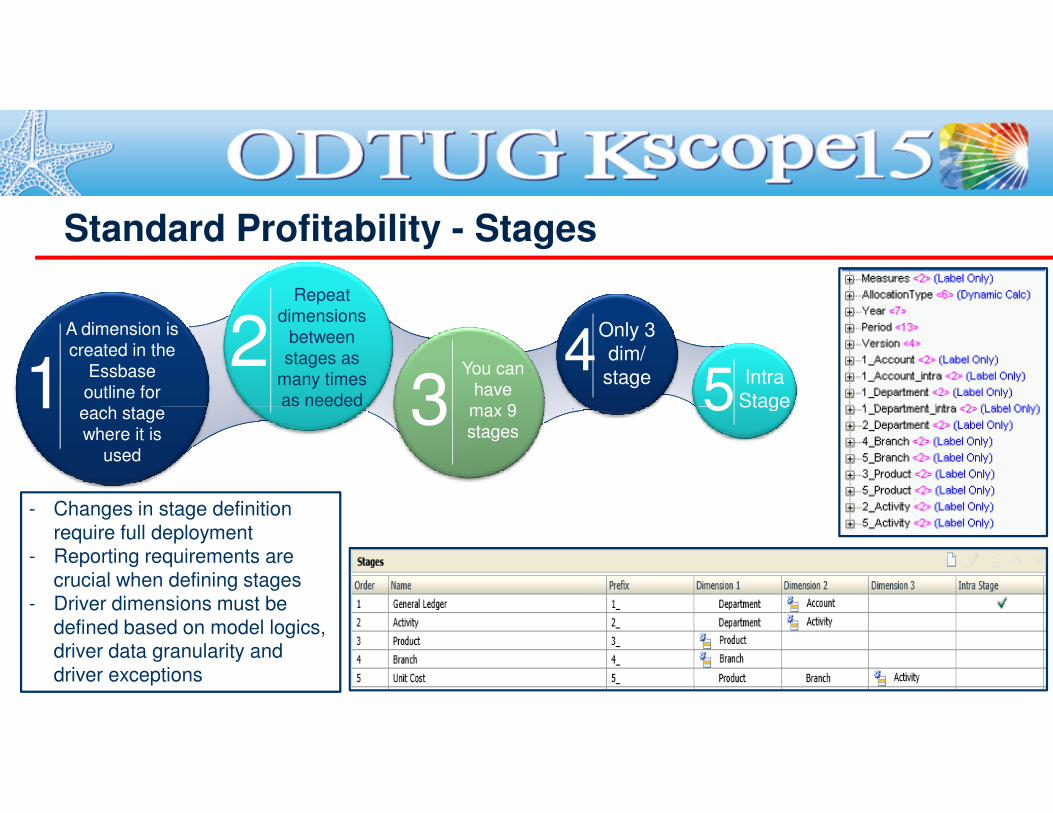
Standard Profitability - Stages
12
3 .
45
A dimension is
created in the
Essbase
outline for
each stage
Repeat
dimensions
between
stages as
many times
as needed
You can
have
max 9
Only 3
dim/stage Intra
Stage
- Changes in stage definition
require full deployment- Reporting requirements are
crucial when defining stages- Driver dimensions must be
defined based on model logics, driver data granularity and
driver exceptions
1 3 . 5each stage
where it is
used
as neededmax 9
stages
Stage
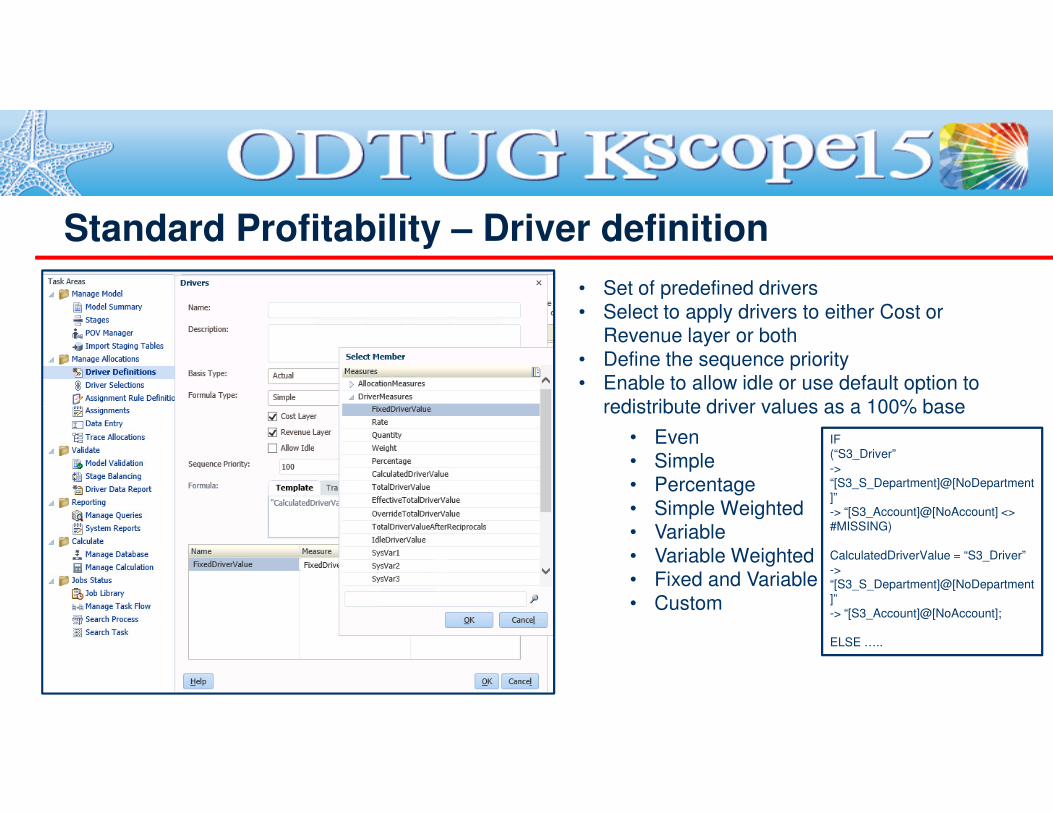
Standard Profitability – Driver definition
• Set of predefined drivers
• Select to apply drivers to either Cost or Revenue layer or both
• Define the sequence priority• Enable to allow idle or use default option to
redistribute driver values as a 100% baseredistribute driver values as a 100% base
• Even
• Simple• Percentage
• Simple Weighted• Variable
• Variable Weighted• Fixed and Variable
• Custom
IF (“S3_Driver”->“[S3_S_Department]@[NoDepartment]”-> “[S3_Account]@[NoAccount] <> #MISSING)
CalculatedDriverValue = “S3_Driver”->“[S3_S_Department]@[NoDepartment]”-> “[S3_Account]@[NoAccount];
ELSE …..
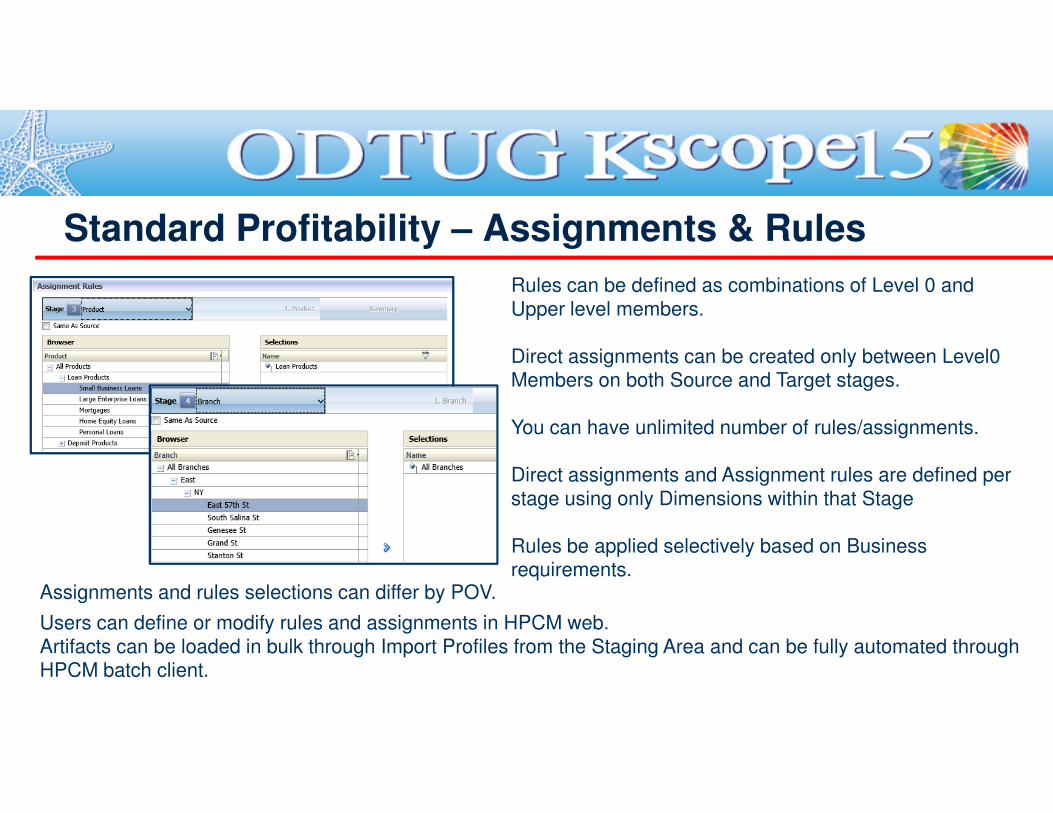
Standard Profitability – Assignments & Rules
Rules can be defined as combinations of Level 0 and
Upper level members.
Direct assignments can be created only between Level0 Members on both Source and Target stages.
You can have unlimited number of rules/assignments.
Direct assignments and Assignment rules are defined per
stage using only Dimensions within that Stage
Rules be applied selectively based on Business requirements.
Assignments and rules selections can differ by POV.
Users can define or modify rules and assignments in HPCM web.
Artifacts can be loaded in bulk through Import Profiles from the Staging Area and can be fully automated through HPCM batch client.
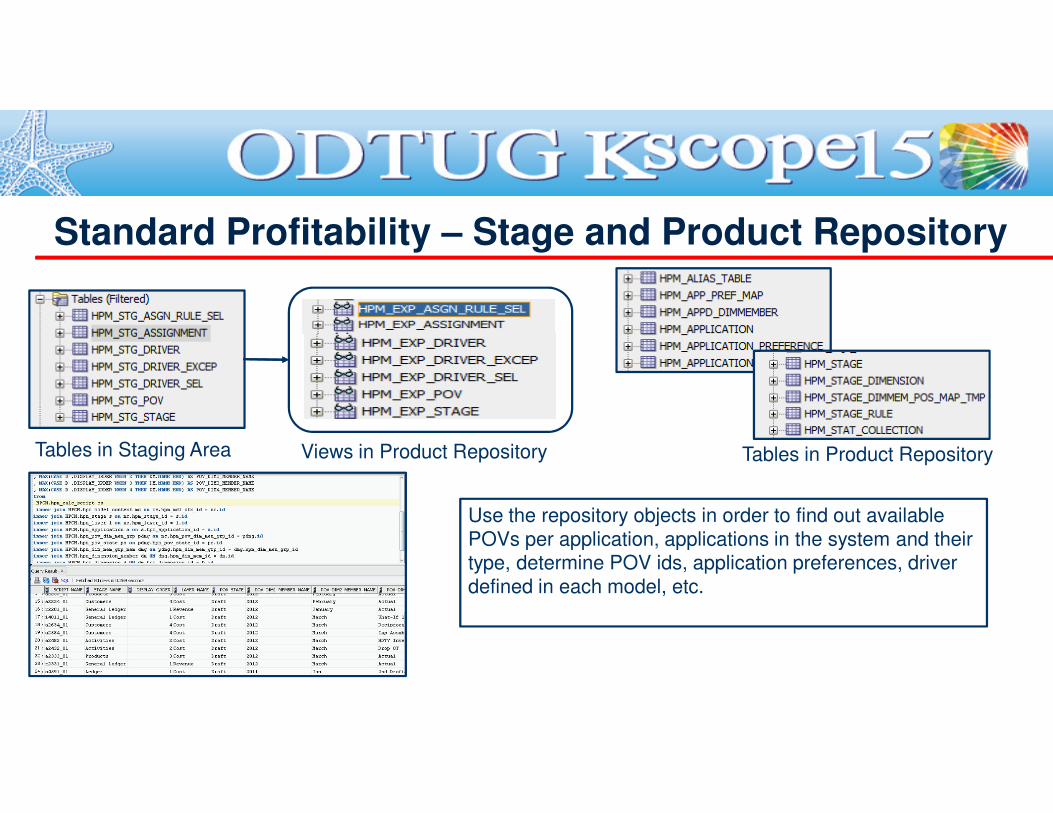
Standard Profitability – Stage and Product Repository
Views in Product RepositoryTables in Staging Area Tables in Product Repository
Use the repository objects in order to find out available
POVs per application, applications in the system and their type, determine POV ids, application preferences, driver
defined in each model, etc.
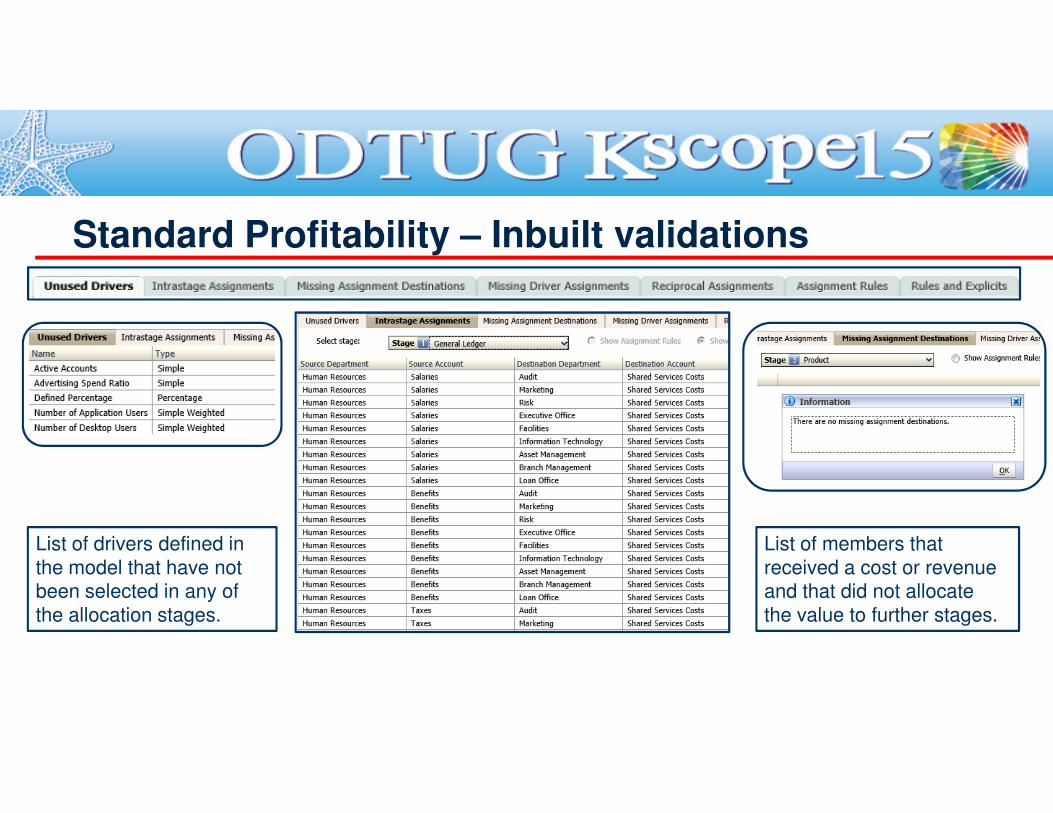
Standard Profitability – Inbuilt validations
List of drivers defined in
the model that have not been selected in any of
the allocation stages.
List of members that
received a cost or revenue and that did not allocate
the value to further stages.
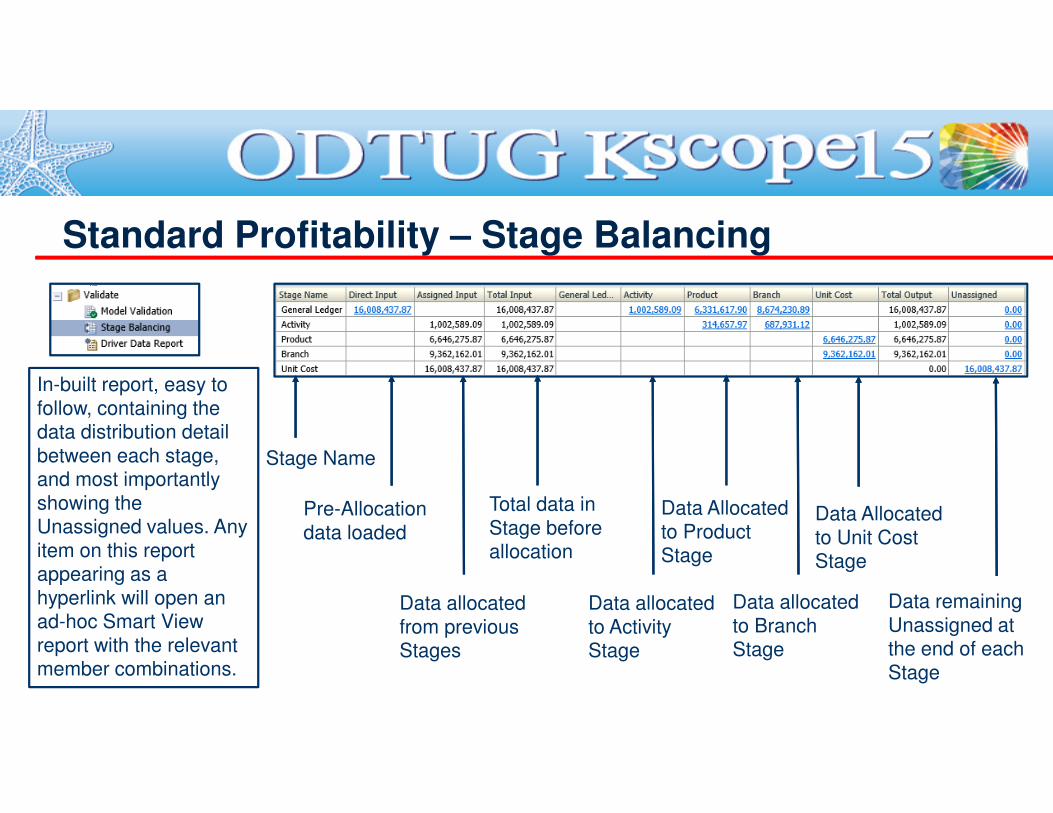
Standard Profitability – Stage Balancing
In-built report, easy to
follow, containing the
Stage Name
Pre-Allocation
data loaded
Data allocated
from previous Stages
Total data in
Stage before allocation
Data allocated
to ActivityStage
Data Allocated
to Unit Cost Stage
Data allocated
to Branch Stage
Data Allocated
to Product Stage
Data remaining
Unassigned at the end of each
Stage
follow, containing the data distribution detail
between each stage, and most importantly
showing the Unassigned values. Any
item on this report appearing as a
hyperlink will open an ad-hoc Smart View
report with the relevant member combinations.
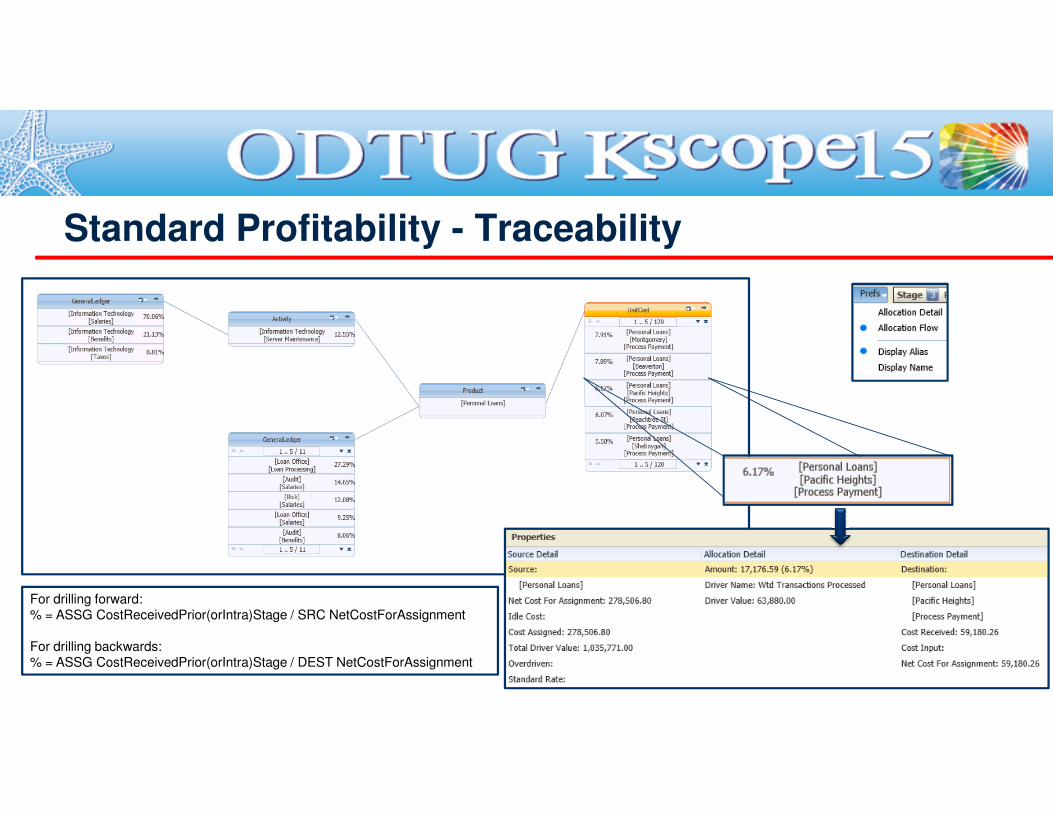
Standard Profitability - Traceability
For drilling forward:% = ASSG CostReceivedPrior(orIntra)Stage / SRC NetCostForAssignment
For drilling backwards:% = ASSG CostReceivedPrior(orIntra)Stage / DEST NetCostForAssignment
� What is HPCM and what does it do?
� Common points between HPCM and Planning & Essbase
� HPCM Modules
Agenda
● Standard Profitability
● Management Ledger
● Detailed Profitability
� HPCM vs Planning/Essbase
� Q&A
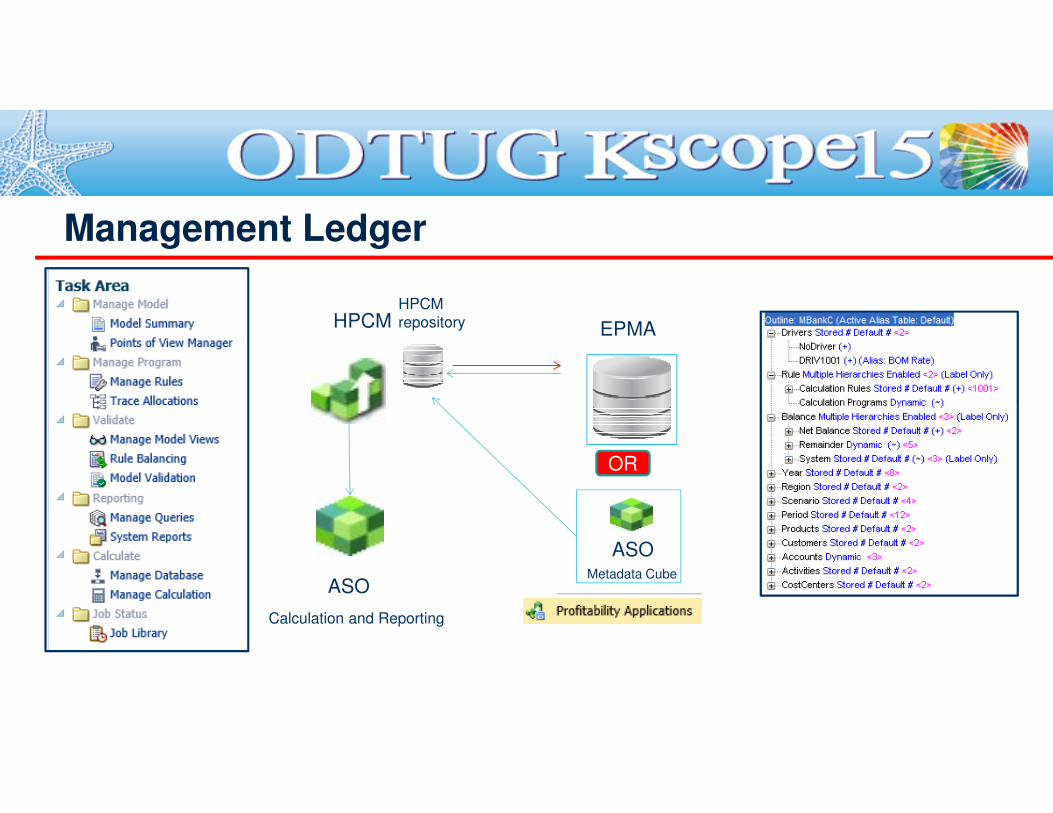
Management Ledger
EPMAHPCMHPCM repository
ASO
OR
ASOMetadata Cube
Calculation and Reporting
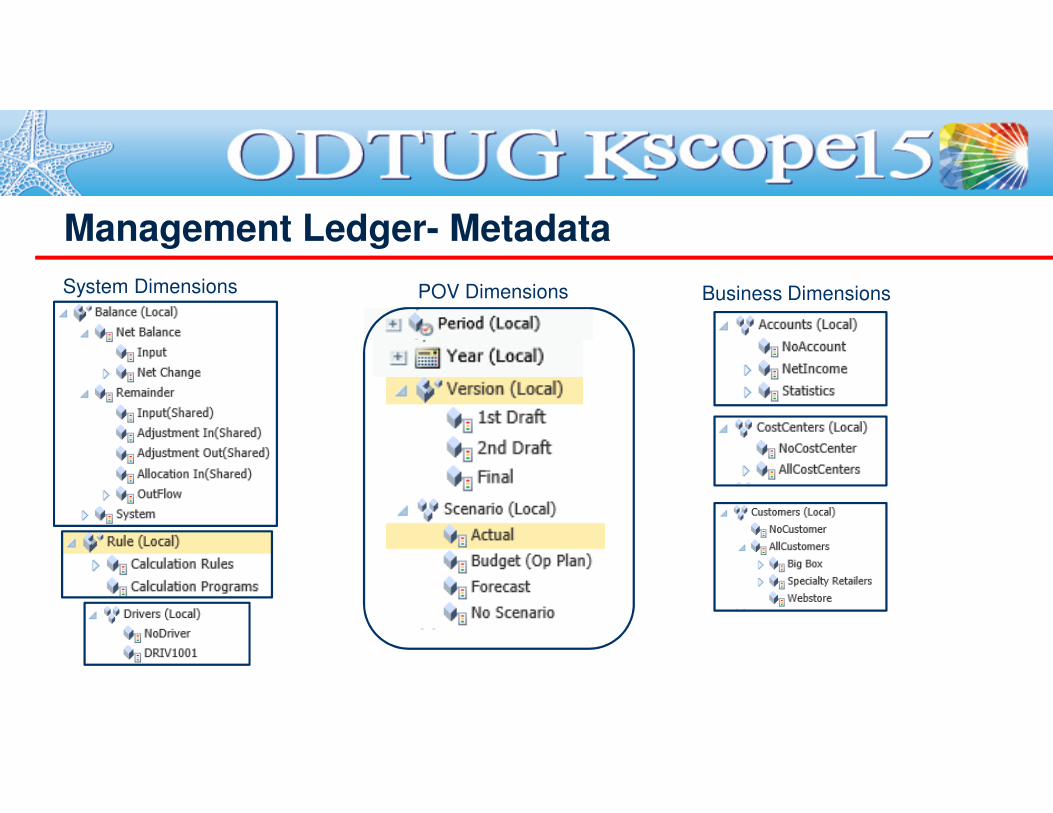
Management Ledger- Metadata
System Dimensions POV Dimensions Business Dimensions
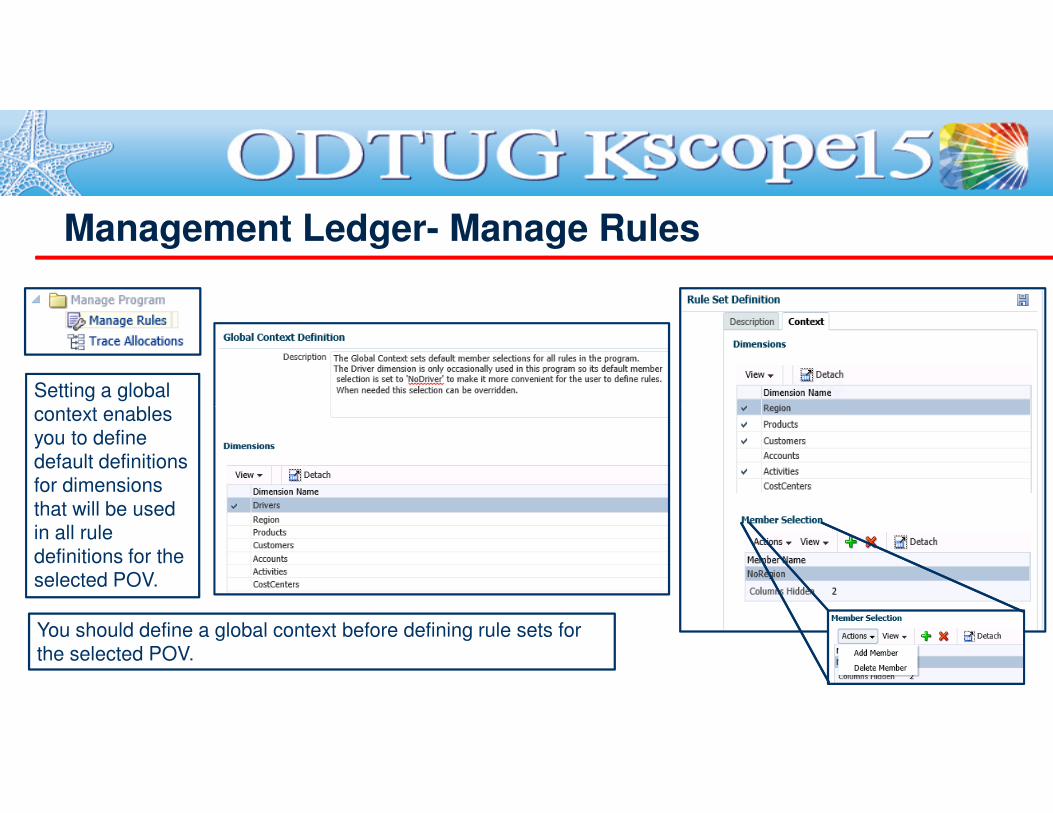
Management Ledger- Manage Rules
Setting a global
context enables context enables you to define
default definitions for dimensions
that will be usedin all rule
definitions for the selected POV.
You should define a global context before defining rule sets for
the selected POV.
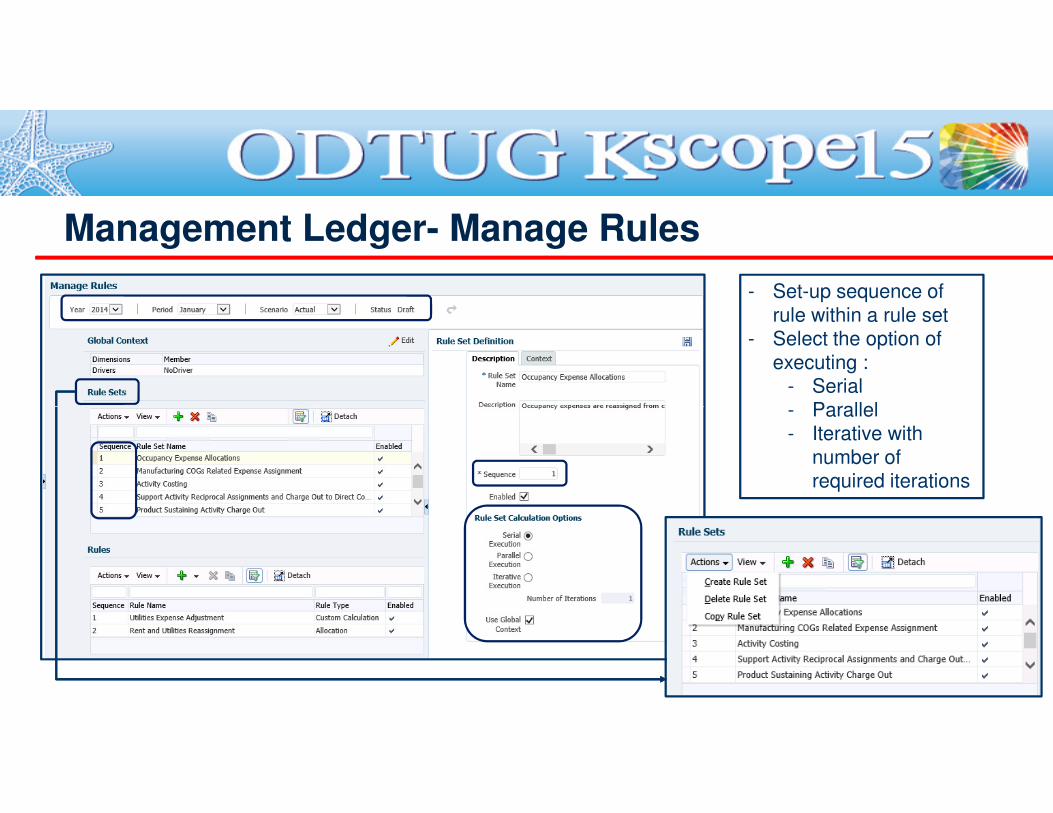
Management Ledger- Manage Rules
- Set-up sequence of
rule within a rule set- Select the option of
executing : - Serial
- Parallel- Parallel- Iterative with
number of required iterations
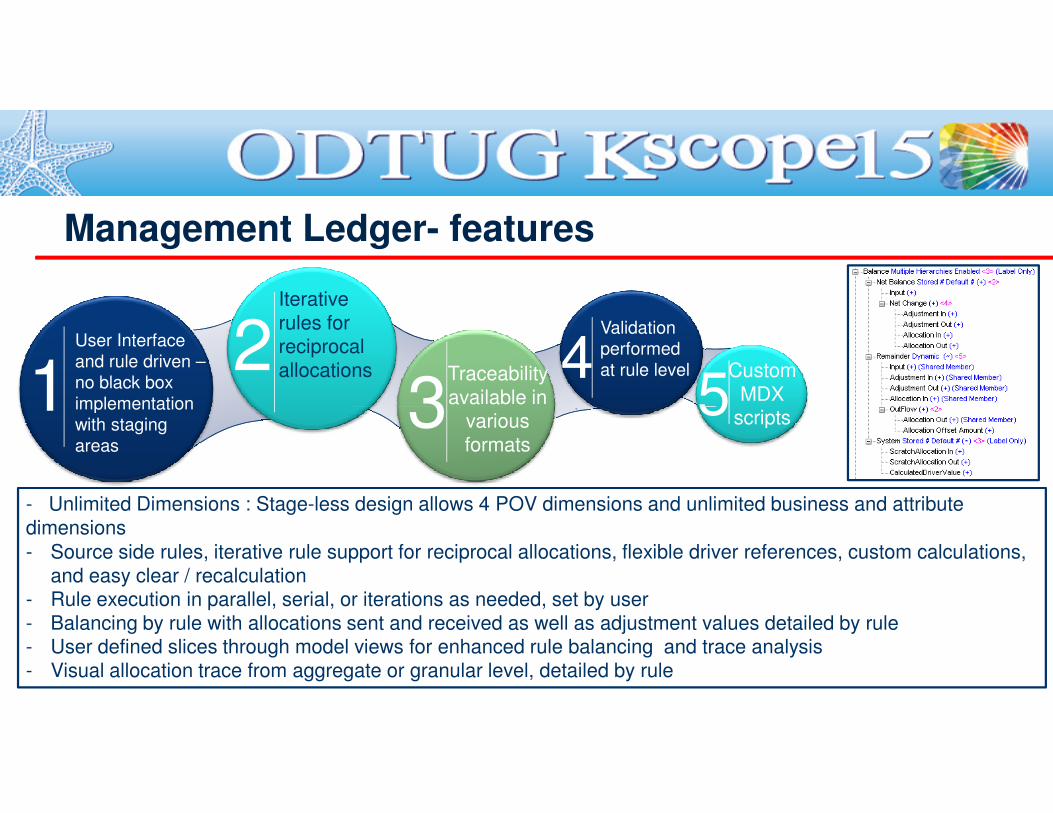
Management Ledger- features
12
3 .
45
User Interface
and rule driven –
no black box
implementation
Validation
performed
at rule level Custom
MDX scripts
Traceability
available in
Iterative
rules for reciprocal
allocations1 3 . 5implementation
with staging
areas
scriptsavailable in
various
formats
- Unlimited Dimensions : Stage-less design allows 4 POV dimensions and unlimited business and attribute
dimensions
- Source side rules, iterative rule support for reciprocal allocations, flexible driver references, custom calculations,
and easy clear / recalculation - Rule execution in parallel, serial, or iterations as needed, set by user
- Balancing by rule with allocations sent and received as well as adjustment values detailed by rule- User defined slices through model views for enhanced rule balancing and trace analysis
- Visual allocation trace from aggregate or granular level, detailed by rule
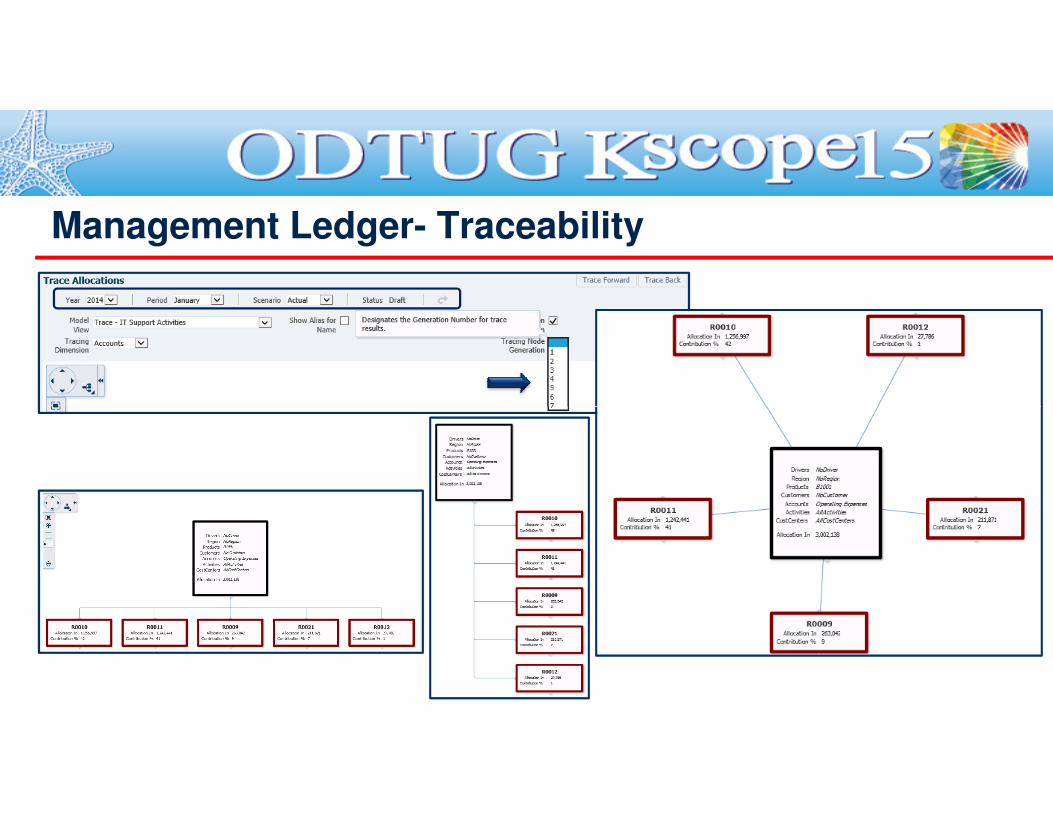
Management Ledger- Traceability
� What is HPCM and what does it do?
� Common points between HPCM and Planning & Essbase
� HPCM Modules
Agenda
● Standard Profitability
● Management Ledger
● Detailed Profitability
� HPCM vs Planning/Essbase
� Q&A
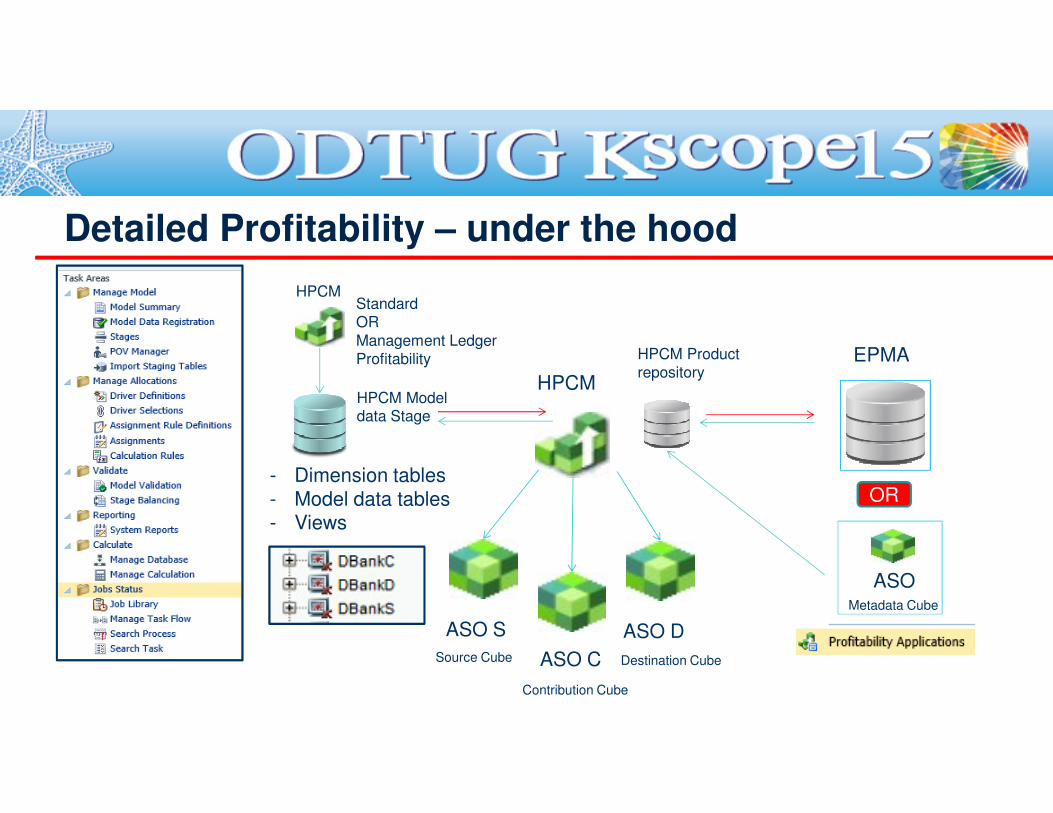
Detailed Profitability – under the hood
EPMA
HPCM
HPCM Product repository
HPCM Model
HPCMStandard OR
Management Ledger Profitability
data Stage
ASO D
Destination CubeASO C
ASO S
Contribution Cube
Source Cube
- Dimension tables
- Model data tables- Views
OR
ASOMetadata Cube

Detailed Profitability - Metadata
System Dimension POV Dimensions Business Dimensions
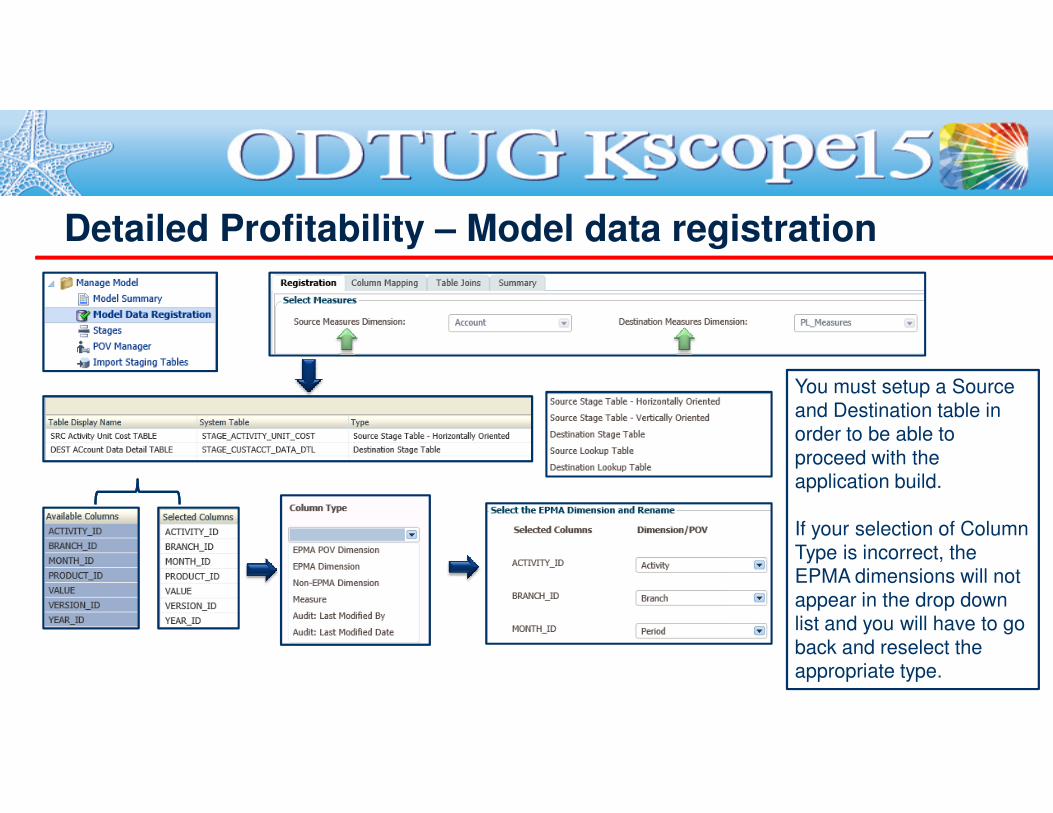
Detailed Profitability – Model data registration
You must setup a Source
and Destination table in and Destination table in order to be able to
proceed with the application build.
If your selection of Column
Type is incorrect, the EPMA dimensions will not
appear in the drop down list and you will have to go
back and reselect the appropriate type.
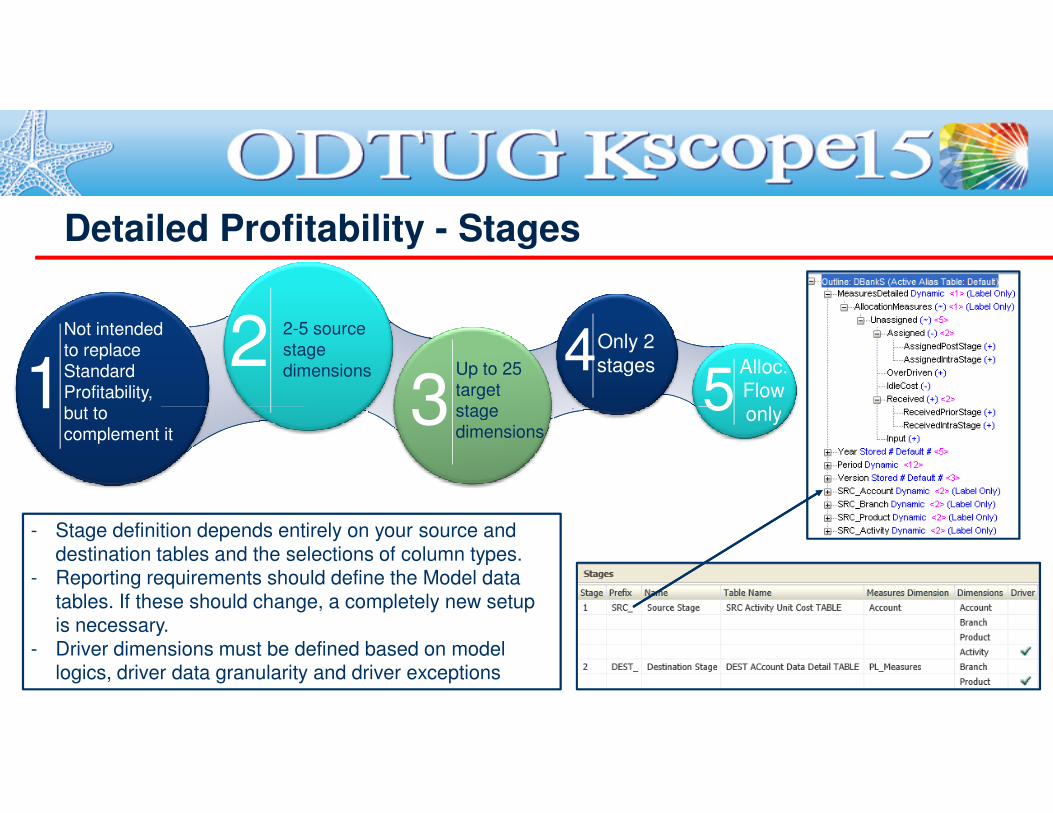
Detailed Profitability - Stages
12
3 .
45
Not intended
to replace
Standard
Profitability,
but to
2-5 source
stage
dimensions Up to 25
target
stage
Only 2
stages Alloc.
Flow only
1 3 . 5but to
complement it
stage
dimensionsonly
- Stage definition depends entirely on your source and
destination tables and the selections of column types.- Reporting requirements should define the Model data
tables. If these should change, a completely new setup is necessary.
- Driver dimensions must be defined based on model logics, driver data granularity and driver exceptions
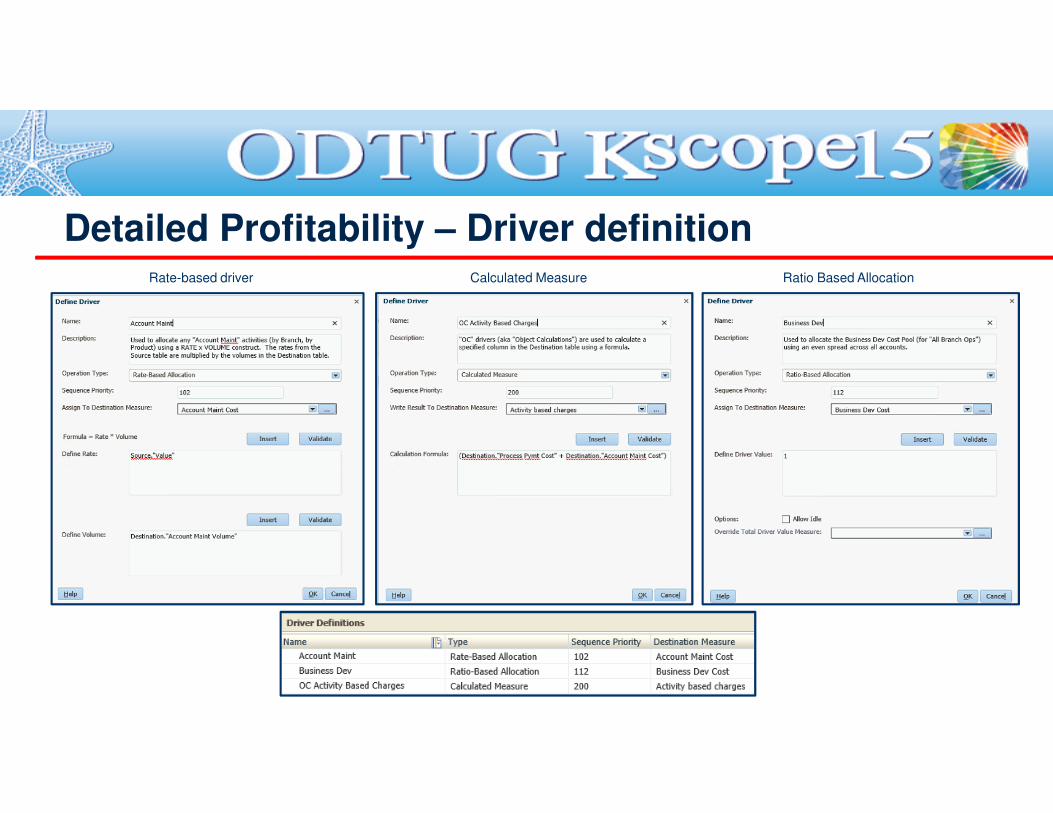
Detailed Profitability – Driver definitionRate-based driver Calculated Measure Ratio Based Allocation
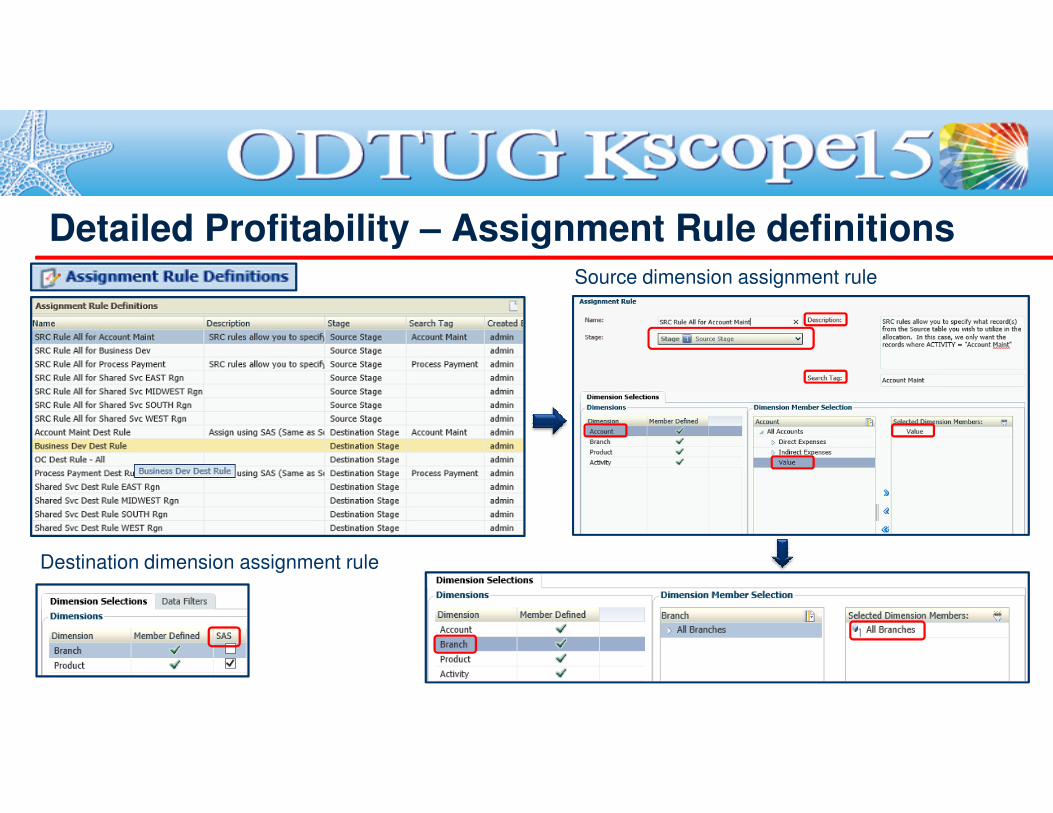
Detailed Profitability – Assignment Rule definitionsSource dimension assignment rule
Destination dimension assignment rule
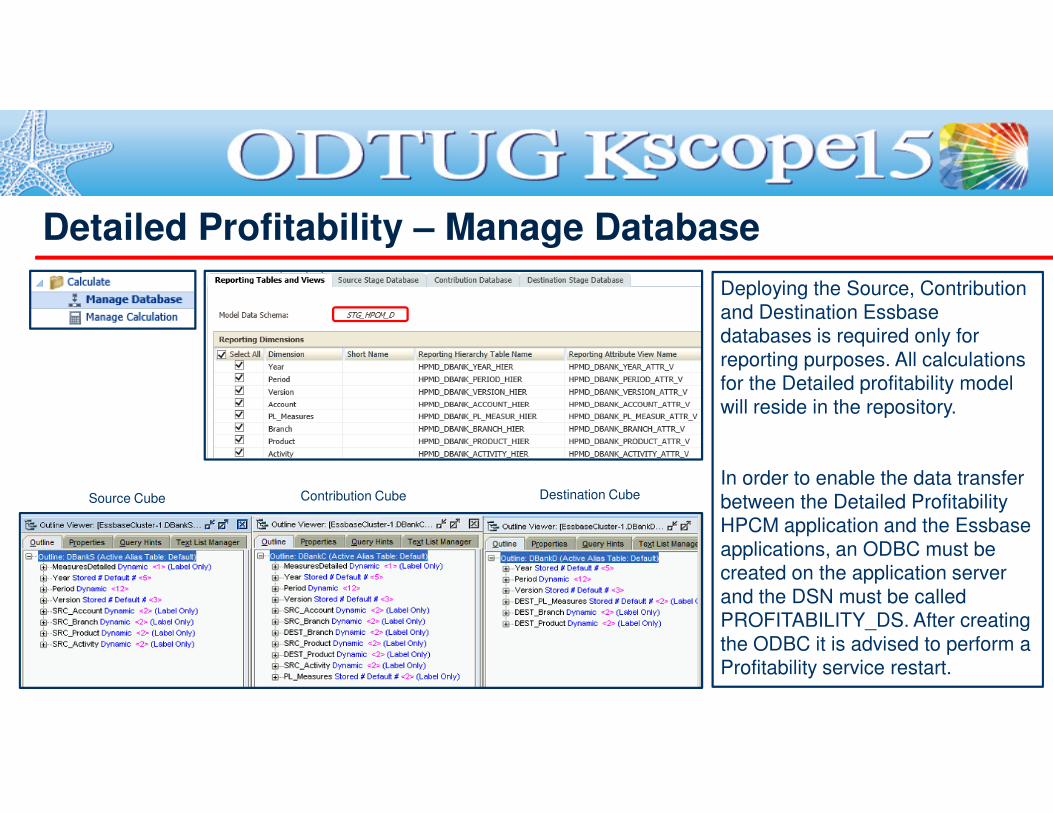
Detailed Profitability – Manage Database
Deploying the Source, Contribution
and Destination Essbase databases is required only for
reporting purposes. All calculations for the Detailed profitability model
will reside in the repository.
Source Cube Contribution Cube Destination Cube
will reside in the repository.
In order to enable the data transfer
between the Detailed Profitability HPCM application and the Essbase
applications, an ODBC must be created on the application server
and the DSN must be called PROFITABILITY_DS. After creating
the ODBC it is advised to perform a Profitability service restart.
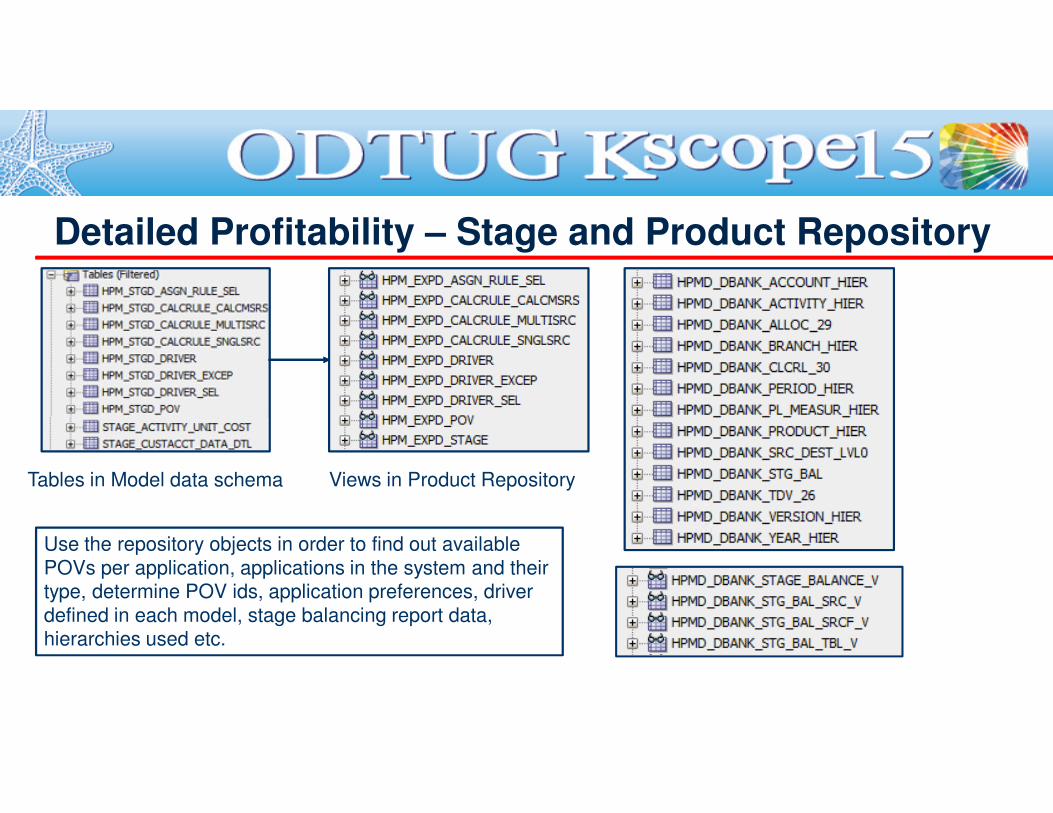
Detailed Profitability – Stage and Product Repository
Views in Product RepositoryTables in Model data schema
Use the repository objects in order to find out available
POVs per application, applications in the system and their type, determine POV ids, application preferences, driver
defined in each model, stage balancing report data, hierarchies used etc.
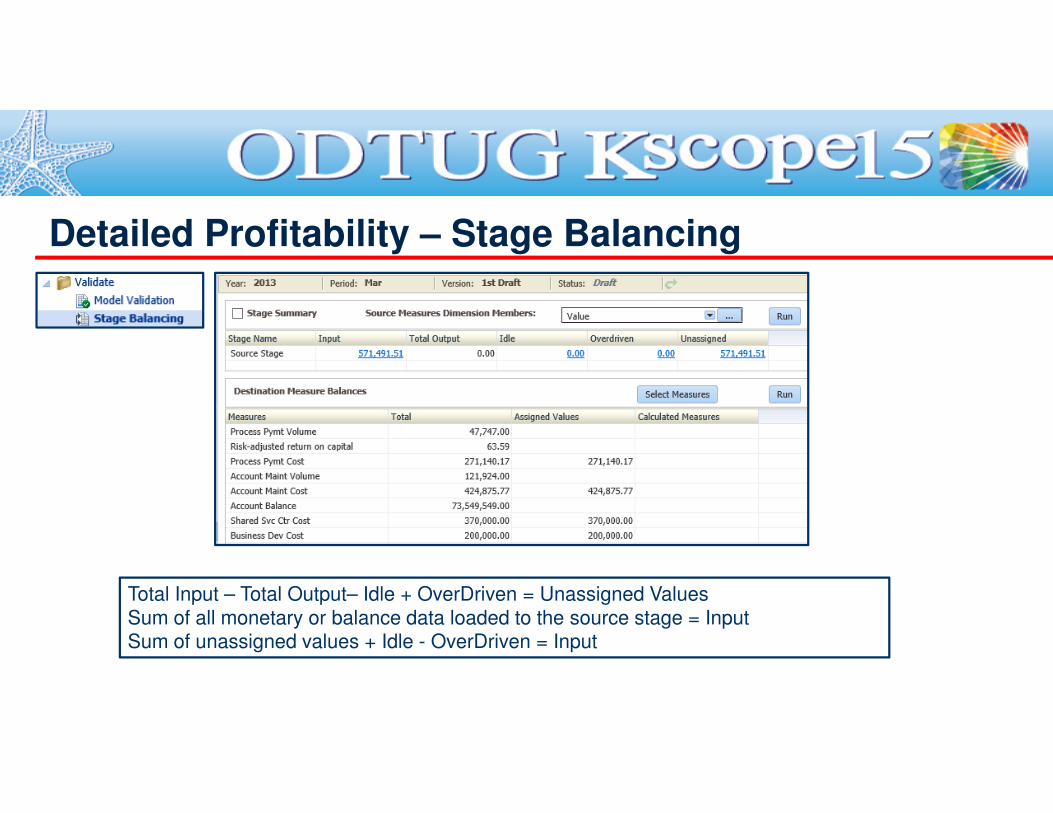
Detailed Profitability – Stage Balancing
Total Input – Total Output– Idle + OverDriven = Unassigned Values
Sum of all monetary or balance data loaded to the source stage = InputSum of unassigned values + Idle - OverDriven = Input
� What is HPCM and what does it do?
� Common points between HPCM and Planning & Essbase
� HPCM Modules
Agenda
● Standard Profitability
● Detailed Profitability
● Management Ledger
� HPCM vs Planning/Essbase
� Q&A
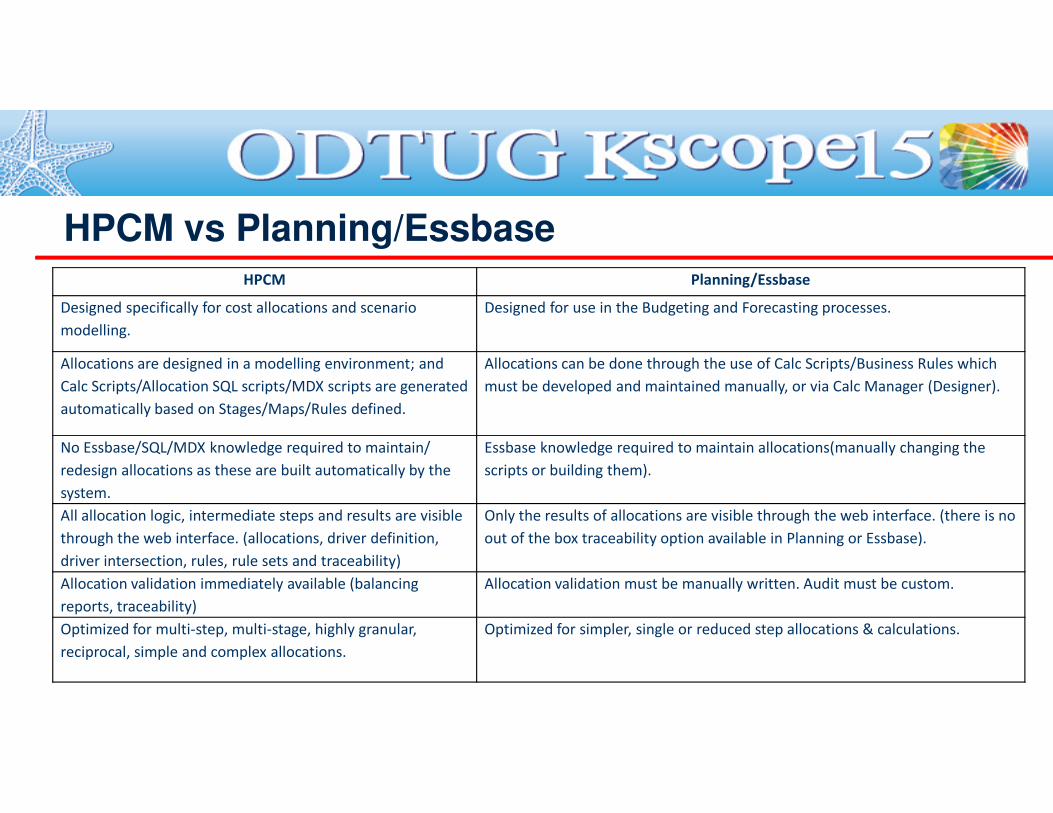
HPCM vs Planning/EssbaseHPCM Planning/Essbase
Designed specifically for cost allocations and scenario
modelling.
Designed for use in the Budgeting and Forecasting processes.
Allocations are designed in a modelling environment; and
Calc Scripts/Allocation SQL scripts/MDX scripts are generated
automatically based on Stages/Maps/Rules defined.
Allocations can be done through the use of Calc Scripts/Business Rules which
must be developed and maintained manually, or via Calc Manager (Designer).
automatically based on Stages/Maps/Rules defined.
No Essbase/SQL/MDX knowledge required to maintain/
redesign allocations as these are built automatically by the
system.
Essbase knowledge required to maintain allocations(manually changing the
scripts or building them).
All allocation logic, intermediate steps and results are visible
through the web interface. (allocations, driver definition,
driver intersection, rules, rule sets and traceability)
Only the results of allocations are visible through the web interface. (there is no
out of the box traceability option available in Planning or Essbase).
Allocation validation immediately available (balancing
reports, traceability)
Allocation validation must be manually written. Audit must be custom.
Optimized for multi-step, multi-stage, highly granular,
reciprocal, simple and complex allocations.
Optimized for simpler, single or reduced step allocations & calculations.

Modules Summary
Edgewater Ranzal108 Corporate Park Drive, Suite 105
White Plains, NY 10604Tel (914) 253-6600
Email: [email protected]
Contact Information
Visit Us in the
Exhibition Hall at Booth 500
PresentersMike Killeen, Sr. VP Technology & Strategy
Alecs Mlynarzek, Principal Consultant
45 Beech Street,
Suite 109
London EC2Y 8AD
United Kingdom
Tel +44 (0) 2033 717 174
150 North Michigan
Ave.
Suite 2800
Chicago, IL 60601
Tel (312) 624-7738
200 Harvard Mill
Square
Suite 210
Wakefield, MA 01880
Tel (781) 246-3343

Appendix – General
• HPCM Workflow
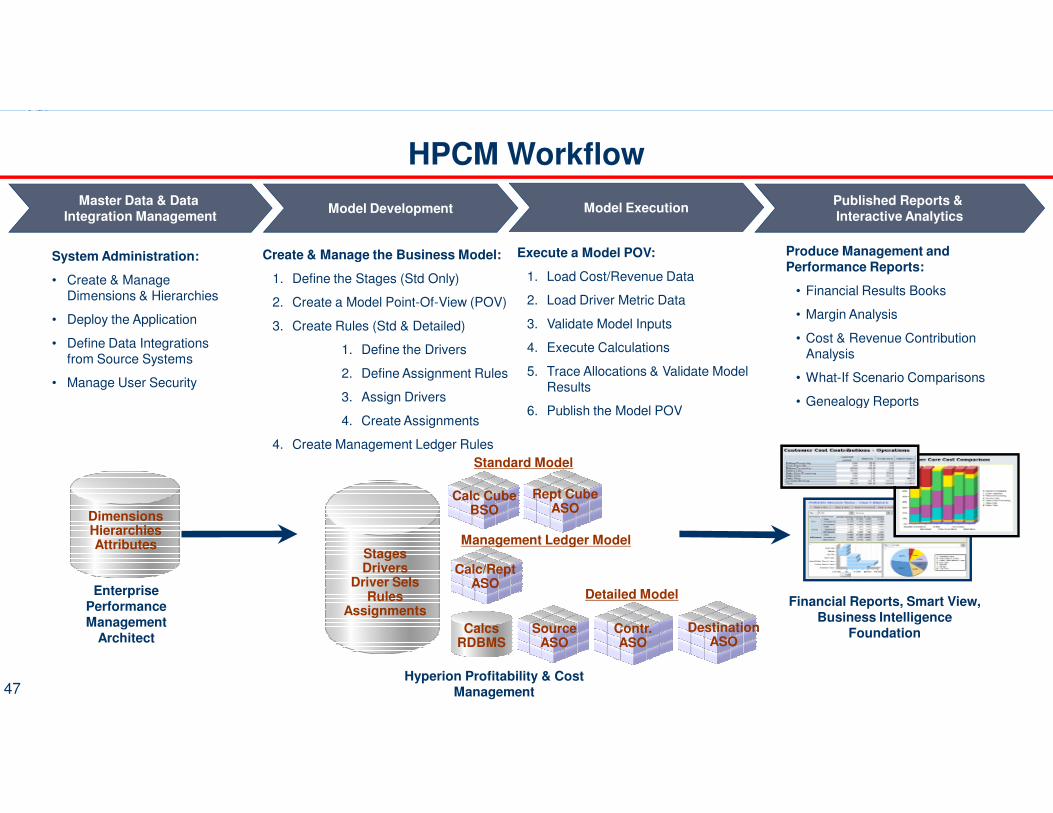
HPCM Workflow
Published Reports & Interactive Analytics
Model Development
System Administration:
• Create & Manage Dimensions & Hierarchies
• Deploy the Application
• Define Data Integrations from Source Systems
• Manage User Security
Master Data & Data Integration Management
Produce Management and Performance Reports:
• Financial Results Books
• Margin Analysis
• Cost & Revenue Contribution Analysis
• What-If Scenario Comparisons
• Genealogy Reports
Execute a Model POV:
1. Load Cost/Revenue Data
2. Load Driver Metric Data
3. Validate Model Inputs
4. Execute Calculations
5. Trace Allocations & Validate Model Results
6. Publish the Model POV
Create & Manage the Business Model:
1. Define the Stages (Std Only)
2. Create a Model Point-Of-View (POV)
3. Create Rules (Std & Detailed)
1. Define the Drivers
2. Define Assignment Rules
3. Assign Drivers
Model Execution
47
EnterprisePerformance Management
Architect
DimensionsHierarchiesAttributes
Hyperion Profitability & CostManagement
Financial Reports, Smart View,Business Intelligence
Foundation
• Genealogy Reports6. Publish the Model POV
4. Create Assignments
4. Create Management Ledger Rules
StagesDrivers
Driver SelsRules
Assignments
Standard Model
Detailed Model
Management Ledger Model
Calc CubeBSO
Rept CubeASO
CalcsRDBMS
Contr.ASO
DestinationASO
Calc/ReptASO
SourceASO
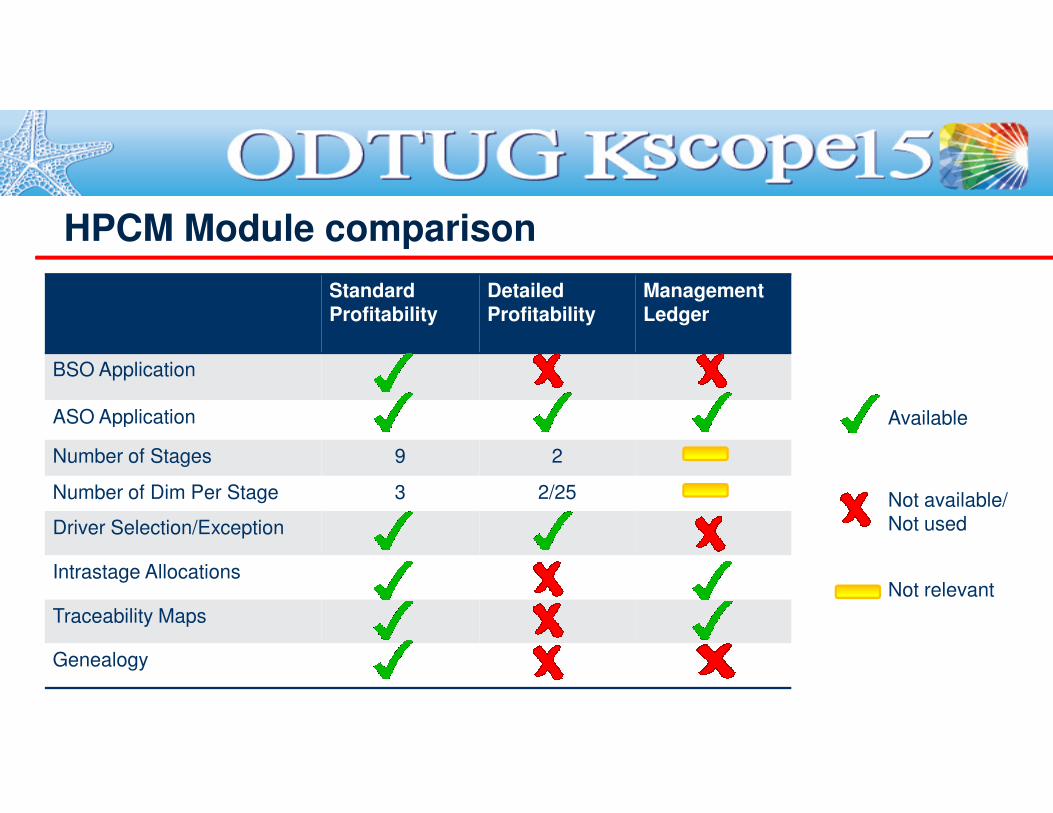
HPCM Module comparison
Standard Profitability
Detailed Profitability
Management Ledger
BSO Application
ASO Application AvailableASO Application
Number of Stages 9 2
Number of Dim Per Stage 3 2/25
Driver Selection/Exception
Intrastage Allocations
Traceability Maps
Genealogy
Not available/
Not used
Available
Not relevant
Appendix – Standard Model Details
• Standard Profitability Workflow
• Use cases• Driver Load
• Calculation Scripts naming convention• System Reports
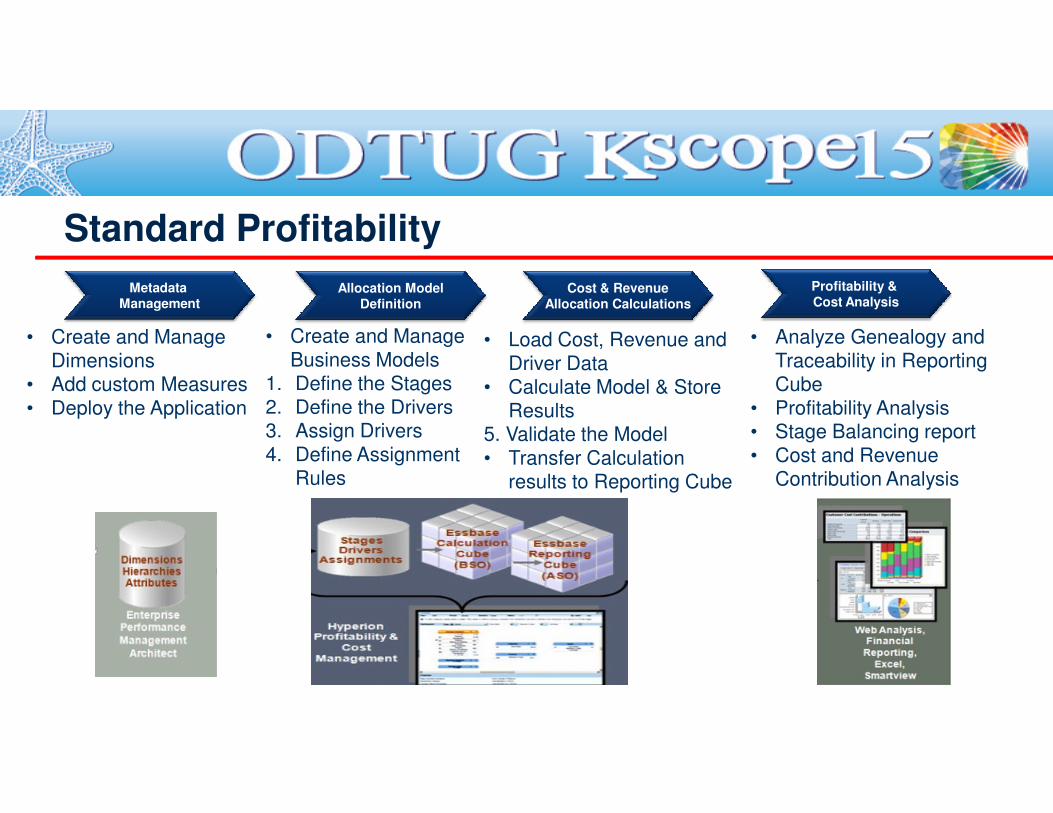
Standard Profitability
Metadata Management
Allocation ModelDefinition
Cost & RevenueAllocation Calculations
Profitability & Cost Analysis
• Create and Manage
Dimensions• Add custom Measures
• Deploy the Application
• Create and Manage
Business Models1. Define the Stages
2. Define the Drivers
• Load Cost, Revenue and
Driver Data• Calculate Model & Store
Results
• Analyze Genealogy and
Traceability in Reporting Cube
• Profitability Analysis• Deploy the Application 2. Define the Drivers3. Assign Drivers
4. Define Assignment Rules
Results5. Validate the Model
• Transfer Calculation results to Reporting Cube
• Profitability Analysis• Stage Balancing report
• Cost and Revenue Contribution Analysis
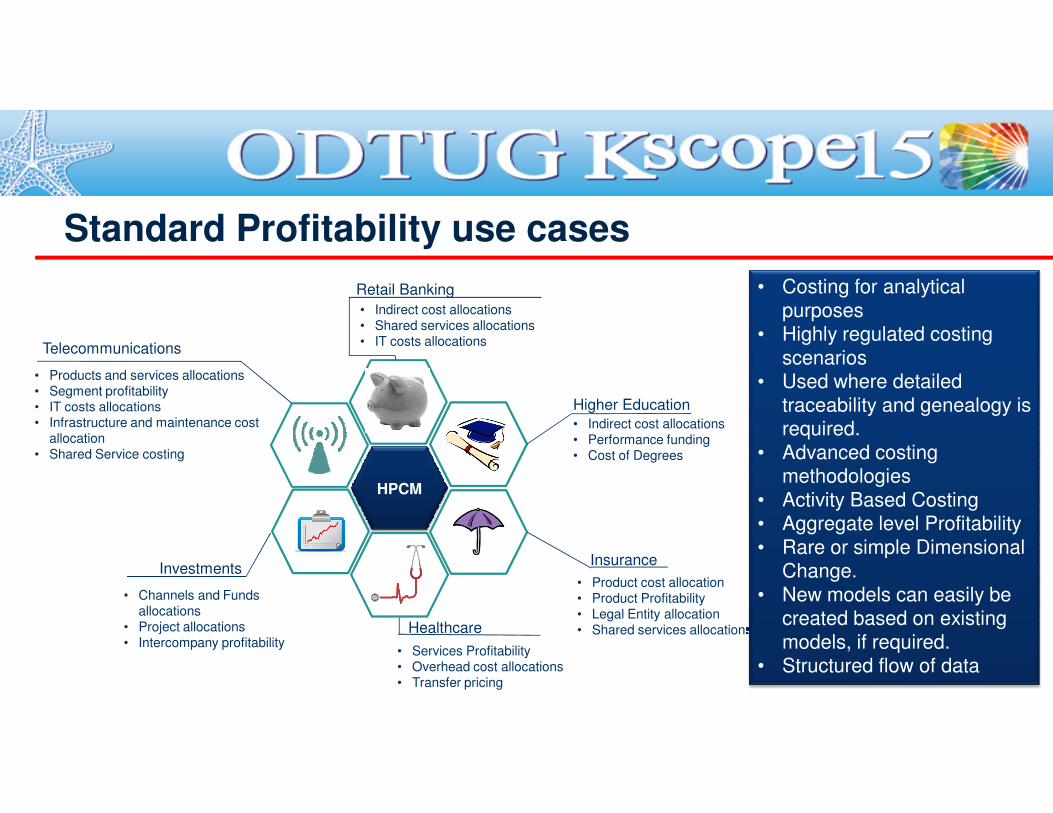
Standard Profitability use cases
Retail Banking
• Indirect cost allocations• Shared services allocations• IT costs allocations
Telecommunications
• Products and services allocations• Segment profitability• IT costs allocations Higher Education
• Costing for analytical
purposes• Highly regulated costing
scenarios• Used where detailed
traceability and genealogy is
HPCM
Insurance
• Product cost allocation• Product Profitability• Legal Entity allocation• Shared services allocations
Investments
• Channels and Funds allocations
• Project allocations• Intercompany profitability
• IT costs allocations• Infrastructure and maintenance cost
allocation• Shared Service costing
Healthcare
• Services Profitability• Overhead cost allocations• Transfer pricing
Higher Education
• Indirect cost allocations• Performance funding• Cost of Degrees
traceability and genealogy is required.
• Advanced costing methodologies
• Activity Based Costing• Aggregate level Profitability
• Rare or simple Dimensional Change.
• New models can easily be created based on existing
models, if required.• Structured flow of data
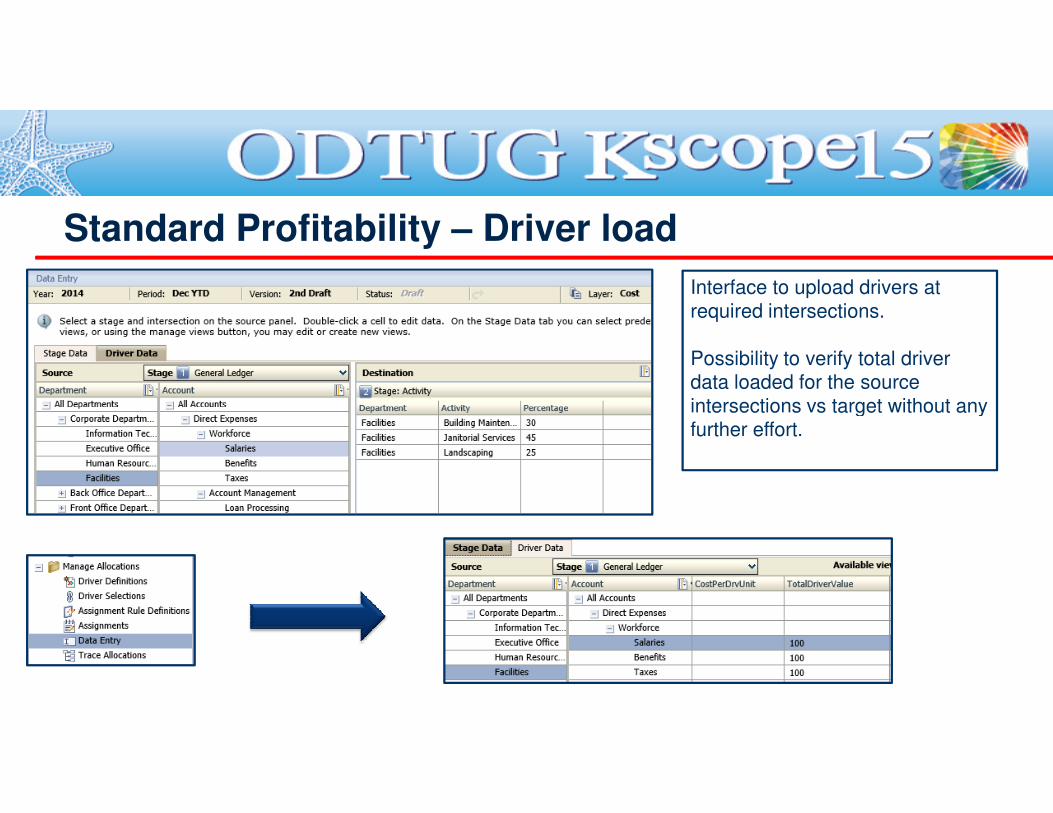
Standard Profitability – Driver load
Interface to upload drivers at
required intersections.
Possibility to verify total driver data loaded for the source
intersections vs target without any intersections vs target without any further effort.
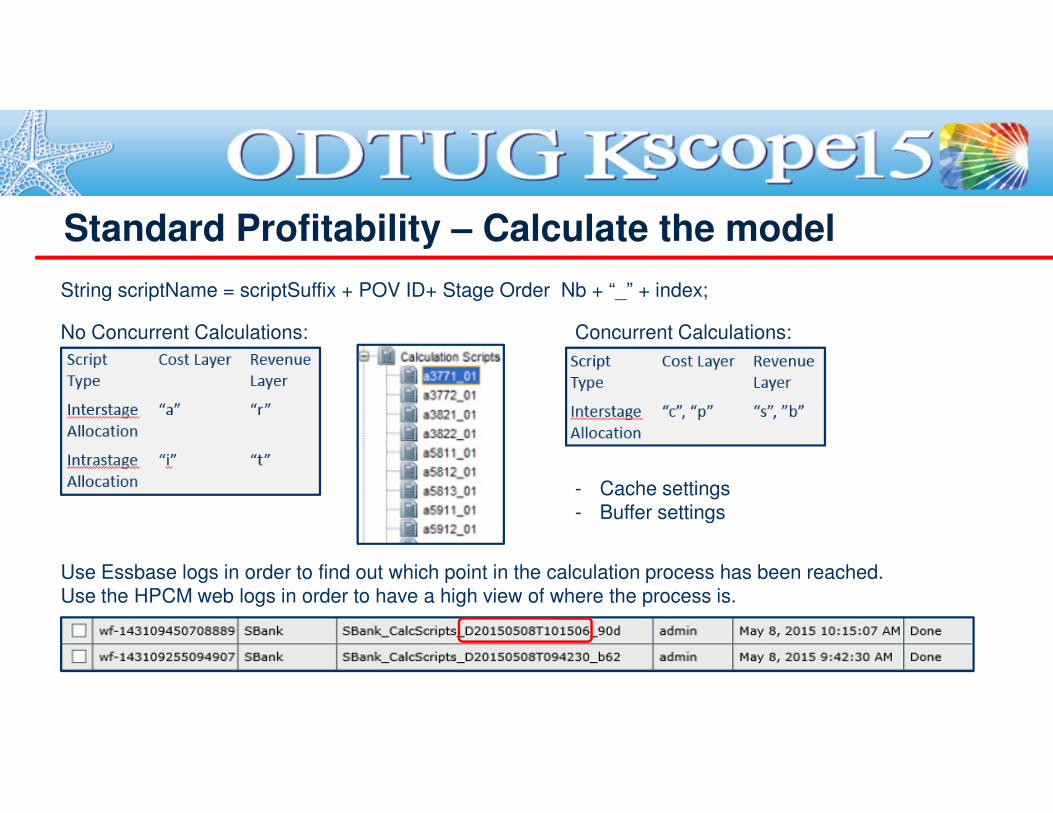
Standard Profitability – Calculate the model
String scriptName = scriptSuffix + POV ID+ Stage Order Nb + “_” + index;
No Concurrent Calculations: Concurrent Calculations:
- Cache settings
- Buffer settings
Use Essbase logs in order to find out which point in the calculation process has been reached.
Use the HPCM web logs in order to have a high view of where the process is.
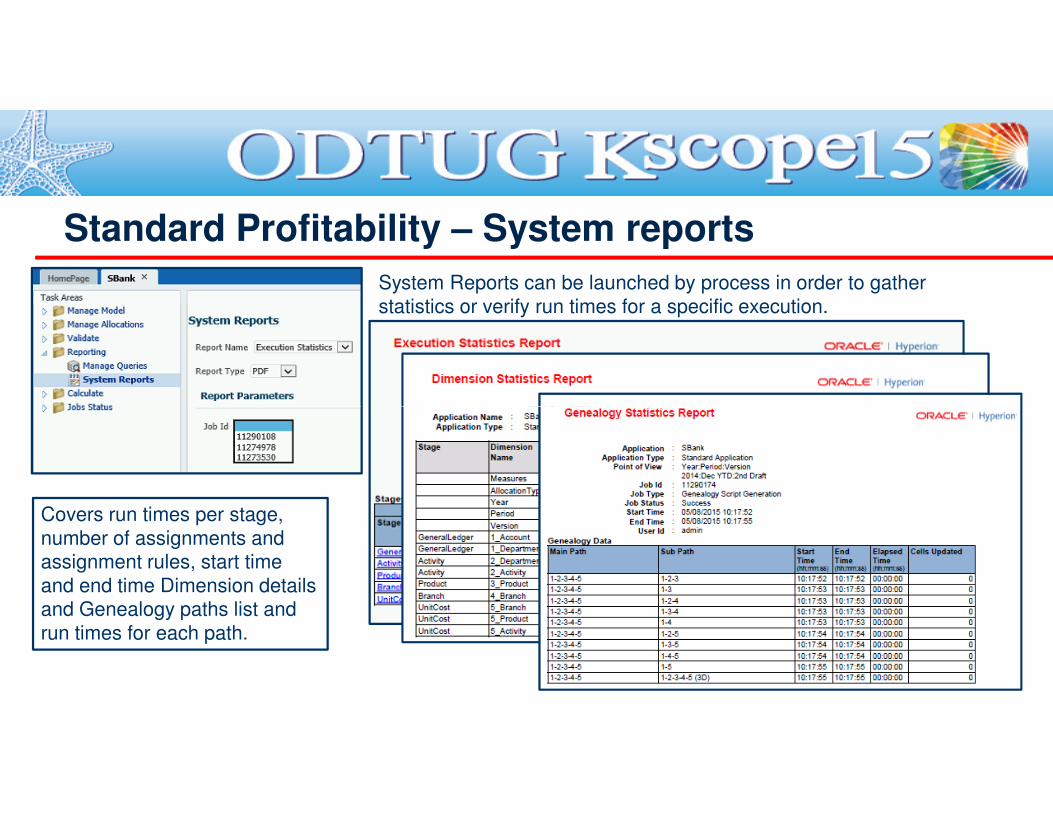
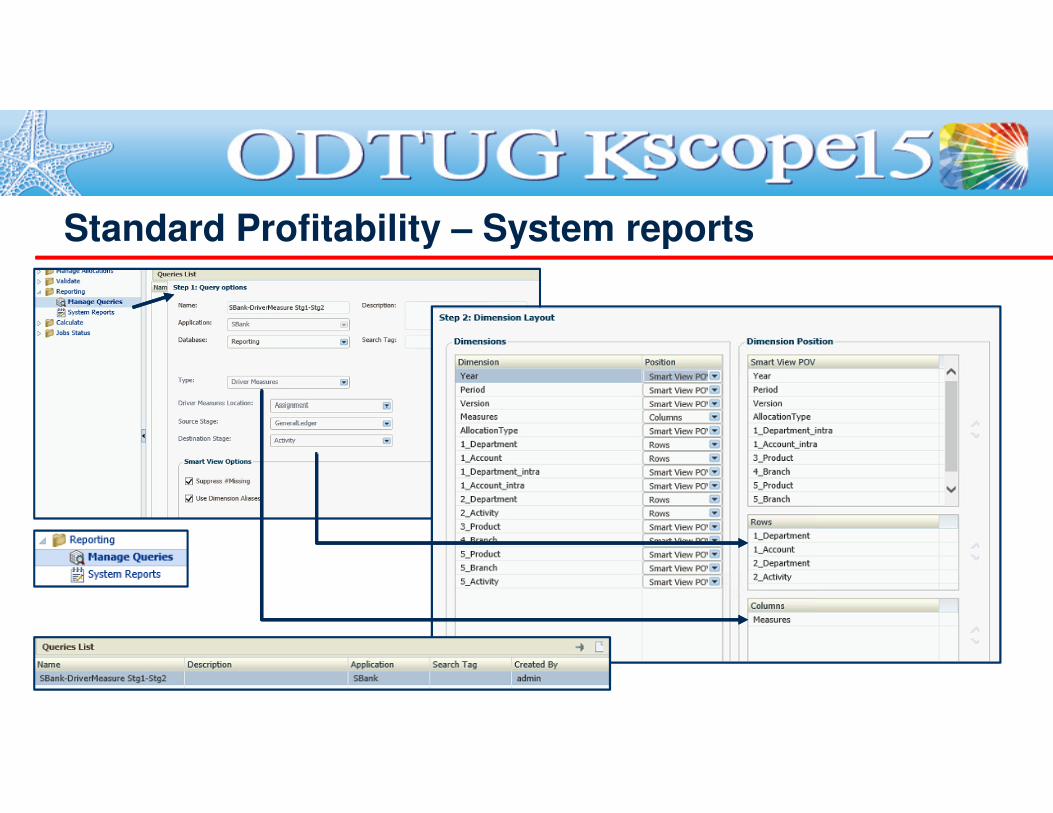
Standard Profitability – System reports
System Reports can be launched by process in order to gather
statistics or verify run times for a specific execution.
Covers run times per stage,
number of assignments and assignment rules, start time
and end time Dimension details and Genealogy paths list and
run times for each path.
Standard Profitability – System reports
Appendix – Management Ledger Details
• Management Ledger Workflow
• Use cases• Driver Data Entry
• Model Validation• System Reports
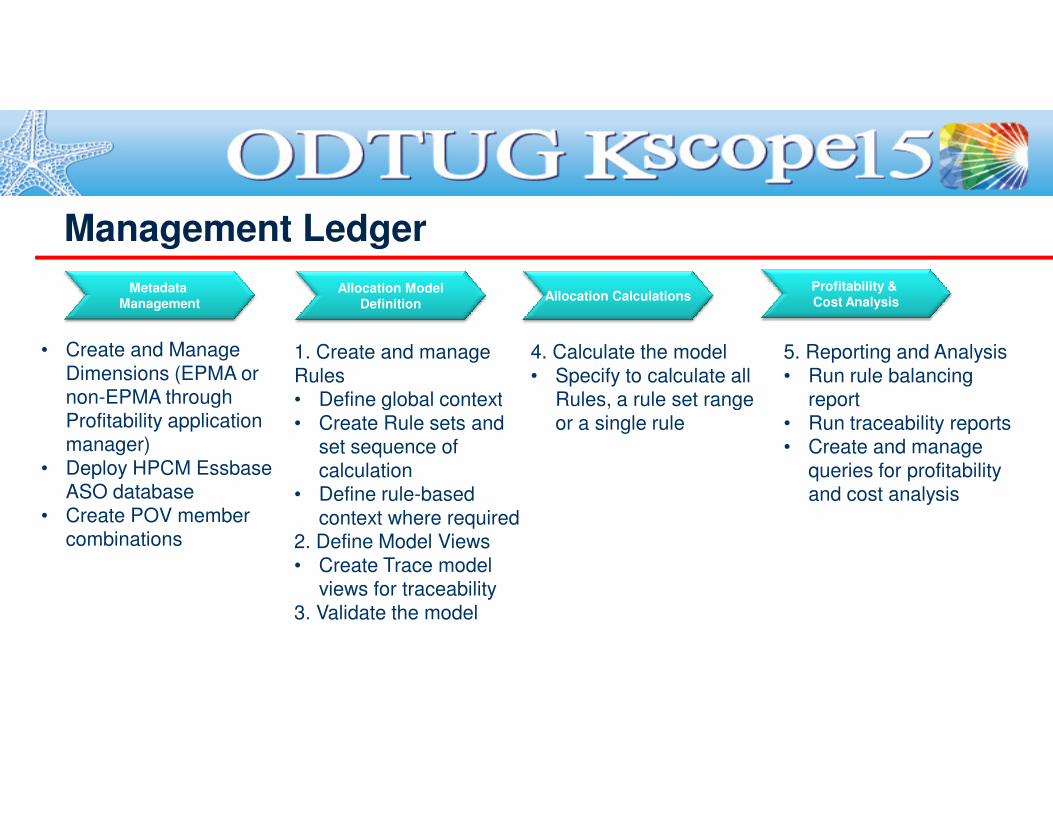
Management Ledger
Metadata Management
Allocation ModelDefinition
Allocation CalculationsProfitability & Cost Analysis
• Create and Manage
Dimensions (EPMA or non-EPMA through
1. Create and manage
Rules• Define global context
4. Calculate the model
• Specify to calculate all Rules, a rule set range
5. Reporting and Analysis
• Run rule balancing reportnon-EPMA through
Profitability application manager)
• Deploy HPCM Essbase ASO database
• Create POV member combinations
• Define global context
• Create Rule sets and set sequence of
calculation• Define rule-based
context where required2. Define Model Views
• Create Trace model views for traceability
3. Validate the model
Rules, a rule set range
or a single rule
report
• Run traceability reports • Create and manage
queries for profitability and cost analysis
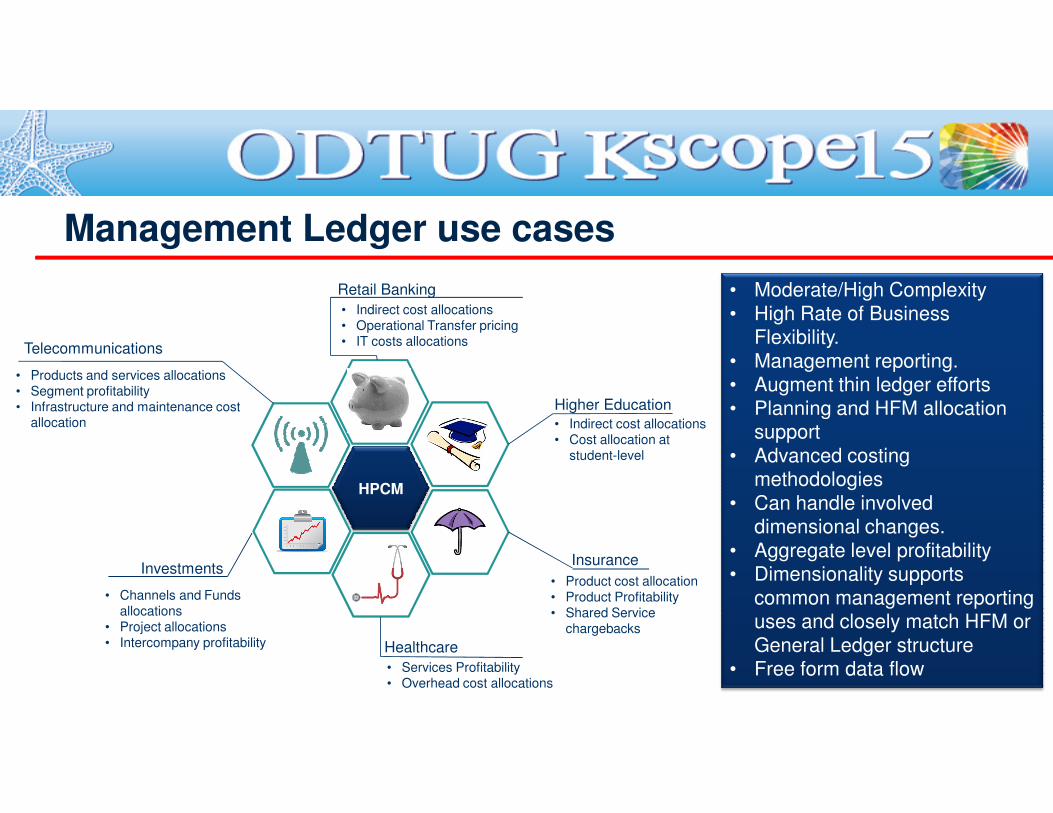
Management Ledger use cases
Retail Banking
• Indirect cost allocations• Operational Transfer pricing• IT costs allocations
Telecommunications
• Products and services allocations• Segment profitability• Infrastructure and maintenance cost Higher Education
• Moderate/High Complexity
• High Rate of Business Flexibility.
• Management reporting.• Augment thin ledger efforts
• Planning and HFM allocation
HPCM
Insurance
• Product cost allocation• Product Profitability• Shared Service
chargebacks
Investments
• Channels and Funds allocations
• Project allocations• Intercompany profitability
• Infrastructure and maintenance cost allocation
Healthcare
• Services Profitability• Overhead cost allocations
Higher Education
• Indirect cost allocations• Cost allocation at
student-level
• Planning and HFM allocation support
• Advanced costing methodologies
• Can handle involved dimensional changes.
• Aggregate level profitability• Dimensionality supports
common management reporting uses and closely match HFM or
General Ledger structure• Free form data flow
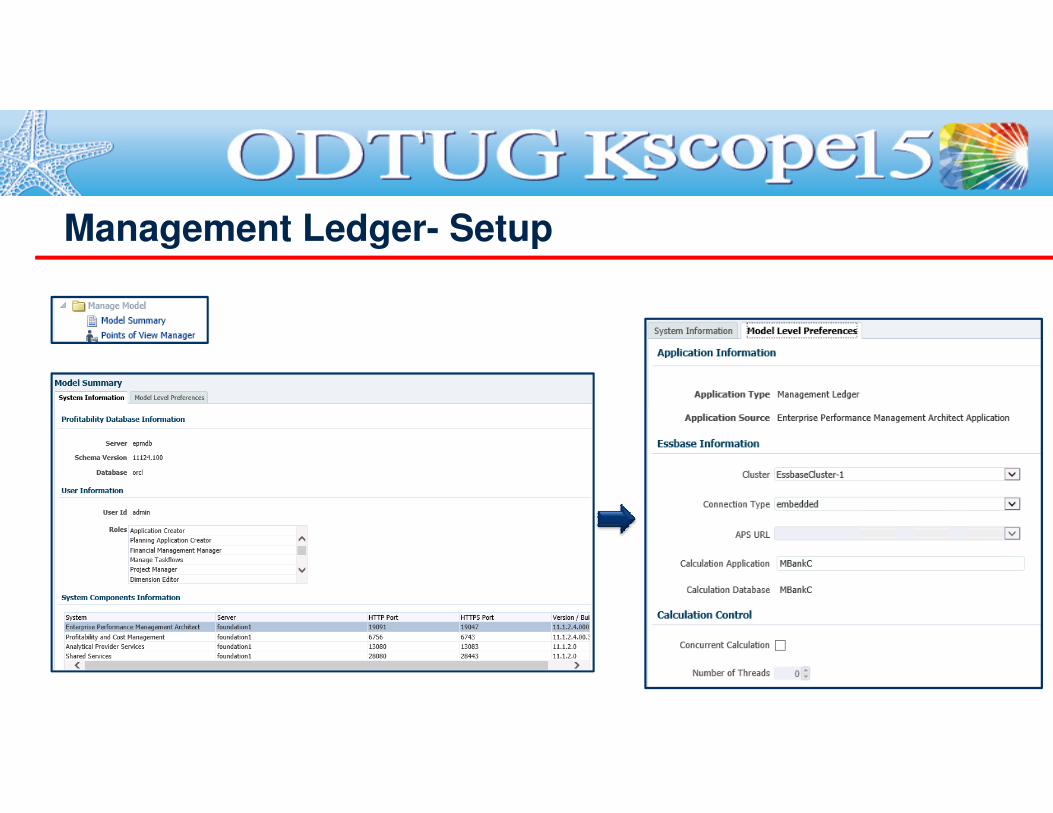
Management Ledger- Setup
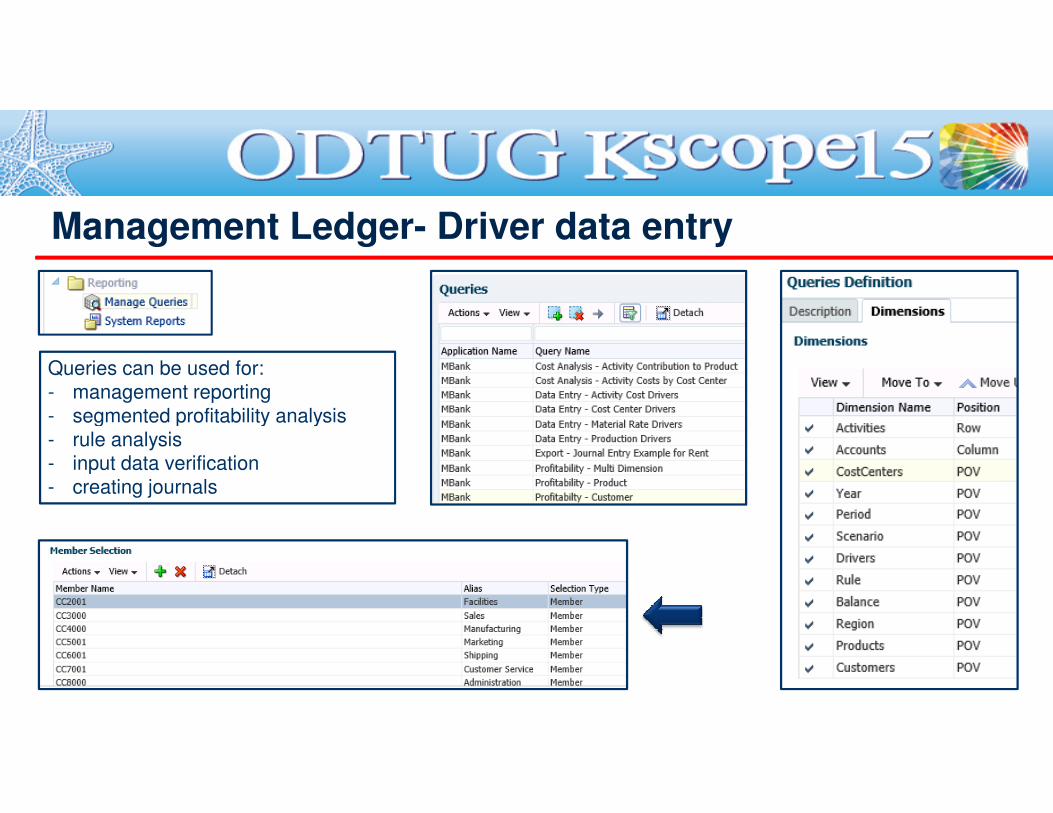
Management Ledger- Driver data entry
Queries can be used for:
- management reporting- segmented profitability analysis - segmented profitability analysis
- rule analysis- input data verification
- creating journals
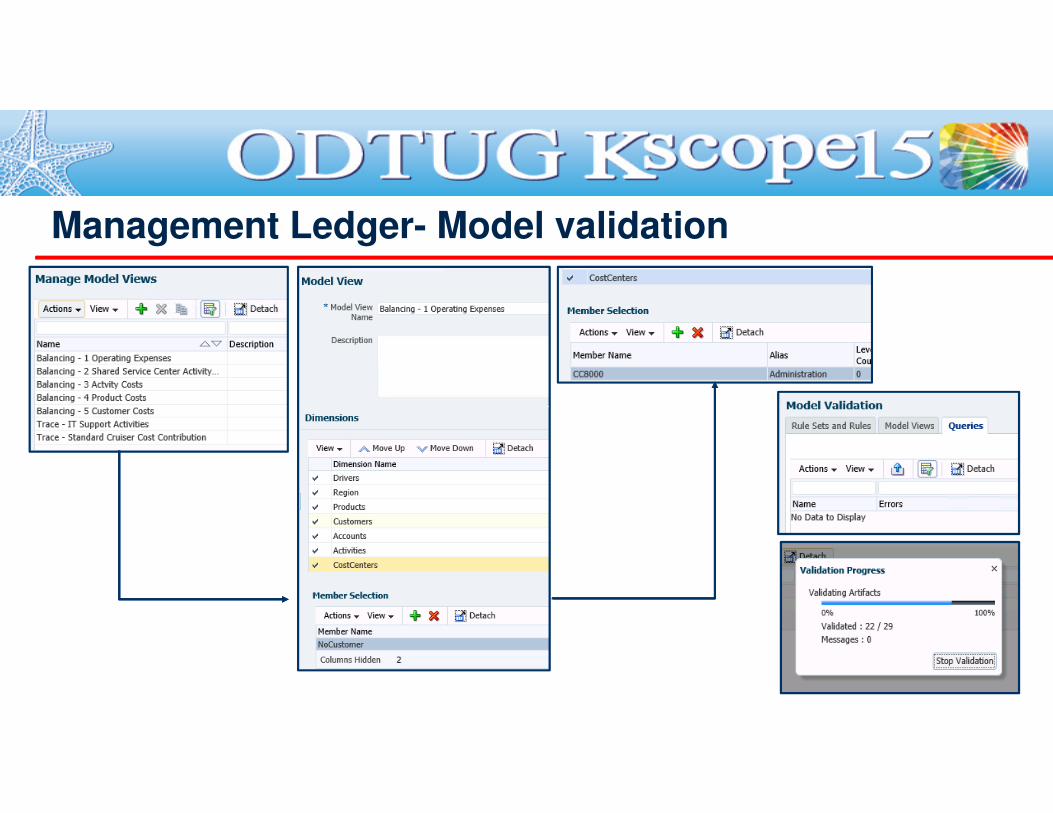
Management Ledger- Model validation
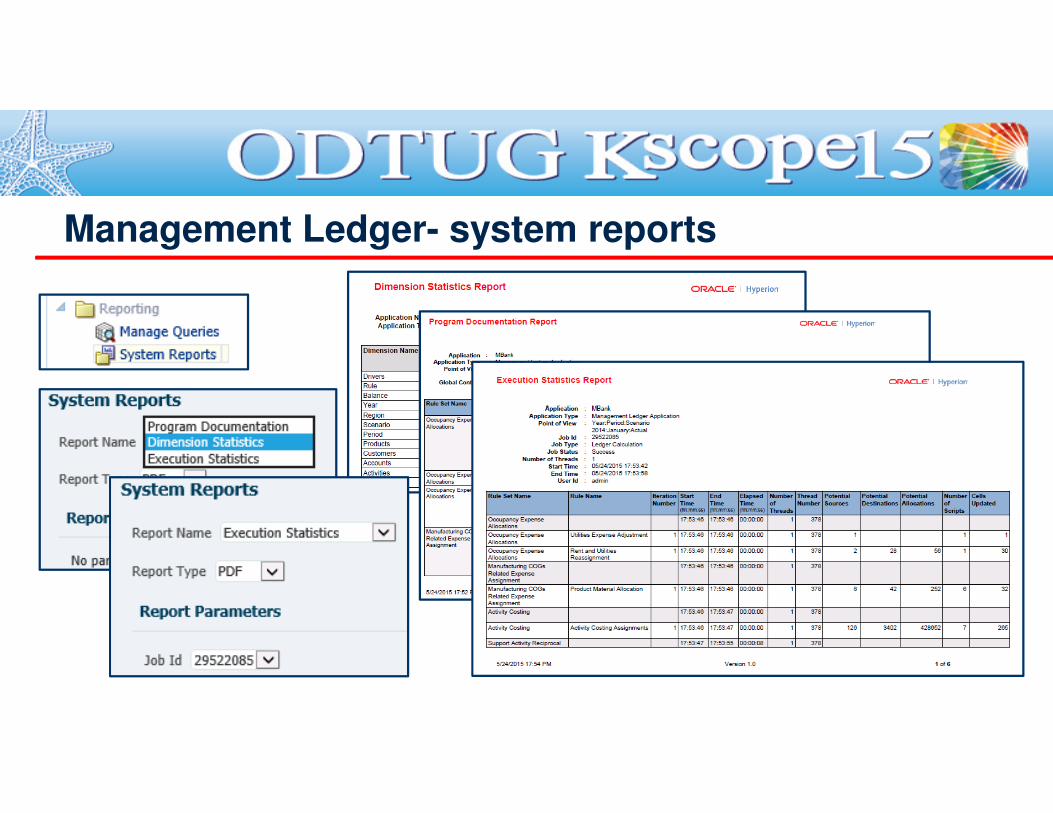
Management Ledger- system reports
Appendix – Detailed Model Details
• Detailed Profitability Workflow
• Use cases• Detailed Profitability Application Setup
• Driver Selection• Assignment Rules selection
• Calculation Rules• Calculation Rules• Manage Calculation
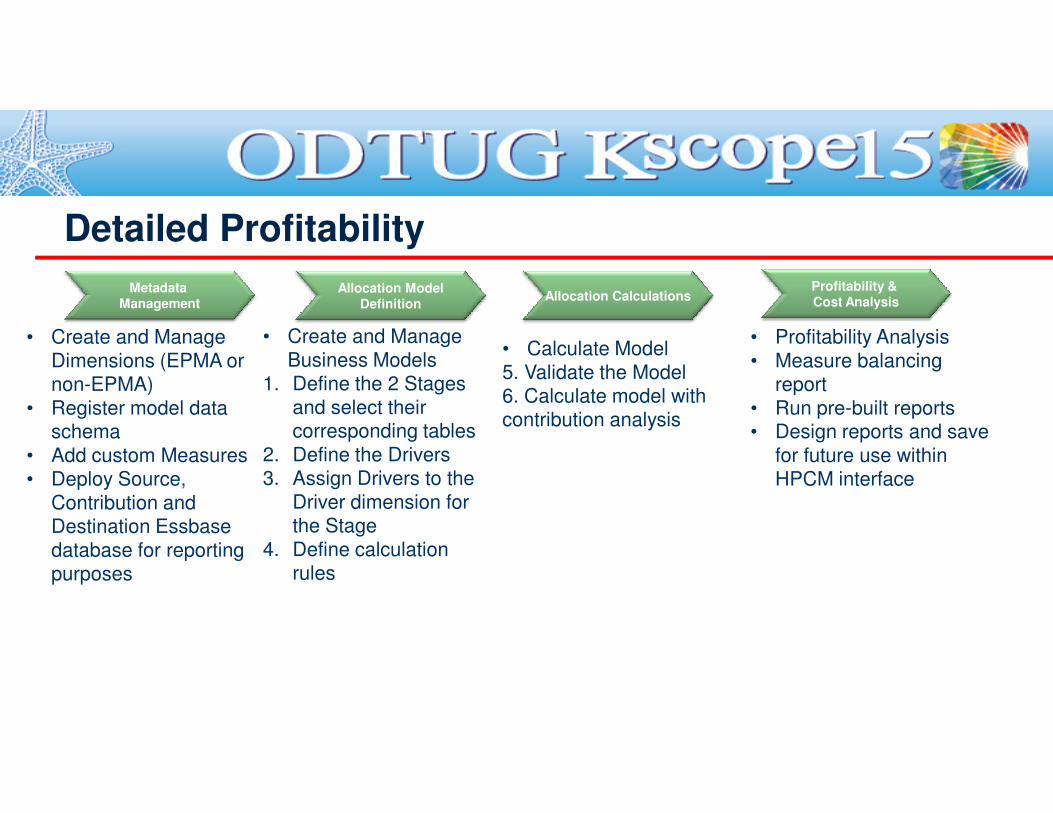
Detailed Profitability
Metadata Management
Allocation ModelDefinition
Allocation CalculationsProfitability & Cost Analysis
• Create and Manage
Dimensions (EPMA or non-EPMA)
• Register model data
• Create and Manage
Business Models1. Define the 2 Stages
and select their
• Calculate Model
5. Validate the Model6. Calculate model with
• Profitability Analysis
• Measure balancing report
• Run pre-built reports• Register model data schema
• Add custom Measures• Deploy Source,
Contribution and Destination Essbase
database for reporting purposes
and select their corresponding tables
2. Define the Drivers3. Assign Drivers to the
Driver dimension for the Stage
4. Define calculation rules
contribution analysis• Run pre-built reports• Design reports and save
for future use within HPCM interface

Detailed Profitability use cases
Broker Institutions
• Cost allocations and profitability calculation at desk level/ Employee level
Retail
Manufacturing, Distribution
• Product line profitability• Customer
category\class\tariff group
• Low Complexity
• High Rate of Business Flexibility.
• Bottom-up profitability computation
• Highly detailed, granular
HPCM
Insurance
• Product cost allocation where more than 3 dimensions /stage are required
Investments
• Portfolio/ Account / Client level profitability
Healthcare
• Patient-level cost allocations
Retail
• Customer and / or segment profitability
• Overhead cost allocation• Profitability by
location/store
category\class\tariff group cost allocations
• Highly detailed, granular dimensional cost and profit
objects• Flexible regarding
dimensional changes• First setup is time consuming
hence not as quick to spin-off new model from an existing
one• B2C customer, customer
event, order , or transaction costing and profitability
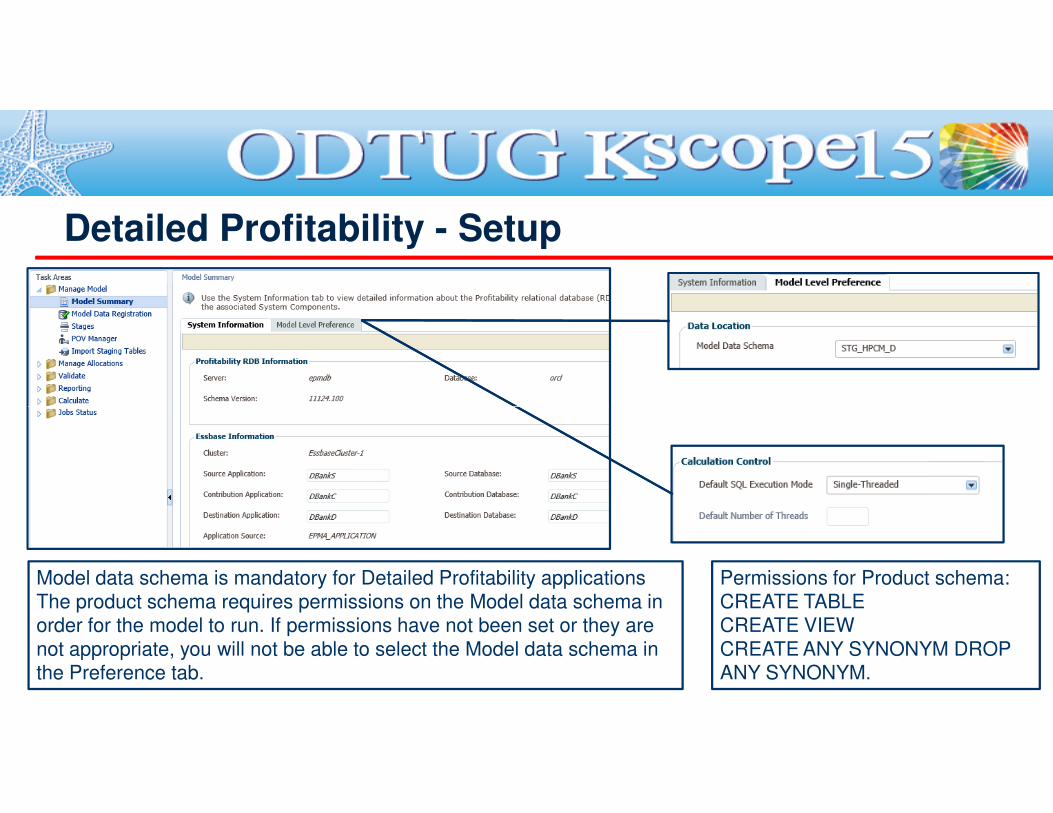
Detailed Profitability - Setup
Model data schema is mandatory for Detailed Profitability applications
The product schema requires permissions on the Model data schema in order for the model to run. If permissions have not been set or they are
not appropriate, you will not be able to select the Model data schema in the Preference tab.
Permissions for Product schema:
CREATE TABLECREATE VIEW
CREATE ANY SYNONYM DROP ANY SYNONYM.
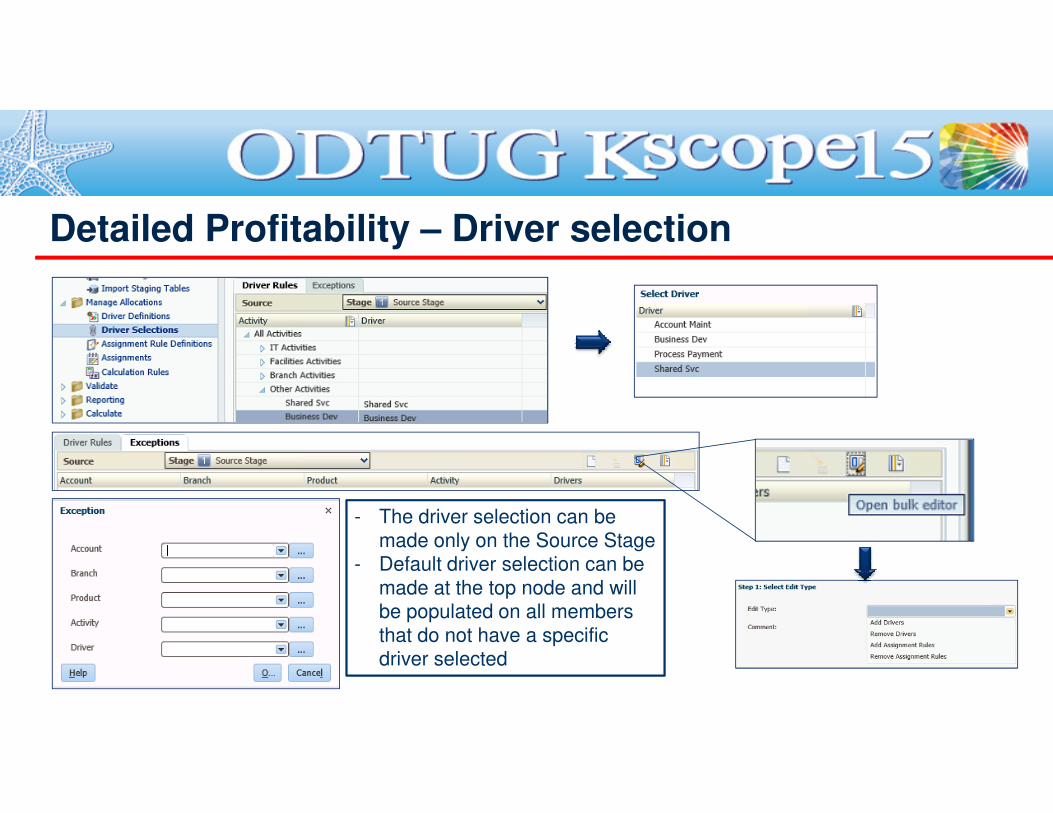
Detailed Profitability – Driver selection
- The driver selection can be
made only on the Source Stage- Default driver selection can be
made at the top node and will be populated on all members
that do not have a specific driver selected
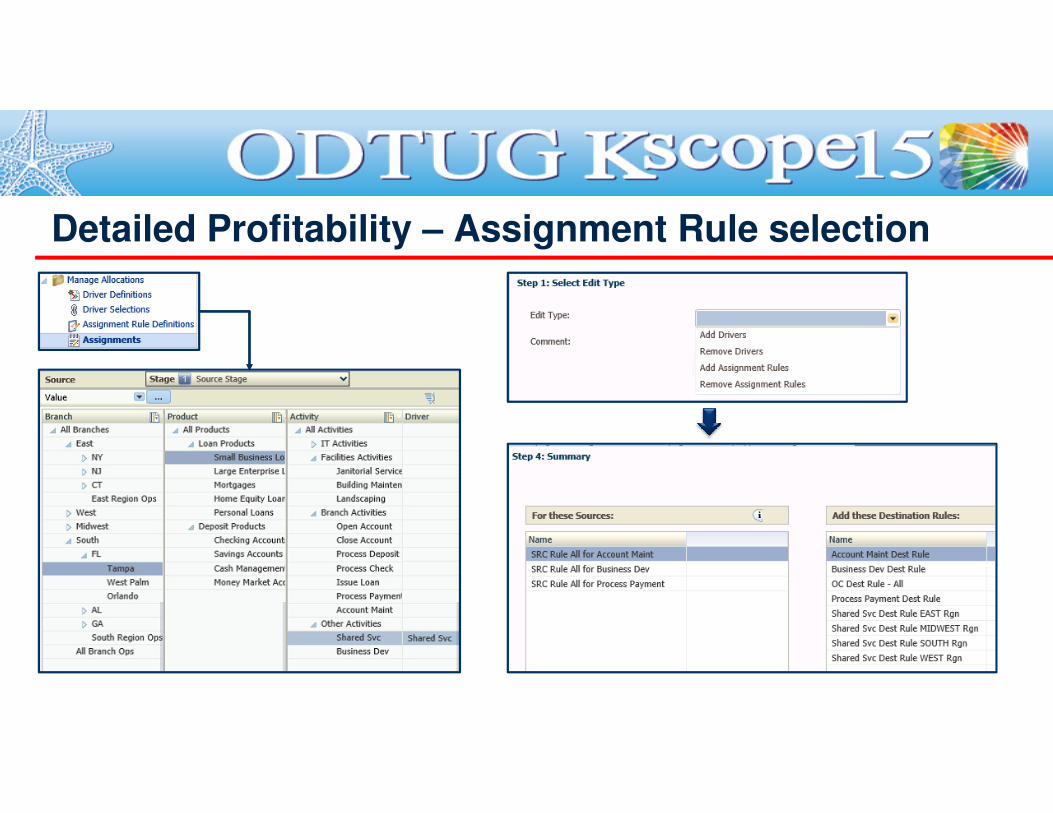
Detailed Profitability – Assignment Rule selection
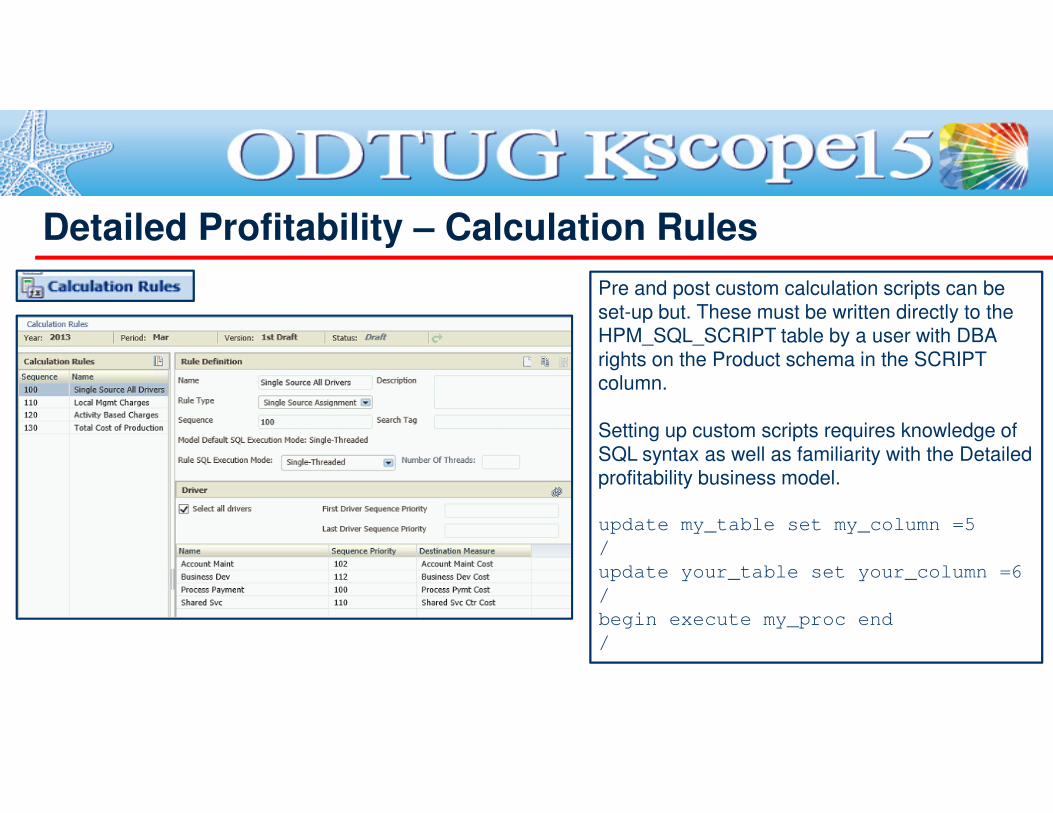
Detailed Profitability – Calculation Rules
Pre and post custom calculation scripts can be
set-up but. These must be written directly to the HPM_SQL_SCRIPT table by a user with DBA
rights on the Product schema in the SCRIPT column.
Setting up custom scripts requires knowledge of
SQL syntax as well as familiarity with the Detailed profitability business model.
update my_table set my_column =5
/
update your_table set your_column =6
/
begin execute my_proc end
/
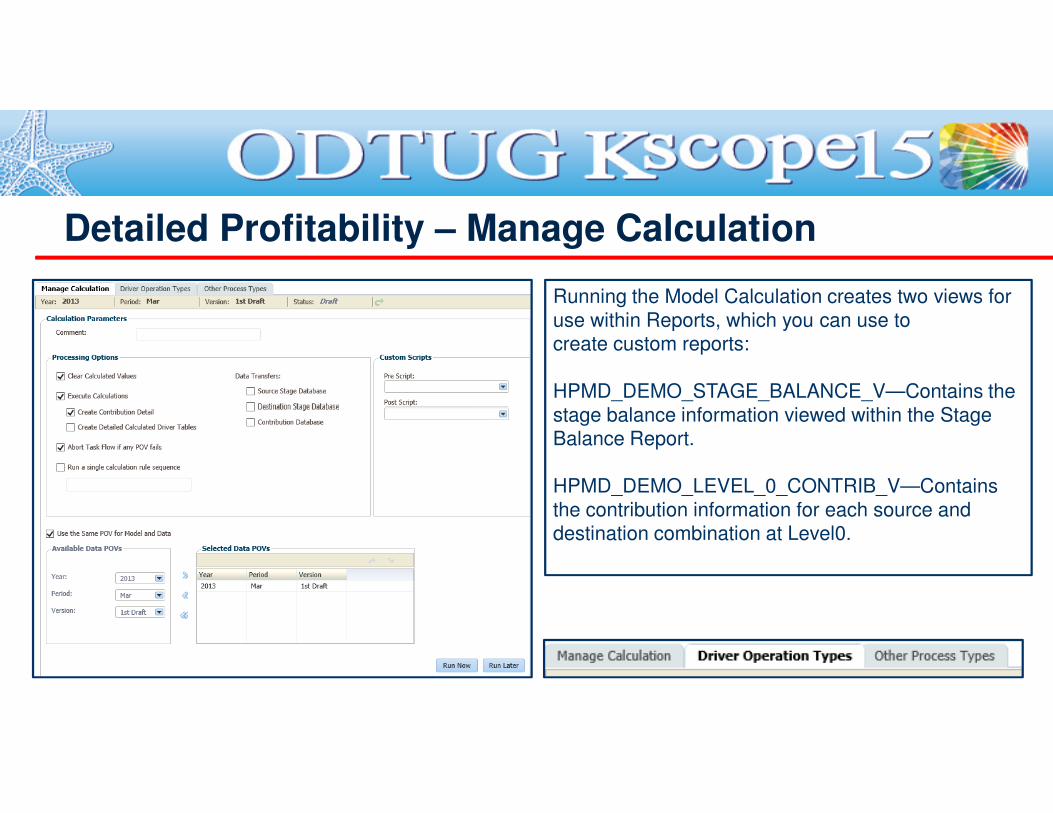
Detailed Profitability – Manage Calculation
Running the Model Calculation creates two views for
use within Reports, which you can use tocreate custom reports:
HPMD_DEMO_STAGE_BALANCE_V—Contains the
stage balance information viewed within the Stage stage balance information viewed within the Stage Balance Report.
HPMD_DEMO_LEVEL_0_CONTRIB_V—Contains
the contribution information for each source and destination combination at Level0.

THANK YOU!