Embed Size (px)
Citation preview

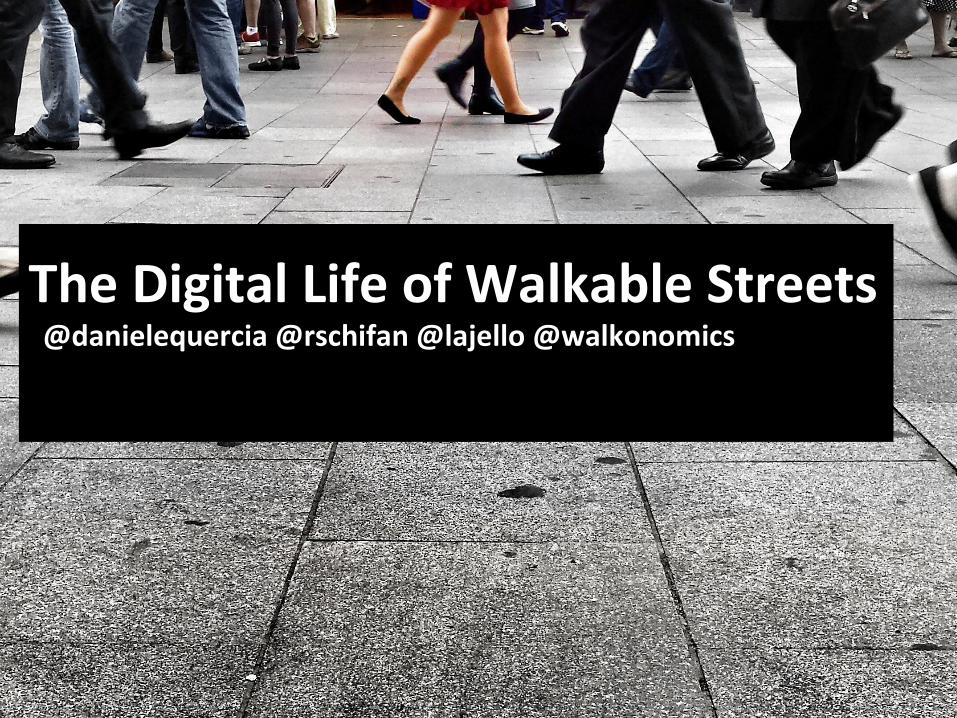
The Digital Life of Walkable Streets
The Digital Life of Walkable Streets @danielequercia @rschifan @lajello @walkonomics

We cannot afford to leave architecture to architects

We cannot afford to leave computers to engineers

Neil Gershenfeld Director of MIT’s Center for Bits and Atoms
“Computer science is one of the worst things to happen to computers or to science because, unlike physics, it has arbitrarily segregated the notion that computing happens in an alien world.”


daniele quercia


offline & online


Jane Jacob
Kevin Lynch

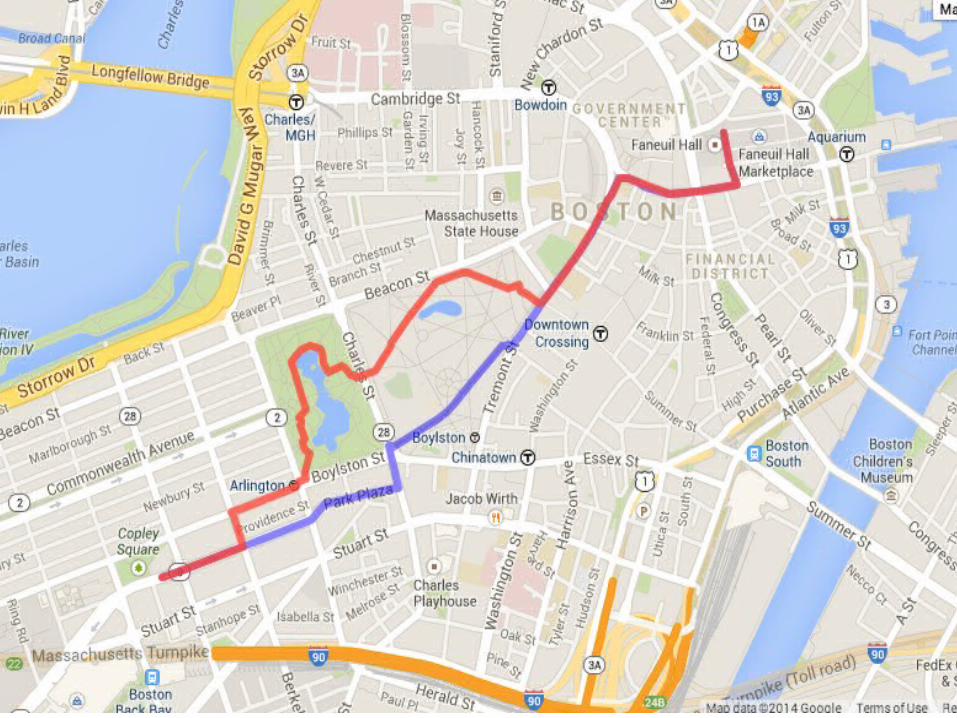
Shortest
Quiet
Happy
Beauty
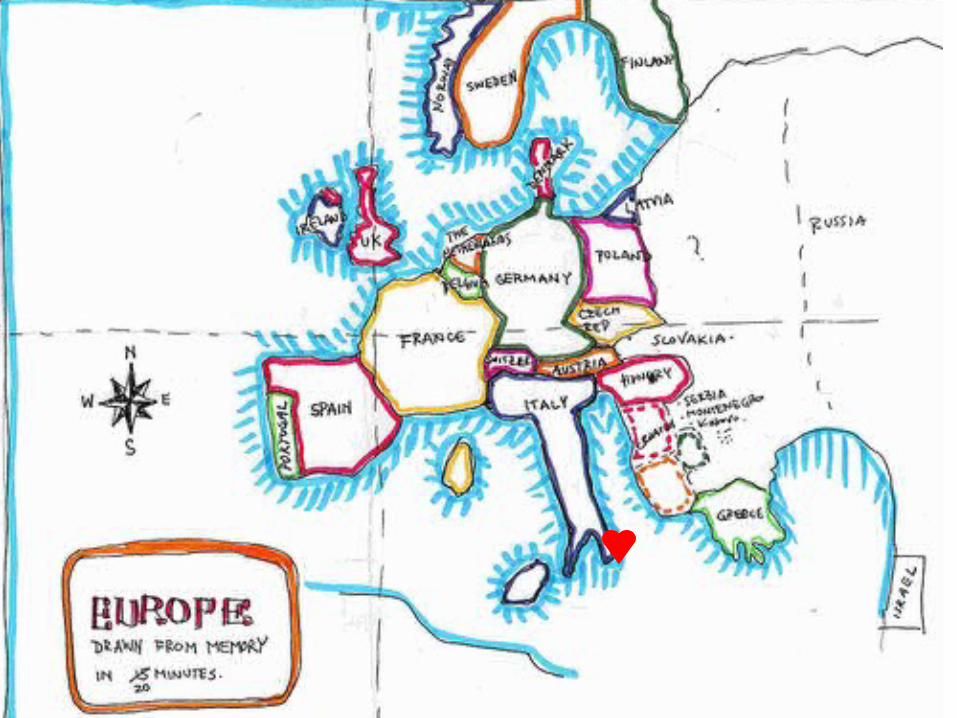
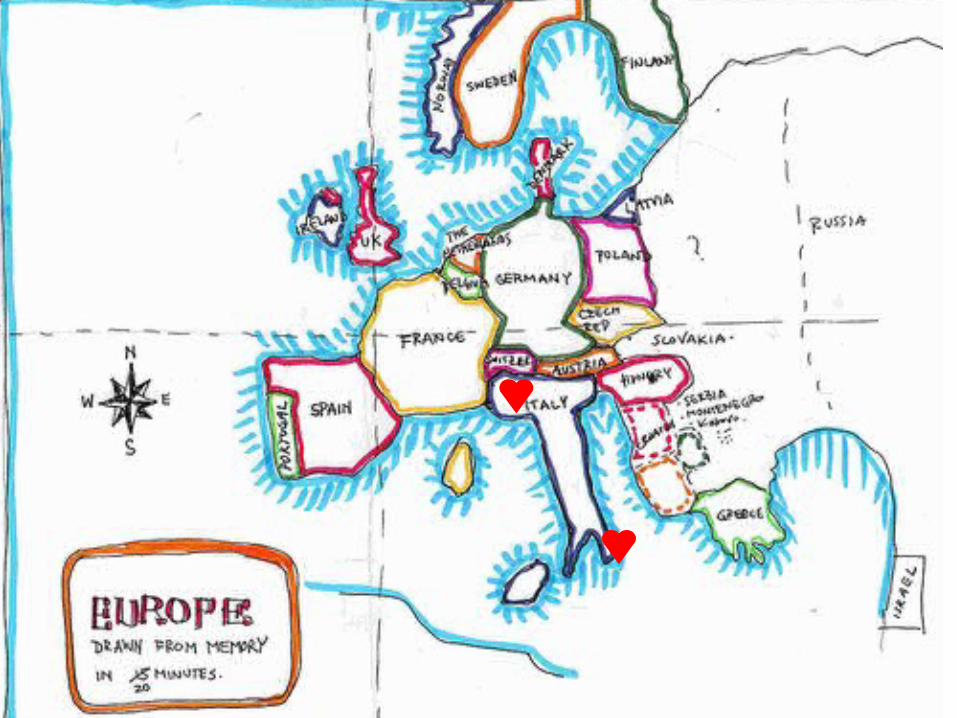
Google for “Happy Maps”

The shortest Path to Happiness

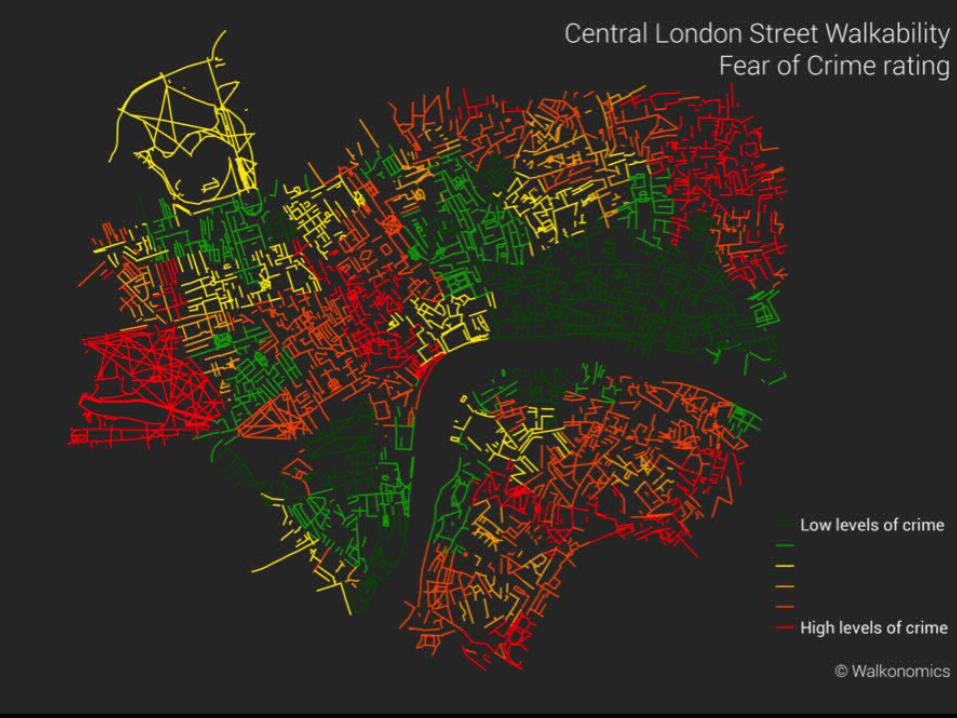
Walkability
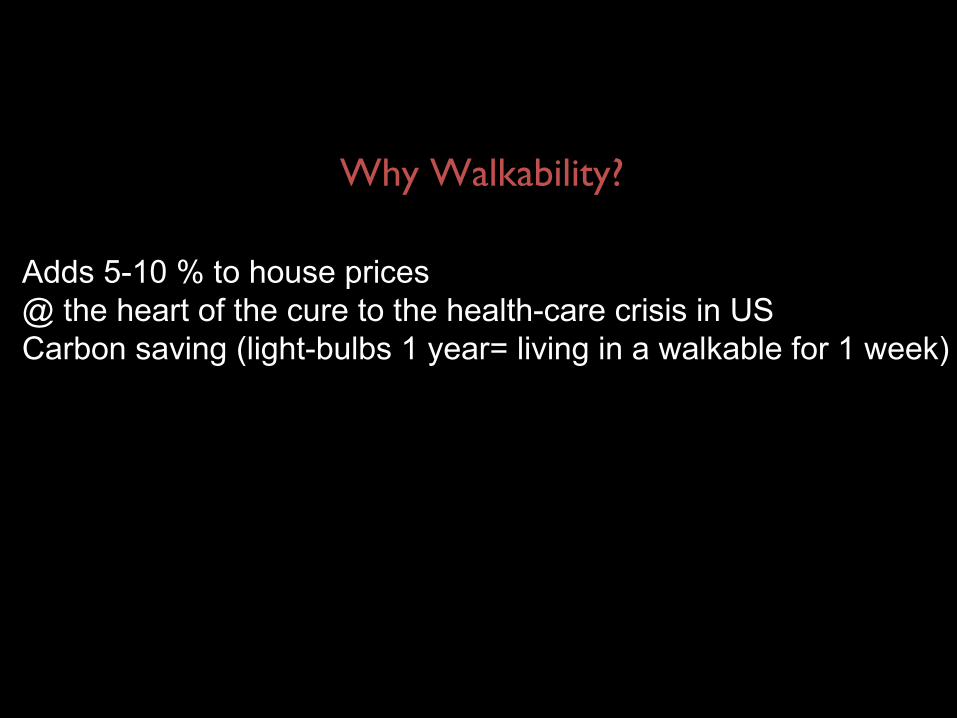
Why Walkability?
Adds 5-10 % to house prices @ the heart of the cure to the health-care crisis in US Carbon saving (light-bulbs 1 year= living in a walkable for 1 week) neighborhood in 1 week)

Public space surrendered to cars ...

The commuting Paradox
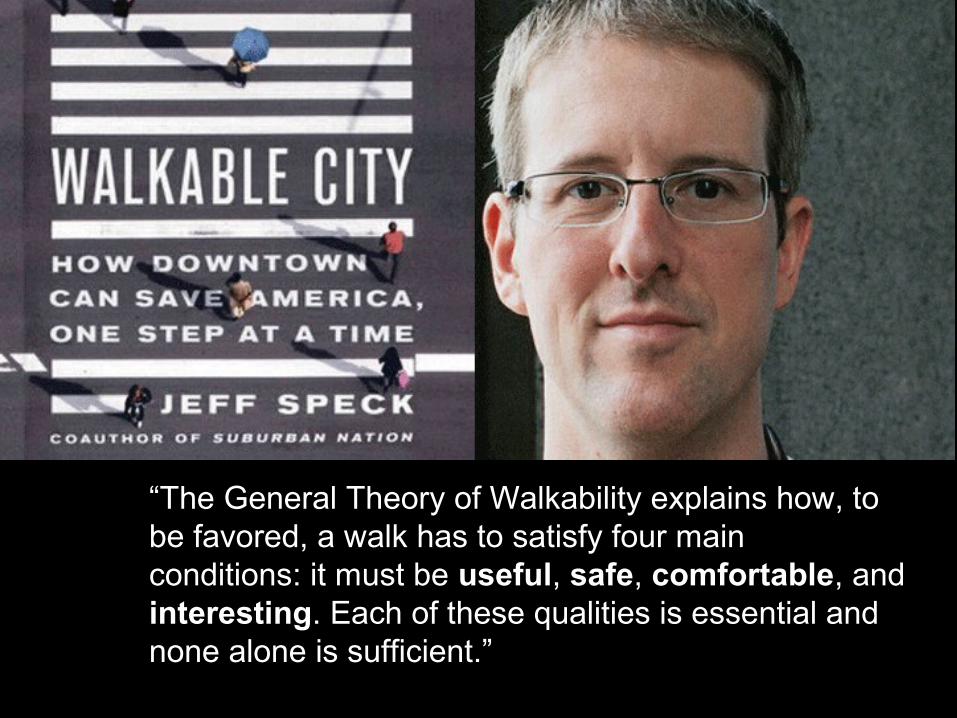
“The General Theory of Walkability explains how, to be favored, a walk has to satisfy four main conditions: it must be useful, safe, comfortable, and interesting. Each of these qualities is essential and none alone is sufficient.”
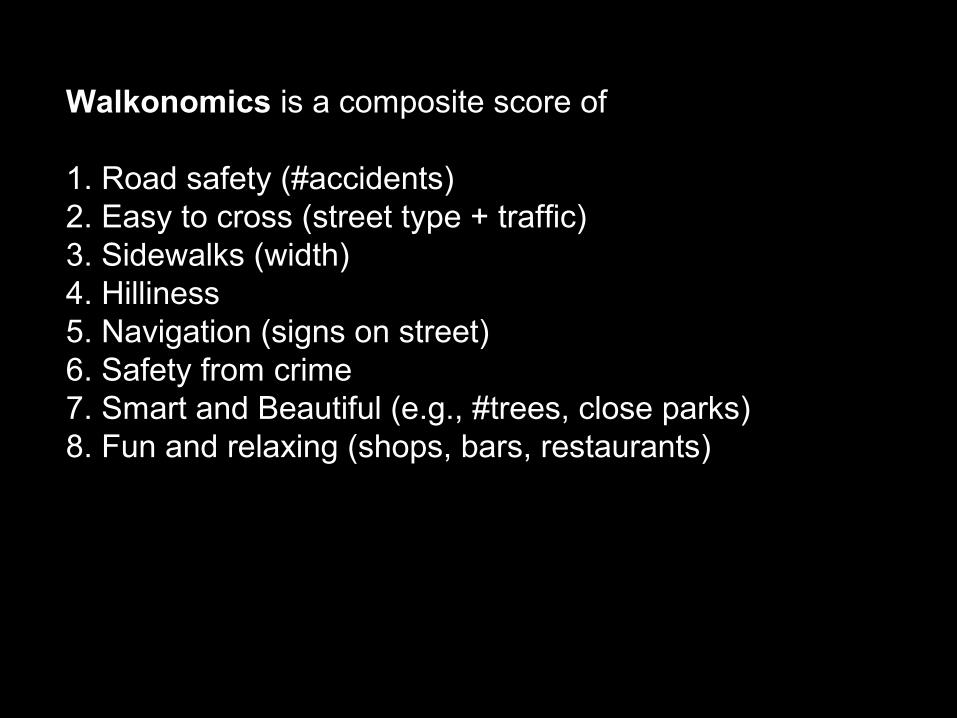
Walkonomics is a composite score of
1. Road safety (#accidents)2. Easy to cross (street type + traffic)3. Sidewalks (width)4. Hilliness5. Navigation (signs on street)6. Safety from crime7. Smart and Beautiful (e.g., #trees, close parks)8. Fun and relaxing (shops, bars, restaurants)
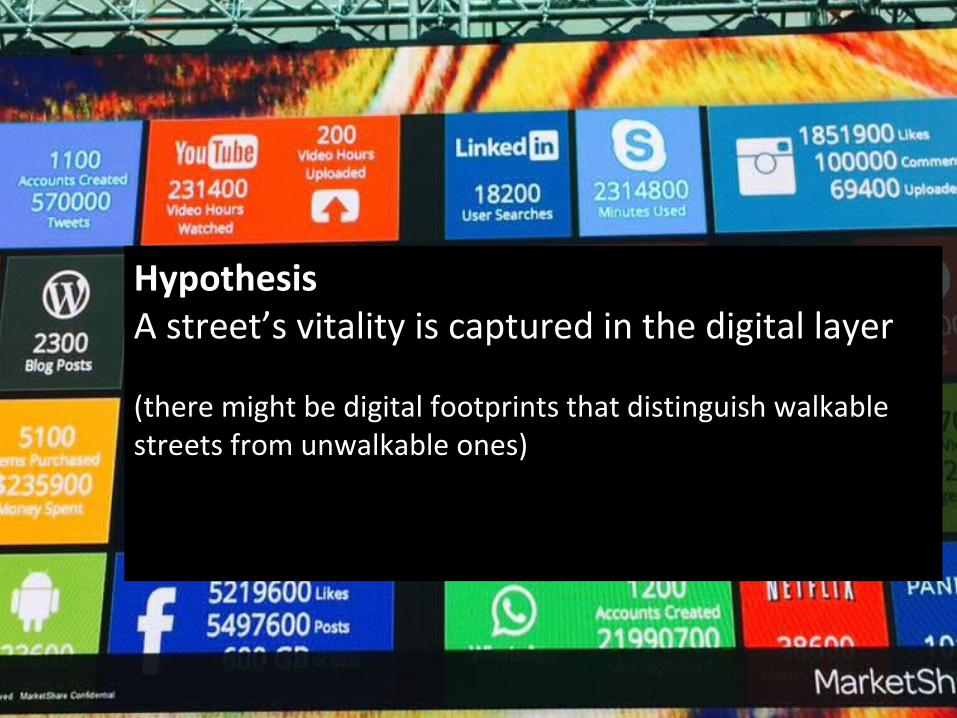
HypothesisA street’s vitality is captured in the digital layer
(there might be digital footprints that distinguish walkable streets from unwalkable ones)

Method
1. Theoretically derive hypotheses concerning walkability2. Test them3. If supported, then “valid” scores
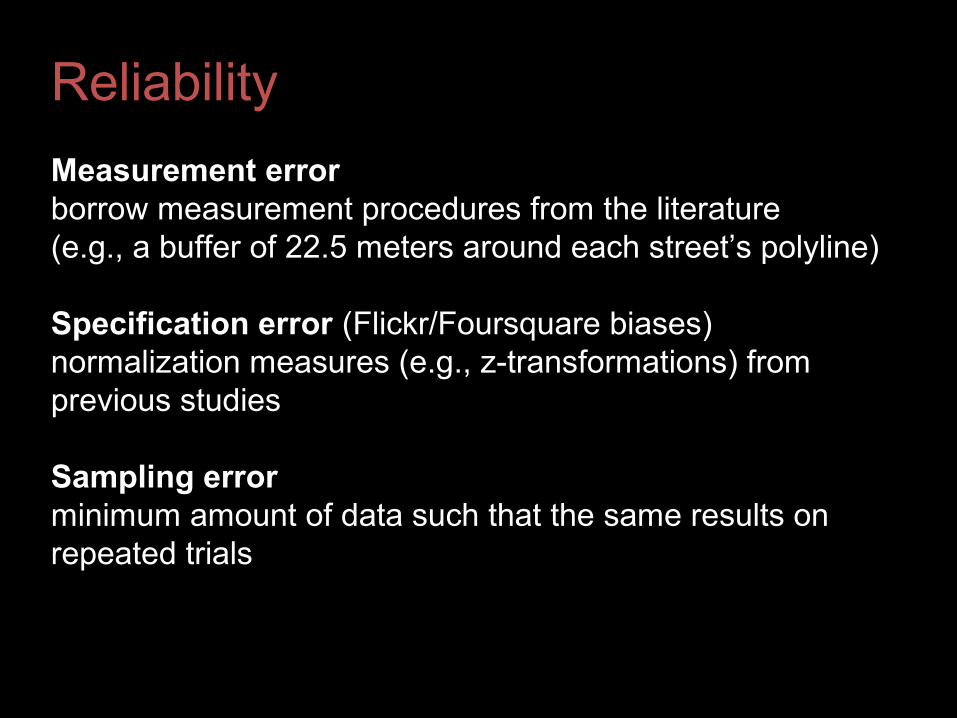
Reliability
Measurement error borrow measurement procedures from the literature (e.g., a buffer of 22.5 meters around each street’s polyline)
Specification error (Flickr/Foursquare biases) normalization measures (e.g., z-transformations) from previous studies
Sampling errorminimum amount of data such that the same results on repeated trials

Time of Day

Jane Jacobs
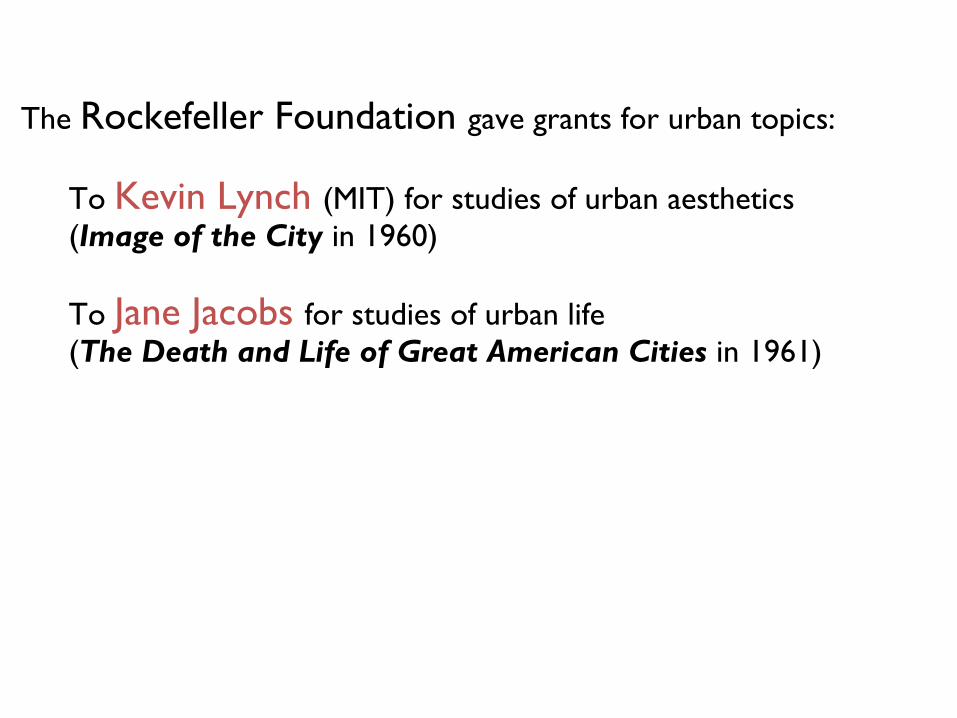
The Rockefeller Foundation gave grants for urban topics:
To Kevin Lynch (MIT) for studies of urban aesthetics (Image of the City in 1960)
To Jane Jacobs for studies of urban life (The Death and Life of Great American Cities in 1961)
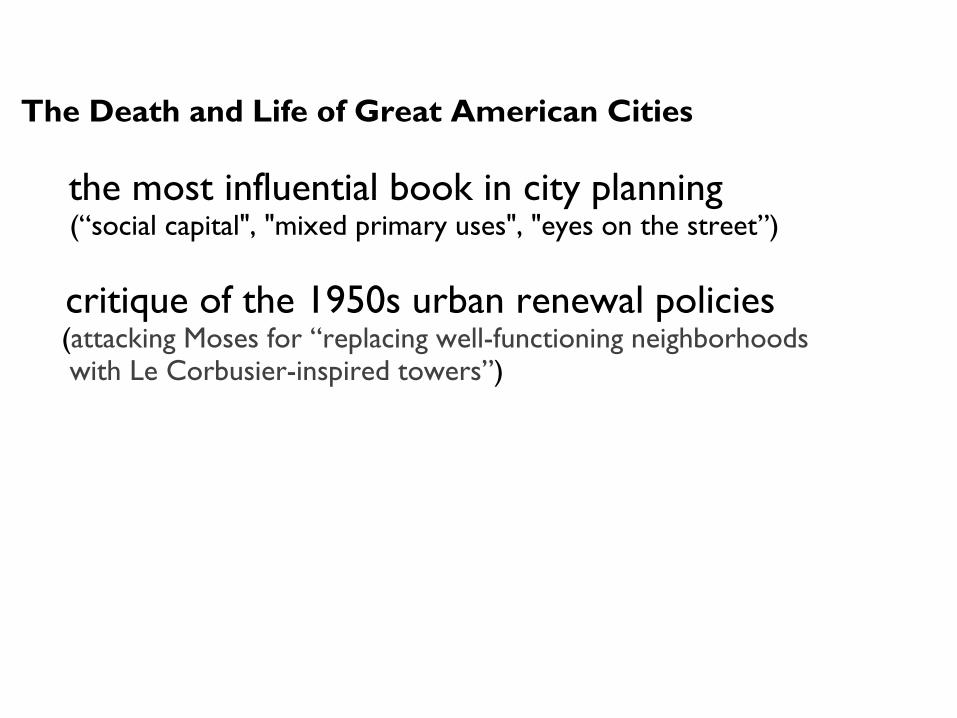
The Death and Life of Great American Cities
the most influential book in city planning (“social capital", "mixed primary uses", "eyes on the street”)
critique of the 1950s urban renewal policies (attacking Moses for “replacing well-functioning neighborhoods with Le Corbusier-inspired towers”)
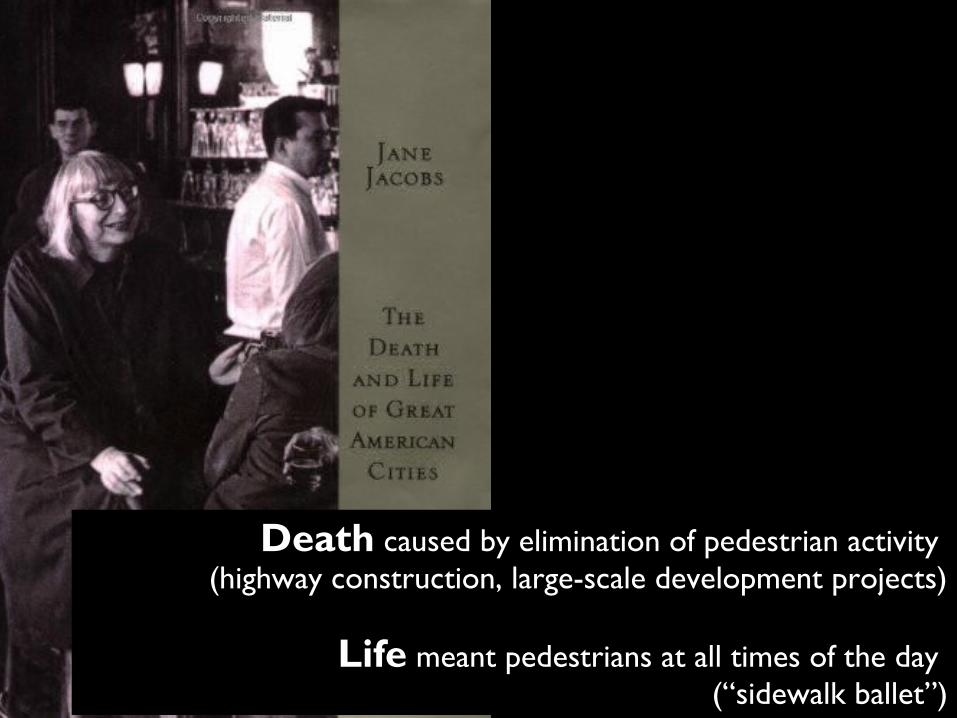
Death caused by elimination of pedestrian activity (highway construction, large-scale development projects)
Life meant pedestrians at all times of the day (“sidewalk ballet”)
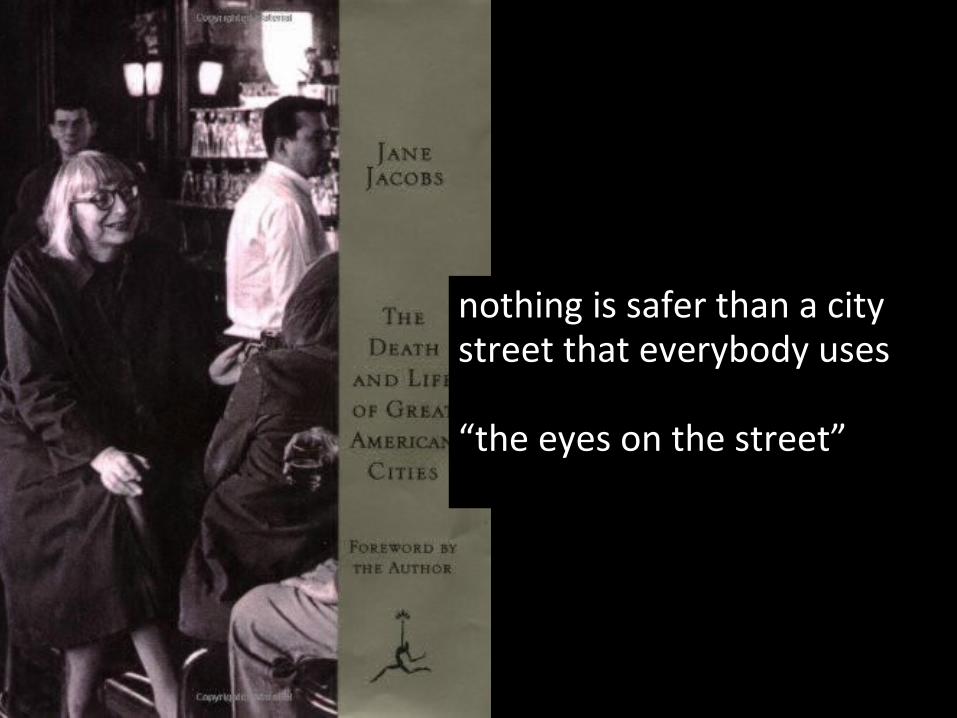
nothing is safer than a city street that everybody uses
“the eyes on the street”
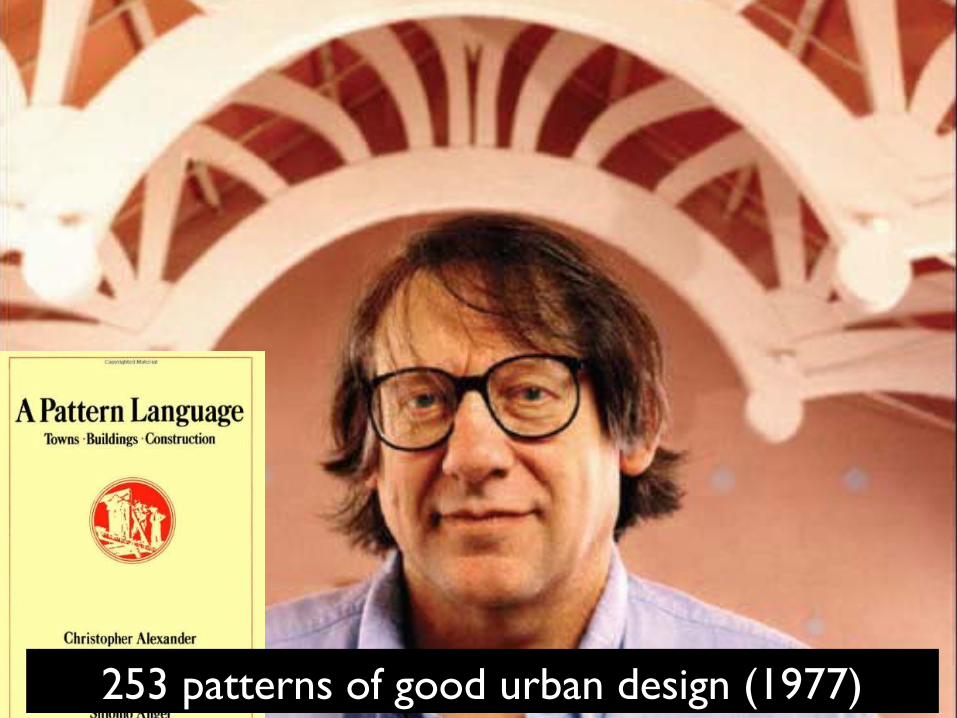
253 patterns of good urban design (1977)
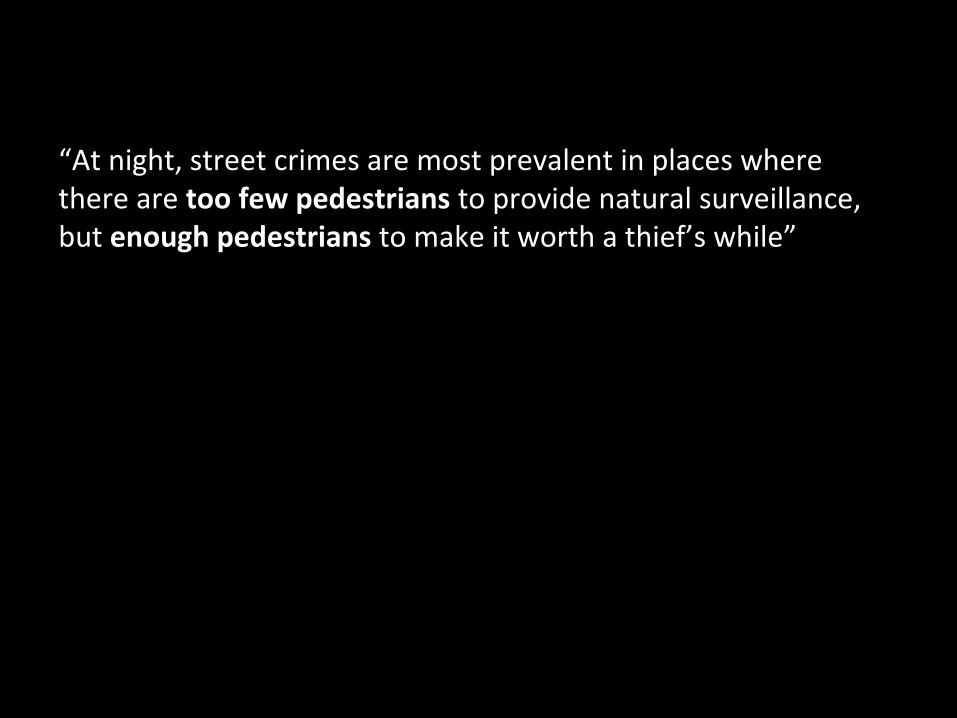
“At night, street crimes are most prevalent in places where there are too few pedestrians to provide natural surveillance, but enough pedestrians to make it worth a thief’s while”
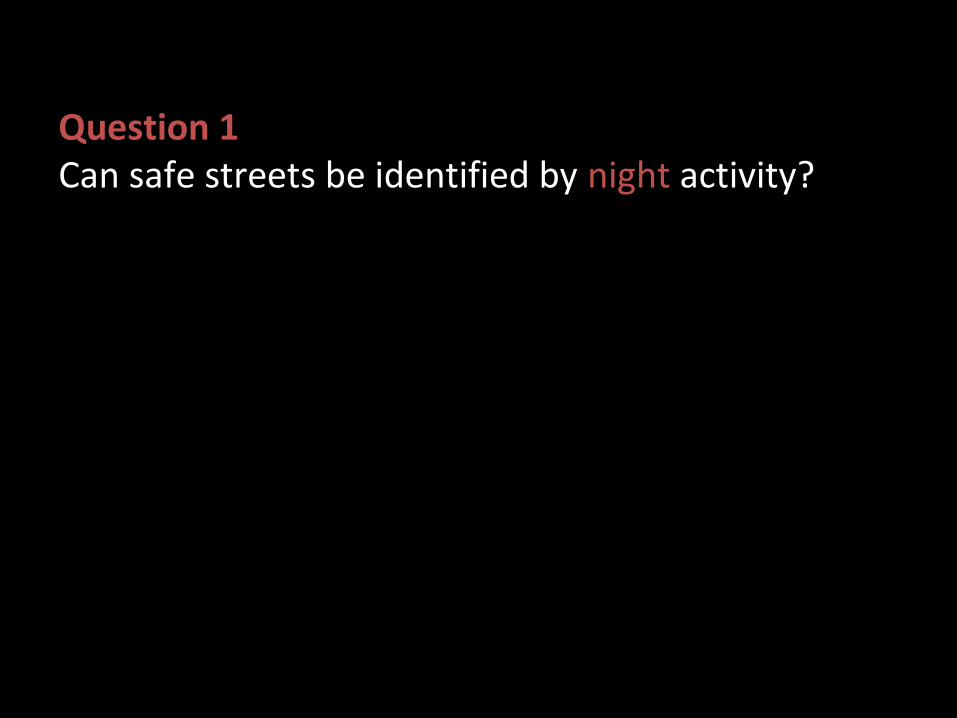
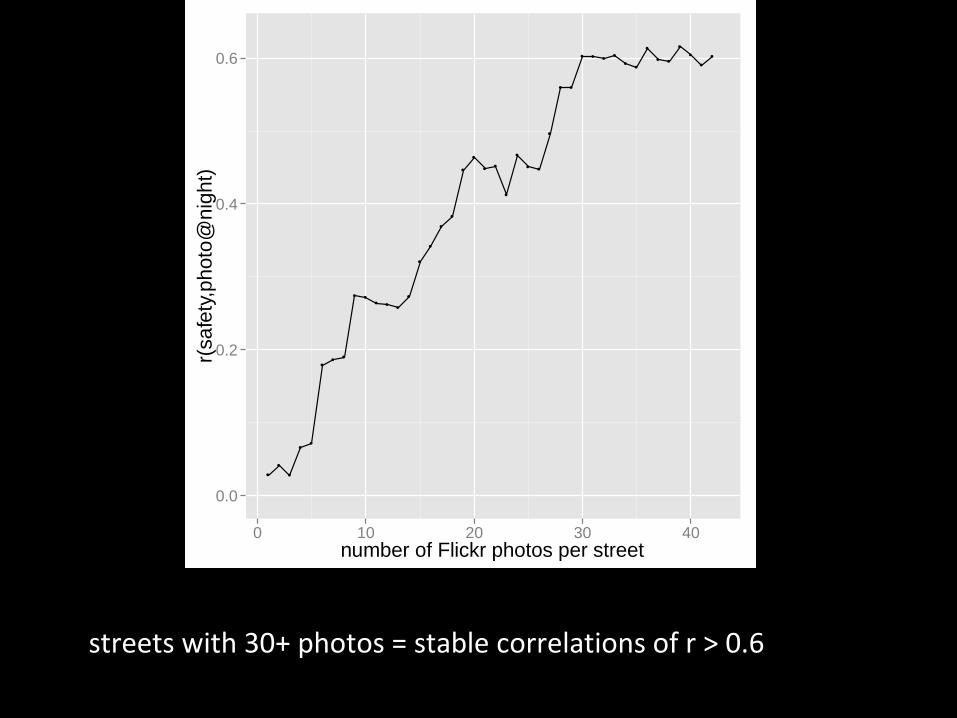
Question 1Can safe streets be identified by night activity?
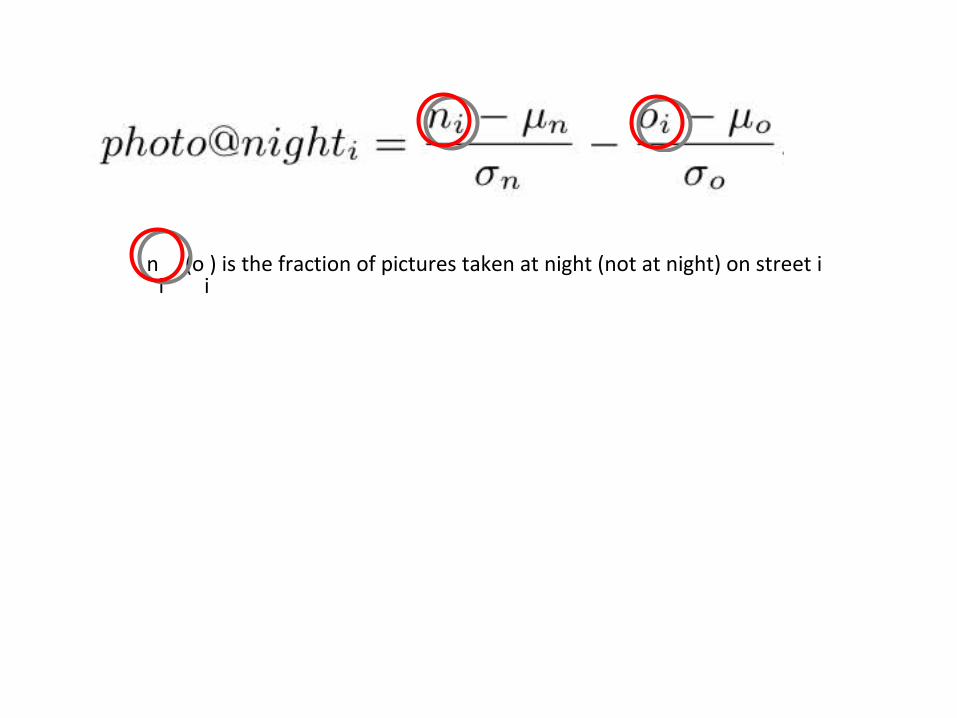
ni
(oi) is the fraction of pictures taken at night (not at night) on street i

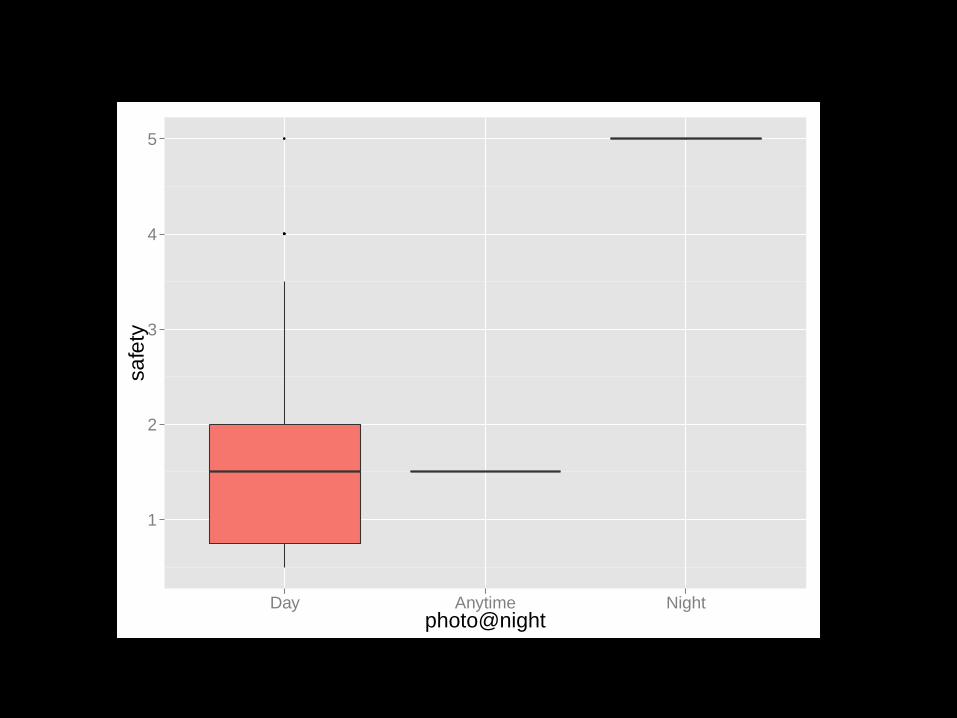
r(safe,night)= 0.60safe street tend to be visited at night as well
●●●
●
1
2
3
4
5
Day Anytime Nightphoto@night
safe
ty
●●●
● ●
●● ●
● ●● ● ●
●
●
●
●●
●
●
● ●
●
●
● ●
●
● ●
● ● ● ●● ●
●
● ●
●●●●
0.0
0.2
0.4
0.6
0 10 20 30 40number of Flickr photos per street
r(sa
fety
,pho
to@
nigh
t)
streets with 30+ photos = stable correlations of r > 0.6

What about making “it worth a thief’s while”?
unsafe ones are used by men only OR unsafe streets used by women
Question 2Can safe streets be identified by gender or age?
0
100
200
300
0.0 2.5 5.0 7.5log(male)
0
100
200
300
400
500
0.0 2.5 5.0 7.5log(female)
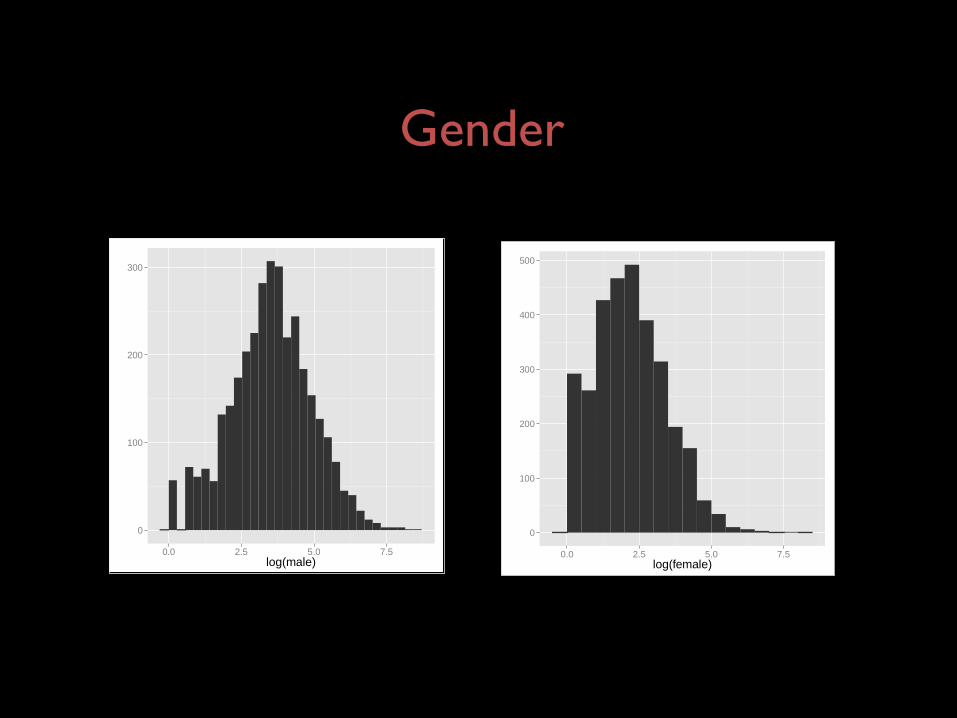
Gender
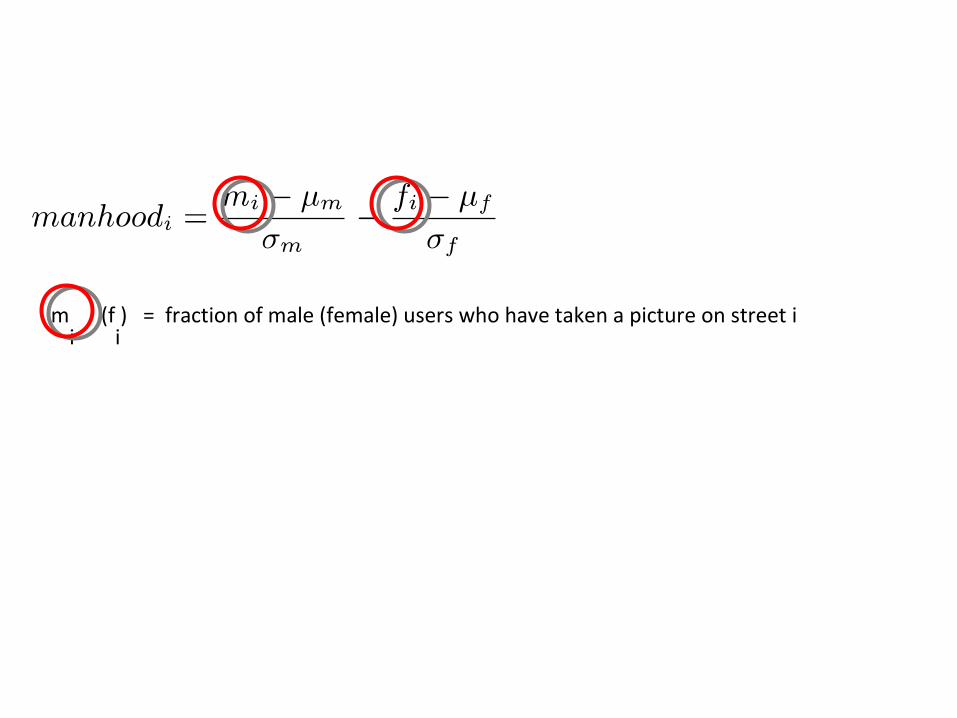
mi
(fi) = fraction of male (female) users who have taken a picture on street i
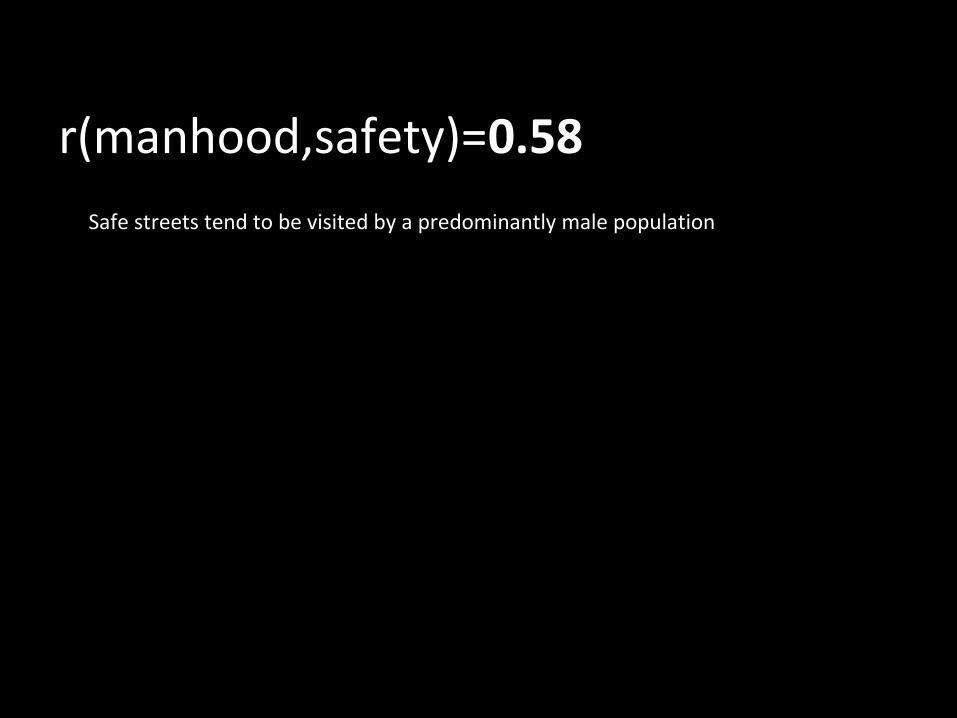
r(manhood,safety)=0.58Safe streets tend to be visited by a predominantly male population
●●
1
2
3
4
5
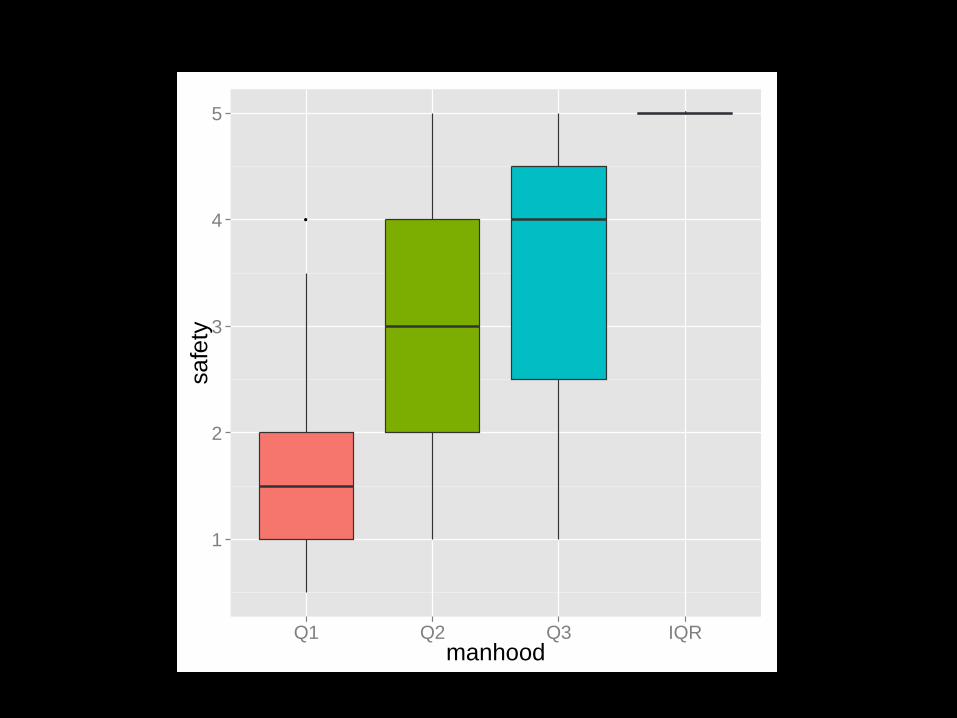
Q1 Q2 Q3 IQRmanhood
safe
ty
●
●
●
●●●
●
●● ●
●
●●●
●● ●
●●
●●●●
● ● ●
● ● ●●●
● ●
●
●●
●●
● ● ●● ●
● ● ●
●●
●●● ●
●●● ●
●
0.0
0.2
0.4
0.6
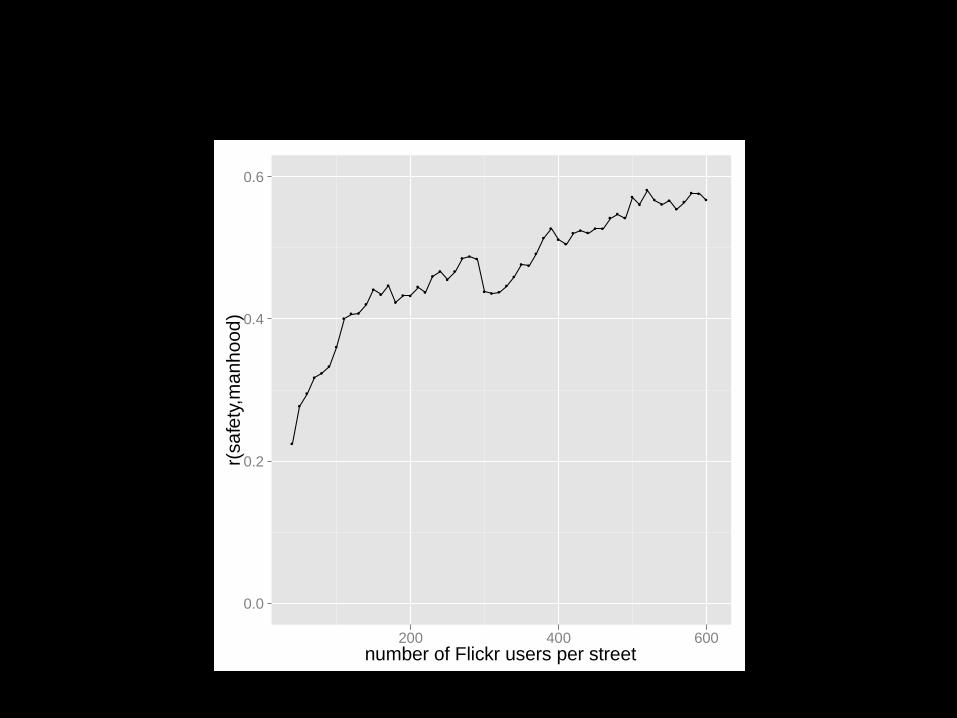
200 400 600number of Flickr users per street
r(sa
fety
,man
hood
)
0
200
400
600
800
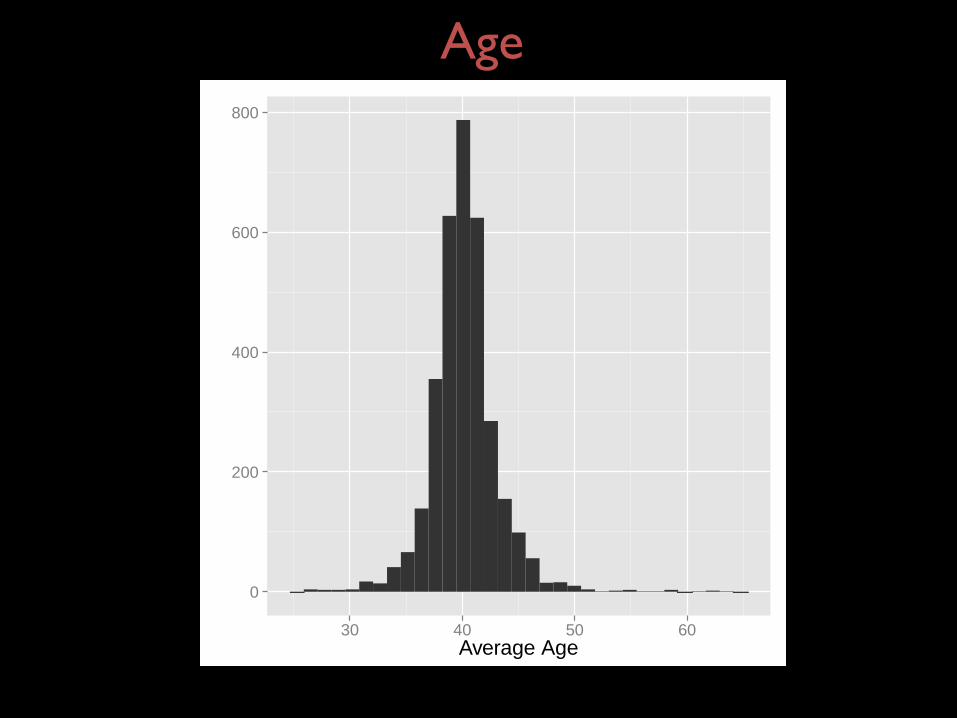
30 40 50 60Average Age
Age
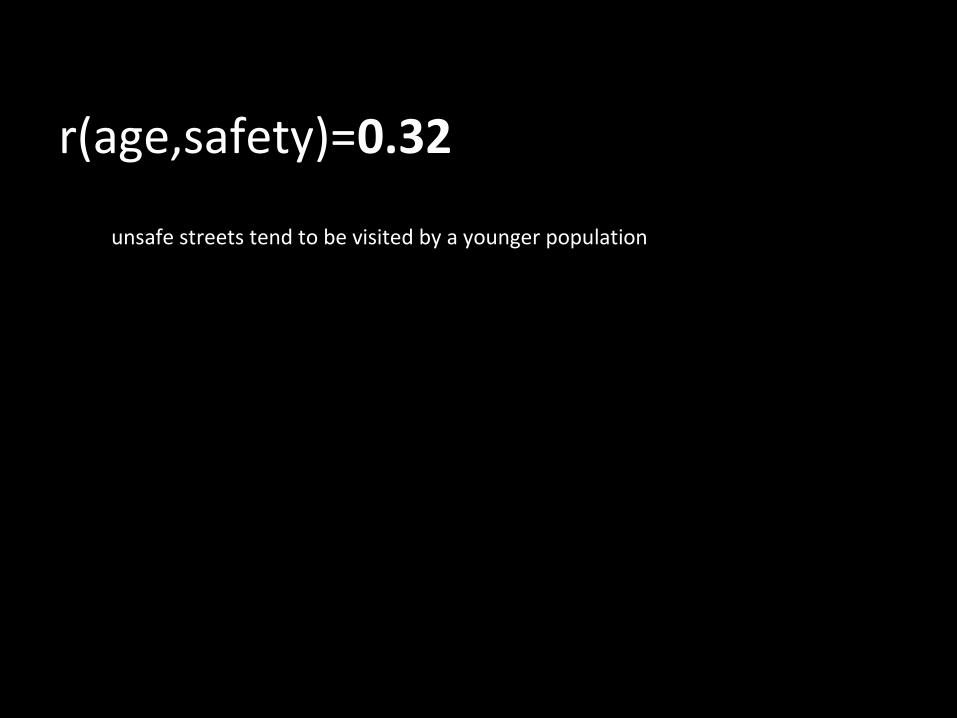
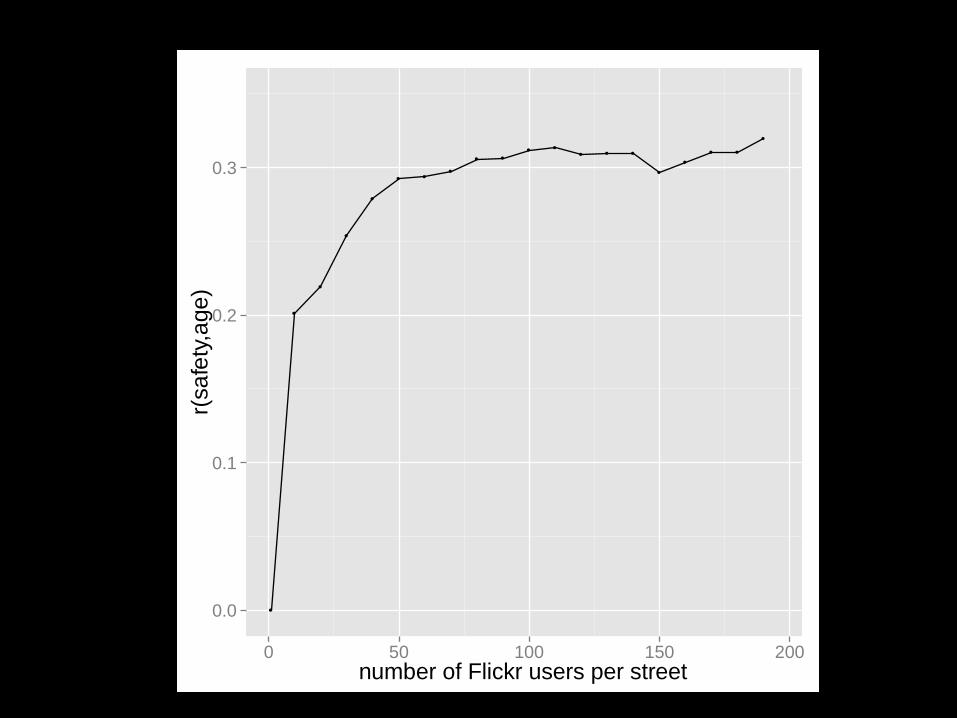
r(age,safety)=0.32
unsafe streets tend to be visited by a younger population
●
●
●
●
●
● ●●
● ●● ●
● ● ●
●●
● ●
●
0.0
0.1
0.2
0.3
0 50 100 150 200number of Flickr users per street
r(sa
fety
,age
)

Crime prevention through environmental design
The physical environment can be designed or manipulated to reduce fear of crime (by supporting certain activities over others)
Questions 3 & 4Can safe (walkable) streets be identified by the presence of specific types of places?
●●●
●
1
2
3
4
5
Day Anytime Nightphoto@night
safe
ty
(a) Average street safety for street segments grouped by theirphoto@night scores in three bins. Safety increases for streetsthat are increasingly photographed at night. Whiskers represent the2n d and 98t h percentiles.
●●●
● ●
●● ●
● ●● ● ●
●
●
●
●●
●
●
● ●
●
●
● ●
●
● ●
● ● ● ●● ●
●
● ●
●●●●
0.0
0.2
0.4
0.6
0 10 20 30 40number of Flickr photos per street
r(sa
fety
,pho
to@
nigh
t)
(b) Pearson correlation coefficient between streetsafety and photo@night as the number of photos oneach segment increases. Theshaded area indicates thenumber of photos per street segment after which thecorrelation becomesstable.
Figure 5: Thedigital life of safe streets: night activity. Safe streets tend to bephotographed at night aswell.
●●
1
2
3
4
5
Q1 Q2 Q3 IQRmanhood
safe
ty
(a) Average safety score for streetsegments grouped by whether theirmanhood scores are in the lowerquartile (Q1), second quartile (Q2),upper quartile (Q3), and interquartilerange (IQR). Whiskers represent the 2n d
and 98t h percentiles
●
●
●
●●●
●
●● ●
●
●●●
●● ●
●●
●●●●
● ● ●
● ● ●●●
● ●
●
●●
●●
● ● ●● ●
● ● ●
●●
●●● ●
●●● ●
●
0.0
0.2
0.4
0.6
200 400 600number of Flickr users per street
r(sa
fety
,man
hood
)
(b) Correlation coefficientr (safety, street’s manhood)for segments of differing number ofusers. The shaded area indicates thenumber of users per street segmentafter which thecorrelation becomesstable.
●
●
●
●
●
● ●●
● ●● ●
● ● ●
●●
● ●
●
0.0
0.1
0.2
0.3
0 50 100 150 200number of Flickr users per street
r(sa
fety
,age
)
(c) Correlation coefficientr (safety, dwellers’ average age)for segments of differing number of users.The shaded area indicates the number ofusers per street segment after which thecorrelation becomes stable.
Figure 6: Thedigital life of safe streets: gender and age. Safe streets tend to be increasingly photographed by men.
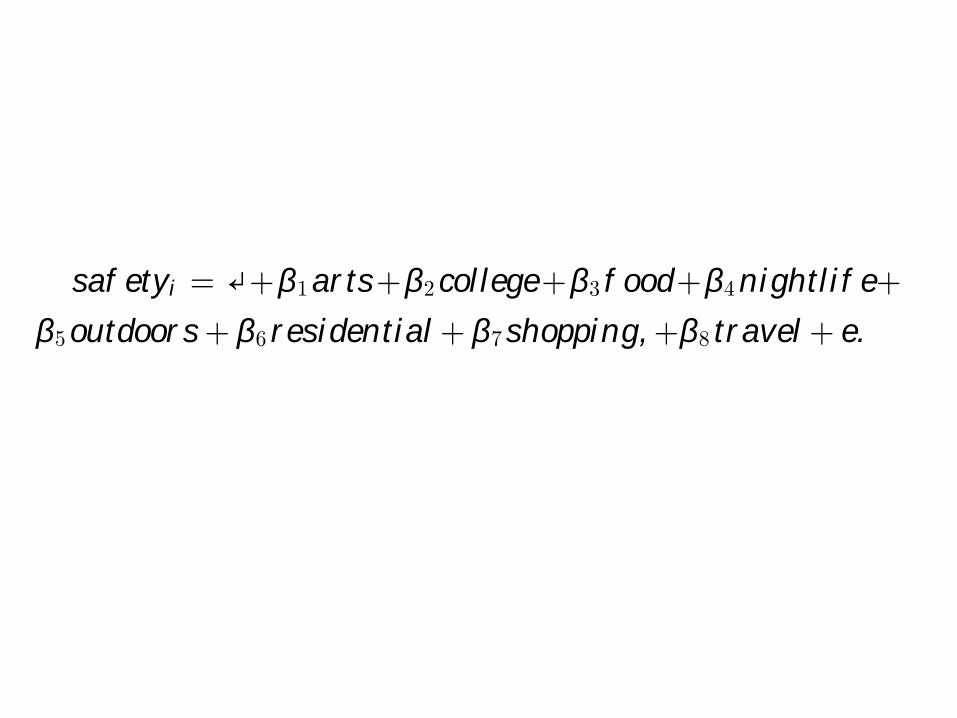
To test the extent to which safety is associated with the pres-enceof specific places, webuild a linear model that predicts safetyscores from the presence of first-level Foursquare categories. Thatis, astreet’spredicted safety score iscomputed from the fraction ofplaces on it that fall into thedifferent categories:
saf etyi = ↵+β1ar ts+β2col lege+β3 f ood+β4nightl i f e+
β5outdoor s+ β6 r esident ial + β7shopping,+β8 t r avel + e.
It turnsout that theregression showsanadjustedR2 of 74%, sug-gesting that safety can be accurately predicted only from the pres-
ence of Foursquare venues. The corresponding beta coefficients(Table 1, column 3) suggest that safe streets tend to be associatedwith outdoor places (mainly parks), while unsafe ones with resi-dential bits of central London that have no parks. This might ap-pear surprising at first. However, further investigation shows that,in Central London, well-to-do residential areas are often associ-ated with parks, whiledeprived areasarenot. Therefore, this resultcan be explained by a strong interaction effect between residentialstreets and parks.
6
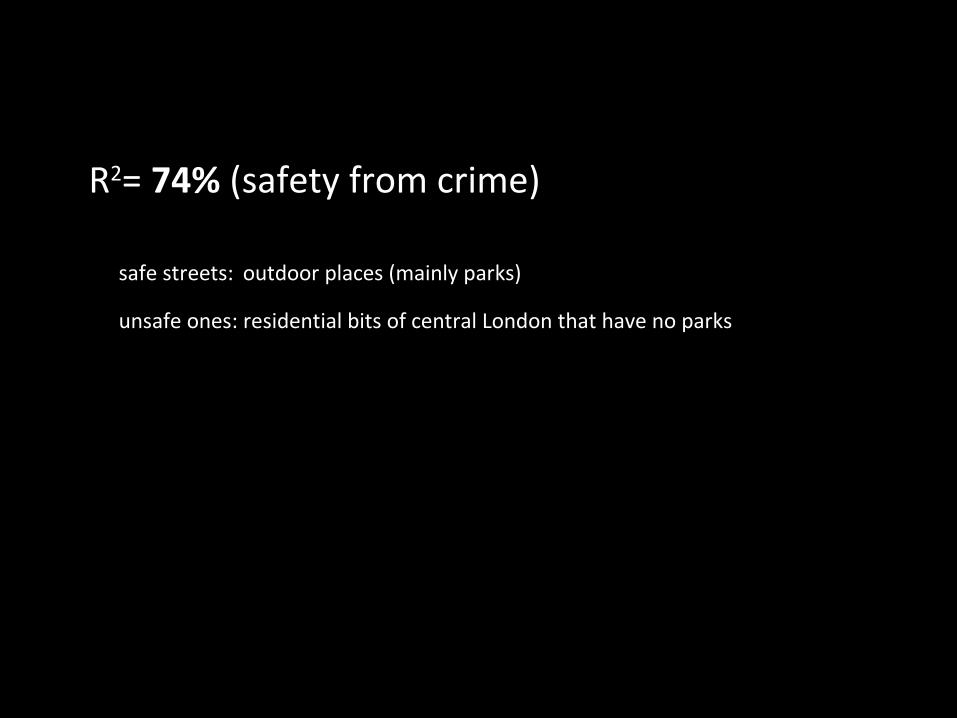
R2= 74% (safety from crime)
safe streets: outdoor places (mainly parks)
unsafe ones: residential bits of central London that have no parks

R2= 33% (walkability)
the presence of residential areas drives most of the predictive power of the regression

Text
we gather the literature on walkability to produce a list of walkability-related keywords
Line-by-line coding1.Collecting documents2.Annotating them3.Validating them
Question 5Can walkable streets be identified by walkability-related tags?
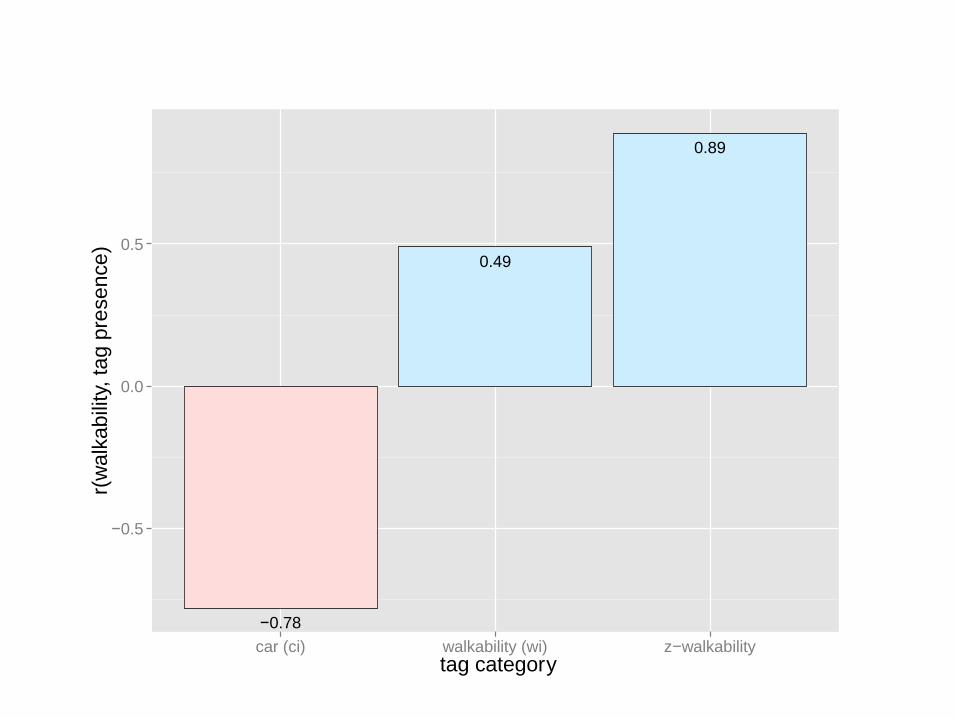
0.49
0.78−
0.89
0.5−
0.0
0.5
car (ci) walkability (wi) z w− alkability tag category
r(w
alka
bilit
y, ta
g pr
esen
ce)
●
●
0.2
0.4
0.6
0.8
1.0
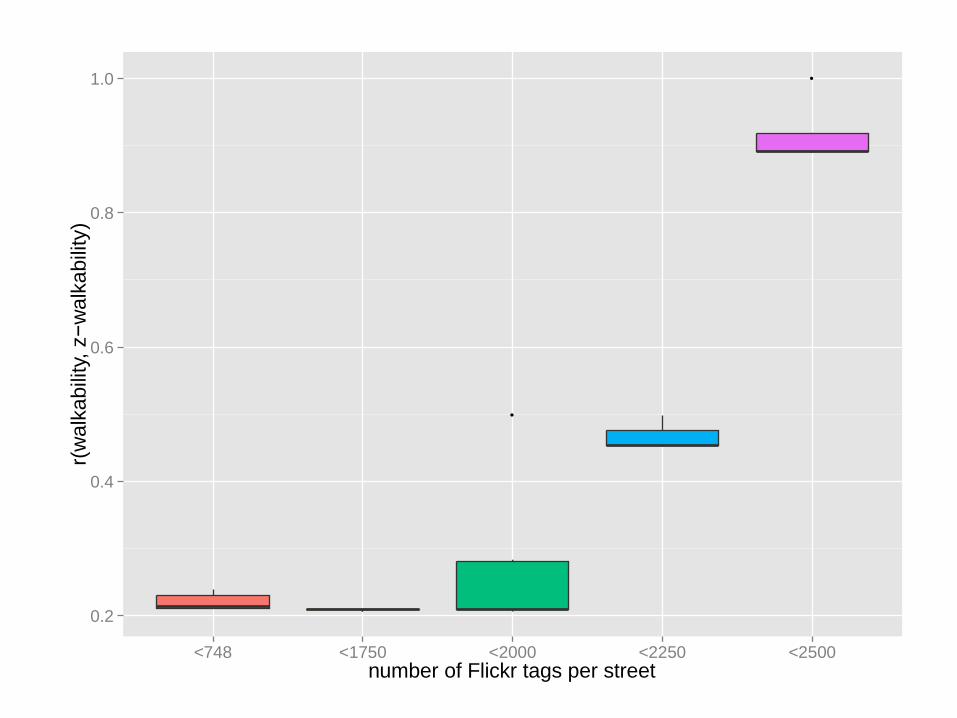
<748 <1750 <2000 <2250 <2500number of Flickr tags per street
r(w
alka
bilit
y, z−w
alka
bilit
y)
To sum up...
Picture uploads from dwellers of walkable streets differ from those of unwalkable ones, mainly in terms of upload time and tagging *
* limited data vs. high penetration
Theoretical Implication Social media = Opportunities for Theory
Comforted by our validation work, urban researchers might well be enticed to use social media to answer theoretical questions that could not have been tackled before because of lack of data
Practical Implications
Room bookingUrban route recommendationsReal-estate
LimitationIt doesn’t work where there is little activity(yet absence/presence of venues work)

Happy MapsThe Digital Life of Walkable Streets

Smelly MapsThe Digital Life of Urban Smellscapes

Humans Can Discriminate More than 1 Trillion Olfactory StimuliScience, March 2014
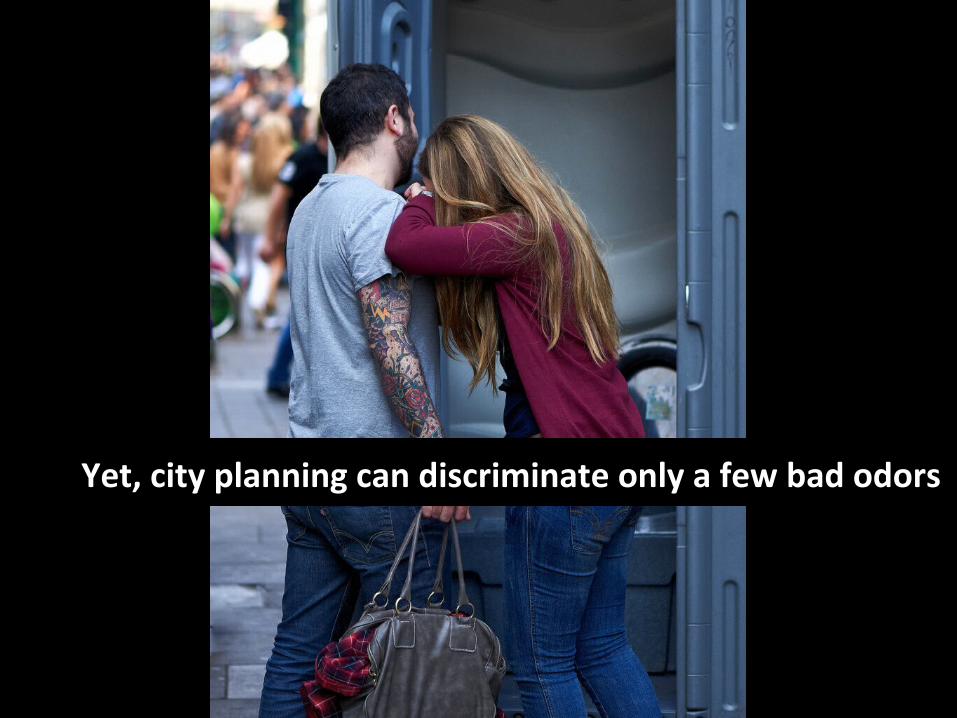
Yet, city planning can discriminate only a few bad odors
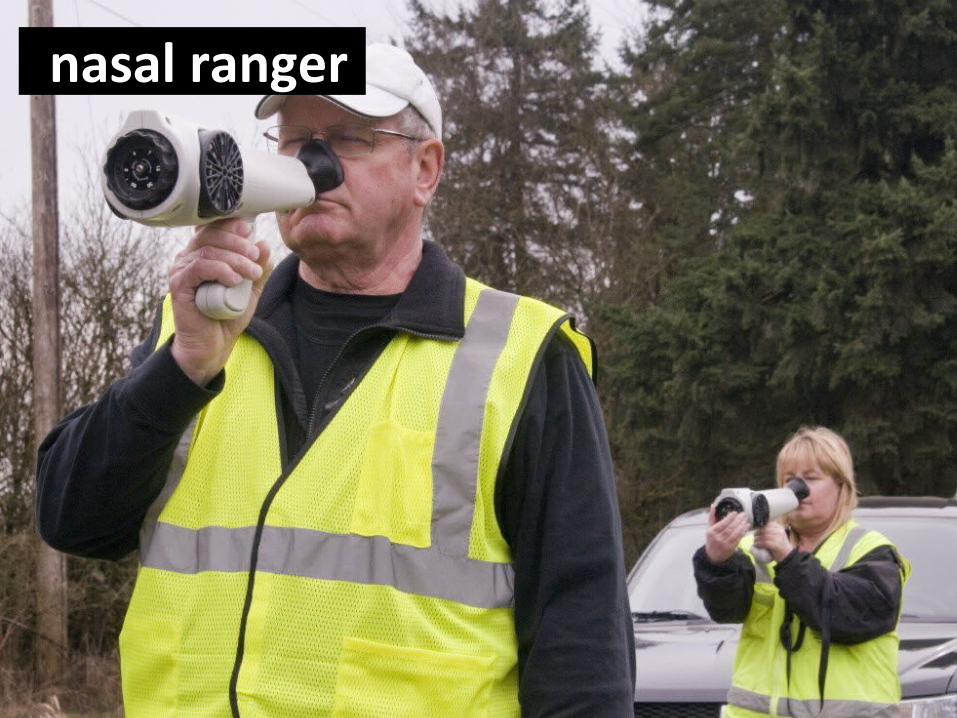
nasal ranger
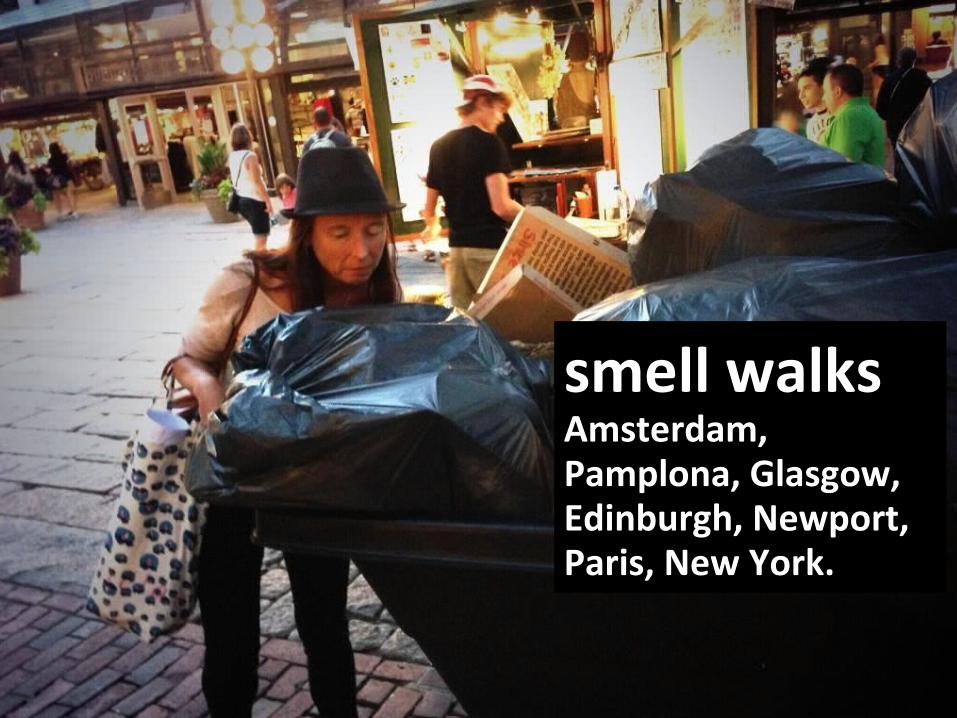
smell walksAmsterdam, Pamplona, Glasgow, Edinburgh, Newport, Paris, New York.
Good classification
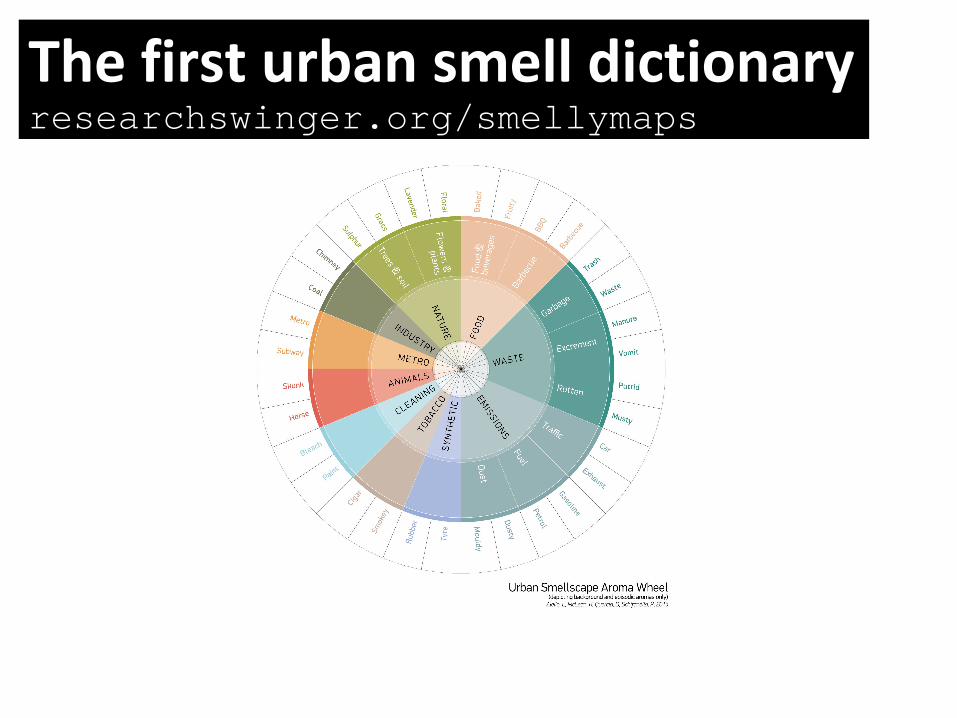
The first urban smell dictionaryresearchswinger.org/smellymaps
Happy MapsThe Digital Life of Walkable Streets
Smelly MapsThe Digital Life of Urban Smellscapes

Chatty MapsThe Digital Life of Urban Soundscapes


The Digital Life of Walkable Streets
The Digital Life of Walkable Streets @danielequercia @rschifan @lajello @walkonomics