Embed Size (px)
Citation preview

The Social Disruption Index
A Joint Program of W2O Group and The Social Starts Fund

How Technology will help evaluate itself
• Patterns exist in how people embrace new concepts– We follow the same approaches to evaluate, invest and build over and over
• Markets reveal if they are ready for innovation– Innovation can be ahead of market readiness, so it’s not just technology; it’s behavior
• Humans also create, follow patterns based on what they desire– We know what we want, act on it and show it via our data trails online
• Predictive models can now help identify innovative concepts, market niches and human change agents at an earlier stage. – We need to look around the next corner to find the new edge for opportunity

A new index can now be created to help us understand the significance of human behavior, technology advances and
investment decisions in the face of transformational change
The Social Disruption Index
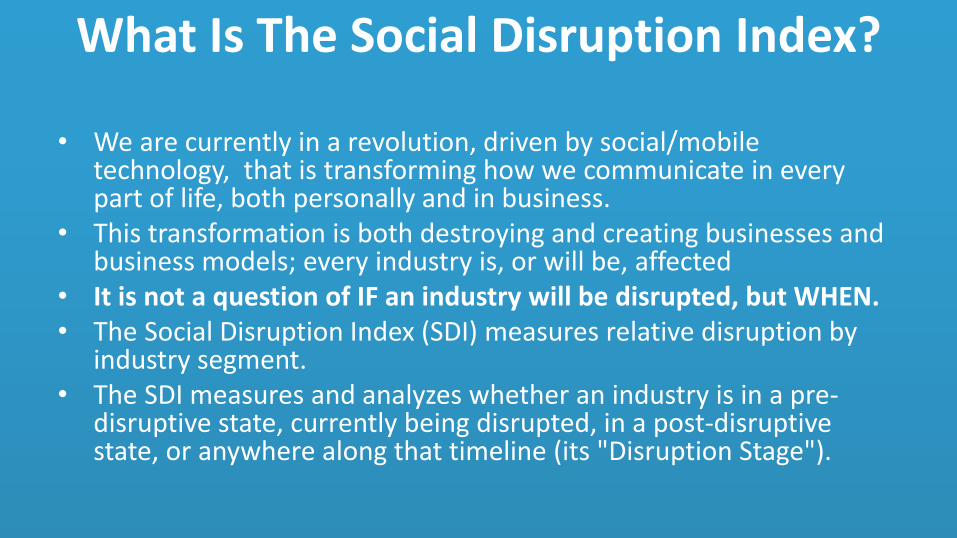
What Is The Social Disruption Index?
• We are currently in a revolution, driven by social/mobile technology, that is transforming how we communicate in every part of life, both personally and in business.
• This transformation is both destroying and creating businesses and business models; every industry is, or will be, affected
• It is not a question of IF an industry will be disrupted, but WHEN.• The Social Disruption Index (SDI) measures relative disruption by
industry segment. • The SDI measures and analyzes whether an industry is in a pre-
disruptive state, currently being disrupted, in a post-disruptive state, or anywhere along that timeline (its "Disruption Stage").

A simple model drawn from hundreds of attributes
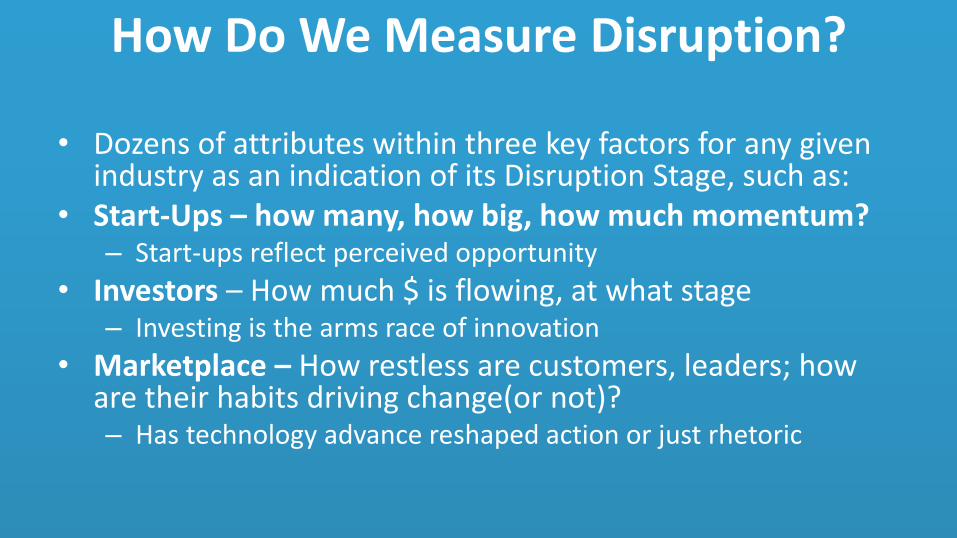
How Do We Measure Disruption?
• Dozens of attributes within three key factors for any given industry as an indication of its Disruption Stage, such as:
• Start-Ups – how many, how big, how much momentum?– Start-ups reflect perceived opportunity
• Investors – How much $ is flowing, at what stage– Investing is the arms race of innovation
• Marketplace – How restless are customers, leaders; how are their habits driving change(or not)?– Has technology advance reshaped action or just rhetoric
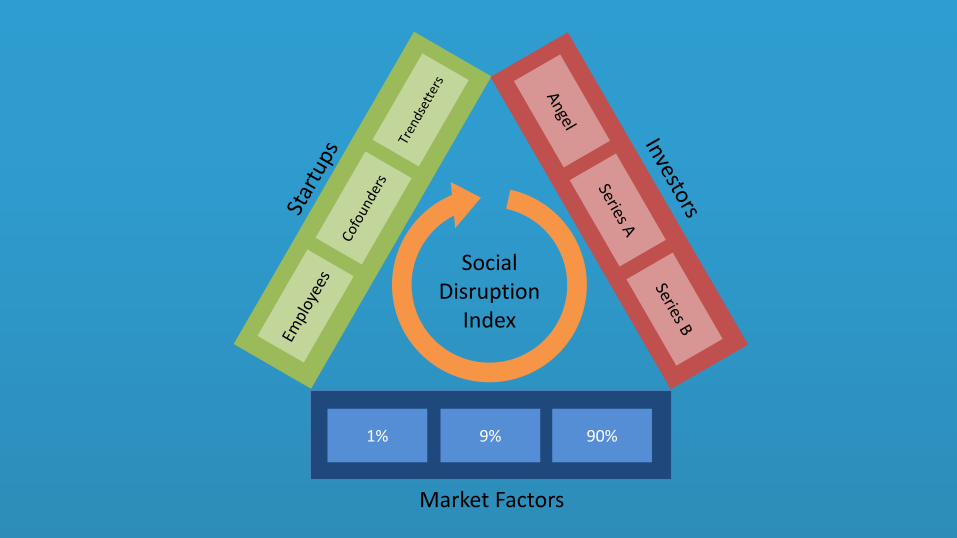
Market Factors
1% 9% 90%
SocialDisruption
Index
Understanding how consumer/customer behavior changes as a technology takes shape is critical to watch, learn and understand
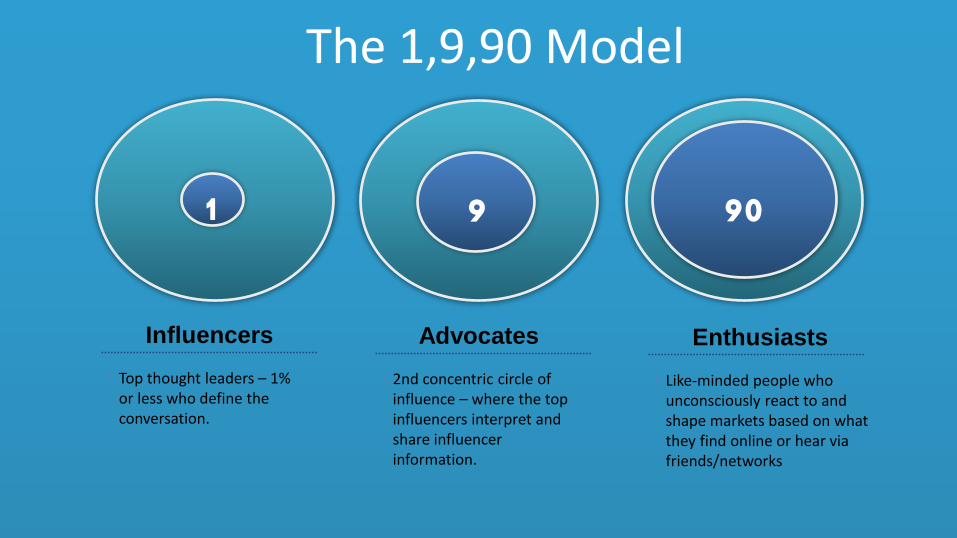
The 1,9,90 Model
1 9 90
Influencers
• Top thought leaders – 1% or less who define the conversation.
Advocates
• 2nd concentric circle of influence – where the top influencers interpret and share influencer information.
Enthusiasts
• Like-minded people who unconsciously react to and shape markets based on what they find online or hear via friends/networks

We will also look at the elasticity of innovation
Markets are not all equal in response to technological disruption

What Factors Enable or Stall Disruption?
• All enterprises and industries pressured by the new connections among people and how information is disseminated
• Some sectors naturally more prone to disruption than others. • The SDI will analyze multiple factors, some of which accelerate
while others stall disruption, including:– Presence of new start-ups / delta of venture investment– Commodity vs. specialized nature of products or services– Relevance of higher information velocity – Legal and regulatory framework and barriers

A Visual Representation of Change
Business Model Human Resources Industry Turnover
Status of Disruption
NewEntrants
CommodityServices
InfoVelocity
Facilitating / Dampening Factors
Legal/Regulatory Overall Disruption Stage: 3 (Early)

Can Also Measure Start Up Potential
• Openness to disruption vs. number of start-ups
• Best opportunity space: high disruption/few start-ups
• Worst opportunity space: regulatory issues, many contenders
• Can’t measure individual start-up success, but can measure comparative market potential
• Where are start-ups most likely to penetrate next?
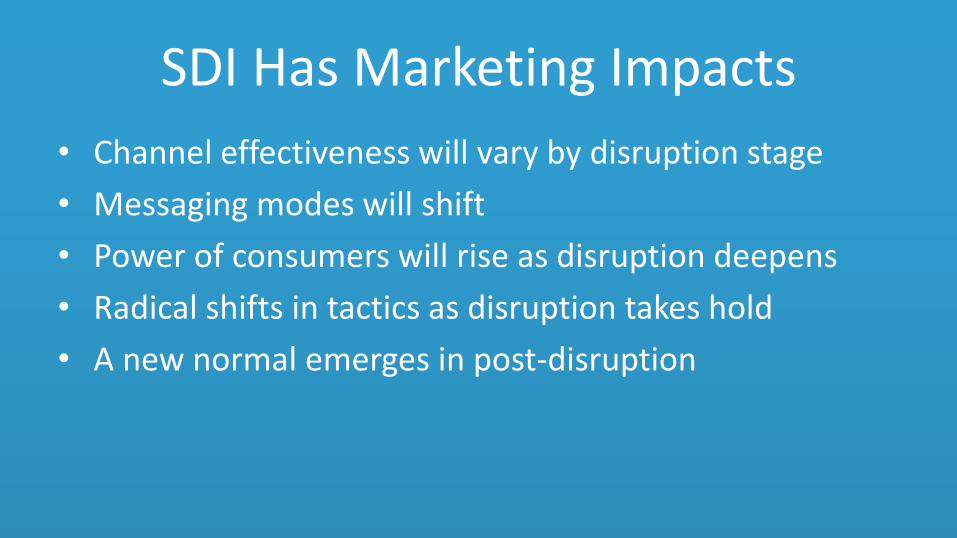
SDI Has Marketing Impacts
• Channel effectiveness will vary by disruption stage
• Messaging modes will shift
• Power of consumers will rise as disruption deepens
• Radical shifts in tactics as disruption takes hold
• A new normal emerges in post-disruption

Netflix Social Data vs. Actual Revenue Data
15
20,000 22,000 24,000 26,000 28,000 30,000 32,000 34,000 36,000 38,000
0100000020000003000000400000050000006000000700000080000009000000
10000000
Members vs. Predictive Variable
All Mentions Total members at end of period

Predicted vs. Actual Netflix Revenue Data
16
20,000
22,000
24,000
26,000
28,000
30,000
32,000
34,000
36,000
38,000
December31, 2012
March 31,2013
June 30,2013
September30, 2013
December31, 2013
March 31,2014
June 30,2014
Rev
enu
e
Actual Revenues Social Predicted Members Market Forecasts

Next Steps• We want your help!• Join us as early partners and see SDI before anyone else• Initial release by June 2015• Available to W2O clients & select investors• Summary data available to media• Post-release, 1 category deep dive each quarter• By end of 2015, release of broad quarterly cross-category
disruption index