Embed Size (px)
Citation preview

Houston Economy in 2016:Another Slow Year as Oil Prices
Find New LowsRobert W. Gilmer, Ph.D.
C.T. Bauer College of BusinessFebruary 2015
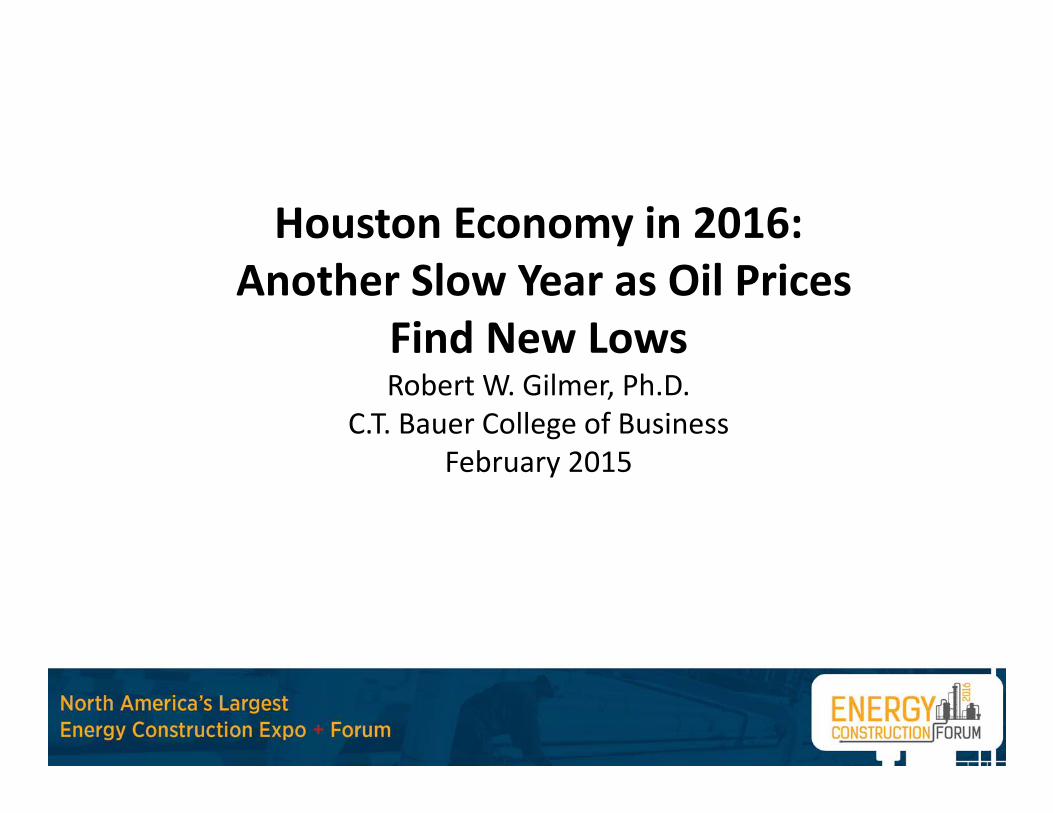
It Is All About Oil in Houston! Price Is Now Down By Over Half
$104
$59$51 $54
$60
43 4637
32 30
$20$30$40$50$60$70$80$90
$100$110$120
Spot Price of WTI in $/barrel
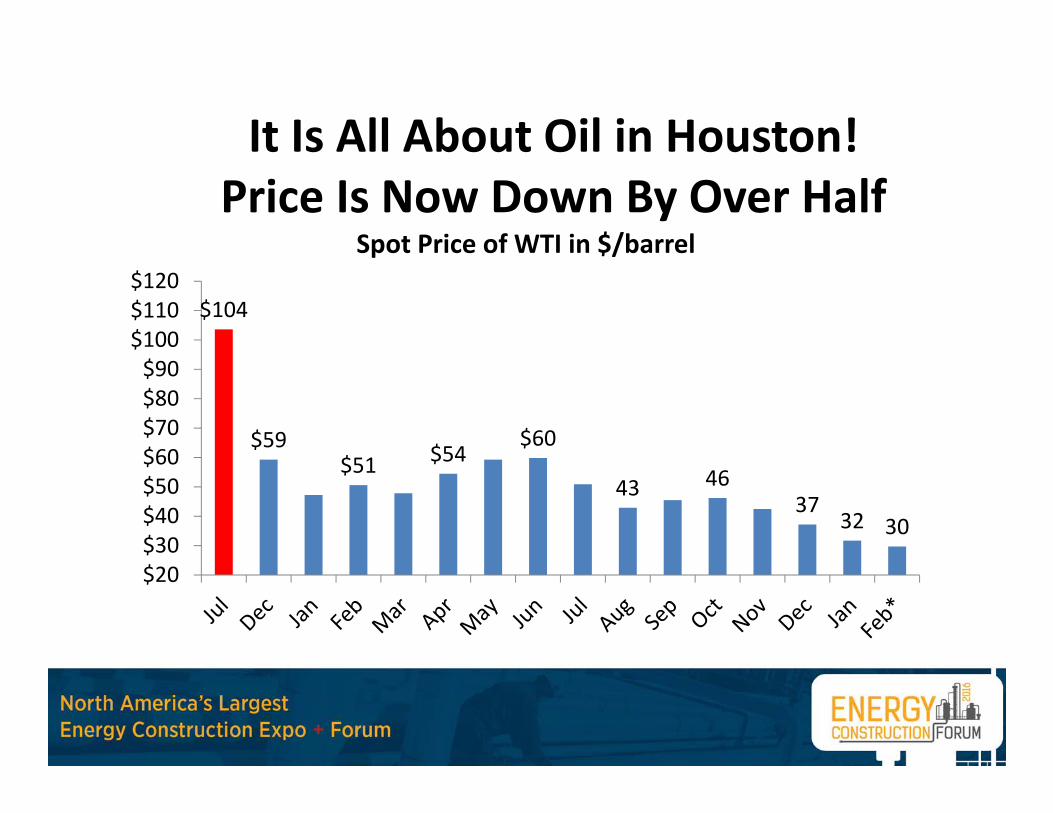
We Are Out of Good Options: Five Past and Present Scenarios
• Fracking Forever! ‐‐ Summer 2014• Maybe It Won’t Be So Bad? ‐‐ Early 2015• V‐Shaped Recovery – Summer 2015 & now off the table• U‐Shaped Recovery – 2016• Check‐Mark Recovery – Current favorite of big investment
houses• Fracking Defeated – Slow and partial recovery of rig count
from current levels of drilling
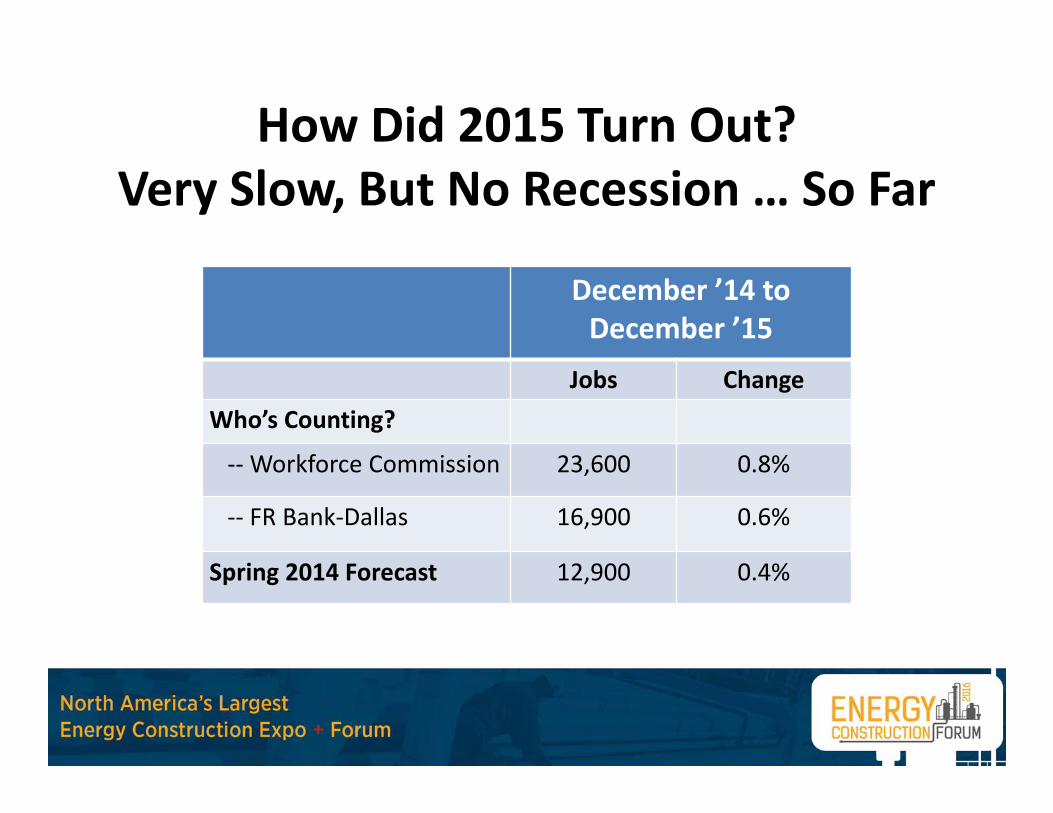
How Did 2015 Turn Out? Very Slow, But No Recession … So Far
December ’14 to December ’15
Jobs ChangeWho’s Counting?
‐‐Workforce Commission 23,600 0.8%
‐‐ FR Bank‐Dallas 16,900 0.6%
Spring 2014 Forecast 12,900 0.4%
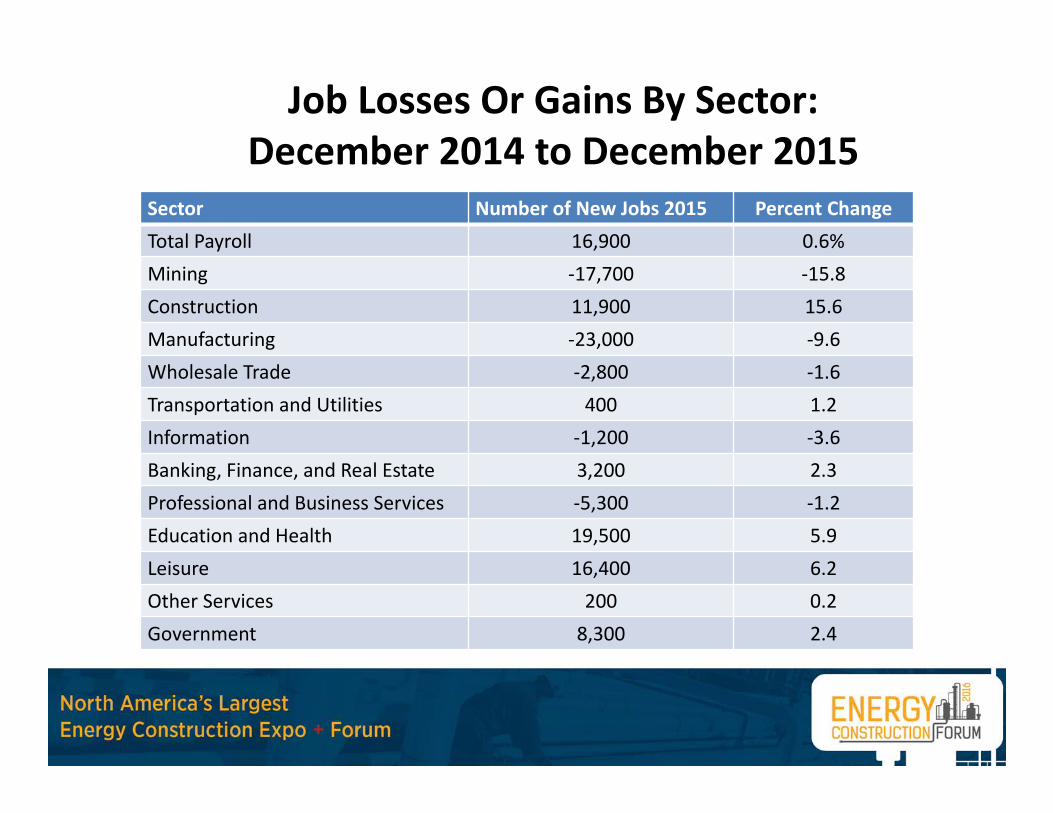
Job Losses Or Gains By Sector: December 2014 to December 2015
Sector Number of New Jobs 2015 Percent ChangeTotal Payroll 16,900 0.6%Mining ‐17,700 ‐15.8Construction 11,900 15.6Manufacturing ‐23,000 ‐9.6Wholesale Trade ‐2,800 ‐1.6Transportation and Utilities 400 1.2Information ‐1,200 ‐3.6Banking, Finance, and Real Estate 3,200 2.3Professional and Business Services ‐5,300 ‐1.2Education and Health 19,500 5.9Leisure 16,400 6.2Other Services 200 0.2Government 8,300 2.4
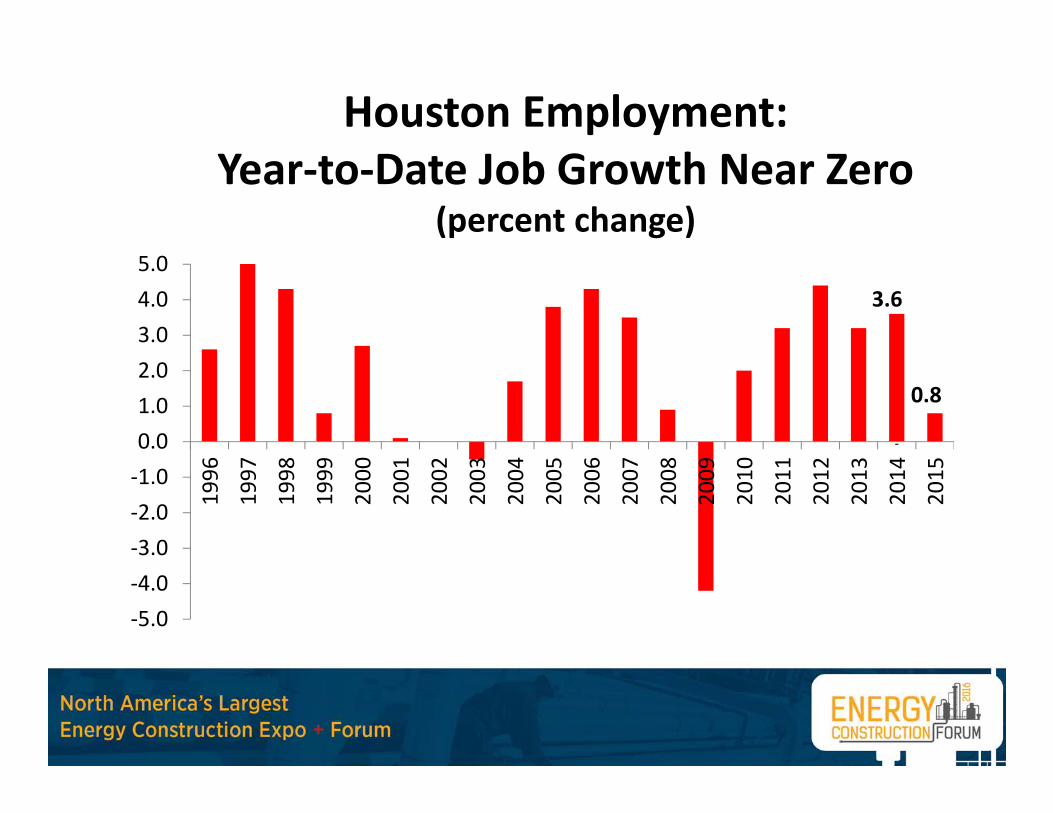
Houston Employment:Year‐to‐Date Job Growth Near Zero
(percent change)
‐5.0‐4.0‐3.0‐2.0‐1.00.01.02.03.04.05.0
1996
1997
1998
1999
2000
2001
2002
2003
2004
2005
2006
2007
2008
2009
2010
2011
2012
2013
2014
2015
3.6
0.8
‐
How Are You Feeling? • Many sectors of Houston have not felt much pain from this downturn
yet. What oil bust? • How can this be?
– Maybe they sell into strong national markets: United Airlines, Sysco, AIG, HP, …
– Maybe they live in East Houston– Maybe they are living off of past momentum. Houston Added 680,000 jobs
from 2004‐2024– Population stays strong for usually stays strong for several quarters after
job growth slows– Most damage has been confined to oil producers, oil services, and
manufacturing so far• BUT another slow year in Houston gives time for the slowdown to
spread to many sectors that have felt immune so far – healthcare, retail, restaurants, real estate, leisure, and government

Oil Markets and Oil Price
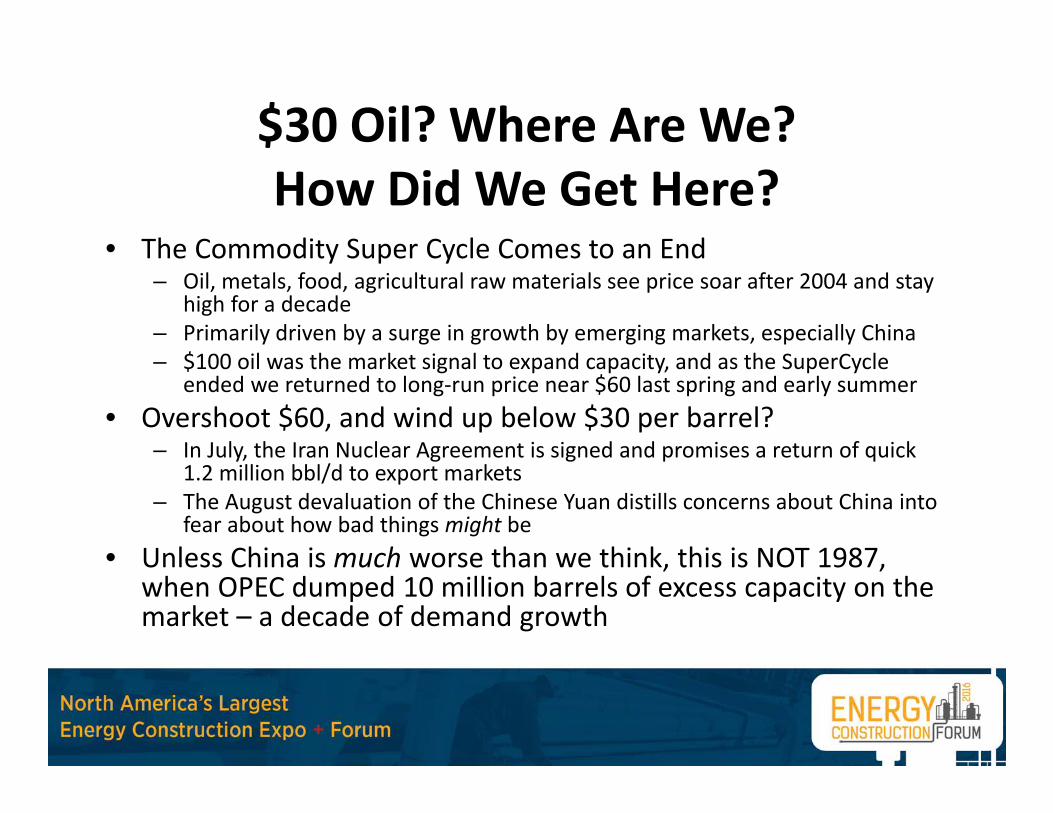
$30 Oil? Where Are We? How Did We Get Here?
• The Commodity Super Cycle Comes to an End– Oil, metals, food, agricultural raw materials see price soar after 2004 and stay
high for a decade– Primarily driven by a surge in growth by emerging markets, especially China– $100 oil was the market signal to expand capacity, and as the SuperCycle
ended we returned to long‐run price near $60 last spring and early summer• Overshoot $60, and wind up below $30 per barrel?
– In July, the Iran Nuclear Agreement is signed and promises a return of quick 1.2 million bbl/d to export markets
– The August devaluation of the Chinese Yuan distills concerns about China into fear about how bad things might be
• Unless China is much worse than we think, this is NOT 1987, when OPEC dumped 10 million barrels of excess capacity on the market – a decade of demand growth
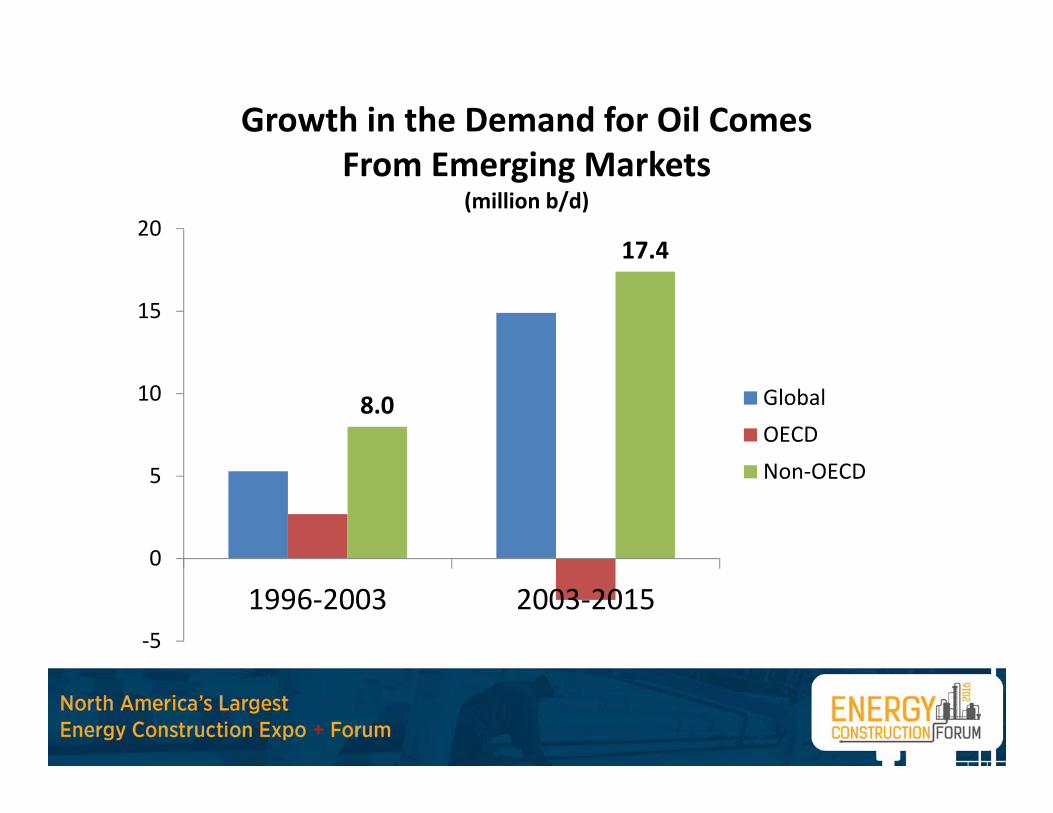
Growth in the Demand for Oil Comes From Emerging Markets
(million b/d)
8.0
17.4
‐5
0
5
10
15
20
1996‐2003 2003‐2015
GlobalOECDNon‐OECD
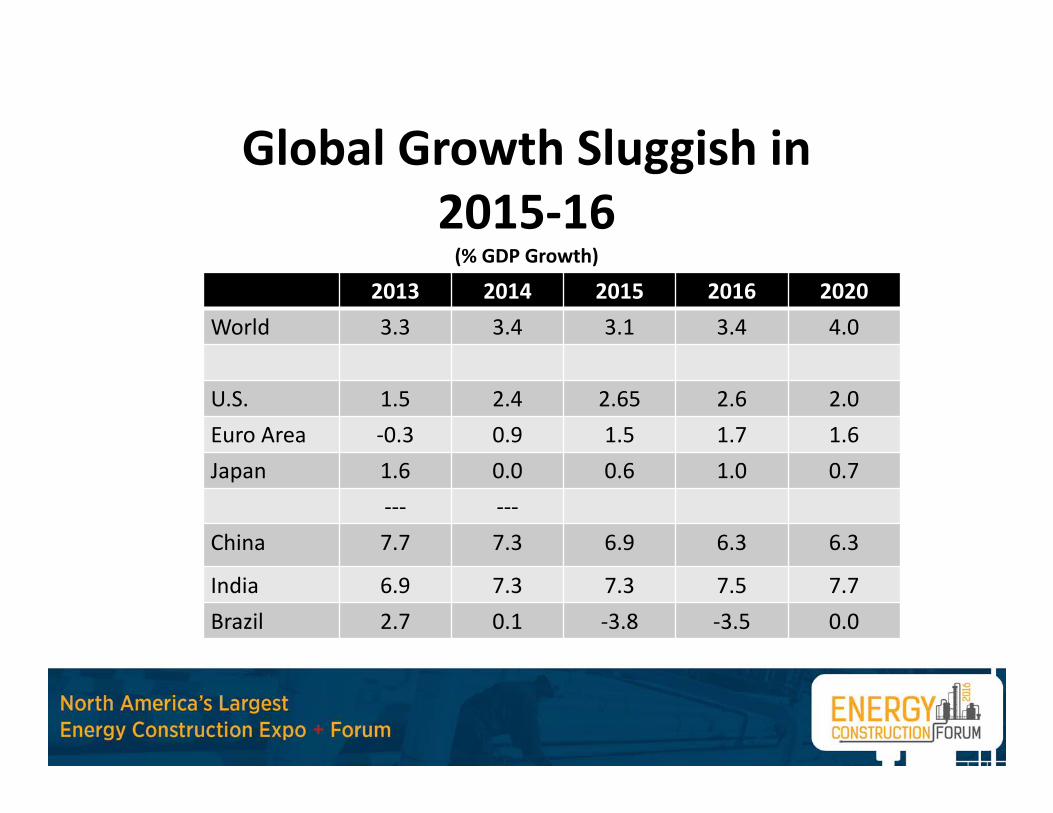
Global Growth Sluggish in 2015‐16(% GDP Growth)
2013 2014 2015 2016 2020World 3.3 3.4 3.1 3.4 4.0
U.S. 1.5 2.4 2.65 2.6 2.0Euro Area ‐0.3 0.9 1.5 1.7 1.6Japan 1.6 0.0 0.6 1.0 0.7
‐‐‐ ‐‐‐China 7.7 7.3 6.9 6.3 6.3
India 6.9 7.3 7.3 7.5 7.7Brazil 2.7 0.1 ‐3.8 ‐3.5 0.0
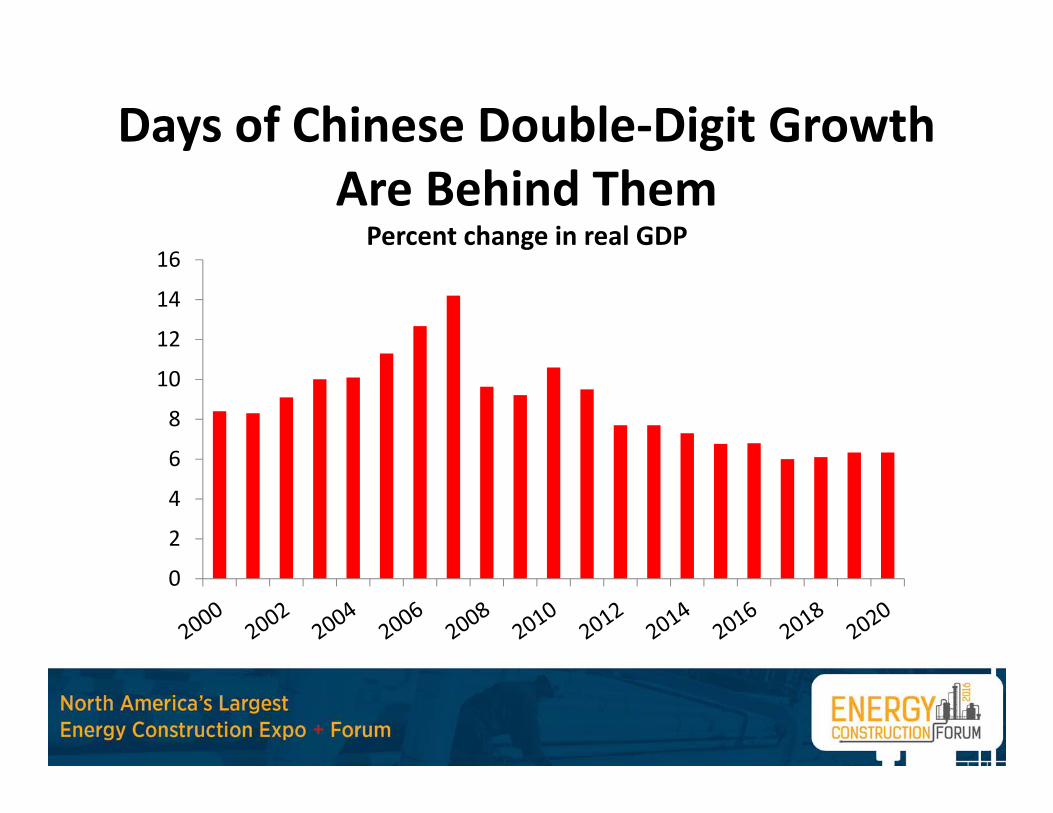
Days of Chinese Double‐Digit Growth Are Behind Them
0
2
4
6
8
10
12
14
16Percent change in real GDP
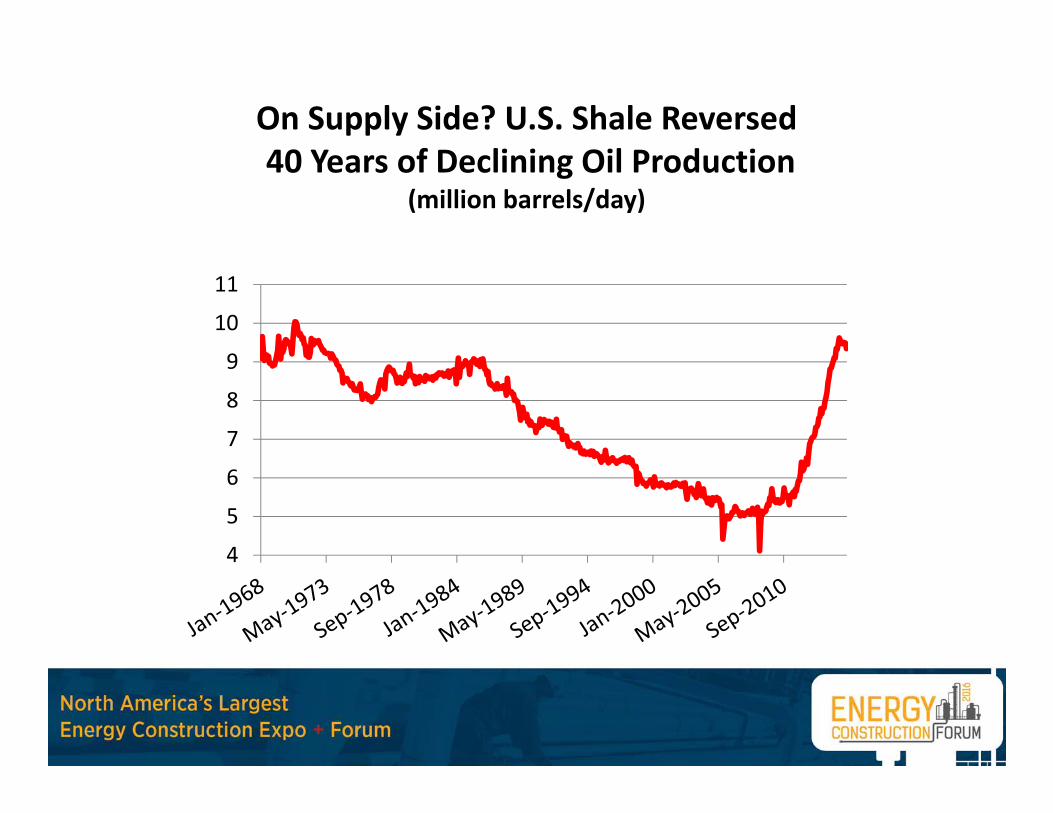
On Supply Side? U.S. Shale Reversed40 Years of Declining Oil Production
(million barrels/day)
4
5
6
7
8
9
10
11
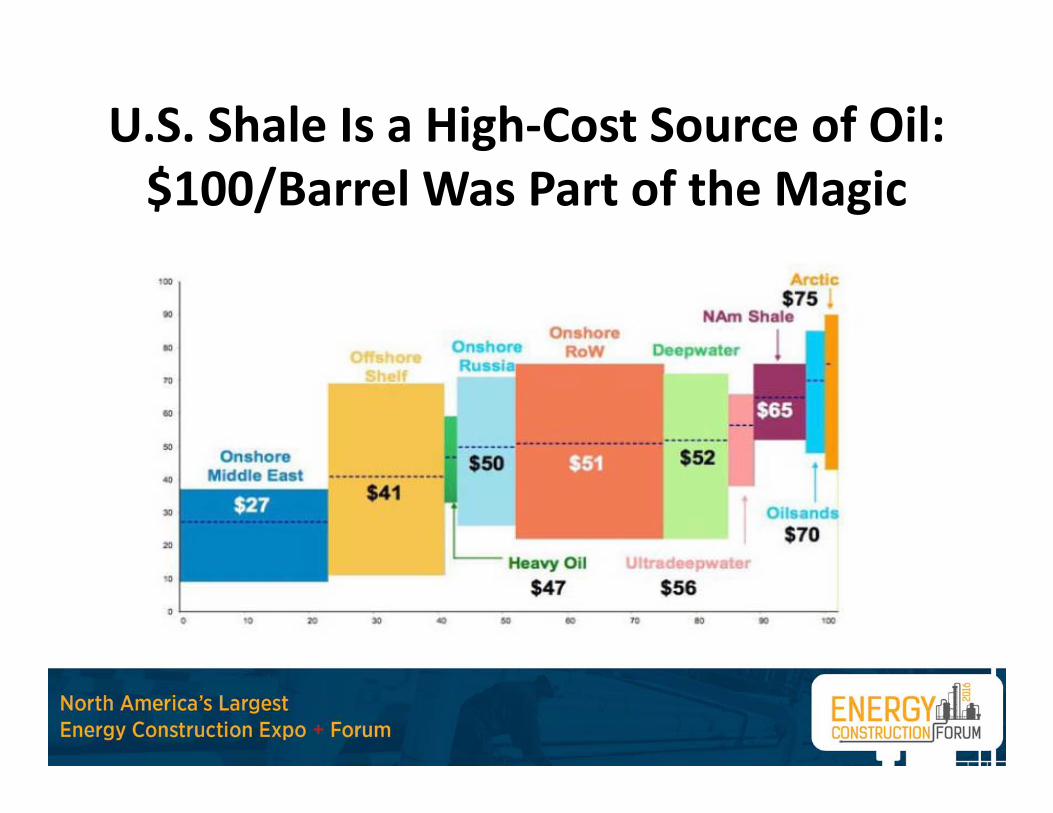
U.S. Shale Is a High‐Cost Source of Oil: $100/Barrel Was Part of the Magic
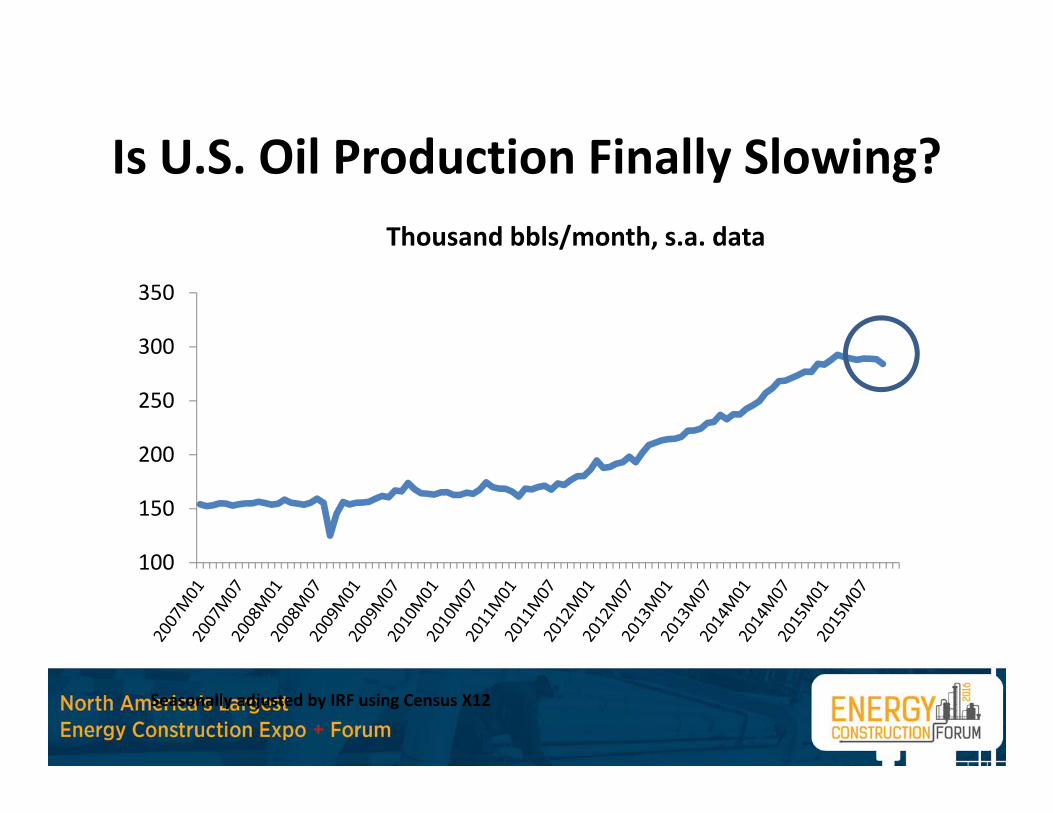
Is U.S. Oil Production Finally Slowing?
100
150
200
250
300
350
Thousand bbls/month, s.a. data
Seasonally adjusted by IRF using Census X12
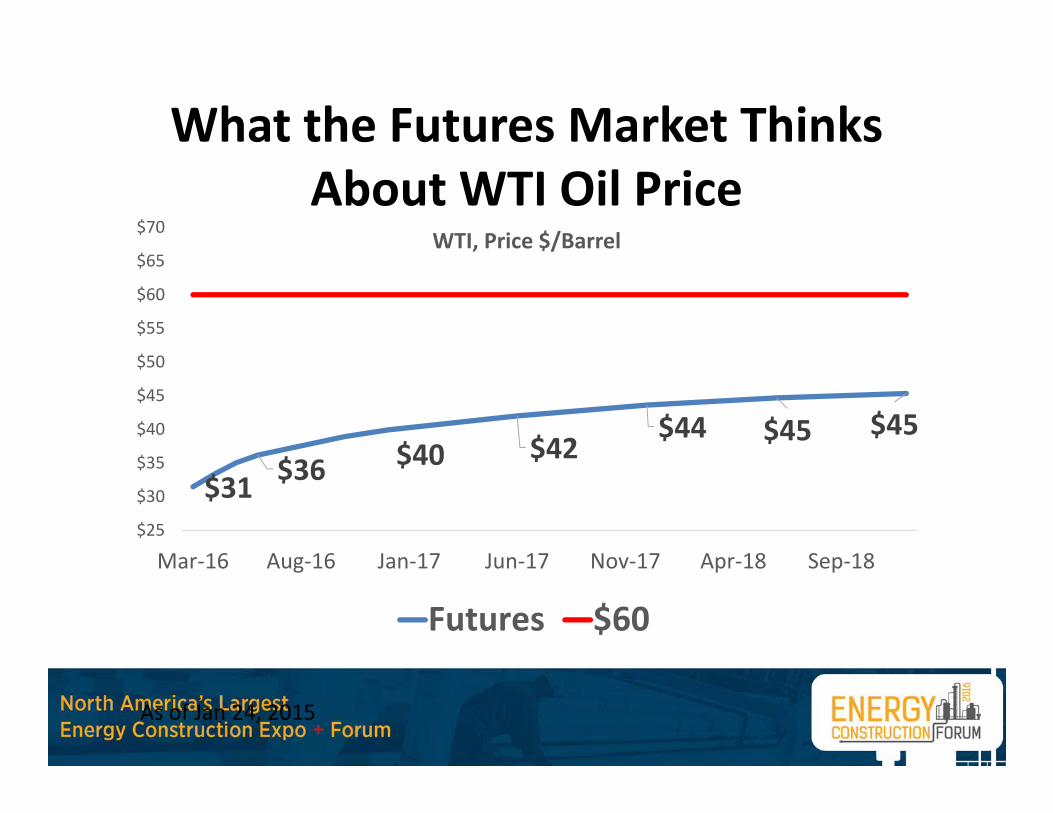
What the Futures Market Thinks About WTI Oil Price
$31 $36 $40 $42$44 $45 $45
$25
$30
$35
$40
$45
$50
$55
$60
$65
$70
Mar‐16 Aug‐16 Jan‐17 Jun‐17 Nov‐17 Apr‐18 Sep‐18
WTI, Price $/Barrel
Futures $60
As of Jan 24, 2015
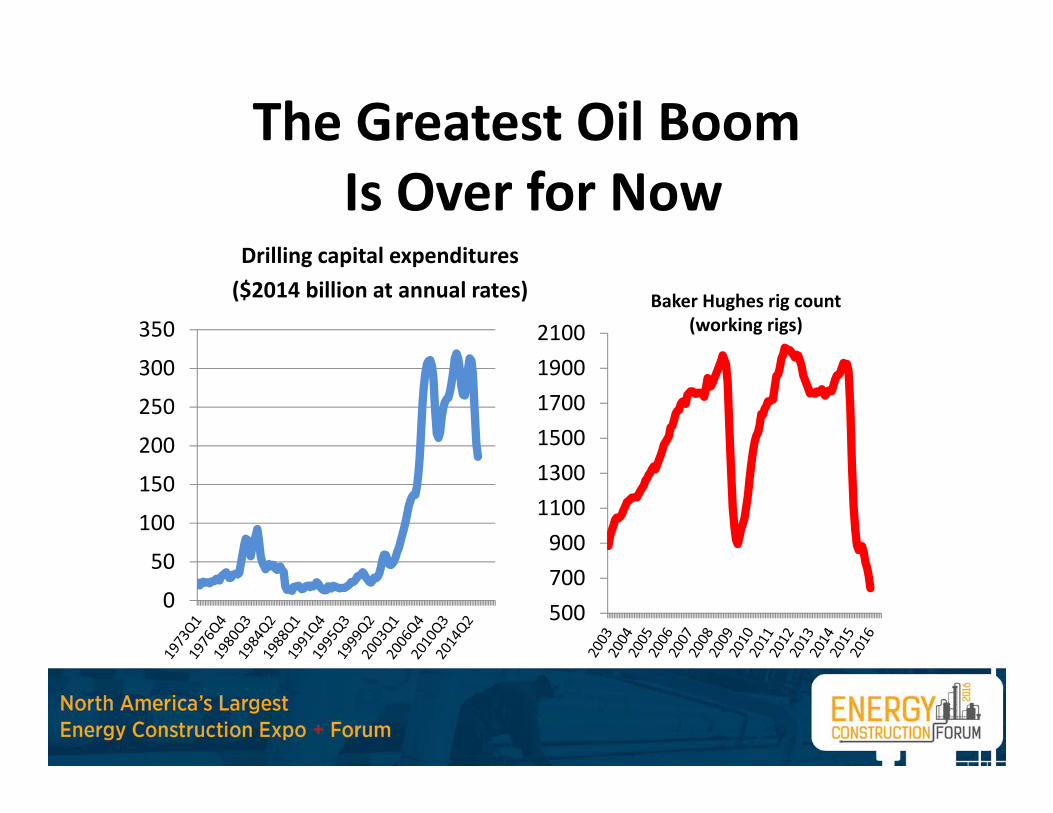
The Greatest Oil BoomIs Over for Now
Drilling capital expenditures($2014 billion at annual rates)
0
50
100
150
200
250
300
350Baker Hughes rig count
(working rigs)
500700900110013001500170019002100
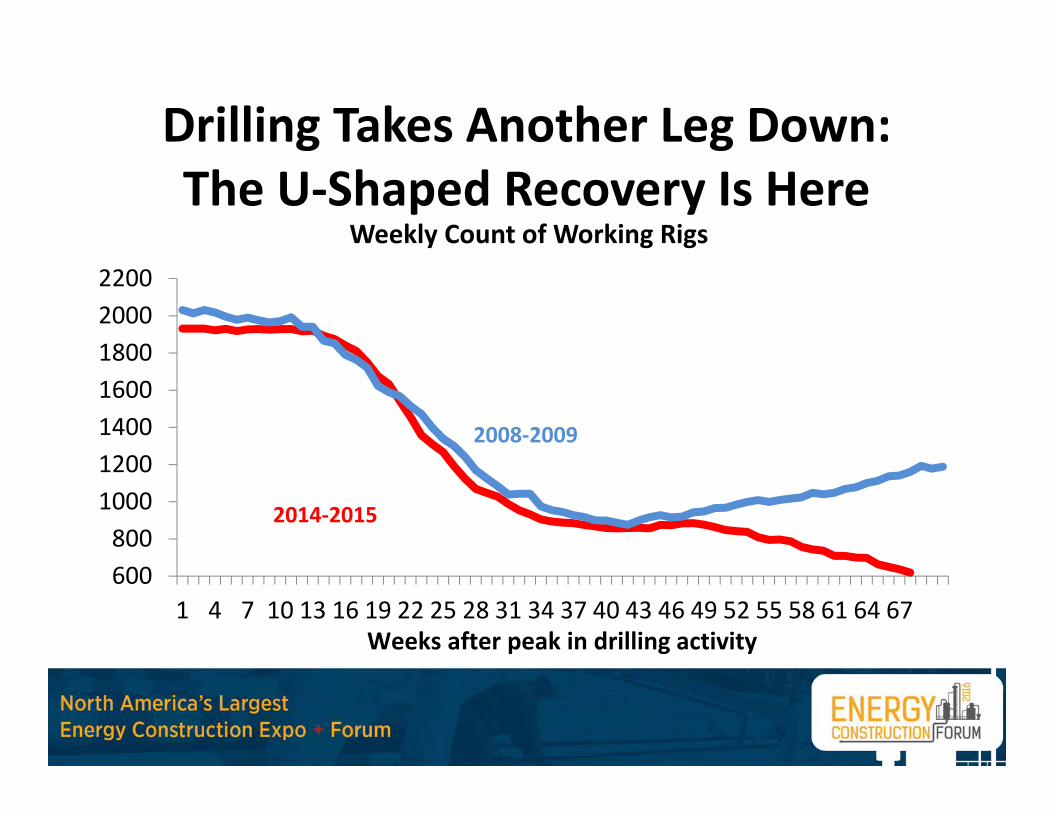
Drilling Takes Another Leg Down:The U‐Shaped Recovery Is Here
600800
1000120014001600180020002200
1 4 7 10 13 16 19 22 25 28 31 34 37 40 43 46 49 52 55 58 61 64 67
Weekly Count of Working Rigs
Weeks after peak in drilling activity
2008‐2009
2014‐2015
Local Job Losses Will Spread If Drilling Does Not Turn Up
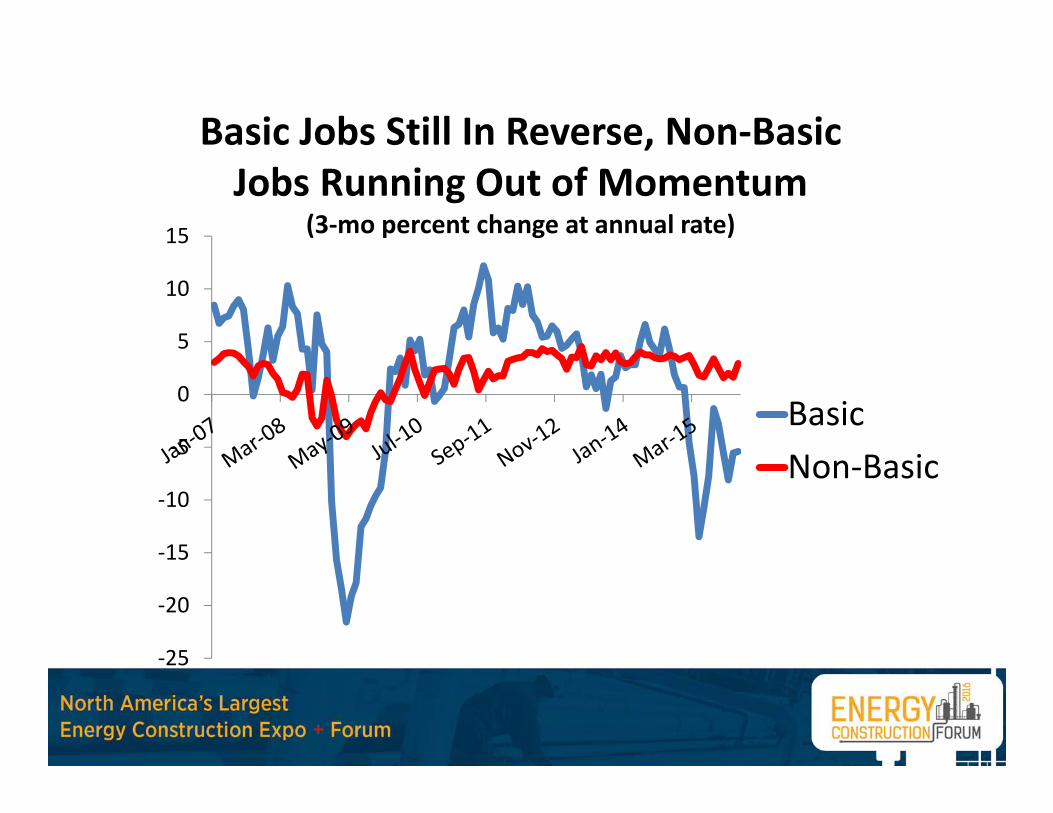
Basic Jobs Still In Reverse, Non‐Basic Jobs Running Out of Momentum
(3‐mo percent change at annual rate)
‐25
‐20
‐15
‐10
‐5
0
5
10
15
BasicNon‐Basic
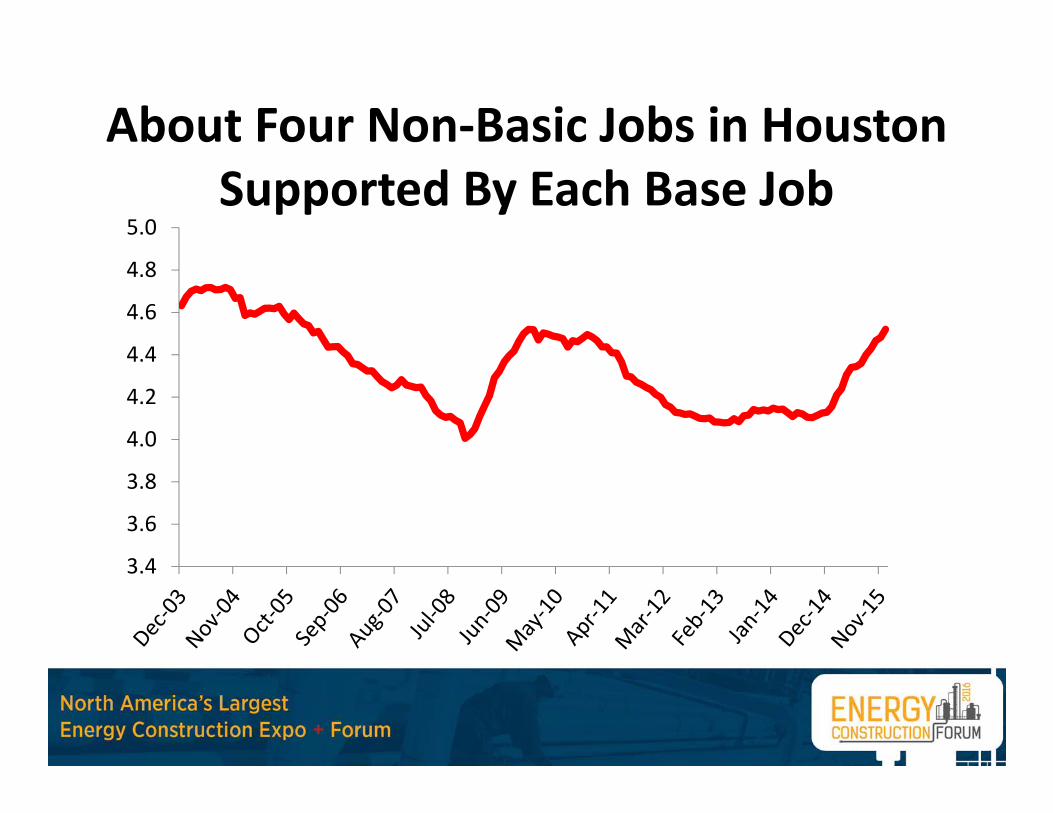
About Four Non‐Basic Jobs in HoustonSupported By Each Base Job
3.4
3.6
3.8
4.0
4.2
4.4
4.6
4.8
5.0

Four Scenarios
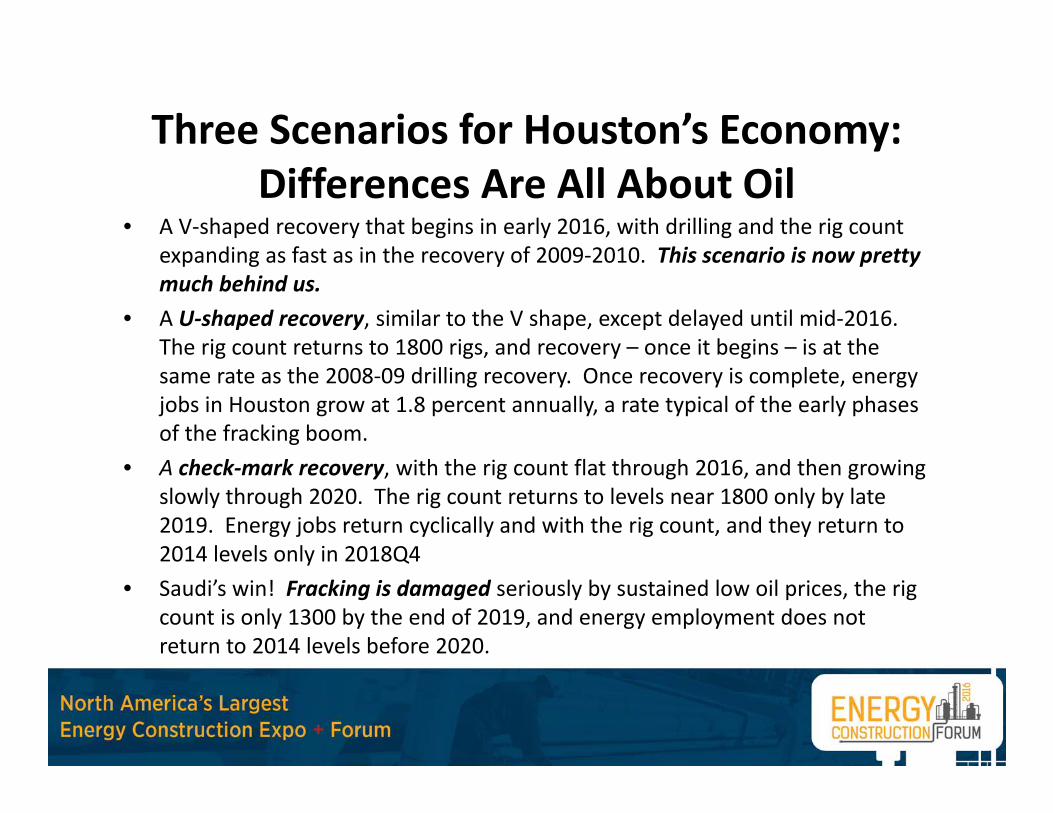
Three Scenarios for Houston’s Economy: Differences Are All About Oil
• A V‐shaped recovery that begins in early 2016, with drilling and the rig count expanding as fast as in the recovery of 2009‐2010. This scenario is now pretty much behind us.
• A U‐shaped recovery, similar to the V shape, except delayed until mid‐2016. The rig count returns to 1800 rigs, and recovery – once it begins – is at the same rate as the 2008‐09 drilling recovery. Once recovery is complete, energy jobs in Houston grow at 1.8 percent annually, a rate typical of the early phases of the fracking boom.
• A check‐mark recovery, with the rig count flat through 2016, and then growing slowly through 2020. The rig count returns to levels near 1800 only by late 2019. Energy jobs return cyclically and with the rig count, and they return to 2014 levels only in 2018Q4
• Saudi’s win! Fracking is damaged seriously by sustained low oil prices, the rig count is only 1300 by the end of 2019, and energy employment does not return to 2014 levels before 2020.
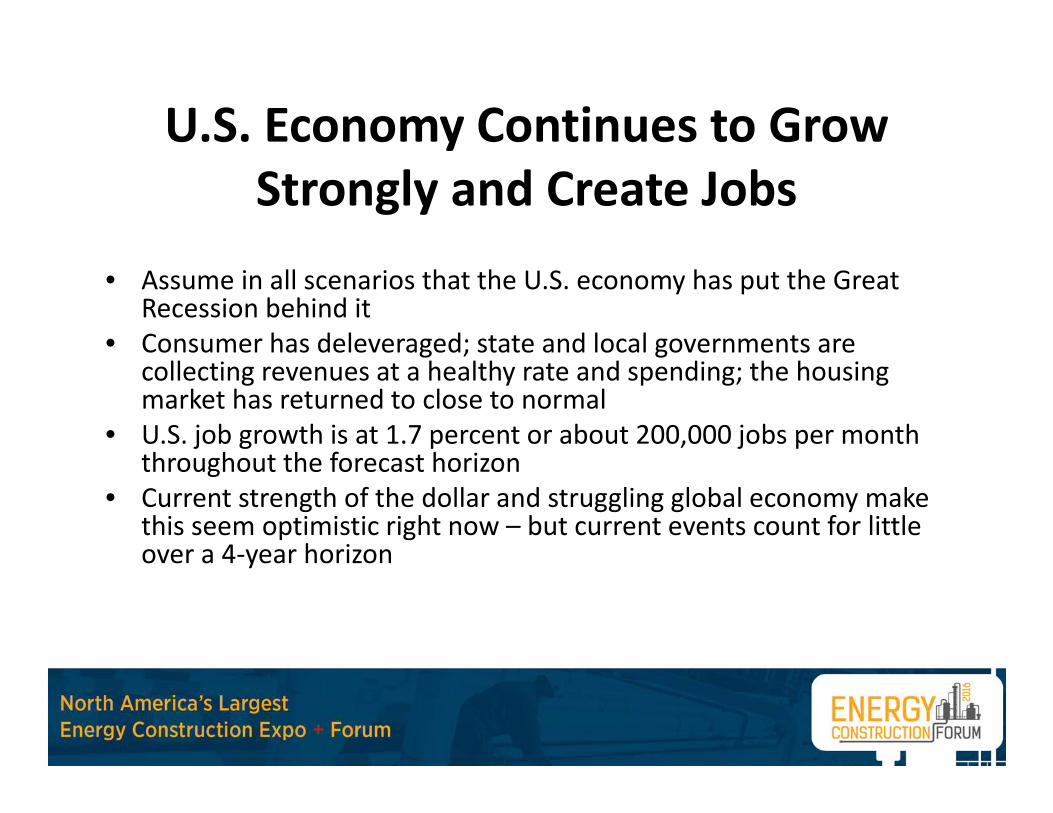
U.S. Economy Continues to Grow Strongly and Create Jobs
• Assume in all scenarios that the U.S. economy has put the Great Recession behind it
• Consumer has deleveraged; state and local governments are collecting revenues at a healthy rate and spending; the housing market has returned to close to normal
• U.S. job growth is at 1.7 percent or about 200,000 jobs per month throughout the forecast horizon
• Current strength of the dollar and struggling global economy make this seem optimistic right now – but current events count for little over a 4‐year horizon
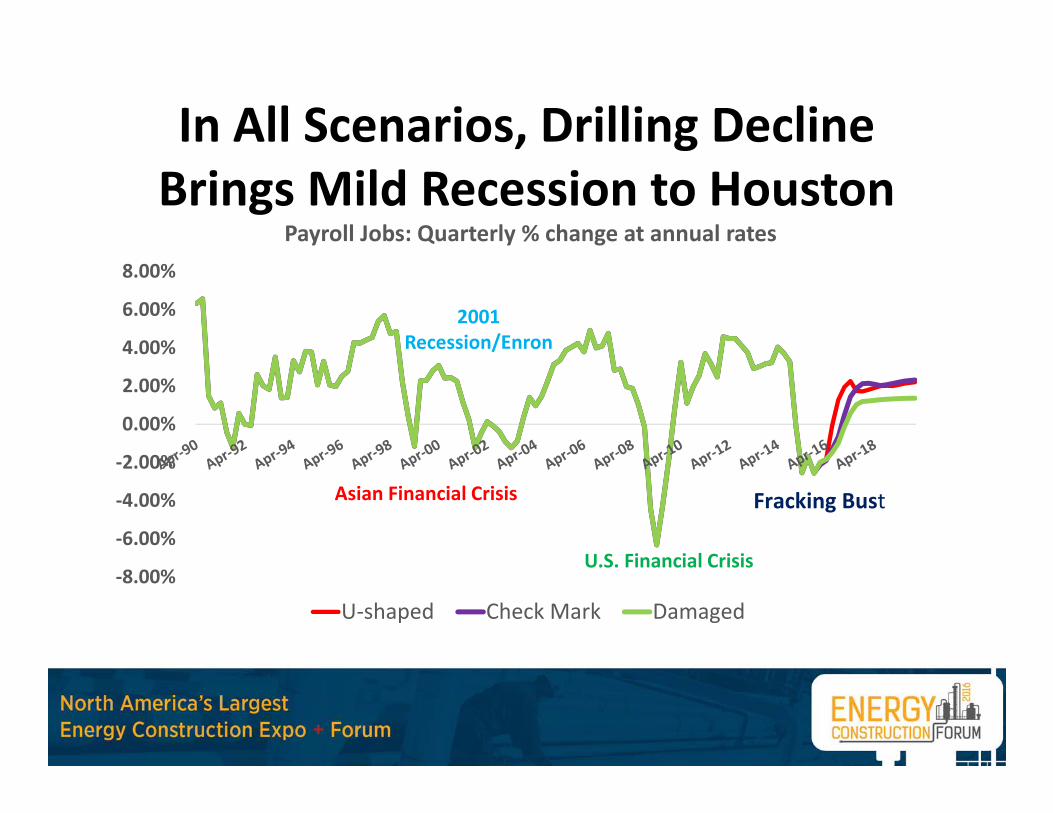
In All Scenarios, Drilling Decline Brings Mild Recession to Houston
‐8.00%
‐6.00%
‐4.00%
‐2.00%
0.00%
2.00%
4.00%
6.00%
8.00%
Payroll Jobs: Quarterly % change at annual rates
U‐shaped Check Mark Damaged
Asian Financial Crisis Fracking Bust
2001 Recession/Enron
U.S. Financial Crisis
Downstream Boom Built on Cheap Energy
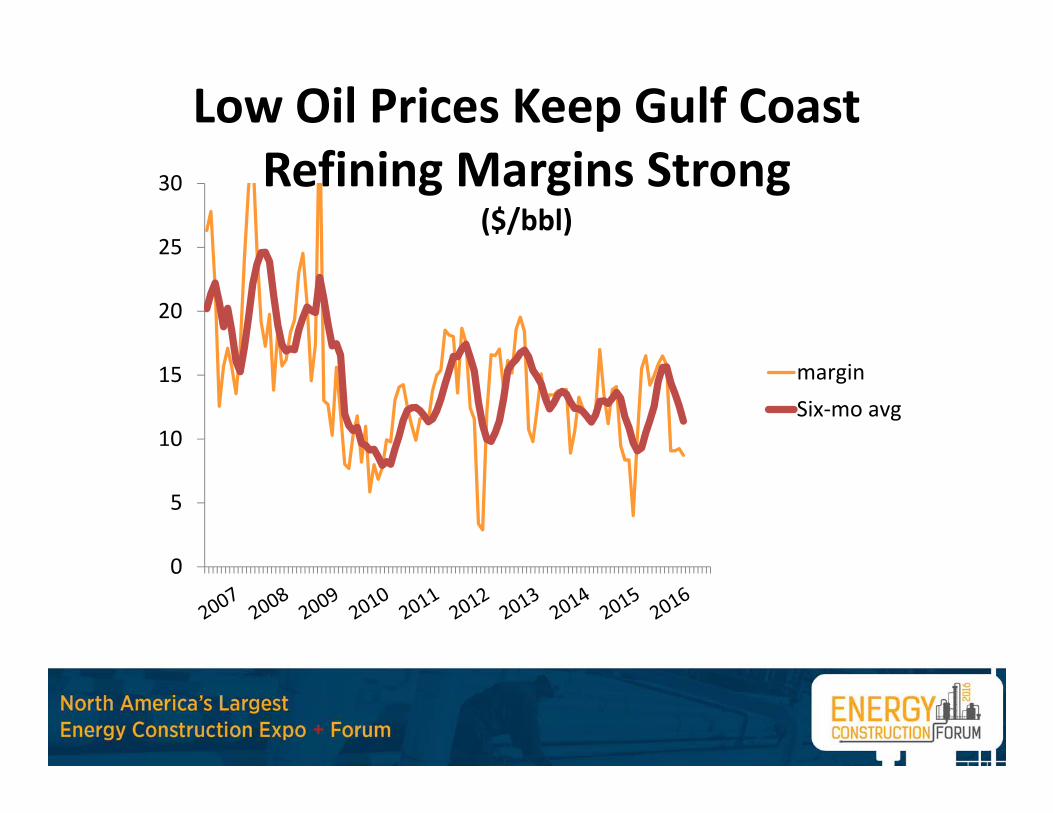
Low Oil Prices Keep Gulf Coast Refining Margins Strong
($/bbl)
0
5
10
15
20
25
30
marginSix‐mo avg
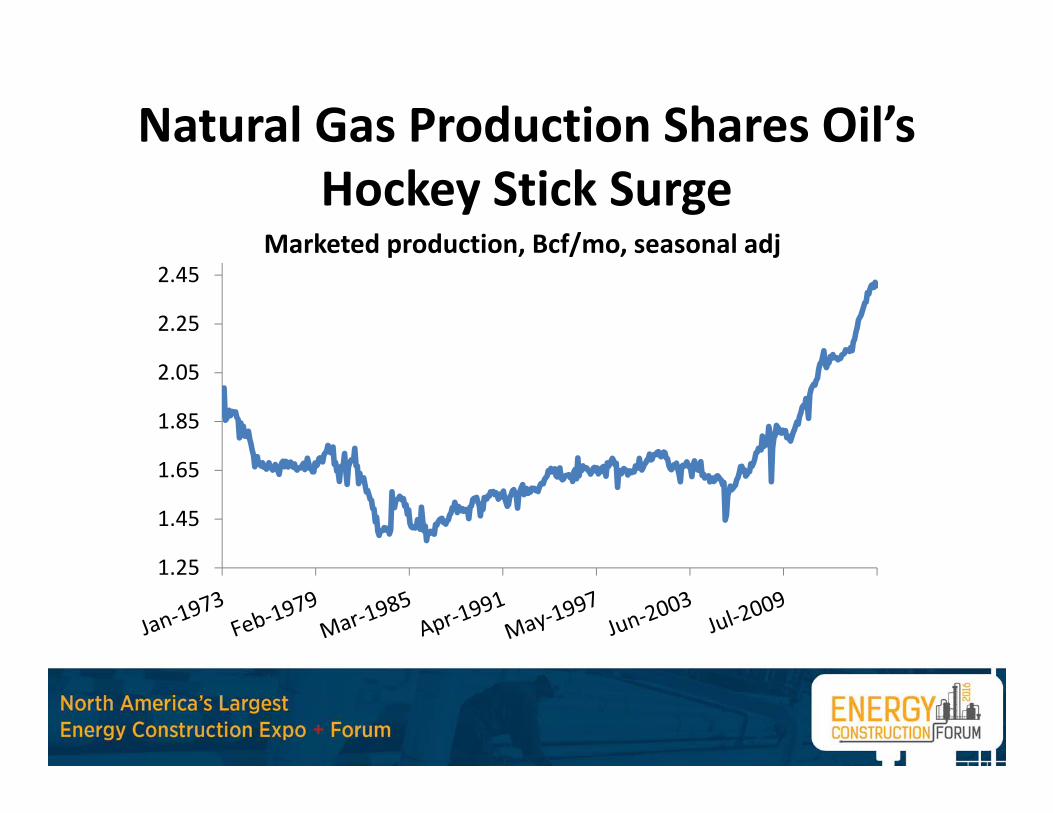
Natural Gas Production Shares Oil’s Hockey Stick Surge
1.25
1.45
1.65
1.85
2.05
2.25
2.45Marketed production, Bcf/mo, seasonal adj
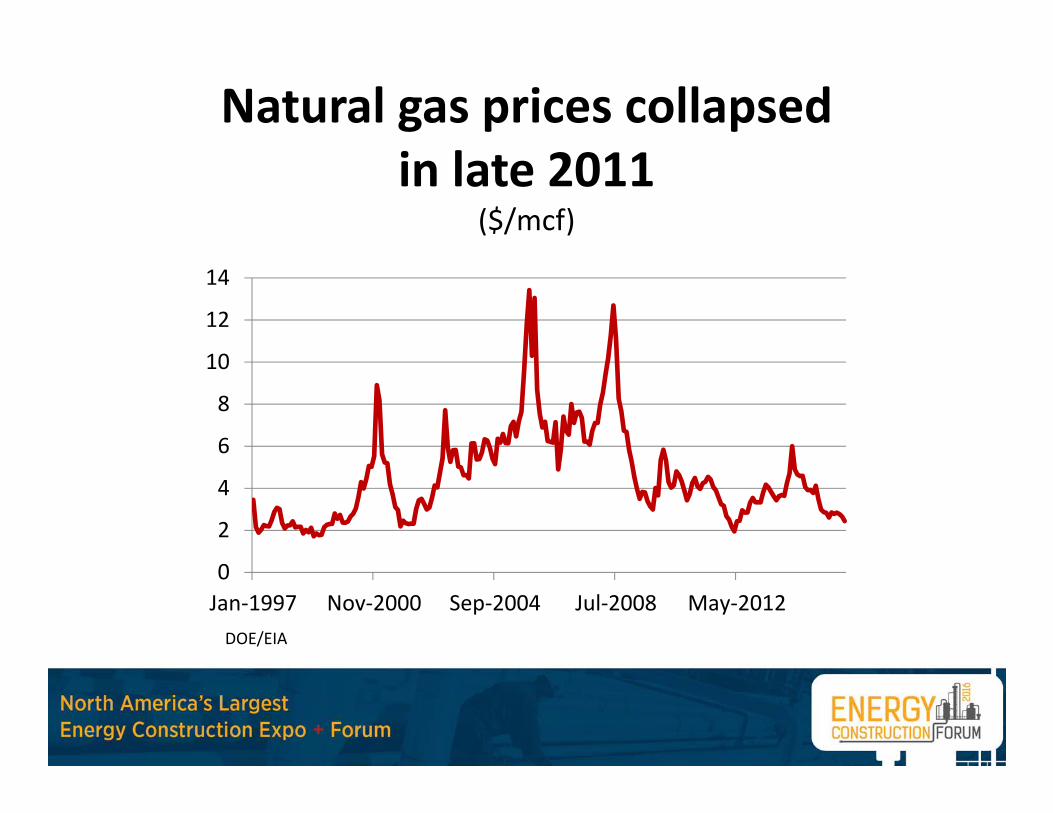
Natural gas prices collapsed in late 2011
($/mcf)
0
2
4
6
8
10
12
14
Jan‐1997 Nov‐2000 Sep‐2004 Jul‐2008 May‐2012DOE/EIA
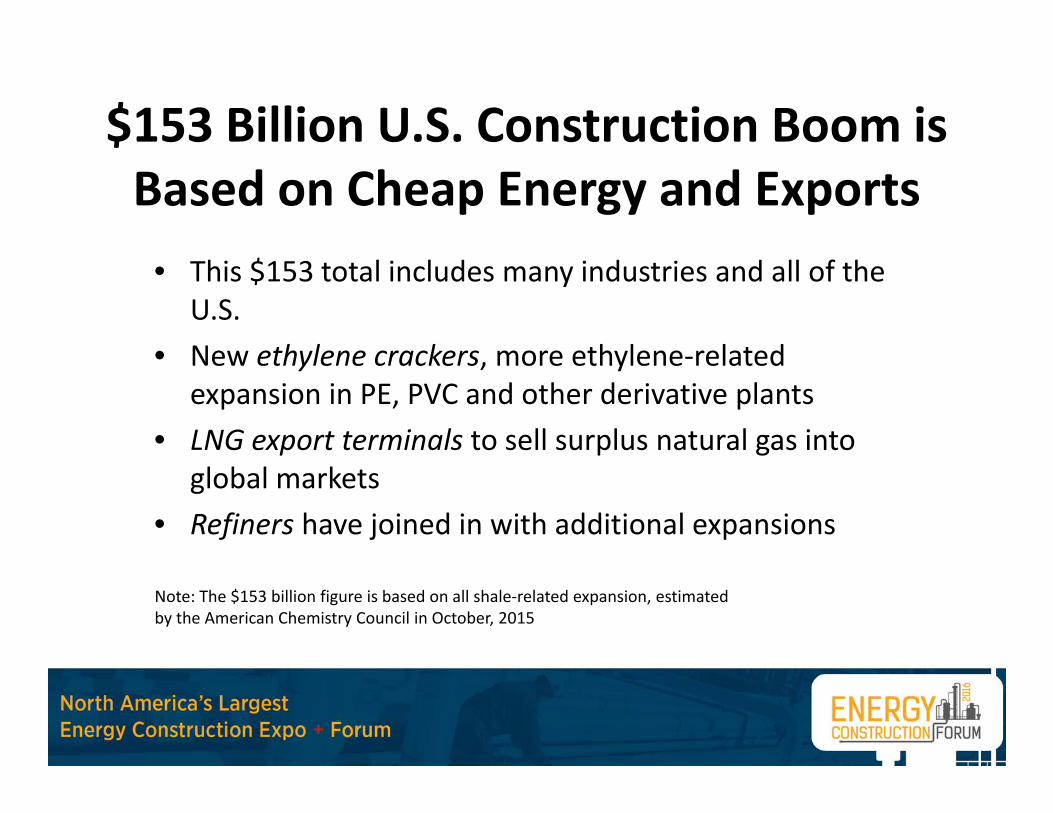
$153 Billion U.S. Construction Boom is Based on Cheap Energy and Exports
• This $153 total includes many industries and all of the U.S.
• New ethylene crackers, more ethylene‐related expansion in PE, PVC and other derivative plants
• LNG export terminals to sell surplus natural gas into global markets
• Refiners have joined in with additional expansions
Note: The $153 billion figure is based on all shale‐related expansion, estimatedby the American Chemistry Council in October, 2015
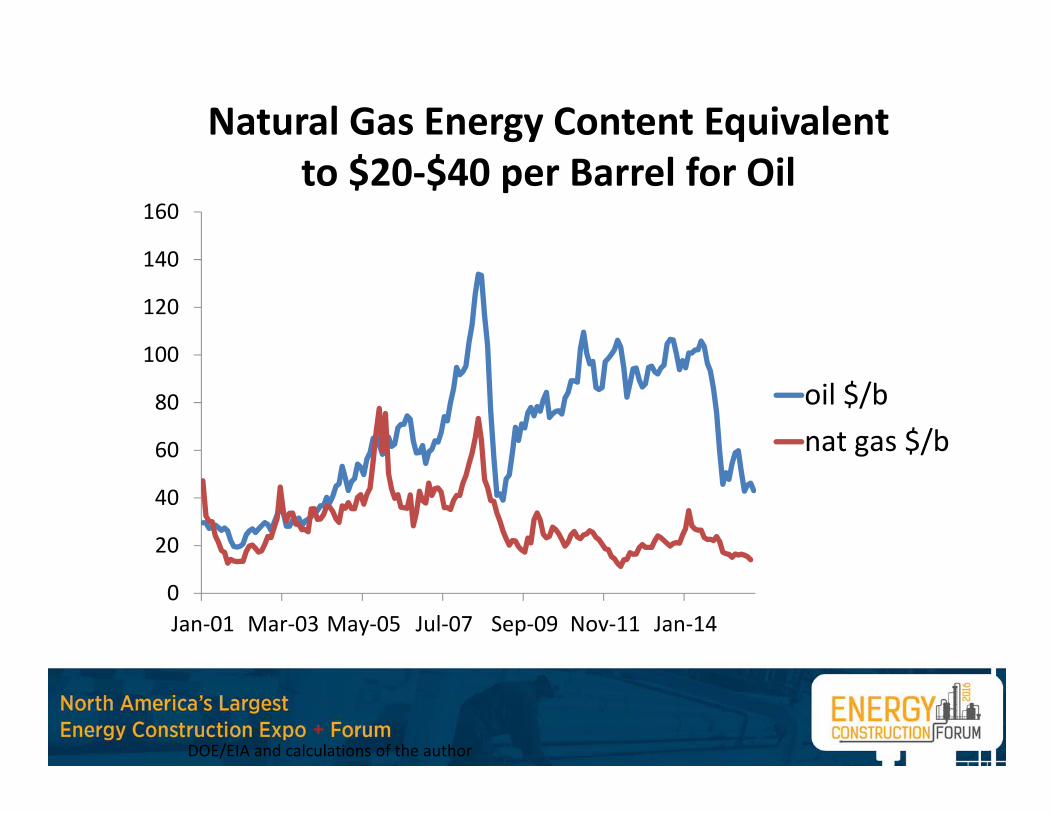
Natural Gas Energy Content Equivalent to $20‐$40 per Barrel for Oil
0
20
40
60
80
100
120
140
160
Jan‐01 Mar‐03 May‐05 Jul‐07 Sep‐09 Nov‐11 Jan‐14
oil $/bnat gas $/b
DOE/EIA and calculations of the author
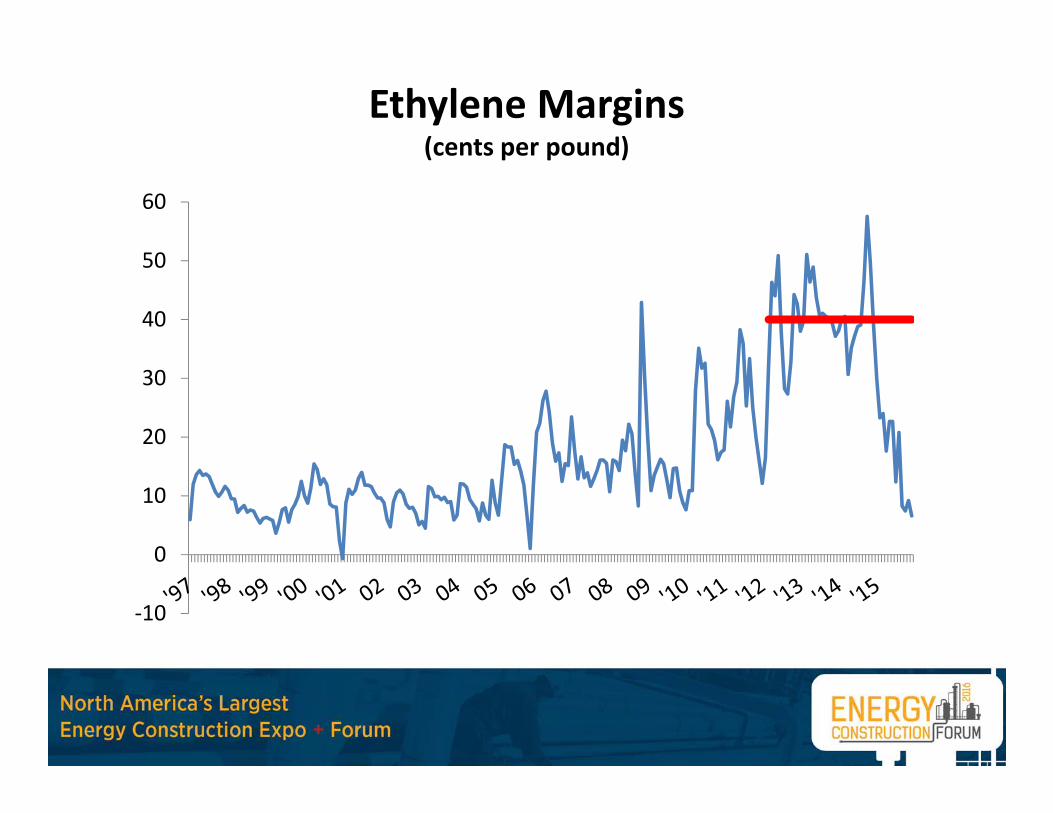
Ethylene Margins(cents per pound)
‐10
0
10
20
30
40
50
60
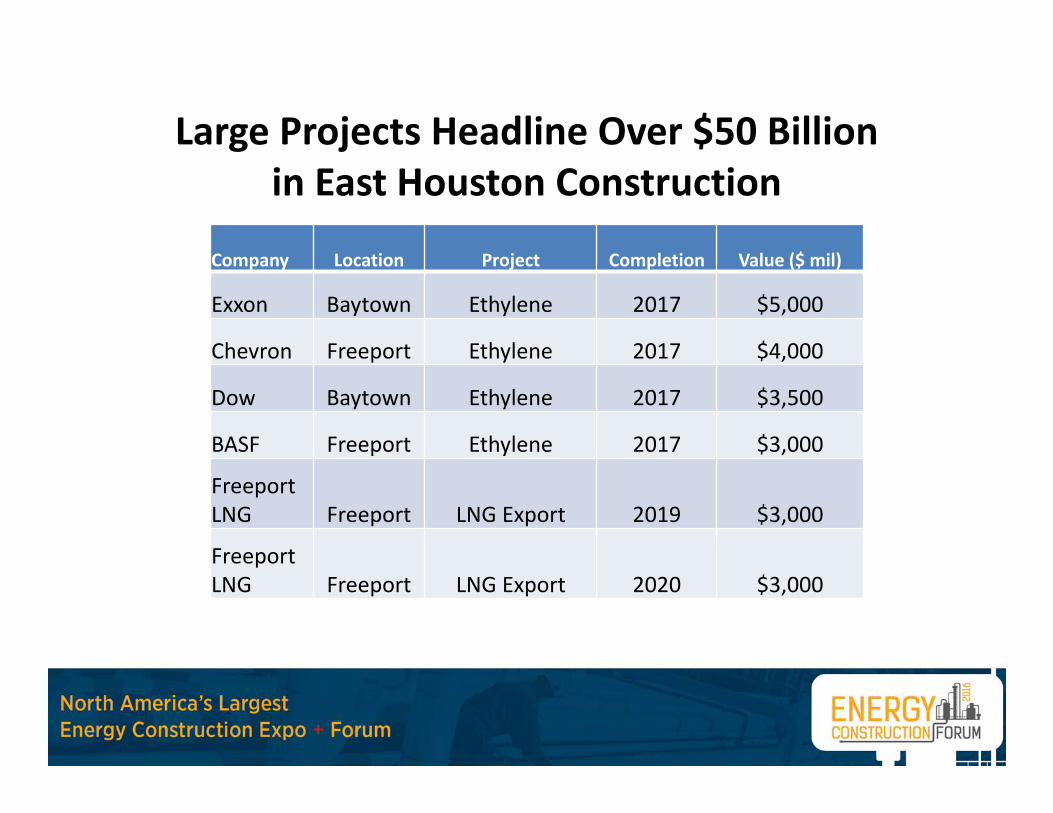
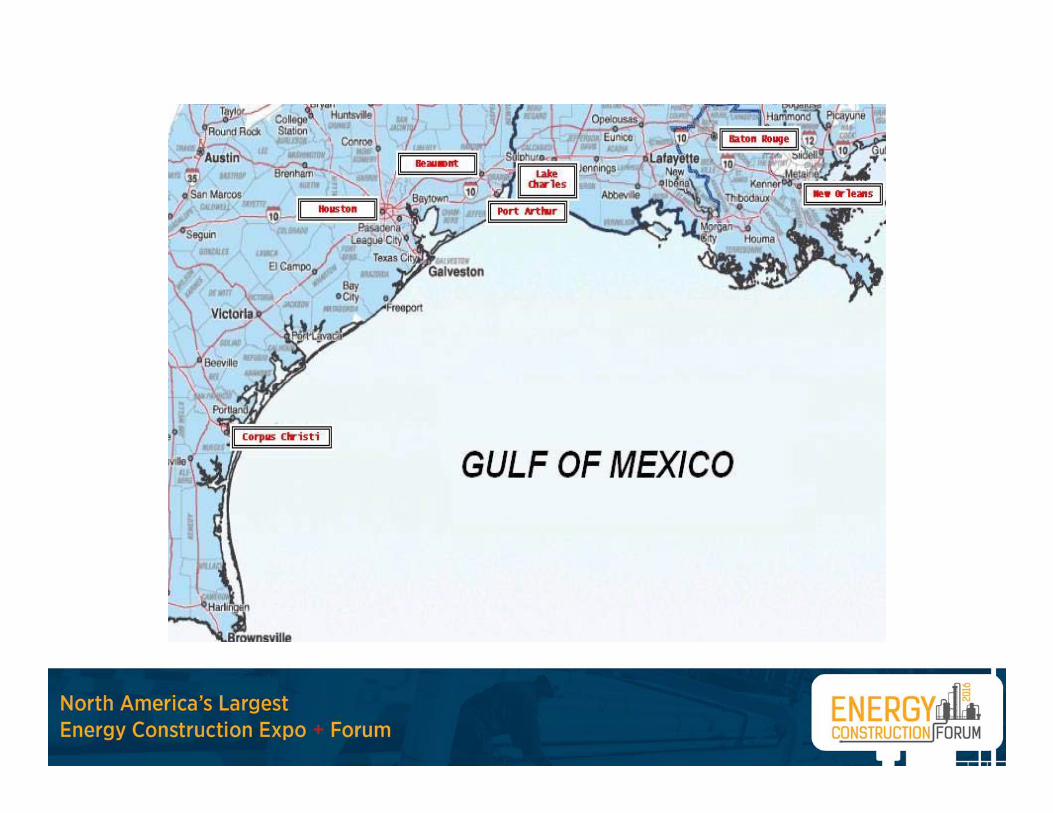
Large Projects Headline Over $50 Billion in East Houston Construction
Company Location Project Completion Value ($ mil)
Exxon Baytown Ethylene 2017 $5,000
Chevron Freeport Ethylene 2017 $4,000
Dow Baytown Ethylene 2017 $3,500
BASF Freeport Ethylene 2017 $3,000
Freeport LNG Freeport LNG Export 2019 $3,000
Freeport LNG Freeport LNG Export 2020 $3,000
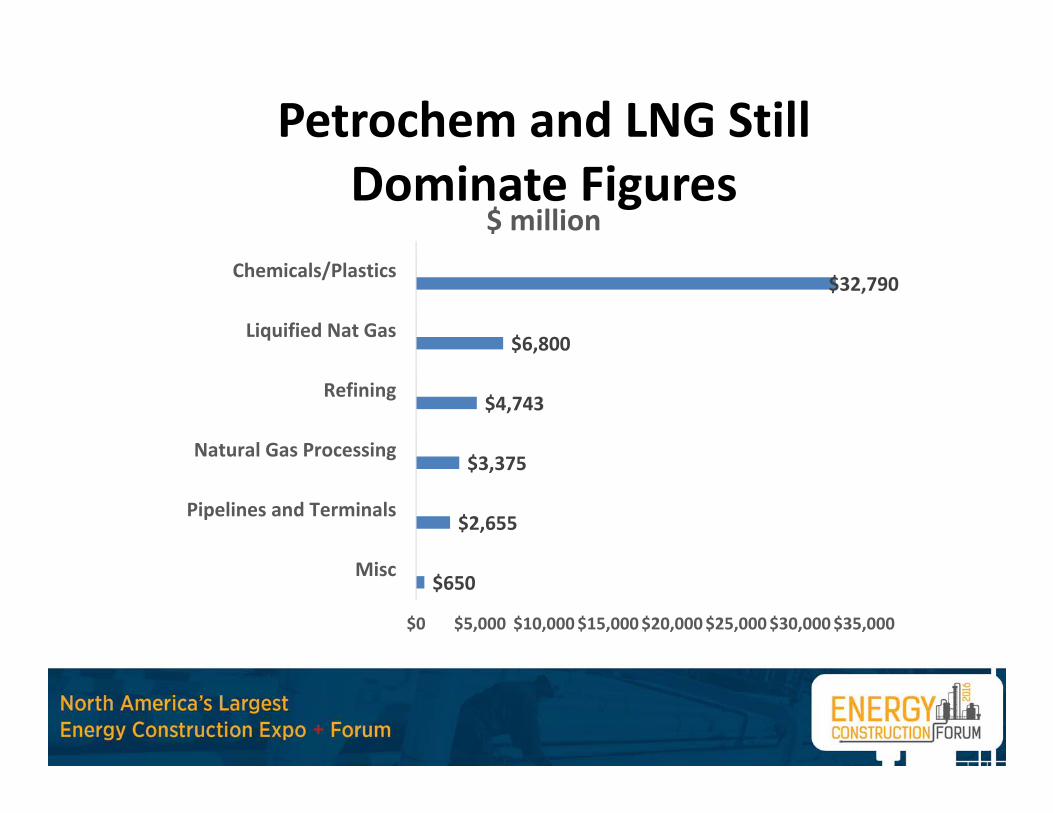
Petrochem and LNG Still Dominate Figures
$650
$2,655
$3,375
$4,743
$6,800
$32,790
$0 $5,000 $10,000$15,000$20,000$25,000$30,000$35,000
Misc
Pipelines and Terminals
Natural Gas Processing
Refining
Liquified Nat Gas
Chemicals/Plastics
$ million
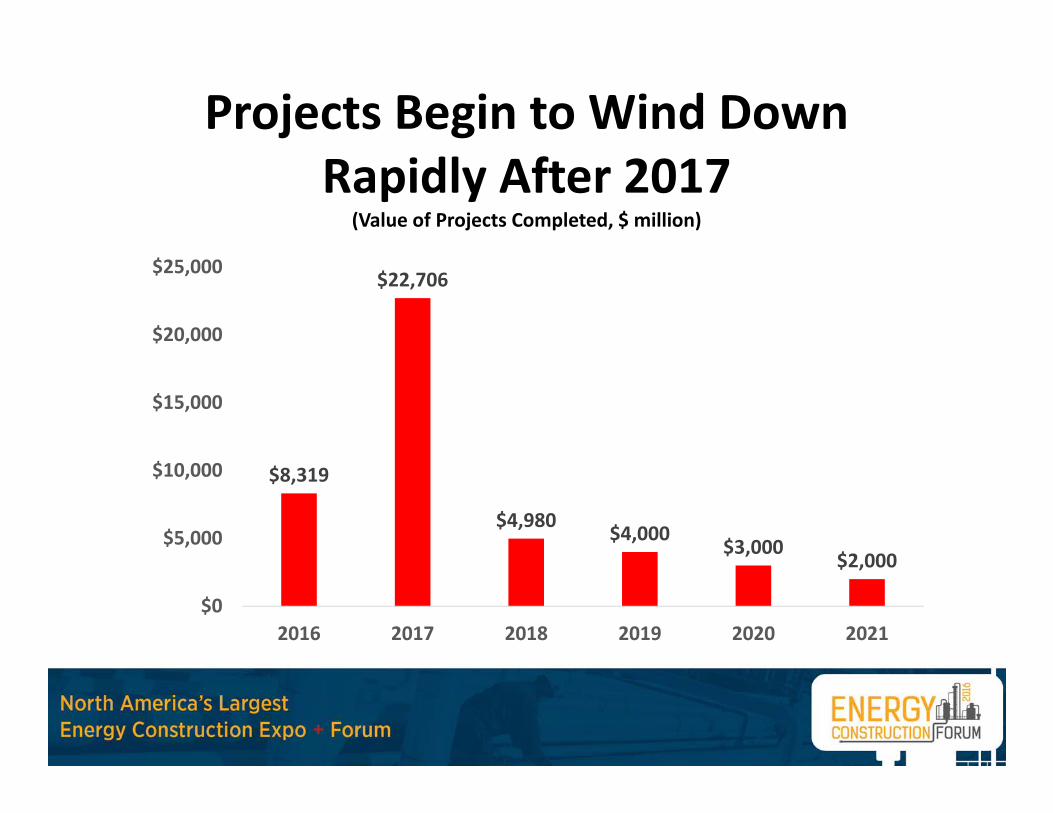
Projects Begin to Wind Down Rapidly After 2017
(Value of Projects Completed, $ million)
$8,319
$22,706
$4,980 $4,000$3,000
$2,000
$0
$5,000
$10,000
$15,000
$20,000
$25,000
2016 2017 2018 2019 2020 2021
A Counterweight to Upstream Damage From Low Oil Prices
• Jobs adds up quickly given the number and scale of proposed construction projects in 2015‐2017
• These are temporary jobs, disappearing as projects end and capital expenditures wind down
• Normally, downstream capital expenditures are small compared to the upstream, move in a narrow range, and create relatively few jobs
• The construction projects just described means the downstream can’t be ignored right now. Can this spending substitute for losses upstream?
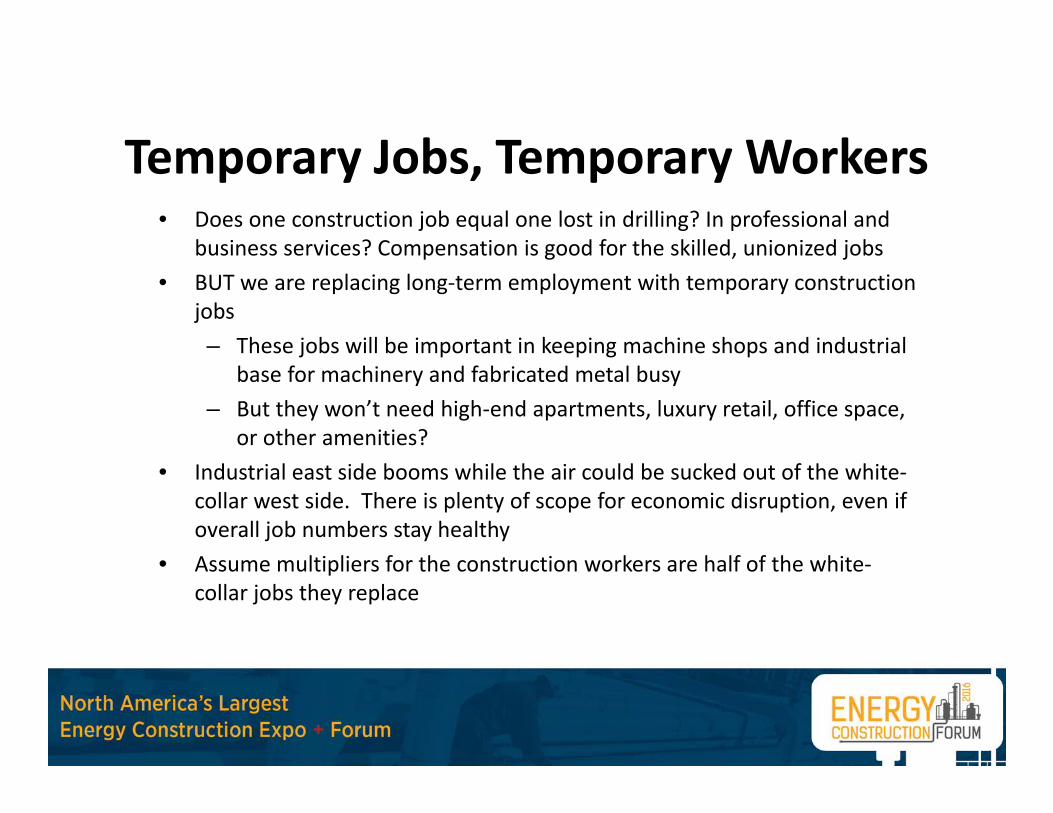
Temporary Jobs, Temporary Workers• Does one construction job equal one lost in drilling? In professional and
business services? Compensation is good for the skilled, unionized jobs • BUT we are replacing long‐term employment with temporary construction
jobs – These jobs will be important in keeping machine shops and industrial
base for machinery and fabricated metal busy– But they won’t need high‐end apartments, luxury retail, office space,
or other amenities?• Industrial east side booms while the air could be sucked out of the white‐
collar west side. There is plenty of scope for economic disruption, even if overall job numbers stay healthy
• Assume multipliers for the construction workers are half of the white‐collar jobs they replace
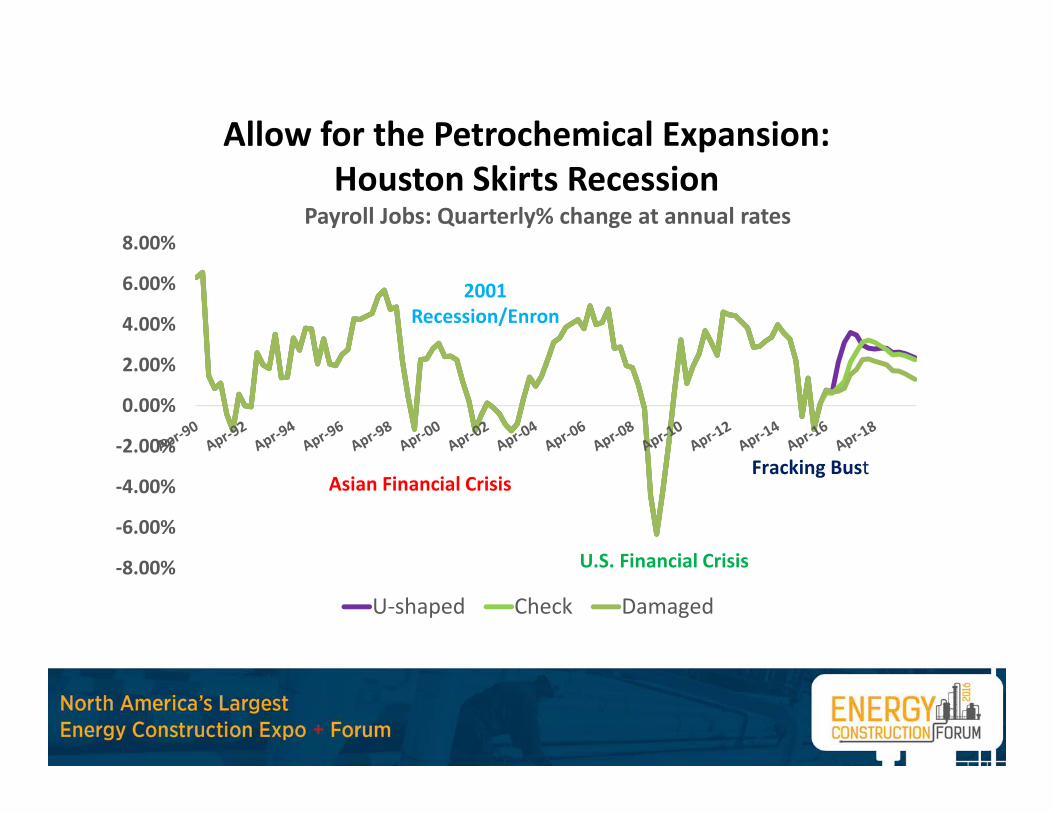
Allow for the Petrochemical Expansion:Houston Skirts Recession
‐8.00%
‐6.00%
‐4.00%
‐2.00%
0.00%
2.00%
4.00%
6.00%
8.00%Payroll Jobs: Quarterly% change at annual rates
U‐shaped Check Damaged
Asian Financial CrisisFracking Bust
2001 Recession/Enron
U.S. Financial Crisis
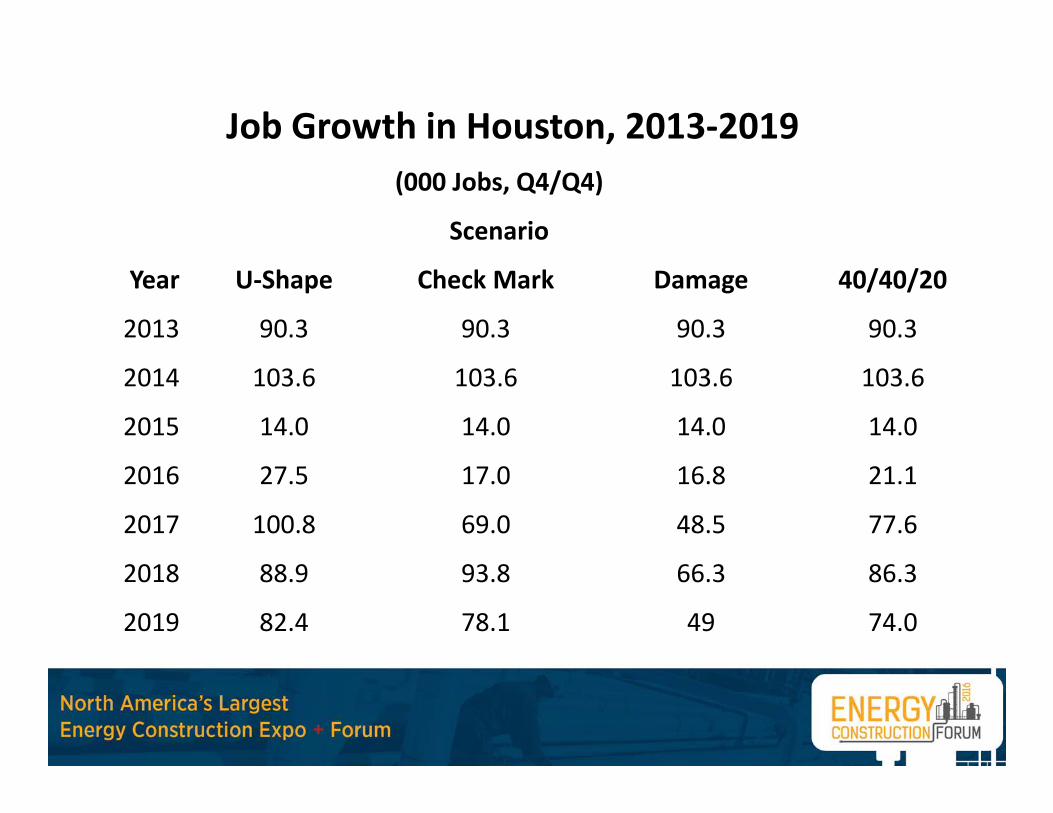
Job Growth in Houston, 2013‐2019(000 Jobs, Q4/Q4)
Scenario
Year U‐Shape Check Mark Damage 40/40/20
2013 90.3 90.3 90.3 90.3
2014 103.6 103.6 103.6 103.6
2015 14.0 14.0 14.0 14.0
2016 27.5 17.0 16.8 21.1
2017 100.8 69.0 48.5 77.6
2018 88.9 93.8 66.3 86.3
2019 82.4 78.1 49 74.0
In Closing …• This is a serious downturn in oil markets, that has run faster and
deeper than 2008‐09, and it has serious implications for Houston• The options for a quick and easy way out of this downturn have
disappeared, and slow job growth will likely stretch through 2016• With limited job growth in 2016, many sectors that seemed
immune to the slowdown in 2015 will begin to feel it. Health care, leisure, retail, single‐family, and multi‐family will be on this list
• That said, it is just one more oil downturn in Houston. It is not 1982 or 1987 in oil markets – and certainly not the Houston economy

Houston Economy in 2016:Another Slow Year as Oil Prices
Find New LowsRobert W. Gilmer, Ph.D.
C.T. Bauer College of BusinessFebruary 2015