Embed Size (px)
Citation preview

arX
iv:1
212.
2209
v2 [
astro
-ph.
SR]
4 Fe
b 20
13Draft version February 5, 2013Preprint typeset using LATEX style emulateapj v. 11/10/09
TYPE Iax SUPERNOVAE: A NEW CLASS OF STELLAR EXPLOSION1
Ryan J. Foley2,3, P. J. Challis2, R. Chornock2, M. Ganeshalingam4, W. Li4,5, G. H. Marion2, N. I. Morrell6,G. Pignata7, M. D. Stritzinger8, J. M. Silverman4, 9, X. Wang10, J. P. Anderson11, A. V. Filippenko4,
W. L. Freedman12, M. Hamuy11, S. W. Jha13, R. P. Kirshner2, C. McCully13, S. E. Persson12,M. M. Phillips6, D. E. Reichart14, A. M. Soderberg2
Draft version February 5, 2013
ABSTRACT
We describe observed properties of the Type Iax class of supernovae (SNe Iax), consisting of SNeobservationally similar to its prototypical member, SN 2002cx. The class currently has 25 members,and we present optical photometry and/or optical spectroscopy for most of them. SNe Iax are spec-troscopically similar to SNe Ia, but have lower maximum-light velocities (2000 ! |v| ! 8000 km s−1),typically lower peak magnitudes (−14.2 ≥ MV,peak " −18.9 mag), and most have hot photospheres.Relative to SNe Ia, SNe Iax have low luminosities for their light-curve shape. There is a correlationbetween luminosity and light-curve shape, similar to that of SNe Ia, but offset from that of SNe Ia andwith larger scatter. Despite a host-galaxy morphology distribution that is highly skewed to late-typegalaxies without any SNe Iax discovered in elliptical galaxies, there are several indications that theprogenitor stars are white dwarfs (WDs): evidence of C/O burning in their maximum-light spectra,low (typically ∼0.5 M⊙) ejecta masses, strong Fe lines in their late-time spectra, a lack of X-raydetections, and deep limits on massive stars and star formation at the SN sites. However, two SNe Iaxshow strong He lines in their spectra. The progenitor system and explosion model that best fits all ofthe data is a binary system of a C/O WD that accretes matter from a He star and has a deflagration.At least some of the time, this explosion will not disrupt the WD. The small number of SNe in thisclass prohibit a detailed analysis of the homogeneity and heterogeneity of the entire class. We estimatethat in a given volume there are 31+17
−13 SNe Iax for every 100 SNe Ia, and for every 1 M⊙ of irongenerated by SNe Ia at z = 0, SNe Iax generate ∼0.036 M⊙. Being the largest class of peculiar SNe,thousands of SNe Iax will be discovered by LSST. Future detailed observations of SNe Iax shouldfurther our understanding of both their progenitor systems and explosions as well as those of SNe Ia.Subject headings: supernovae: general — supernovae: individual (SN 1991bj, SN 1999ax, SN 2002bp,
SN 2002cx, SN 2003gq, SN 2004cs, SN 2004gw, SN 2005P, SN 2005cc, SN 2005hk,SN 2006hn, SN 2007J, SN 2007ie, SN 2007qd, SN 2008A, SN 2008ae, SN 2008ge,SN 2008ha, SN 2009J, SN 2009ku, SN 2010ae, SN 2010el, SN 2011ay, SN 2011ce,SN 2012Z)
1. INTRODUCTION
1 This paper is dedicated to the memory of our friend andcolleague, Dr. Weidong Li, a pioneer in the identification anddetailed study of this class of objects.
2 Harvard-Smithsonian Center for Astrophysics, 60 GardenStreet, Cambridge, MA 02138, USA
3 Clay Fellow. Electronic address [email protected] .4 Department of Astronomy, University of California, Berke-
ley, CA 94720-3411, USA5 Deceased 12 December 20116 Carnegie Observatories, Las Campanas Observatory, La Ser-
ena, Chile7 Departamento de Ciencias Fisicas, Universidad Andres
Bello, Avda. Republica 252, Santiago, Chile8 Department of Physics and Astronomy, Aarhus University,
Ny Munkegade, DK-8000 Aarhus C, Denmark9 Department of Astronomy, University of Texas, Austin, TX
78712-0259, USA10 Physics Department and Tsinghua Center for Astrophysics
(THCA), Tsinghua University, Beijing 100084, China11 Departamento de Astronomıa, Universidad de Chile,
Casilla 36-D, Santiago, Chile12 Observatories of the Carnegie Institution of Washington,
813 Santa Barbara St., Pasadena, CA 91101, USA13 Department of Physics and Astronomy, Rutgers, the State
University of New Jersey, 136 Frelinghuysen Road, Piscataway,NJ 08854, USA
14 Department of Physics and Astronomy, University of NorthCarolina at Chapel Hill, Chapel Hill, NC, USA
Most thermonuclear supernovae are spectroscopicallydefined as Type Ia. These supernovae (SNe) lack hydro-gen and helium in their spectra (except perhaps fromcircumstellar interaction), and most have strong linesfrom intermediate mass elements (IMEs) in their near-maximum-light spectra (see Filippenko 1997 for a re-view of SN classification). The bulk of observational di-versity within this group can be described by a singleparameter that relates peak luminosity with light-curveshape (a width-luminosity relation or WLR; Phillips1993), intrinsic color (Riess et al. 1996), and 56Ni mass(Mazzali et al. 2007). However, there is additional diver-sity related to ejecta velocity (e.g., Benetti et al. 2005;Foley & Kasen 2011; Ganeshalingam et al. 2011). Theability to collapse the observational diversity of this classto one or two parameters suggests that most SNe Iahave similar progenitor stars (although not necessarilyprogenitor systems, as some SN Ia observables correlatewith their progenitor environment; Foley et al. 2012b)and explosion mechanisms. There are also examples ofparticular thermonuclear SNe that do not follow this pa-rameterization (e.g., Li et al. 2001a; Howell et al. 2006;Foley et al. 2010b; Ganeshalingam et al. 2012), whichmay be the result of these SNe having different progen-
2 Foley et al.
itors and/or explosion mechanisms than most SNe Ia,rather than being extreme examples of the normal SN Iaprogenitor system and explosion mechanism.Almost all thermonuclear SNe that are outliers to the
trends defined by SNe Ia are part of a single, relativelylarge class. Members of this class, previously labeled“SN 2002cx-like” after the prototypical object (Li et al.2003), have peak magnitudes "1 mag below that of nor-mal SNe Ia, spectra that show low-velocity ejecta, andmaximum-light spectra that typically resemble those ofthe high-luminosity SN Ia 1991T (blue continua and ab-sorption from higher-ionization species consistent with ahot photosphere). Studying thermonuclear outliers canboth help determine what progenitors and explosionsmechanisms do not produce normal SNe Ia and constrainvarious models by examining the extremes of the popu-lation.In addition to the properties mentioned above, the
SN 2002cx-like class has several observational proper-ties that distinguish it from that of normal SNe Ia:low luminosity for its light-curve shape (e.g., Li et al.2003), no observed second maximum in the near-infrared(NIR) bands (e.g., Li et al. 2003), late-time spectradominated by narrow permitted Fe II lines (Jha et al.2006; Sahu et al. 2008), but can occasionally have strong[Fe II] emission (Foley et al. 2010c), strong mixing ofthe ejecta (Jha et al. 2006; Phillips et al. 2007), and ahost-galaxy morphology distribution highly skewed tolate-type galaxies, and no member of this class hasbeen discovered in an elliptical galaxy (Foley et al. 2009;Valenti et al. 2009). Additionally, some members of theclass, such as SN 2007J, display strong He I lines in theirspectra (Foley et al. 2009).Because of these physical distinctions as well as others
discussed in this paper, we designate this class of objects“Type Iax supernovae” or SNe Iax. This designationindicates the observational and physical similarities toSNe Ia, but also emphasizes the physical differences be-tween SNe Iax and normal SNe Ia (e.g., SNe Iax are notsimply a subclass of SNe Ia) and will hopefully reduceconfusion within the literature.Several of the extreme characteristics of some members
of this class, including low kinetic energy and significantmixing in the ejecta, may be consistent with a full de-flagration of a white dwarf (WD) (Branch et al. 2004;Phillips et al. 2007), rather than a deflagration that tran-sitions into a detonation as expected for normal SNe Ia(Khokhlov 1991). Because of their low velocities, whicheases line identification and helps probe the deflagra-tion process, which is essential to all SN Ia explosions,this class is particularly useful for understanding typicalSN Ia explosions.An extreme member of this class, SN 2008ha
(Foley et al. 2009; Valenti et al. 2009; Foley et al.2010a), was much fainter (peaking at MV = −14.2 mag)and had a significantly lower velocity (|v| ≈ 2000 km s−1)than the typical member. Although its maximum-lightspectrum indicates that the object underwent C/O burn-ing (Foley et al. 2010a), certain observations are consis-tent with a massive-star progenitor (Foley et al. 2009;Valenti et al. 2009; Moriya et al. 2010). Nonetheless, amassive-star progenitor is inconsistent with other ob-servables (Foley et al. 2010a). SN 2008ha generated
∼ 10−3 M⊙ of 56Ni and ejected ∼ 0.3 M⊙ of mate-rial (Foley et al. 2010a), suggesting that the most plau-sible explanation was a failed deflagration of a WD(Foley et al. 2009, 2010a).Furthermore, another member of this class, SN 2008ge,
was hosted in an S0 galaxy with no signs of star for-mation or massive stars, including at the SN positionin pre-explosion Hubble Space Telescope (HST) images(Foley et al. 2010c). SN 2008ge most likely had a WDprogenitor. SN 2008ha had an inferred ejecta mass of∼0.3M⊙, which is less than the total mass of any WDexpected to explode as a SN. If SN 2008ha had a WDprogenitor, then its progenitor star was not completelydisrupted during the explosion (Foley 2008; Foley et al.2009, 2010a).Although there have been a number of papers
on individual members of this class (Li et al. 2003;Branch et al. 2004; Chornock et al. 2006; Jha et al.2006; Phillips et al. 2007; Sahu et al. 2008; Foley et al.2009, 2010a,c; Valenti et al. 2009; Maund et al.2010; McClelland et al. 2010; Narayan et al. 2011;Kromer et al. 2012), a holistic view of the entire classhas not yet been published. Here we present newdata for several SNe and examine the properties of allknown members of the class, totaling 25 SNe, with theintention of further understanding the relations betweenobservational properties of the class, their progenitorsystems, and their explosions.The manuscript is structured in the following way. Sec-
tion 2 outlines the criteria for membership in the classand details the members of the class. We present previ-ously published and new observations of the SNe in Sec-tion 3. We describe the photometric and spectroscopicproperties of the class in Sections 4 and 5, respectively.In Section 6, we provide estimates of the relative rate ofSNe Iax to normal SNe Ia and the Fe production fromSNe Iax. We summarize the observations and constrainpossible progenitor systems in Section 7, and we concludein Section 8. UT dates are used throughout the paper.
2. MEMBERS OF THE CLASS
SNe have historically been classified spectroscopically(Minkowski 1941), with the presence or absence of par-ticular spectral features being the fundamental distinc-tion between various classes. Occasionally, photometricproperties are used to subclassify various classes (e.g.,SNe IIL and IIP). Recently, the underlying diversity ofSNe combined with the recent surge in discoveries hasblurred clear lines in SN classification.Observational classification has several advantages
over “theoretical” classification. Observational classifi-cation is purely empirical, which has previously linkedphysically unrelated objects. For instance, SNe I usedto be a single class. Even with these potential mistakes,this kind of classification has been exceedingly useful fordetermining the physical underpinnings of stellar explo-sions. On the other hand, ascribing particular theoreti-cal models to perform classification indicates a “correct”model and can hinder further advancements. Here we at-tempt to provide an observational classification schemefor the SN Iax class.The primary motivation of this classification scheme is
to include all SNe physically similar to SN 2002cx with-out including those with significantly different progen-
Type Iax Supernovae 3
4000 4500 5000 5500 6000 6500 7000Rest Wavelength (Å)
0
1
2
3
4
Rela
tive
f λ +
Cons
tant
SN 2009JSmoothed by300 km s−1
Blueshifted by3000 km s−1
SN 2005ccSmoothed by900 km s−1
Blueshifted by3000 km s−1
SN 2008ASmoothed by1800 km s−1
Blueshifted by6000 km s−1
SN 1999aa
Fig. 1.— Spectra of SNe Iax, from lowest to highest ejectavelocity (SNe 2009J, 2005cc, and 2008A, respectively), in com-parison with the high-luminosity SN Ia 1999aa (Li et al. 2001b;Garavini et al. 2004). The black spectra are unaltered. The redspectra are smoothed using a Gaussian filter of 300, 900, and1800 km s−1 for SNe 2009J, 2005cc, and 2008A, respectively. Theblue spectra are the smoothed spectra after being blueshiftedby 3000, 3000, and 6000 km s−1, respectively. The smoothed,blueshifted SN 2009J spectrum is visually similar to the unalteredSN 2005cc spectrum; the smoothed, blueshifted SN 2005cc spec-trum is visually similar to the unaltered SN 2008A spectrum; andthe smoothed, blueshifted SN 2008A spectrum is visually similarto the unaltered SN 1999aa spectrum.
itors or explosion mechanisms; however, further refine-ments may be necessary in the future. We exclusivelyuse observational properties of the SNe to provide theclassification.As noted above, SNe Iax are somewhat spectroscopi-
cally similar to the high-luminosity SN Ia 1991T. Fig-ure 1 shows the near-maximum-brightness spectra ofthree SNe Iax. These SNe have ejecta velocities whichrange from |v| = 2200 to 6900 km s−1. By artifi-cially smoothing the spectra (Blondin & Tonry 2007) tobroaden the spectral features and also blueshifting thespectra, one can produce spectra that are similar to whatone would expect if the SN simply had a higher ejectavelocity. Doing this exercise, one can see the contin-uum from SN 2009J (with |v| = 2200 km s−1) throughSN 2005cc (with |v| = 5200 km s−1) to SN 2008A (with|v| = 6900 km s−1). All SNe Iax seem to have similarcomposition with varying ejecta velocity. SNe Iax alsoappear to be similar to high-luminosity SNe Ia, such asSN 1991T and SN 1999aa (Li et al. 2001b; Garavini et al.2004), near maximum brightness after accounting forejecta velocity. Since the individual narrow lines inSNe Iax are the same lines seen as blends in SNe Ia,identifying features in SNe Iax helps with interpretingSN Ia spectra.
To be a member of the SN Iax class, we require(1) no evidence of hydrogen in any spectrum, (2) amaximum-brightness photospheric velocity lower thanthat of any normal SN Ia at maximum brightness(|v| ! 8000 kms−1), (3) if near-maximum light curvesare available, an absolute magnitude that is low for anormal SN Ia given its light-curve shape (i.e., fallingbelow the WLR for SNe Ia). By the first criterion, weexclude all SNe II and any SN that obviously has ahydrogen envelope. The second criterion will exclude all“normal” SNe Ia, Ib, and Ic, including high-luminosityand low-luminosity SNe Ia similar to SN 1991T(Filippenko et al. 1992b; Phillips et al. 1992) andSN 1991bg (Filippenko et al. 1992a; Leibundgut et al.1993), respectively, as well as the unique SN 2000cx(Li et al. 2001a), SNe similar to SN 2006bt (Foley et al.2010b), SN 2010X (Kasliwal et al. 2010), and ultralumi-nous SNe I (e.g., Pastorello et al. 2010; Quimby et al.2011; Chomiuk et al. 2011). No known core-collapseSN passes these first two criteria. The third crite-rion excludes all “super-Chandrasekhar” SNe Ia (e.g.,Howell et al. 2006), which can have low ejecta velocities,but have high peak luminosities.A final criterion is that the spectra need to be simi-
lar to those of SN 2002cx at comparable epochs. Thislast criterion is somewhat subjective, yet necessary. Itis also a primary criterion, as the first two criteria listedabove naturally result from spectral similarity. We notethat this criterion is no more subjective than the oneused to distinguish between SNe Ia and Ic. However,exclusively using the previously listed criteria for clas-sification would include specific SNe that do not ap-pear to be physically related to SN 2002cx. For in-stance, SN 2005E (Perets et al. 2010) lacks hydrogen,has a low ejecta velocity, and a low luminosity for itslight-curve shape, but is clearly spectroscopically dif-ferent from SN 2002cx at all epochs. SNe 2005E and2008ha have somewhat similar spectra at ∼2 months af-ter maximum brightness. Both have strong [Ca II] andCa II emission, but there are several significant differ-ences including SN 2008ha lacking [O I] (Foley et al.2009). Significant differences in the host-galaxy mor-phologies for SNe similar to SNe 2002cx and 2005E fur-ther suggest that these SNe have significantly differ-ent progenitor systems (Foley et al. 2009; Perets et al.2010). SNe 2002es (Ganeshalingam et al. 2012) andPTF 09dav(Sullivan et al. 2011, which fails our first cri-terion) have low luminosity and low velocities, but alsohave significantly cooler spectra (lacking Fe III and hav-ing strong Ti II features) than SN 2002cx near maximumbrightness.Although SN 2002es and PTF 09dav may bephysically related to the SN 2002cx-like class in the sameway that SN 1991bg is similar to the hotter, more com-mon “Branch-normal SNe Ia” (Branch et al. 1993), wedo not currently link these SNe to SNe Iax. The progen-itor environments of the SN 2002es and PTF 09dav arealso suggestive of older progenitor systems: SN 2002eswas hosted in an S0 galaxy, a fairly unusual host for aSN Iax (Foley et al. 2009), and PTF 09dav was found∼40 kpc from its host, which may indicate a particu-larly old progenitor system, unlike what is inferred forthe majority of SNe Iax. We also exclude SN 2002bj(Poznanski et al. 2010), which is somewhat spectroscop-ically similar to SN 2002cx, but also different in several
4 Foley et al.
ways. Its light curve was extremely fast (∆m15 > 4 mag),yet it was still fairly luminous at peak (M ≈ −18 mag).We consider there to be too many significant differencesto include SN 2002bj in the class. A list of our criteriaand how various SN classes and particular objects passor fail the criteria is presented in Table 1.When applying the criteria to our sample, we note that
three of the four criteria can be determined from a sin-gle spectrum near maximum light. We also note thatthere are no SNe that are spectroscopically similar toSN 2002cx, and also have luminosities equal to or largerthan SNe Ia with the same light-curve shape. There-fore, a single near-maximum-light spectrum appears tobe sufficient for classification. However, because of thespectral similarities with other SNe Ia (except for thelower ejecta velocities; see Figure 1), SNe Iax are easilymistaken as normal SNe Ia in initial classifications. Inparticular, spectral classification software such as SNID(Blondin & Tonry 2007) can easily misclassify a SN Iaxas a SN 1991T-like SN Ia if one does not know the redshiftof the SN or does not restrict the redshift to be the host-galaxy redshift. Misclassification was even more com-mon before the recognition of SN 2002cx as being distinctfrom SNe Ia and before a substantial set of examples wasassembled. We therefore do not believe that our sampleis complete, and it could be significantly incomplete (es-pecially for SNe discovered before 2002). However, theCfA and Berkeley Supernova Ia Program (BSNIP) spec-tral samples have been searched for misclassified SNe Iax(Blondin et al. 2012; Silverman et al. 2012), with BSNIPidentifying one new SN Iax. When determining member-ship in the class, we first examine our own and publisheddata to match the criteria described above. For someobjects, we use data from IAU Circulars and The As-tronomer’s Telegrams. There is no definitively identifiedSN Iax for which we do not have access to previouslypublished data or our own data published here.There are currently 25 known SNe Iax15. Fifteen
of these SNe were considered members of the class byFoley et al. (2009). Since that publication, 6 additionalmembers have been discovered and 4 previously knownSNe have been identified as members. The sample sizeis considerable; the original Type I/II SN classificationand the definition of the SN IIP/IIL, SN IIn, SN IIb, andbroad-lined SN Ic classes were all performed with signifi-cantly fewer members of each class. A list of the membersand some of their basic properties are in Table 2.Below we present details for the SNe. For additional
information, see Foley et al. (2009), references therein,and the references listed for each SN below.
2.1. SN 1991bj
SN 1991bj is the oldest known member of the class,although it has only recently been identified as a member(Foley et al. 2009). It was originally classified as a SN Iaby two separate teams (Pollas et al. 1992). Gomez et al.(1996) presented a spectrum of SN 1991bj and noted itslow ejecta velocity. Stanishev et al. (2007) first identified
15 In the final stages of the preparation of this manuscript,LSQ12fhs, SN 2006ct, and PS1-12bwh were identified as poten-tial SNe Iax. At the time of publication, we had not verified theclassifications (Copin et al. 2012; Quimby et al. 2012; Wright et al.2012).
4000 5000 6000 7000 8000Rest Wavelength (Å)
0.0
0.2
0.4
0.6
0.8
1.0
Rela
tive
f λ
SN 1999axSN 2002cx +17 d
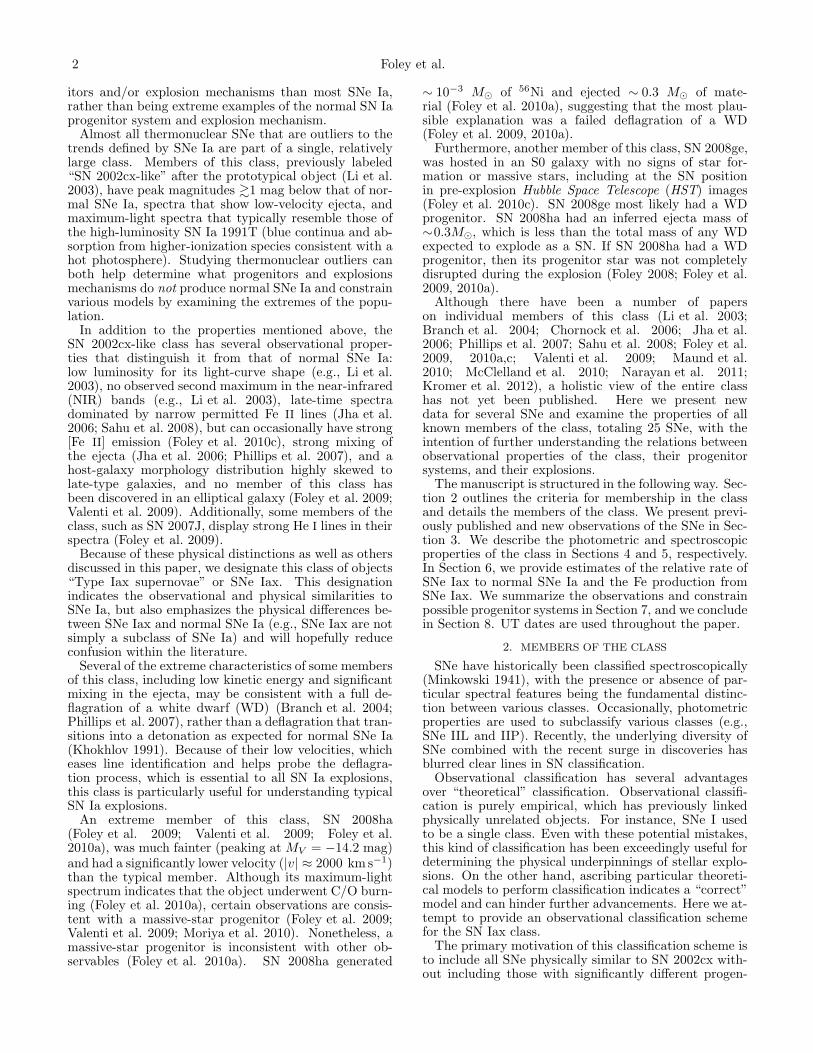
Fig. 2.— Spectra of SN 1999ax (black) and SN 2002cx (red).Both spectra have been divided by a fifth-order polynomial to re-move the poor flux calibration of the SN 1999ax spectrum and tomake an appropriate comparison. The rest-frame phase relative toV maximum is marked for SN 2002cx.
SN 1991bj as a possible SN Iax. Foley et al. (2009) useda Lick spectrum obtained by A. V. Filippenko to classifySN 1991bj as a SN Iax.
2.2. SN 1999ax
SN 1999ax was discovered by the Wise Observa-tory Optical Transient Search (WOOTS; Gal-Yam et al.2008) in the field of Abell 1852, which has a redshiftz = 0.181 (Gal-Yam & Maoz 1999). Spectra of the SNsuggested that SN 1999ax was a SN Ia at z ≈ 0.05(Gal-Yam et al. 2000). A spectrum was also presented byGal-Yam et al. (2008), where they used template match-ing to find z ≈ 0.05.16
However, an SDSS spectrum revealed that its hostgalaxy, SDSS J140358.27+155101.2, is at z = 0.023(Abazajian et al. 2009). We obtained the spectrum ofSN 1999ax from 6 April 1999,17 but its flux calibrationdoes not appear to be correct. To make a comparison toother SNe, we divided the flux by a fifth-order polyno-mial and compared the resulting spectrum to other SNspectra that were similarly modified. Using the SDSSredshift and correcting the flux, it is clear that SN 1999axis similar to SN 2002cx (see Figure 2).This is the first time that SN 1999ax has been consid-
ered a member of the SN Iax class.
2.3. SN 2002bp
SN 2002bp was discovered by the Puckett ObservatorySupernova Search (POSS; Puckett & Langoussis 2002),but remained unclassified for several years. Finally, whileanalyzing the large BSNIP sample of SN Ia spectra,Silverman et al. (2012) determined that SN 2002bp wassimilar to SN 2008ha, another member of this class.
16 Gal-Yam et al. (2008) also note that their spectrum ofSN 1999ax is “somewhat peculiar,” but do not expand further sinceit was not the focus of their study.
17 Spectra are available athttp://www.physto.se/∼snova/private/near-z/spectroscopy/reduced data/.
Type Iax Supernovae 5
TABLE 1Classification Criteria for SNe Iax
SN Class Has Hydrogen? |v| ! 8000 km s−1? Low L for LC Shape Spec. like SN 2002cx
SN Iax N Y Y Y
SN II Y Some N/A NSN Ib/c N N Y NSLSN I N Y N NNormal SN Ia N N N NSuper-Chandra N Y N NSN 1991T N N N SomewhatSN 1991bg N N N NSN 2000cx N N Y NSN 2002bj N Y N SomewhatSN 2002es N Y Y SomewhatSN 2002ic Y N N NSN 2005E N Y Y NSN 2006bt N N Y NSN 2010X N N Y NPTF 09dav Y Y Y Somewhat
TABLE 2Properties of SNe Iax
SN R.A. Dec. Refs. tmax(V ) MV ,peak ∆m15(V ) vpeak He?Name (J2000) (J2000) (JD − 2,450,000) (mag) (mag) ( km s−1)
1991bj 03:41:30.47 −04:39:49.5 1,2,3 · · · ! −15.4 · · · · · · N1999ax 14:03:57.92 +15:51:09.2 4,5 · · · ! −16.4 · · · · · · N2002bp 11:19:18.20 +20:48:23.1 6 · · · ! −16.1 · · · · · · N2002cx 13:13:49.72 +06:57:31.9 7,8,9 2418.31 −17.63 0.84 −5600 N2003gq 22:53:20.68 +32:07:57.6 9,10 2852.56 −17.29 0.98 −5200 N2004cs 17:50:14.38 +14:16:59.5 4,11 ∼3185 ∼ −16.2 ∼1.4 · · · Y2004gw 05:08:48.41 +62:26:20.7 1,12,13 · · · ! −16.4 · · · · · · N2005P 14:06:34.01 −05:27:42.6 4,9,14 · · · ! −15.3 · · · · · · N2005cc 13:57:04.85 +41:50:41.8 15,16 3522.10 −16.48 0.97 −5000 N2005hk 00:27:50.89 −01:11:53.3 17,18,19 3689.81 −18.37 0.92 −4500 N2006hn 11:07:18.67 +76:41:49.8 1,20,21 >3895.0 < −17.7 · · · · · · N2007J 02:18:51.70 +33:43:43.3 1,4,22,23 4075.7–4114.3 ! −15.4 · · · · · · Y2007ie 22:17:36.69 +00:36:48.0 25,26 <4348.5 ∼ −18.2 · · · · · · N2007qd 02:09:33.56 −01:00:02.2 24 4353.9–4404.4 · · · · · · · · · N2008A 01:38:17.38 +35:22:13.7 16,27,28,29 4483.61 −18.46 0.82 −6400 N2008ae 09:56:03.20 +10:29:58.8 4,27,30,31 4513.52 −17.67 0.94 −6100 N2008ge 04:08:24.68 −47:53:47.4 14 4725.77 −17.60 0.34 · · · N2008ha 23:34:52.69 +18:13:35.4 1,32,33 4785.24 −14.19 1.22 −3200 N2009J 05:55:21.13 −76:55:20.8 4,34 >4836.6 ! −16.6 · · · −2200 N2009ku 03:29:53.23 −28:05:12.2 35,36 · · · −18.94 0.38 · · · N2010ae 07:15:54.65 −57:20:36.9 4,37 >5244.6 ! −14.9 · · · · · · N2010el 04:19:58.83 −54:56:38.5 38 >5350.6 ! −14.8 · · · · · · N2011ay 07:02:34.06 +50:35:25.0 4,39 5651.81 −18.40 0.75 −5600 N2011ce 18:55:35.84 −53:43:29.1 4,40 5658–5668 −17.8 – −18.9 0.4 – 1.3 · · · N2012Z 03:22:05.35 −15:23:15.6 4,41 >5955.7 ! −16.8 · · · · · · N
References. — 1 = Foley et al. (2009), 2 = Gomez et al. (1996), 3 = Stanishev et al. (2007), 4 = This Paper, 5 =Gal-Yam et al. (2008), 6 = Silverman et al. (2012), 7 = Li et al. (2003), 8 = Branch et al. (2004), 9 = Jha et al. (2006),10 = Filippenko & Chornock (2003), 11 = Rajala et al. (2005), 12 = Foley & Filippenko (2005), 13 = Filippenko & Foley(2005), 14 = Foley et al. (2010c), 15 = Antilogus et al. (2005), 16 = Ganeshalingam et al. (2010), 17 = Chornock et al. (2006),18 = Phillips et al. (2007), 19 = Sahu et al. (2008), 20 = Foley et al. (2006), 21 = Hicken et al. (2009), 22 = Filippenko et al.(2007a), 23 = Filippenko et al. (2007b), 24 = McClelland et al. (2010), 25 = Bassett et al. (2007b), 26 = Ostman et al. (2011),27 = Blondin & Berlind (2008), 28 = Hicken et al. (2012), 29 = McCully et al., in preparation, 30 = Blondin & Calkins (2008),31 = Milne et al. (2010), 32 = Foley et al. (2010a), 33 = Valenti et al. (2009), 34 = Stritzinger (2009), 35 = Rest et al. (2009),36 = Narayan et al. (2011), 37 = Stritzinger et al. (2010b), 38 = Bessell et al. (2010), 39 = Silverman et al. (2011a), 40 =Anderson & Morrell (2011), 41 = Cenko et al. (2012).
2.4. SN 2002cx
SN 2002cx was the first SN in this class recognized asbeing peculiar and is its namesake. Wood-Vasey et al.(2002) discovered SN 2002cx on 12 May 2002. Basicobservational information derived from near-maximumdata were originally presented by Li et al. (2003). Thephotometric data were re-evaluated by Phillips et al.(2007). Late-time spectra were presented by Jha et al.(2006). Branch et al. (2004) performed a detailed spec-
tral analysis of its maximum-light spectra.
2.5. SN 2003gq
SN 2003gq was independently discovered(Graham et al. 2003; Puckett et al. 2003) by theLick Observatory Supernova Search (LOSS; Li et al.2000; Filippenko et al. 2001) and POSS. It was originallyclassified as a SN Ia by Filippenko et al. (2003) andwas later revised as a SN Iax (Filippenko & Chornock2003). As part of the LOSS photometric follow-up effort,
6 Foley et al.
4000 5000 6000 7000 8000 9000Rest Wavelength (Å)
0.0
0.2
0.4
0.6
0.8
1.0
Rela
tive
f λ
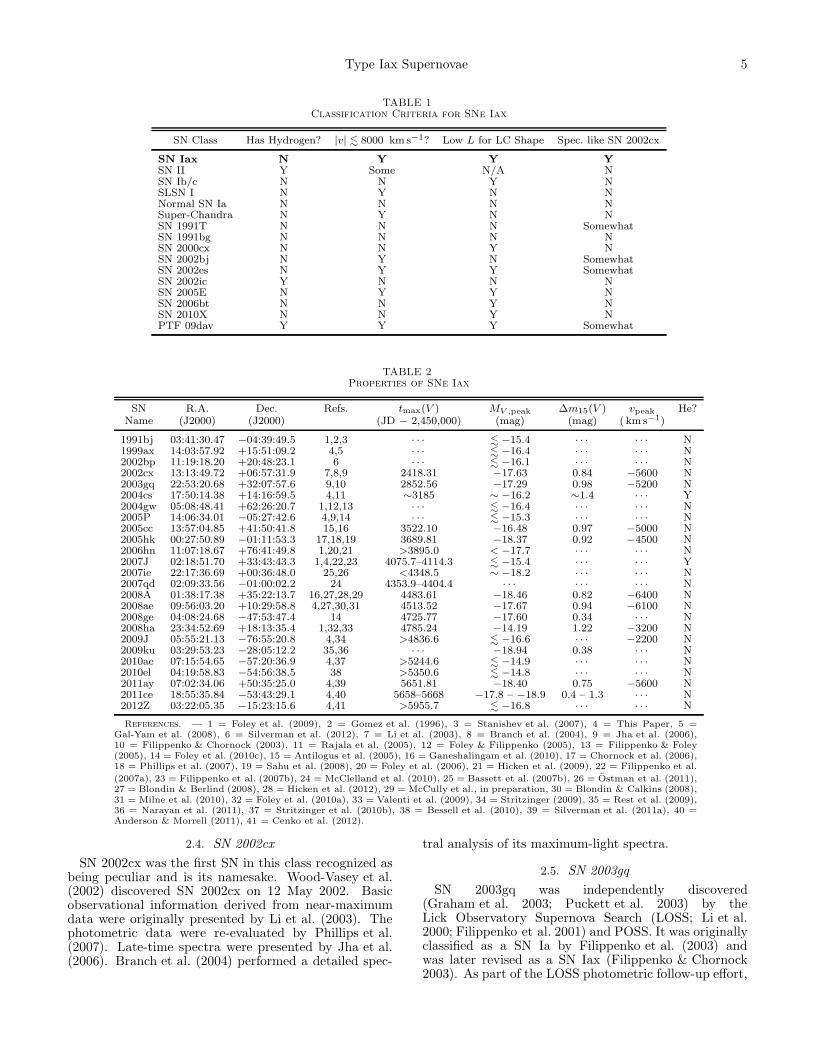
SN 2004cs +42 dSN 2007J
He I
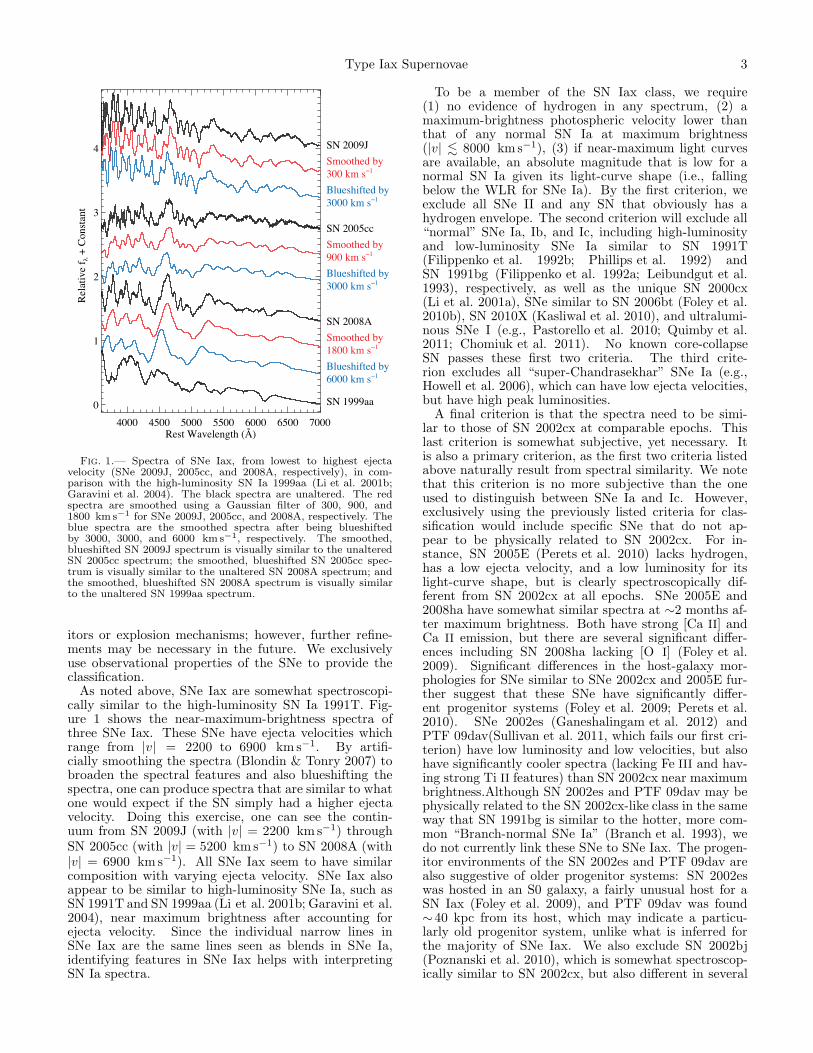
Fig. 3.— Spectra of SN 2004cs (black) and SN 2007J (red). Theapproximate rest-frame phase relative to V maximum is markedfor SN 2004cs.
filtered photometry of SN 2003gq was obtained and pre-sented by Ganeshalingam et al. (2010). Blondin et al.(2012) presented a spectrum of SN 2003gq.
2.6. SN 2004cs
Li et al. (2004) discovered SN 2004cs as part of LOSS.Rajala et al. (2005) presented its spectrum and classifiedit as a SN IIb, identifying both Hα and strong He I fea-tures. We obtained this spectrum (via D. Leonard), andshow a comparison of SNe 2004cs and 2007J in Figure 3.Both SNe are very similar, and SN 2004cs clearly hasHe I features. However, we do not identify Hα in thespectrum; there are clear residuals from galaxy subtrac-tion at the position of Hα, but the peak of the feature isalso blueward of Hα. SN 2007J was identified as a mem-ber of the SN Iax class, but showed He I lines (Foley et al.2009). SN 2004cs demonstrates that there is more thanone member of this class that exhibits He in its spectrum.This is the first time that SN 2004cs has been consid-
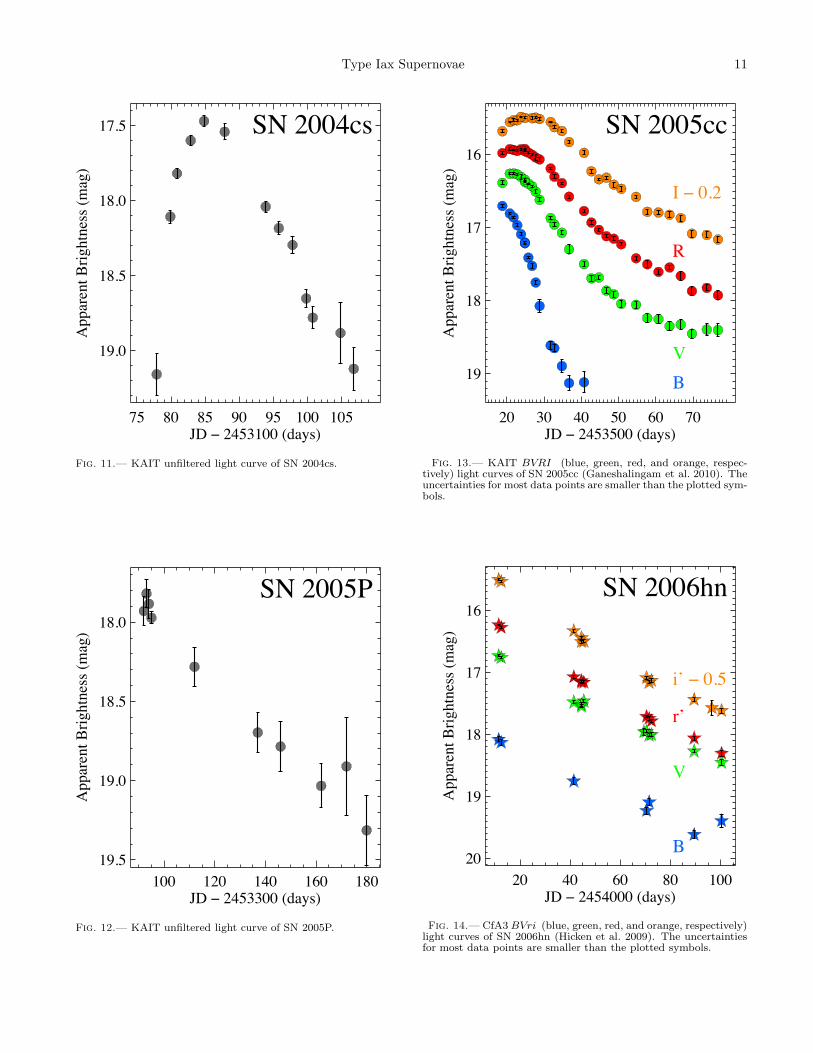
ered a SN Iax. In Section 3.1, we present a previously un-published unfiltered light curve obtained with the robotic0.76 m Katzman Automatic Imaging Telescope (KAIT;Filippenko et al. 2001) at Lick Observatory.
2.7. SN 2004gw
SN 2004gw was discovered by POSS on 29 December2004 (Puckett & Ireland 2004). Gal-Yam (2005) origi-nally classified it as a SN I with some indications thatit was of Type Ic. Foley & Filippenko (2005) suggestedthat it was a SN Ia which “exhibits a number of spec-tral peculiarities.” Filippenko & Foley (2005) later con-firmed that it was of Type Ia. Finally, with the aid ofa larger comparison sample, Foley et al. (2009) showedthat SN 2004gw was a SN Iax.
2.8. SN 2005P
SN 2005P was discovered by LOSS on 21 January 2005(Burket & Li 2005b). Visual inspection of unpublisheddata taken on 22 January 2005 by Schmidt & Salvo(private communication) indicates that it is a SN Iax.The SN remained unclassified in the literature for over
a year. Based on a late-time spectrum, Jha et al. (2006)classified it as a SN Iax. Foley et al. (2010c) later sug-gested that SN 2005P was spectroscopically most similarto SN 2008ge having a late-time spectrum with relativelybroad lines and relatively strong forbidden Fe lines. Wepresent a previously unpublished KAIT unfiltered lightcurve in Section 3.1.
2.9. SN 2005cc
SN 2005cc was discovered by POSS on 19 May 2005(Puckett et al. 2005). Several spectra indicated that itwas a young SN similar to SN 2002cx (Antilogus et al.2005). As a part of the LOSS photometric follow-upeffort, filtered photometry of SN 2005cc was obtainedand presented by Ganeshalingam et al. (2010). Spectraof SN 2005cc were presented by Blondin et al. (2012).
2.10. SN 2005hk
SN 2005hk, which was independently discoveredby both LOSS (Burket & Li 2005a) and SDSS-II(Barentine et al. 2005), is the best-observed SN Iax.Phillips et al. (2007) and Sahu et al. (2008) presented ex-tensive data near maximum brightness. Kromer et al.(2012) presented NIR spectra and late-time photometryof SN 2005hk, while Sahu et al. (2008) and Valenti et al.(2009) published late-time spectra. Chornock et al.(2006) and Maund et al. (2010) showed spectropolari-metric observations indicating that SN 2005hk had lowpolarization near maximum brightness. Late-time spec-troscopy and HST photometry will be presented by Mc-Cully et al. (in preparation).
2.11. SN 2006hn
POSS discovered SN 2006hn on 28 September 2006(Sehgal et al. 2006). Foley et al. (2006) classifiedSN 2006hn as a SN Ia, and Foley et al. (2009) noted thatit was a SN Iax. Photometry of SN 2006hn was publishedas part of the CfA3 data release (Hicken et al. 2009).
2.12. SN 2007J
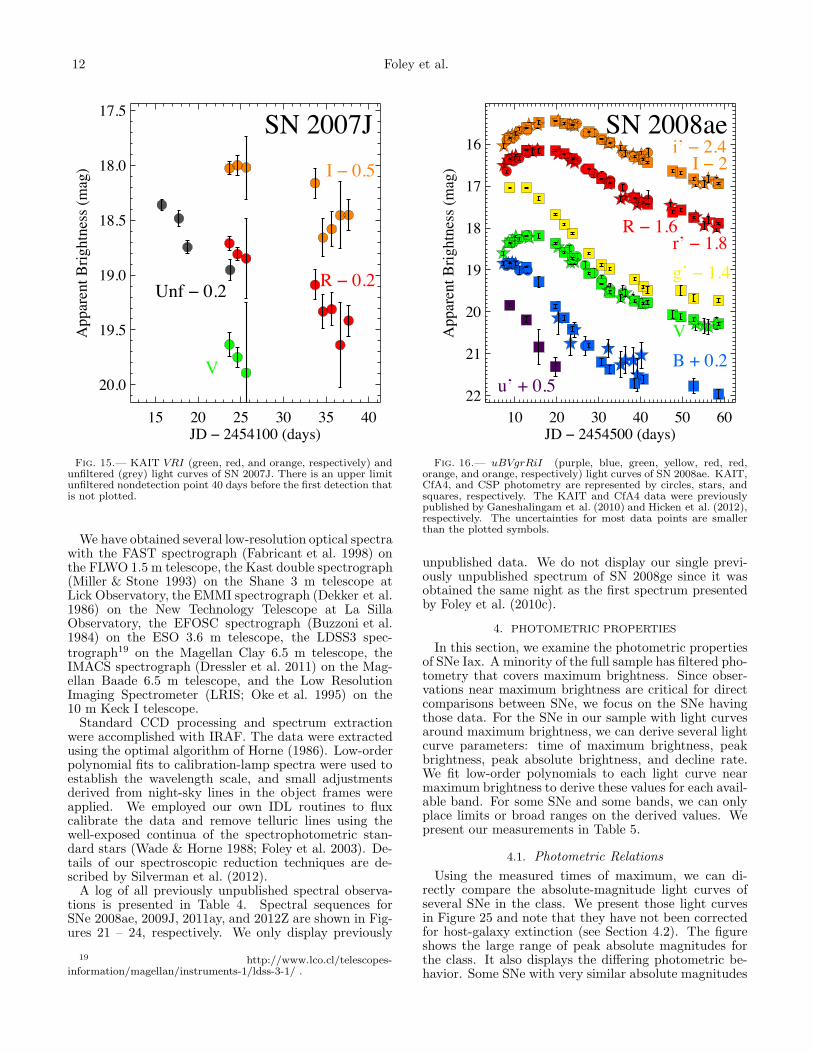
SN 2007J, which was independently discovered by bothLOSS and POSS (Lee et al. 2007), was the first knownmember of the SN Iax class to display He I lines. Ini-tially, these lines were weak, and SN 2007J appeared tobe very similar to SN 2002cx (Filippenko et al. 2007a);however, the He I lines became stronger with time, caus-ing Filippenko et al. (2007b) to reclassify SN 2007J asa peculiar SN Ib. Foley et al. (2009) re-examined thespectra, showing that besides the He I lines, SN 2007J isindeed very similar to SN 2002cx. We therefore considerSN 2007J to be a peculiar SN Iax. We present previouslyunpublished KAIT filtered and unfiltered light curves inSection 3.1.
2.13. SN 2007ie
SN 2007ie was discovered by SDSS-II (Bassett et al.2007b), who also classified it as a probable SN Ia.Ostman et al. (2011) presented a spectrum of SN 2007ieand indicated that it was a probable SN Iax. They notedthe low velocity and spectral similarities to SNe 2002cxand 2005hk, but allowed the possibility that it was anormal SN Ia. However, restricting the redshift of the
Type Iax Supernovae 7
4000 5000 6000 7000 8000Rest Wavelength (Å)
0.0
0.2
0.4
0.6
0.8
1.0
Rela
tive
f λ
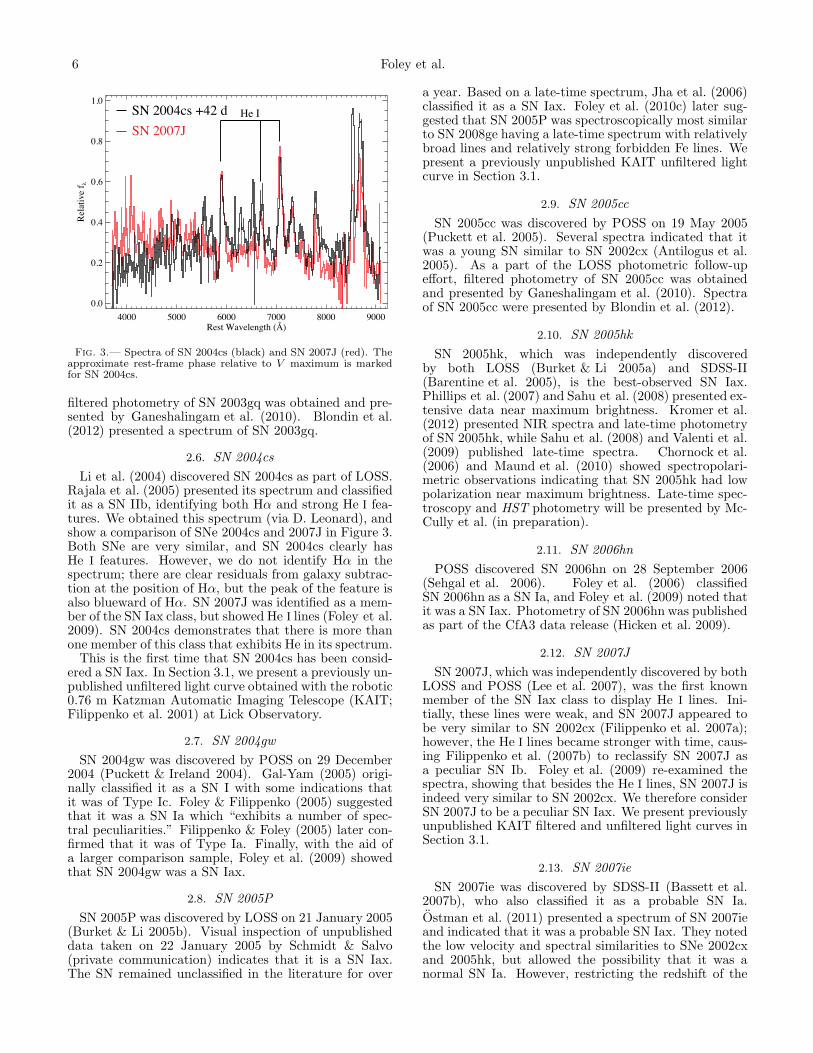
SN 2007ieSN 2002cx +17 d
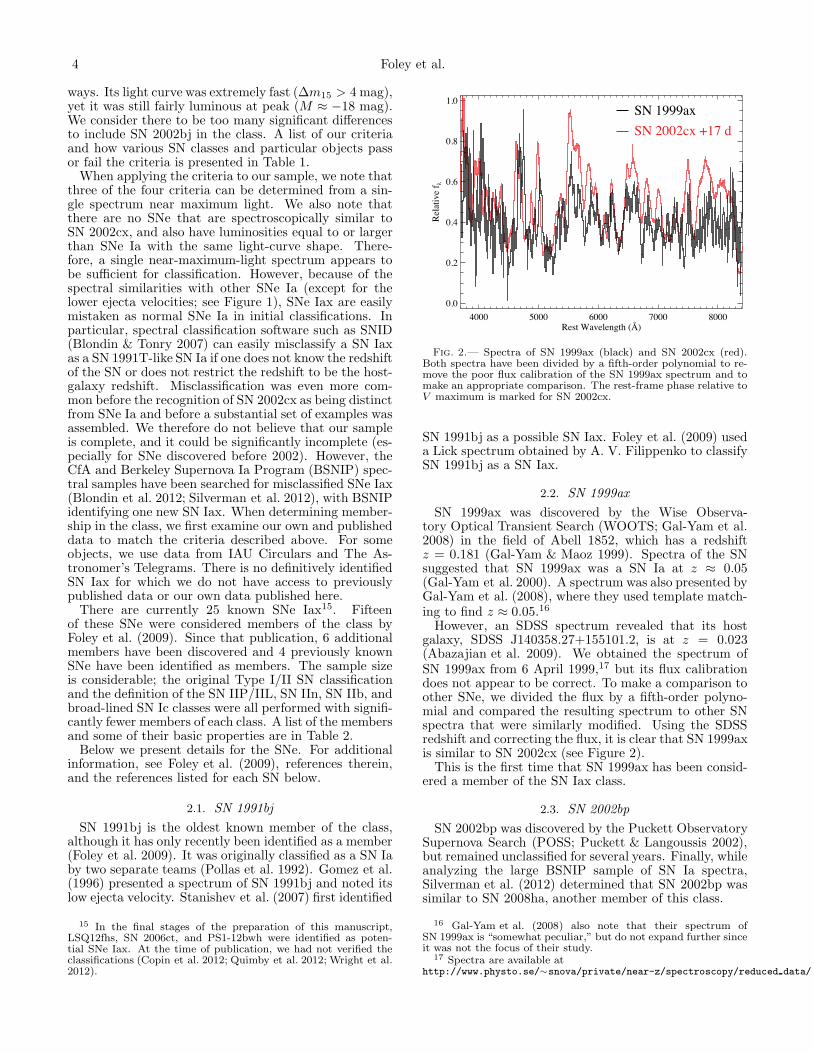
Fig. 4.— Spectra of SN 2007ie (black; galaxy subtracted) andSN 2002cx (red). The rest-frame phase relative to V maximum ismarked for SN 2002cx.
comparison spectra to that of SN 2007ie, only SNe Iaxprovide reasonable matches. Additionally, the peak mag-nitude is M ≈ −18.2 mag, similar to that of SN 2002cx,although the peak of the light curve was not covered intheir photometry. Figure 4 shows the galaxy-subtractedspectrum of SN 2007ie compared to SN 2002cx. We con-sider SN 2007ie to be a clear member of the SN Iax class.
2.14. SN 2007qd
SN 2007qd was discovered by SDSS-II (Bassett et al.2007a). It is a relatively faint SN Iax with ejectavelocity between those of SNe 2002cx and 2008ha(McClelland et al. 2010). McClelland et al. (2010) usedobservations of SNe 2002cx, 2005hk, 2007qd, and 2008hato argue that there was a relationship between ejectavelocity and peak absolute magnitude for SNe Iax.Narayan et al. (2011) showed that SN 2009ku was aprominent outlier to this trend.
2.15. SN 2008A
SN 2008A was discovered on 2 January 2008 byNakano et al. (2008). It was classified as a SN Iax byBlondin & Berlind (2008). As a part of the LOSS photo-metric follow-up effort, filtered photometry of SN 2008Awas obtained and presented by Ganeshalingam et al.(2010). Photometry of SN 2008A was also published aspart of the CfA4 data release (Hicken et al. 2012). TheSN was observed photometrically by Swift; (Milne et al.2010) found that SNe Iax have very blue UV colors rela-tive to normal SNe Ia. Spectroscopy and late-time HSTphotometry will be presented by McCully et al. (in prepa-ration). Blondin et al. (2012) presented several spectraof SN 2008A.
2.16. SN 2008ae
POSS discovered SN 2008ae on 9 February 2008(Sostero et al. 2008). Blondin & Calkins (2008) clas-sified it as a SN Iax, and they further note thatSN 2008ae is relatively luminous (M < −17.7 mag)a few days before maximum brightness. Optical andUV photometry of SN 2008ae was also published as
part of the CfA4 data release (Hicken et al. 2012) andthe Swift photometry compilation (Milne et al. 2010),respectively. Blondin et al. (2012) presented severalspectra of SN 2008ae. We present previously unpub-lished KAIT and Carnegie Supernova Project (CSP)light curves in Section 3.1.
2.17. SN 2008ge
SN 2008ge was very nearby and bright. It was dis-covered by CHASE (Pignata et al. 2008) well past max-imum brightness, but CHASE had several pre-discoveryimages from which a light curve could be generated. Itshost galaxy, NGC 1527, is an S0 galaxy with no signs ofstar formation to deep limits (< 7.2 × 10⁻³ M⊙ yr−1;Foley et al. 2010c). It was also imaged by HST beforeSN 2008ge occurred, and analysis showed that there wereno massive stars near the SN site or any indication of starformation in the host galaxy (Foley et al. 2010c).SN 2008ge had a relatively broad light curve and (un-
like SNe 2002cx and 2005hk) strong [Fe II] emission linesin its late-time spectra (Foley et al. 2010c). The lack ofmassive stars near the SN site, the strict limit on the star-formation rate, and the presumably large generated 56Nimass all suggest a WD progenitor (Foley et al. 2010c).
2.18. SN 2008ha
SN 2008ha is an extreme SN Iax, being less luminousthan any other member and having lower ejecta veloc-ity than most members of the class (Foley et al. 2009,2010a; Valenti et al. 2009). It was discovered by POSS(Puckett et al. 2008).Several studies have been devoted to SN 2008ha
(Foley et al. 2009, 2010a; Valenti et al. 2009), and de-tails of the SN are presented in those works. Notably, thetotal inferred ejecta mass is significantly below the Chan-drasekhar mass. Although SN 2008ha may have had amassive-star progenitor (Foley et al. 2009; Valenti et al.2009), carbon/oxygen burning products in its maximum-light spectrum, and the energy/ejecta mass balancingnecessary to create a low-velocity, low-luminosity SN likeSN 2008hamake that scenario unlikely (Foley et al. 2009,2010a).
2.19. SN 2009J
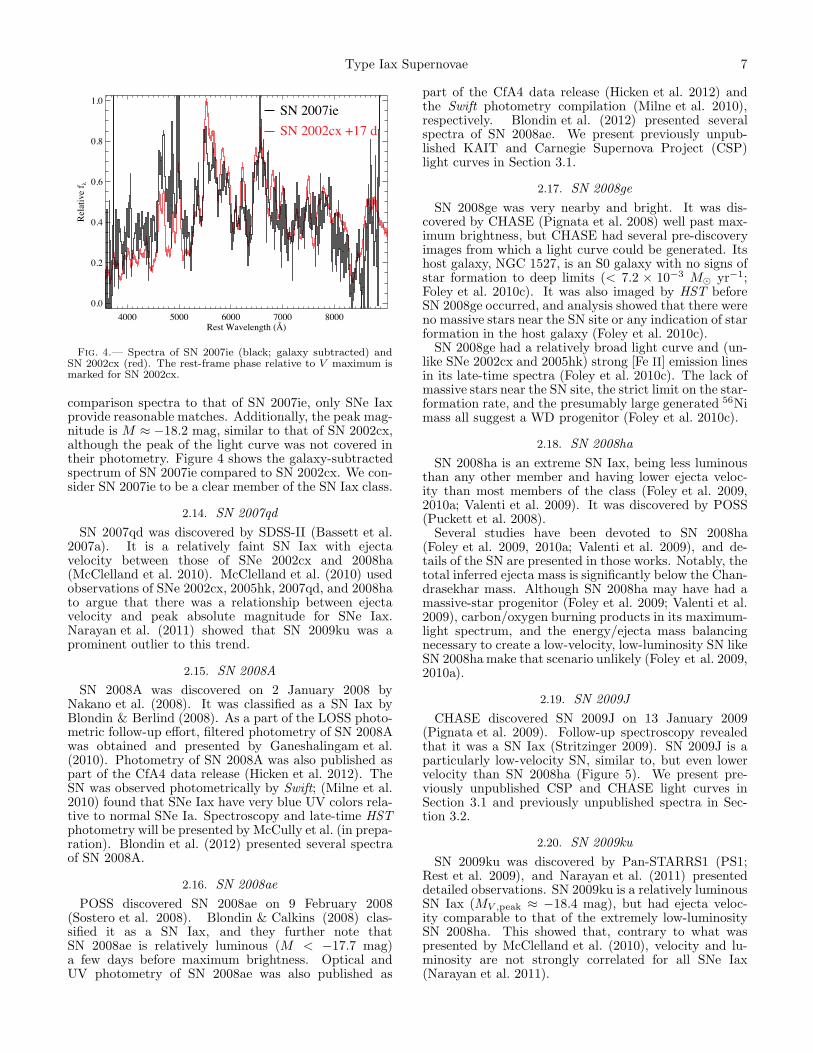
CHASE discovered SN 2009J on 13 January 2009(Pignata et al. 2009). Follow-up spectroscopy revealedthat it was a SN Iax (Stritzinger 2009). SN 2009J is aparticularly low-velocity SN, similar to, but even lowervelocity than SN 2008ha (Figure 5). We present pre-viously unpublished CSP and CHASE light curves inSection 3.1 and previously unpublished spectra in Sec-tion 3.2.
2.20. SN 2009ku
SN 2009ku was discovered by Pan-STARRS1 (PS1;Rest et al. 2009), and Narayan et al. (2011) presenteddetailed observations. SN 2009ku is a relatively luminousSN Iax (MV ,peak ≈ −18.4 mag), but had ejecta veloc-ity comparable to that of the extremely low-luminositySN 2008ha. This showed that, contrary to what waspresented by McClelland et al. (2010), velocity and lu-minosity are not strongly correlated for all SNe Iax(Narayan et al. 2011).
8 Foley et al.
4000 5000 6000 7000 8000Rest Wavelength (Å)
0.0
0.2
0.4
0.6
0.8
1.0
Rela
tive
f λ
SN 2009J +0.2 dSN 2008ha −3.2 d
Fig. 5.— Spectra of SN 2009J (black) and SN 2008ha (red). Therest-frame phase relative to V maximum is marked for both SNe.
4000 5000 6000 7000 8000Rest Wavelength (Å)
0.0
0.2
0.4
0.6
0.8
1.0
Rela
tive
f λ
SN 2010aeSN 2008ha −3.2 d
Fig. 6.— Spectra of SN 2010ae (black) and SN 2008ha (red).Although the continua have different shapes, the spectral featuresare similar. The rest-frame phase relative to V maximum is markedfor SN 2008ha.
2.21. SN 2010ae
SN 2010ae was discovered on 23 February 2010 inESO 162-G017 (Pignata et al. 2010). Stritzinger et al.(2010a) originally classified it as a peculiar SN Iasimilar to the possible “super-Chandrasekhar”SN 2006gz (Hicken et al. 2007). Using additional data,Stritzinger et al. (2010b) determined that SN 2010aewas most similar to SN 2008ha. In Figure 6, wepresent a spectrum at an epoch similar to those fromStritzinger et al. (2010b) that shows this similarity toSN 2008ha (although with a slightly different continuumshape). A full analysis of SN 2010ae will be presentedby Stritzinger et al. (in prep.).
2.22. SN 2010el
SN 2010el was discovered on 19 June 2010 in NGC 1566(Monard 2010). Bessell et al. (2010) determined that
4000 5000 6000 7000 8000 9000Rest Wavelength (Å)
0.0
0.2
0.4
0.6
0.8
1.0
Rela
tive
f λ
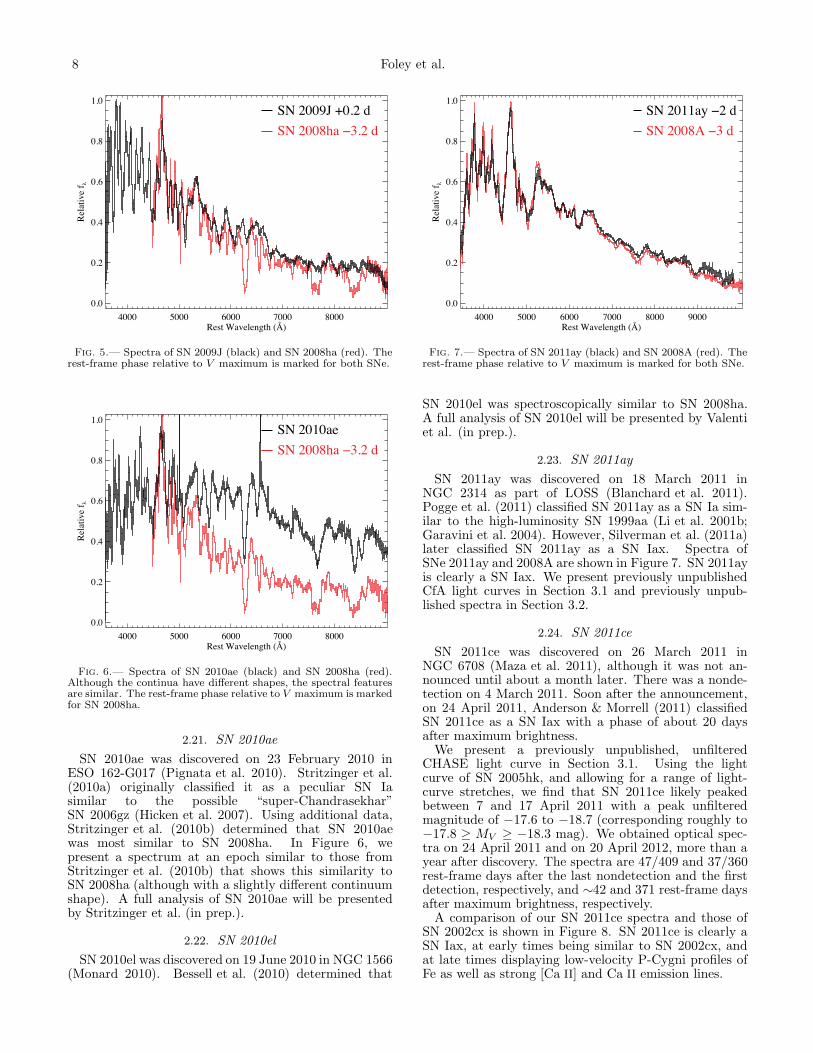
SN 2011ay −2 dSN 2008A −3 d
Fig. 7.— Spectra of SN 2011ay (black) and SN 2008A (red). Therest-frame phase relative to V maximum is marked for both SNe.
SN 2010el was spectroscopically similar to SN 2008ha.A full analysis of SN 2010el will be presented by Valentiet al. (in prep.).
2.23. SN 2011ay
SN 2011ay was discovered on 18 March 2011 inNGC 2314 as part of LOSS (Blanchard et al. 2011).Pogge et al. (2011) classified SN 2011ay as a SN Ia sim-ilar to the high-luminosity SN 1999aa (Li et al. 2001b;Garavini et al. 2004). However, Silverman et al. (2011a)later classified SN 2011ay as a SN Iax. Spectra ofSNe 2011ay and 2008A are shown in Figure 7. SN 2011ayis clearly a SN Iax. We present previously unpublishedCfA light curves in Section 3.1 and previously unpub-lished spectra in Section 3.2.
2.24. SN 2011ce
SN 2011ce was discovered on 26 March 2011 inNGC 6708 (Maza et al. 2011), although it was not an-nounced until about a month later. There was a nonde-tection on 4 March 2011. Soon after the announcement,on 24 April 2011, Anderson & Morrell (2011) classifiedSN 2011ce as a SN Iax with a phase of about 20 daysafter maximum brightness.We present a previously unpublished, unfiltered
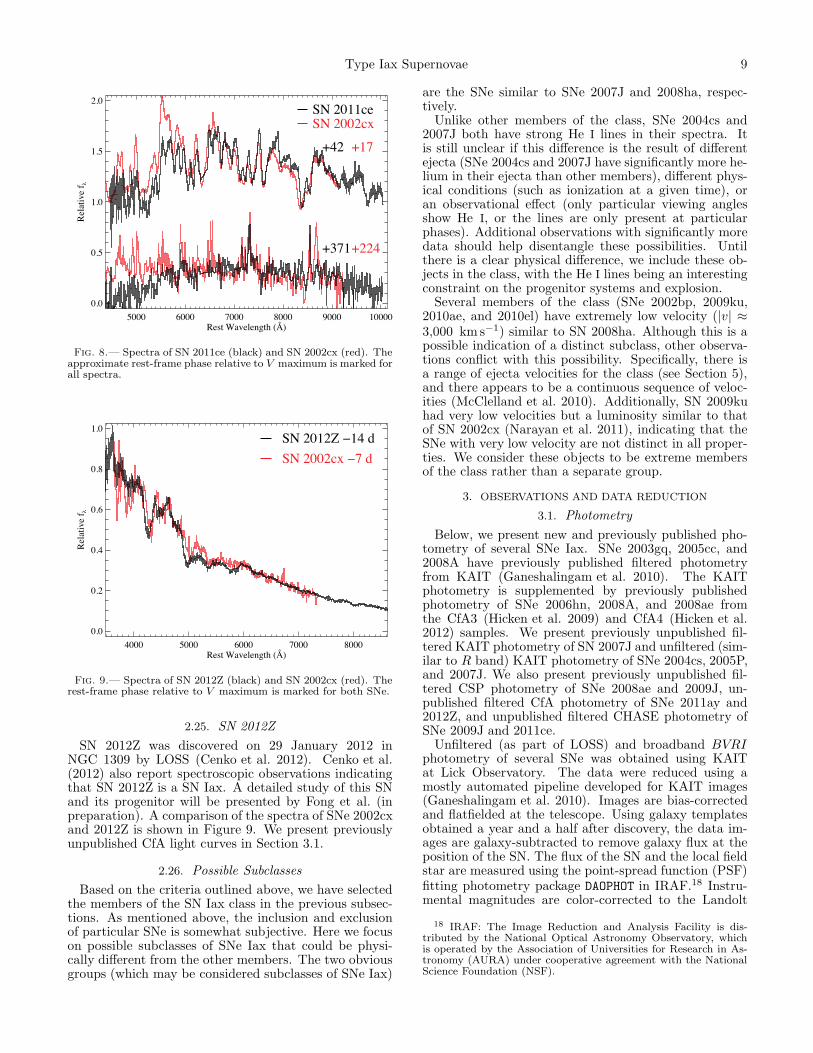
CHASE light curve in Section 3.1. Using the lightcurve of SN 2005hk, and allowing for a range of light-curve stretches, we find that SN 2011ce likely peakedbetween 7 and 17 April 2011 with a peak unfilteredmagnitude of −17.6 to −18.7 (corresponding roughly to−17.8 ≥ MV ≥ −18.3 mag). We obtained optical spec-tra on 24 April 2011 and on 20 April 2012, more than ayear after discovery. The spectra are 47/409 and 37/360rest-frame days after the last nondetection and the firstdetection, respectively, and ∼42 and 371 rest-frame daysafter maximum brightness, respectively.A comparison of our SN 2011ce spectra and those of
SN 2002cx is shown in Figure 8. SN 2011ce is clearly aSN Iax, at early times being similar to SN 2002cx, andat late times displaying low-velocity P-Cygni profiles ofFe as well as strong [Ca II] and Ca II emission lines.
Type Iax Supernovae 9
5000 6000 7000 8000 9000 10000Rest Wavelength (Å)
0.0
0.5
1.0
1.5
2.0
Rela
tive
f λ
SN 2011ceSN 2002cx
+42 +17
+371+224
Fig. 8.— Spectra of SN 2011ce (black) and SN 2002cx (red). Theapproximate rest-frame phase relative to V maximum is marked forall spectra.
4000 5000 6000 7000 8000Rest Wavelength (Å)
0.0
0.2
0.4
0.6
0.8
1.0
Rela
tive
f λ
SN 2012Z −14 dSN 2002cx −7 d
Fig. 9.— Spectra of SN 2012Z (black) and SN 2002cx (red). Therest-frame phase relative to V maximum is marked for both SNe.
2.25. SN 2012Z
SN 2012Z was discovered on 29 January 2012 inNGC 1309 by LOSS (Cenko et al. 2012). Cenko et al.(2012) also report spectroscopic observations indicatingthat SN 2012Z is a SN Iax. A detailed study of this SNand its progenitor will be presented by Fong et al. (inpreparation). A comparison of the spectra of SNe 2002cxand 2012Z is shown in Figure 9. We present previouslyunpublished CfA light curves in Section 3.1.
2.26. Possible Subclasses
Based on the criteria outlined above, we have selectedthe members of the SN Iax class in the previous subsec-tions. As mentioned above, the inclusion and exclusionof particular SNe is somewhat subjective. Here we focuson possible subclasses of SNe Iax that could be physi-cally different from the other members. The two obviousgroups (which may be considered subclasses of SNe Iax)
are the SNe similar to SNe 2007J and 2008ha, respec-tively.Unlike other members of the class, SNe 2004cs and
2007J both have strong He I lines in their spectra. Itis still unclear if this difference is the result of differentejecta (SNe 2004cs and 2007J have significantly more he-lium in their ejecta than other members), different phys-ical conditions (such as ionization at a given time), oran observational effect (only particular viewing anglesshow He I, or the lines are only present at particularphases). Additional observations with significantly moredata should help disentangle these possibilities. Untilthere is a clear physical difference, we include these ob-jects in the class, with the He I lines being an interestingconstraint on the progenitor systems and explosion.Several members of the class (SNe 2002bp, 2009ku,
2010ae, and 2010el) have extremely low velocity (|v| ≈3,000 km s−1) similar to SN 2008ha. Although this is apossible indication of a distinct subclass, other observa-tions conflict with this possibility. Specifically, there isa range of ejecta velocities for the class (see Section 5),and there appears to be a continuous sequence of veloc-ities (McClelland et al. 2010). Additionally, SN 2009kuhad very low velocities but a luminosity similar to thatof SN 2002cx (Narayan et al. 2011), indicating that theSNe with very low velocity are not distinct in all proper-ties. We consider these objects to be extreme membersof the class rather than a separate group.
3. OBSERVATIONS AND DATA REDUCTION
3.1. Photometry
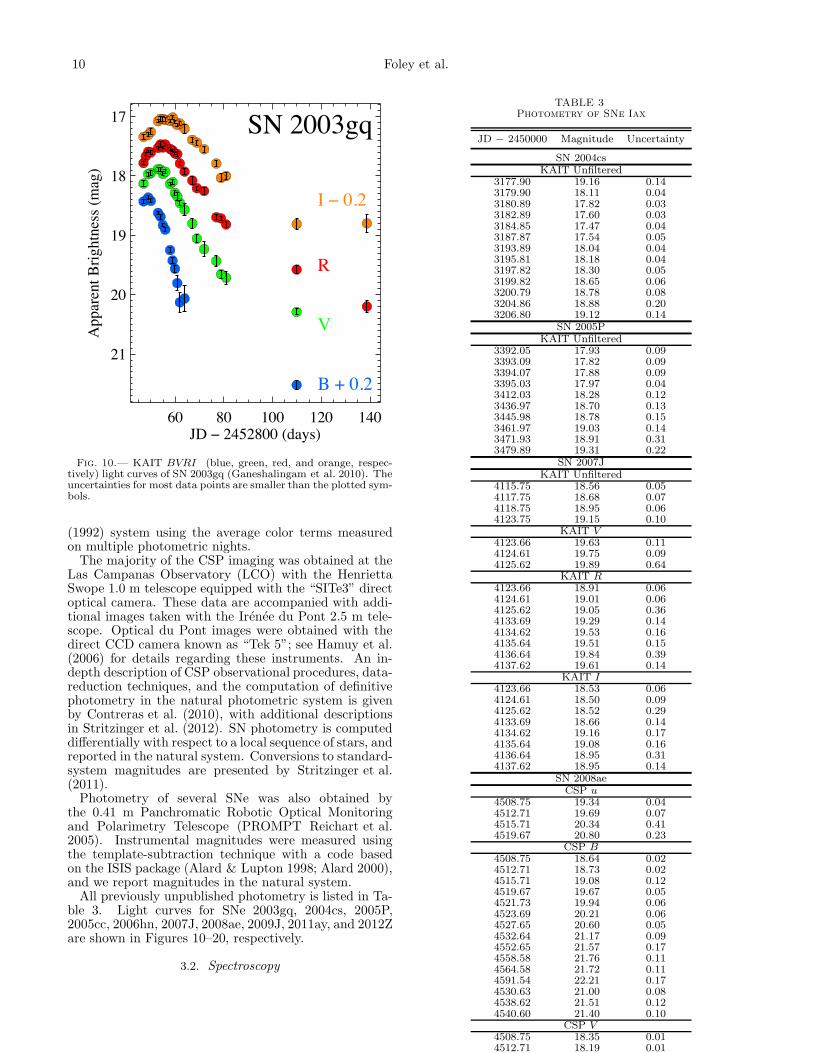
Below, we present new and previously published pho-tometry of several SNe Iax. SNe 2003gq, 2005cc, and2008A have previously published filtered photometryfrom KAIT (Ganeshalingam et al. 2010). The KAITphotometry is supplemented by previously publishedphotometry of SNe 2006hn, 2008A, and 2008ae fromthe CfA3 (Hicken et al. 2009) and CfA4 (Hicken et al.2012) samples. We present previously unpublished fil-tered KAIT photometry of SN 2007J and unfiltered (sim-ilar to R band) KAIT photometry of SNe 2004cs, 2005P,and 2007J. We also present previously unpublished fil-tered CSP photometry of SNe 2008ae and 2009J, un-published filtered CfA photometry of SNe 2011ay and2012Z, and unpublished filtered CHASE photometry ofSNe 2009J and 2011ce.Unfiltered (as part of LOSS) and broadband BVRI
photometry of several SNe was obtained using KAITat Lick Observatory. The data were reduced using amostly automated pipeline developed for KAIT images(Ganeshalingam et al. 2010). Images are bias-correctedand flatfielded at the telescope. Using galaxy templatesobtained a year and a half after discovery, the data im-ages are galaxy-subtracted to remove galaxy flux at theposition of the SN. The flux of the SN and the local fieldstar are measured using the point-spread function (PSF)fitting photometry package DAOPHOT in IRAF.18 Instru-mental magnitudes are color-corrected to the Landolt
18 IRAF: The Image Reduction and Analysis Facility is dis-tributed by the National Optical Astronomy Observatory, whichis operated by the Association of Universities for Research in As-tronomy (AURA) under cooperative agreement with the NationalScience Foundation (NSF).
10 Foley et al.
60 80 100 120 140JD − 2452800 (days)
21
20
19
18
17A
ppar
ent B
right
ness
(mag
)
SN 2003gq
B + 0.2
V
R
I − 0.2
Fig. 10.— KAIT BVRI (blue, green, red, and orange, respec-tively) light curves of SN 2003gq (Ganeshalingam et al. 2010). Theuncertainties for most data points are smaller than the plotted sym-bols.
(1992) system using the average color terms measuredon multiple photometric nights.The majority of the CSP imaging was obtained at the
Las Campanas Observatory (LCO) with the HenriettaSwope 1.0 m telescope equipped with the “SITe3” directoptical camera. These data are accompanied with addi-tional images taken with the Irenee du Pont 2.5 m tele-scope. Optical du Pont images were obtained with thedirect CCD camera known as “Tek 5”; see Hamuy et al.(2006) for details regarding these instruments. An in-depth description of CSP observational procedures, data-reduction techniques, and the computation of definitivephotometry in the natural photometric system is givenby Contreras et al. (2010), with additional descriptionsin Stritzinger et al. (2012). SN photometry is computeddifferentially with respect to a local sequence of stars, andreported in the natural system. Conversions to standard-system magnitudes are presented by Stritzinger et al.(2011).Photometry of several SNe was also obtained by
the 0.41 m Panchromatic Robotic Optical Monitoringand Polarimetry Telescope (PROMPT Reichart et al.2005). Instrumental magnitudes were measured usingthe template-subtraction technique with a code basedon the ISIS package (Alard & Lupton 1998; Alard 2000),and we report magnitudes in the natural system.All previously unpublished photometry is listed in Ta-
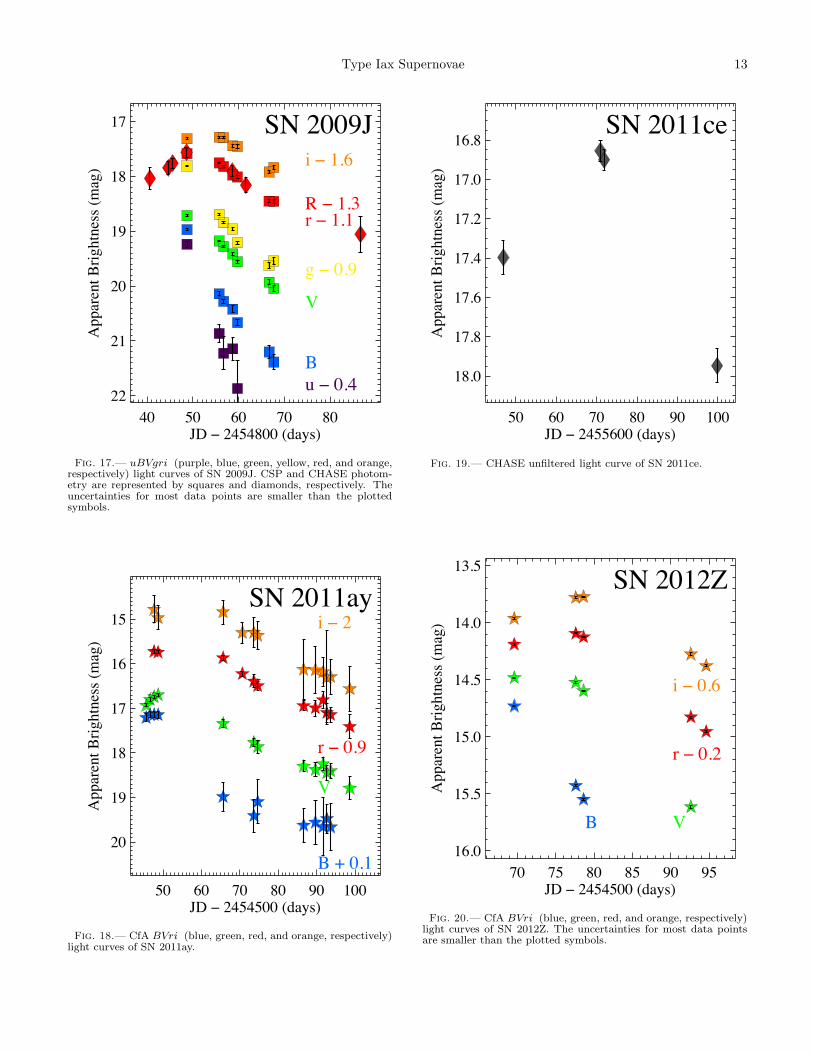
ble 3. Light curves for SNe 2003gq, 2004cs, 2005P,2005cc, 2006hn, 2007J, 2008ae, 2009J, 2011ay, and 2012Zare shown in Figures 10–20, respectively.
3.2. Spectroscopy
TABLE 3Photometry of SNe Iax
JD − 2450000 Magnitude Uncertainty
SN 2004csKAIT Unfiltered
3177.90 19.16 0.143179.90 18.11 0.043180.89 17.82 0.033182.89 17.60 0.033184.85 17.47 0.043187.87 17.54 0.053193.89 18.04 0.043195.81 18.18 0.043197.82 18.30 0.053199.82 18.65 0.063200.79 18.78 0.083204.86 18.88 0.203206.80 19.12 0.14
SN 2005PKAIT Unfiltered
3392.05 17.93 0.093393.09 17.82 0.093394.07 17.88 0.093395.03 17.97 0.043412.03 18.28 0.123436.97 18.70 0.133445.98 18.78 0.153461.97 19.03 0.143471.93 18.91 0.313479.89 19.31 0.22
SN 2007JKAIT Unfiltered
4115.75 18.56 0.054117.75 18.68 0.074118.75 18.95 0.064123.75 19.15 0.10
KAIT V4123.66 19.63 0.114124.61 19.75 0.094125.62 19.89 0.64
KAIT R4123.66 18.91 0.064124.61 19.01 0.064125.62 19.05 0.364133.69 19.29 0.144134.62 19.53 0.164135.64 19.51 0.154136.64 19.84 0.394137.62 19.61 0.14
KAIT I4123.66 18.53 0.064124.61 18.50 0.094125.62 18.52 0.294133.69 18.66 0.144134.62 19.16 0.174135.64 19.08 0.164136.64 18.95 0.314137.62 18.95 0.14
SN 2008aeCSP u
4508.75 19.34 0.044512.71 19.69 0.074515.71 20.34 0.414519.67 20.80 0.23
CSP B4508.75 18.64 0.024512.71 18.73 0.024515.71 19.08 0.124519.67 19.67 0.054521.73 19.94 0.064523.69 20.21 0.064527.65 20.60 0.054532.64 21.17 0.094552.65 21.57 0.174558.58 21.76 0.114564.58 21.72 0.114591.54 22.21 0.174530.63 21.00 0.084538.62 21.51 0.124540.60 21.40 0.10
CSP V4508.75 18.35 0.014512.71 18.19 0.01
Type Iax Supernovae 11
75 80 85 90 95 100 105JD − 2453100 (days)
19.0
18.5
18.0
17.5
App
aren
t Brig
htne
ss (m
ag)
SN 2004cs
Fig. 11.— KAIT unfiltered light curve of SN 2004cs.
100 120 140 160 180JD − 2453300 (days)
19.5
19.0
18.5
18.0
App
aren
t Brig
htne
ss (m
ag)
SN 2005P
Fig. 12.— KAIT unfiltered light curve of SN 2005P.
20 30 40 50 60 70JD − 2453500 (days)
19
18
17
16
App
aren
t Brig
htne
ss (m
ag)
SN 2005cc
BV
R
I − 0.2
Fig. 13.— KAIT BVRI (blue, green, red, and orange, respec-tively) light curves of SN 2005cc (Ganeshalingam et al. 2010). Theuncertainties for most data points are smaller than the plotted sym-bols.
20 40 60 80 100JD − 2454000 (days)
20
19
18
17
16
App
aren
t Brig
htne
ss (m
ag)
SN 2006hn
B
V
r’
i’ − 0.5
Fig. 14.— CfA3BVri (blue, green, red, and orange, respectively)light curves of SN 2006hn (Hicken et al. 2009). The uncertaintiesfor most data points are smaller than the plotted symbols.
12 Foley et al.
15 20 25 30 35 40JD − 2454100 (days)
20.0
19.5
19.0
18.5
18.0
17.5
App
aren
t Brig
htne
ss (m
ag)
SN 2007J
V
R − 0.2
I − 0.5
Unf − 0.2
Fig. 15.— KAIT VRI (green, red, and orange, respectively) andunfiltered (grey) light curves of SN 2007J. There is an upper limitunfiltered nondetection point 40 days before the first detection thatis not plotted.
We have obtained several low-resolution optical spectrawith the FAST spectrograph (Fabricant et al. 1998) onthe FLWO 1.5 m telescope, the Kast double spectrograph(Miller & Stone 1993) on the Shane 3 m telescope atLick Observatory, the EMMI spectrograph (Dekker et al.1986) on the New Technology Telescope at La SillaObservatory, the EFOSC spectrograph (Buzzoni et al.1984) on the ESO 3.6 m telescope, the LDSS3 spec-trograph19 on the Magellan Clay 6.5 m telescope, theIMACS spectrograph (Dressler et al. 2011) on the Mag-ellan Baade 6.5 m telescope, and the Low ResolutionImaging Spectrometer (LRIS; Oke et al. 1995) on the10 m Keck I telescope.Standard CCD processing and spectrum extraction
were accomplished with IRAF. The data were extractedusing the optimal algorithm of Horne (1986). Low-orderpolynomial fits to calibration-lamp spectra were used toestablish the wavelength scale, and small adjustmentsderived from night-sky lines in the object frames wereapplied. We employed our own IDL routines to fluxcalibrate the data and remove telluric lines using thewell-exposed continua of the spectrophotometric stan-dard stars (Wade & Horne 1988; Foley et al. 2003). De-tails of our spectroscopic reduction techniques are de-scribed by Silverman et al. (2012).A log of all previously unpublished spectral observa-
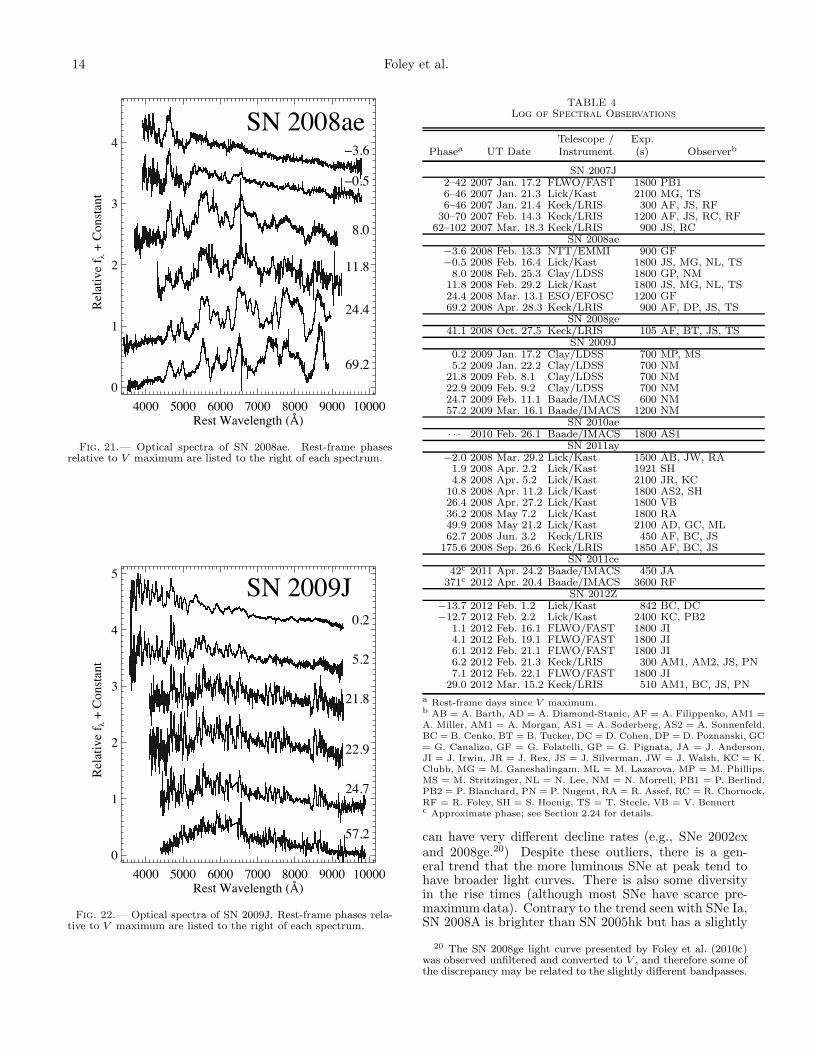
tions is presented in Table 4. Spectral sequences forSNe 2008ae, 2009J, 2011ay, and 2012Z are shown in Fig-ures 21 – 24, respectively. We only display previously
19 http://www.lco.cl/telescopes-information/magellan/instruments-1/ldss-3-1/ .
10 20 30 40 50 60JD − 2454500 (days)
22
21
20
19
18
17
16
App
aren
t Brig
htne
ss (m
ag)
SN 2008ae
u’ + 0.5B + 0.2V
g’ − 1.4r’ − 1.8
R − 1.6
I − 2i’ − 2.4
Fig. 16.— uBVgrRiI (purple, blue, green, yellow, red, red,orange, and orange, respectively) light curves of SN 2008ae. KAIT,CfA4, and CSP photometry are represented by circles, stars, andsquares, respectively. The KAIT and CfA4 data were previouslypublished by Ganeshalingam et al. (2010) and Hicken et al. (2012),respectively. The uncertainties for most data points are smallerthan the plotted symbols.
unpublished data. We do not display our single previ-ously unpublished spectrum of SN 2008ge since it wasobtained the same night as the first spectrum presentedby Foley et al. (2010c).
4. PHOTOMETRIC PROPERTIES
In this section, we examine the photometric propertiesof SNe Iax. A minority of the full sample has filtered pho-tometry that covers maximum brightness. Since obser-vations near maximum brightness are critical for directcomparisons between SNe, we focus on the SNe havingthose data. For the SNe in our sample with light curvesaround maximum brightness, we can derive several lightcurve parameters: time of maximum brightness, peakbrightness, peak absolute brightness, and decline rate.We fit low-order polynomials to each light curve nearmaximum brightness to derive these values for each avail-able band. For some SNe and some bands, we can onlyplace limits or broad ranges on the derived values. Wepresent our measurements in Table 5.
4.1. Photometric Relations
Using the measured times of maximum, we can di-rectly compare the absolute-magnitude light curves ofseveral SNe in the class. We present those light curvesin Figure 25 and note that they have not been correctedfor host-galaxy extinction (see Section 4.2). The figureshows the large range of peak absolute magnitudes forthe class. It also displays the differing photometric be-havior. Some SNe with very similar absolute magnitudes
Type Iax Supernovae 13
40 50 60 70 80JD − 2454800 (days)
22
21
20
19
18
17
App
aren
t Brig
htne
ss (m
ag)
SN 2009J
u − 0.4B
V
g − 0.9
r − 1.1R − 1.3
i − 1.6
Fig. 17.— uBVgri (purple, blue, green, yellow, red, and orange,respectively) light curves of SN 2009J. CSP and CHASE photom-etry are represented by squares and diamonds, respectively. Theuncertainties for most data points are smaller than the plottedsymbols.
50 60 70 80 90 100JD − 2454500 (days)
20
19
18
17
16
15
App
aren
t Brig
htne
ss (m
ag)
SN 2011ay
B + 0.1
V
r − 0.9
i − 2
Fig. 18.— CfA BVri (blue, green, red, and orange, respectively)light curves of SN 2011ay.
50 60 70 80 90 100JD − 2455600 (days)
18.0
17.8
17.6
17.4
17.2
17.0
16.8
App
aren
t Brig
htne
ss (m
ag)
SN 2011ce
Fig. 19.— CHASE unfiltered light curve of SN 2011ce.
70 75 80 85 90 95JD − 2454500 (days)
16.0
15.5
15.0
14.5
14.0
13.5
App
aren
t Brig
htne
ss (m
ag)
SN 2012Z
B V
r − 0.2
i − 0.6
Fig. 20.— CfA BVri (blue, green, red, and orange, respectively)light curves of SN 2012Z. The uncertainties for most data pointsare smaller than the plotted symbols.
14 Foley et al.
4000 5000 6000 7000 8000 9000 10000Rest Wavelength (Å)
0
1
2
3
4
Rela
tive
f λ +
Cons
tant
SN 2008ae−3.6
−0.5
8.0
11.8
24.4
69.2
Fig. 21.— Optical spectra of SN 2008ae. Rest-frame phasesrelative to V maximum are listed to the right of each spectrum.
4000 5000 6000 7000 8000 9000 10000Rest Wavelength (Å)
0
1
2
3
4
5
Rela
tive
f λ +
Cons
tant
SN 2009J0.2
5.2
21.8
22.9
24.7
57.2
Fig. 22.— Optical spectra of SN 2009J. Rest-frame phases rela-tive to V maximum are listed to the right of each spectrum.
TABLE 4Log of Spectral Observations
Telescope / Exp.Phasea UT Date Instrument (s) Observerb
SN 2007J2–42 2007 Jan. 17.2 FLWO/FAST 1800 PB16–46 2007 Jan. 21.3 Lick/Kast 2100 MG, TS6–46 2007 Jan. 21.4 Keck/LRIS 300 AF, JS, RF
30–70 2007 Feb. 14.3 Keck/LRIS 1200 AF, JS, RC, RF62–102 2007 Mar. 18.3 Keck/LRIS 900 JS, RC
SN 2008ae−3.6 2008 Feb. 13.3 NTT/EMMI 900 GF−0.5 2008 Feb. 16.4 Lick/Kast 1800 JS, MG, NL, TS8.0 2008 Feb. 25.3 Clay/LDSS 1800 GP, NM
11.8 2008 Feb. 29.2 Lick/Kast 1800 JS, MG, NL, TS24.4 2008 Mar. 13.1 ESO/EFOSC 1200 GF69.2 2008 Apr. 28.3 Keck/LRIS 900 AF, DP, JS, TS
SN 2008ge41.1 2008 Oct. 27.5 Keck/LRIS 105 AF, BT, JS, TS
SN 2009J0.2 2009 Jan. 17.2 Clay/LDSS 700 MP, MS5.2 2009 Jan. 22.2 Clay/LDSS 700 NM
21.8 2009 Feb. 8.1 Clay/LDSS 700 NM22.9 2009 Feb. 9.2 Clay/LDSS 700 NM24.7 2009 Feb. 11.1 Baade/IMACS 600 NM57.2 2009 Mar. 16.1 Baade/IMACS 1200 NM
SN 2010ae· · · 2010 Feb. 26.1 Baade/IMACS 1800 AS1
SN 2011ay−2.0 2008 Mar. 29.2 Lick/Kast 1500 AB, JW, RA1.9 2008 Apr. 2.2 Lick/Kast 1921 SH4.8 2008 Apr. 5.2 Lick/Kast 2100 JR, KC
10.8 2008 Apr. 11.2 Lick/Kast 1800 AS2, SH26.4 2008 Apr. 27.2 Lick/Kast 1800 VB36.2 2008 May 7.2 Lick/Kast 1800 RA49.9 2008 May 21.2 Lick/Kast 2100 AD, GC, ML62.7 2008 Jun. 3.2 Keck/LRIS 450 AF, BC, JS
175.6 2008 Sep. 26.6 Keck/LRIS 1850 AF, BC, JSSN 2011ce
42c 2011 Apr. 24.2 Baade/IMACS 450 JA371c 2012 Apr. 20.4 Baade/IMACS 3600 RF
SN 2012Z−13.7 2012 Feb. 1.2 Lick/Kast 842 BC, DC−12.7 2012 Feb. 2.2 Lick/Kast 2400 KC, PB2
1.1 2012 Feb. 16.1 FLWO/FAST 1800 JI4.1 2012 Feb. 19.1 FLWO/FAST 1800 JI6.1 2012 Feb. 21.1 FLWO/FAST 1800 JI6.2 2012 Feb. 21.3 Keck/LRIS 300 AM1, AM2, JS, PN7.1 2012 Feb. 22.1 FLWO/FAST 1800 JI
29.0 2012 Mar. 15.2 Keck/LRIS 510 AM1, BC, JS, PNa Rest-frame days since V maximum.b AB = A. Barth, AD = A. Diamond-Stanic, AF = A. Filippenko, AM1 =A. Miller, AM1 = A. Morgan, AS1 = A. Soderberg, AS2 = A. Sonnenfeld,BC = B. Cenko, BT = B. Tucker, DC = D. Cohen, DP = D. Poznanski, GC= G. Canalizo, GF = G. Folatelli, GP = G. Pignata, JA = J. Anderson,JI = J. Irwin, JR = J. Rex, JS = J. Silverman, JW = J. Walsh, KC = K.Clubb, MG = M. Ganeshalingam, ML = M. Lazarova, MP = M. Phillips,MS = M. Stritzinger, NL = N. Lee, NM = N. Morrell, PB1 = P. Berlind,PB2 = P. Blanchard, PN = P. Nugent, RA = R. Assef, RC = R. Chornock,RF = R. Foley, SH = S. Hoenig, TS = T. Steele, VB = V. Bennertc Approximate phase; see Section 2.24 for details.
can have very different decline rates (e.g., SNe 2002cxand 2008ge.20) Despite these outliers, there is a gen-eral trend that the more luminous SNe at peak tend tohave broader light curves. There is also some diversityin the rise times (although most SNe have scarce pre-maximum data). Contrary to the trend seen with SNe Ia,SN 2008A is brighter than SN 2005hk but has a slightly
20 The SN 2008ge light curve presented by Foley et al. (2010c)was observed unfiltered and converted to V , and therefore some ofthe discrepancy may be related to the slightly different bandpasses.
Type Iax Supernovae 15
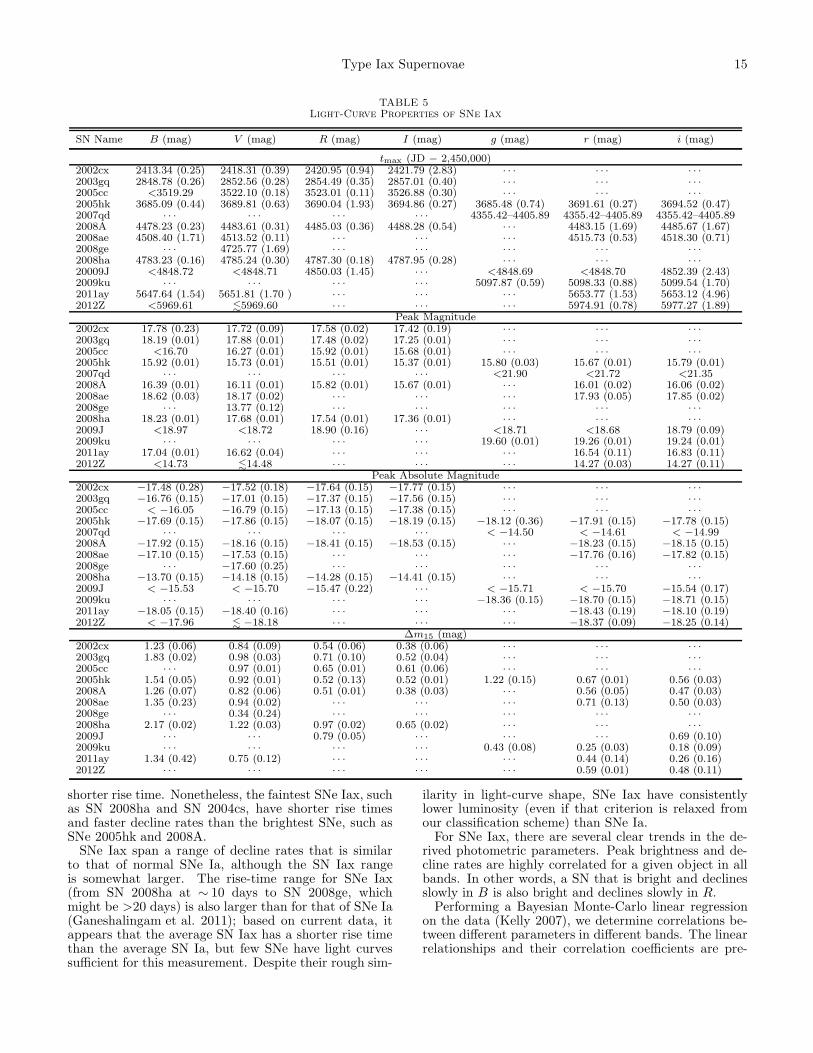
TABLE 5Light-Curve Properties of SNe Iax
SN Name B (mag) V (mag) R (mag) I (mag) g (mag) r (mag) i (mag)
tmax (JD − 2,450,000)2002cx 2413.34 (0.25) 2418.31 (0.39) 2420.95 (0.94) 2421.79 (2.83) · · · · · · · · ·2003gq 2848.78 (0.26) 2852.56 (0.28) 2854.49 (0.35) 2857.01 (0.40) · · · · · · · · ·2005cc <3519.29 3522.10 (0.18) 3523.01 (0.11) 3526.88 (0.30) · · · · · · · · ·2005hk 3685.09 (0.44) 3689.81 (0.63) 3690.04 (1.93) 3694.86 (0.27) 3685.48 (0.74) 3691.61 (0.27) 3694.52 (0.47)2007qd · · · · · · · · · · · · 4355.42–4405.89 4355.42–4405.89 4355.42–4405.892008A 4478.23 (0.23) 4483.61 (0.31) 4485.03 (0.36) 4488.28 (0.54) · · · 4483.15 (1.69) 4485.67 (1.67)2008ae 4508.40 (1.71) 4513.52 (0.11) · · · · · · · · · 4515.73 (0.53) 4518.30 (0.71)2008ge · · · 4725.77 (1.69) · · · · · · · · · · · · · · ·2008ha 4783.23 (0.16) 4785.24 (0.30) 4787.30 (0.18) 4787.95 (0.28) · · · · · · · · ·20009J <4848.72 <4848.71 4850.03 (1.45) · · · <4848.69 <4848.70 4852.39 (2.43)2009ku · · · · · · · · · · · · 5097.87 (0.59) 5098.33 (0.88) 5099.54 (1.70)2011ay 5647.64 (1.54) 5651.81 (1.70 ) · · · · · · · · · 5653.77 (1.53) 5653.12 (4.96)2012Z <5969.61 !5969.60 · · · · · · · · · 5974.91 (0.78) 5977.27 (1.89)
Peak Magnitude2002cx 17.78 (0.23) 17.72 (0.09) 17.58 (0.02) 17.42 (0.19) · · · · · · · · ·2003gq 18.19 (0.01) 17.88 (0.01) 17.48 (0.02) 17.25 (0.01) · · · · · · · · ·2005cc <16.70 16.27 (0.01) 15.92 (0.01) 15.68 (0.01) · · · · · · · · ·2005hk 15.92 (0.01) 15.73 (0.01) 15.51 (0.01) 15.37 (0.01) 15.80 (0.03) 15.67 (0.01) 15.79 (0.01)2007qd · · · · · · · · · · · · <21.90 <21.72 <21.352008A 16.39 (0.01) 16.11 (0.01) 15.82 (0.01) 15.67 (0.01) · · · 16.01 (0.02) 16.06 (0.02)2008ae 18.62 (0.03) 18.17 (0.02) · · · · · · · · · 17.93 (0.05) 17.85 (0.02)2008ge · · · 13.77 (0.12) · · · · · · · · · · · · · · ·2008ha 18.23 (0.01) 17.68 (0.01) 17.54 (0.01) 17.36 (0.01) · · · · · · · · ·2009J <18.97 <18.72 18.90 (0.16) · · · <18.71 <18.68 18.79 (0.09)2009ku · · · · · · · · · · · · 19.60 (0.01) 19.26 (0.01) 19.24 (0.01)2011ay 17.04 (0.01) 16.62 (0.04) · · · · · · · · · 16.54 (0.11) 16.83 (0.11)2012Z <14.73 !14.48 · · · · · · · · · 14.27 (0.03) 14.27 (0.11)
Peak Absolute Magnitude2002cx −17.48 (0.28) −17.52 (0.18) −17.64 (0.15) −17.77 (0.15) · · · · · · · · ·2003gq −16.76 (0.15) −17.01 (0.15) −17.37 (0.15) −17.56 (0.15) · · · · · · · · ·2005cc < −16.05 −16.79 (0.15) −17.13 (0.15) −17.38 (0.15) · · · · · · · · ·2005hk −17.69 (0.15) −17.86 (0.15) −18.07 (0.15) −18.19 (0.15) −18.12 (0.36) −17.91 (0.15) −17.78 (0.15)2007qd · · · · · · · · · · · · < −14.50 < −14.61 < −14.992008A −17.92 (0.15) −18.16 (0.15) −18.41 (0.15) −18.53 (0.15) · · · −18.23 (0.15) −18.15 (0.15)2008ae −17.10 (0.15) −17.53 (0.15) · · · · · · · · · −17.76 (0.16) −17.82 (0.15)2008ge · · · −17.60 (0.25) · · · · · · · · · · · · · · ·2008ha −13.70 (0.15) −14.18 (0.15) −14.28 (0.15) −14.41 (0.15) · · · · · · · · ·2009J < −15.53 < −15.70 −15.47 (0.22) · · · < −15.71 < −15.70 −15.54 (0.17)2009ku · · · · · · · · · · · · −18.36 (0.15) −18.70 (0.15) −18.71 (0.15)2011ay −18.05 (0.15) −18.40 (0.16) · · · · · · · · · −18.43 (0.19) −18.10 (0.19)2012Z < −17.96 ! −18.18 · · · · · · · · · −18.37 (0.09) −18.25 (0.14)
∆m15 (mag)2002cx 1.23 (0.06) 0.84 (0.09) 0.54 (0.06) 0.38 (0.06) · · · · · · · · ·2003gq 1.83 (0.02) 0.98 (0.03) 0.71 (0.10) 0.52 (0.04) · · · · · · · · ·2005cc · · · 0.97 (0.01) 0.65 (0.01) 0.61 (0.06) · · · · · · · · ·2005hk 1.54 (0.05) 0.92 (0.01) 0.52 (0.13) 0.52 (0.01) 1.22 (0.15) 0.67 (0.01) 0.56 (0.03)2008A 1.26 (0.07) 0.82 (0.06) 0.51 (0.01) 0.38 (0.03) · · · 0.56 (0.05) 0.47 (0.03)2008ae 1.35 (0.23) 0.94 (0.02) · · · · · · · · · 0.71 (0.13) 0.50 (0.03)2008ge · · · 0.34 (0.24) · · · · · · · · · · · · · · ·2008ha 2.17 (0.02) 1.22 (0.03) 0.97 (0.02) 0.65 (0.02) · · · · · · · · ·2009J · · · · · · 0.79 (0.05) · · · · · · · · · 0.69 (0.10)2009ku · · · · · · · · · · · · 0.43 (0.08) 0.25 (0.03) 0.18 (0.09)2011ay 1.34 (0.42) 0.75 (0.12) · · · · · · · · · 0.44 (0.14) 0.26 (0.16)2012Z · · · · · · · · · · · · · · · 0.59 (0.01) 0.48 (0.11)
shorter rise time. Nonetheless, the faintest SNe Iax, suchas SN 2008ha and SN 2004cs, have shorter rise timesand faster decline rates than the brightest SNe, such asSNe 2005hk and 2008A.SNe Iax span a range of decline rates that is similar
to that of normal SNe Ia, although the SN Iax rangeis somewhat larger. The rise-time range for SNe Iax(from SN 2008ha at ∼ 10 days to SN 2008ge, whichmight be >20 days) is also larger than for that of SNe Ia(Ganeshalingam et al. 2011); based on current data, itappears that the average SN Iax has a shorter rise timethan the average SN Ia, but few SNe have light curvessufficient for this measurement. Despite their rough sim-
ilarity in light-curve shape, SNe Iax have consistentlylower luminosity (even if that criterion is relaxed fromour classification scheme) than SNe Ia.For SNe Iax, there are several clear trends in the de-
rived photometric parameters. Peak brightness and de-cline rates are highly correlated for a given object in allbands. In other words, a SN that is bright and declinesslowly in B is also bright and declines slowly in R.Performing a Bayesian Monte-Carlo linear regression
on the data (Kelly 2007), we determine correlations be-tween different parameters in different bands. The linearrelationships and their correlation coefficients are pre-
16 Foley et al.
4000 5000 6000 7000 8000 9000 10000Rest Wavelength (Å)
0
1
2
3
4
5
Rela
tive
f λ +
Cons
tant
SN 2011ay−2.0
1.9
4.8
10.8
26.4
36.2
49.9
62.7
175.6
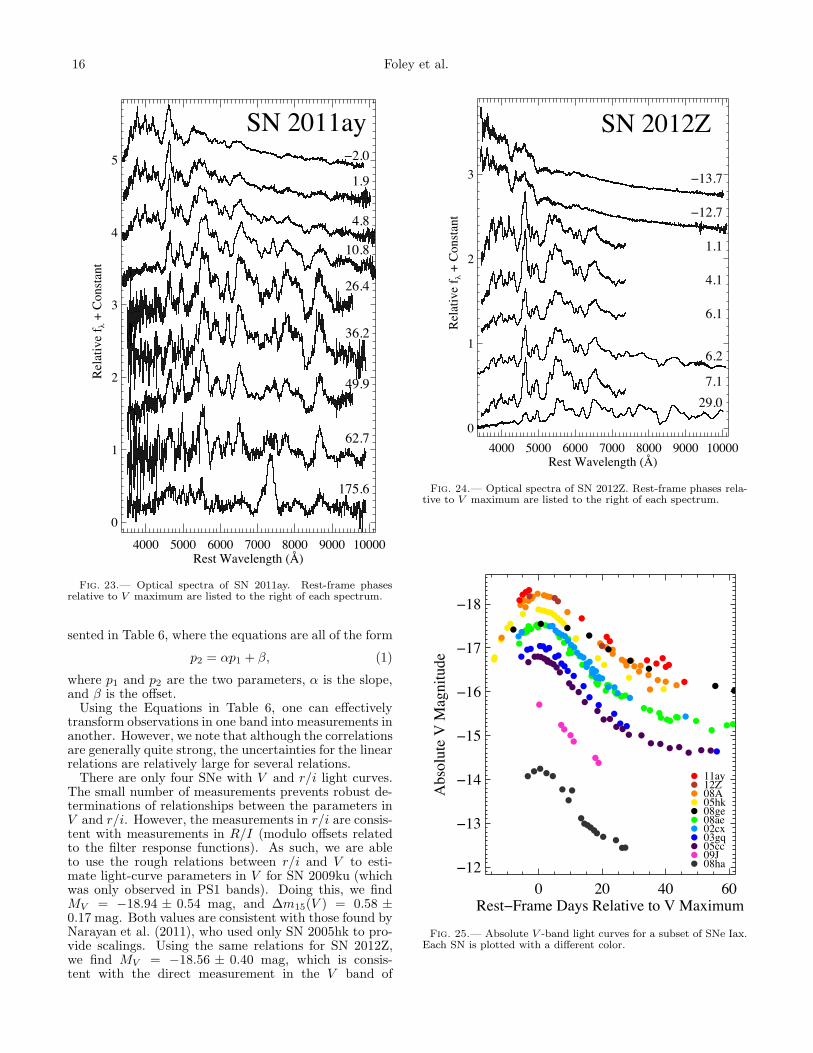
Fig. 23.— Optical spectra of SN 2011ay. Rest-frame phasesrelative to V maximum are listed to the right of each spectrum.
sented in Table 6, where the equations are all of the form
p2 = αp1 + β, (1)
where p1 and p2 are the two parameters, α is the slope,and β is the offset.Using the Equations in Table 6, one can effectively
transform observations in one band into measurements inanother. However, we note that although the correlationsare generally quite strong, the uncertainties for the linearrelations are relatively large for several relations.There are only four SNe with V and r/i light curves.
The small number of measurements prevents robust de-terminations of relationships between the parameters inV and r/i. However, the measurements in r/i are consis-tent with measurements in R/I (modulo offsets relatedto the filter response functions). As such, we are ableto use the rough relations between r/i and V to esti-mate light-curve parameters in V for SN 2009ku (whichwas only observed in PS1 bands). Doing this, we findMV = −18.94 ± 0.54 mag, and ∆m15(V ) = 0.58 ±0.17 mag. Both values are consistent with those found byNarayan et al. (2011), who used only SN 2005hk to pro-vide scalings. Using the same relations for SN 2012Z,we find MV = −18.56 ± 0.40 mag, which is consis-tent with the direct measurement in the V band of
4000 5000 6000 7000 8000 9000 10000Rest Wavelength (Å)
0
1
2
3
Rela
tive
f λ +
Cons
tant
SN 2012Z
−13.7
−12.7
1.1
4.1
6.1
6.2
7.129.0
Fig. 24.— Optical spectra of SN 2012Z. Rest-frame phases rela-tive to V maximum are listed to the right of each spectrum.
0 20 40 60Rest−Frame Days Relative to V Maximum
−12
−13
−14
−15
−16
−17
−18
Abs
olut
e V
Mag
nitu
de
08ha09J05cc03gq02cx08ae08ge05hk08A12Z11ay
Fig. 25.— Absolute V -band light curves for a subset of SNe Iax.Each SN is plotted with a different color.
Type Iax Supernovae 17
TABLE 6Light-Curve Relations for SNe Iax
1st 2nd Slope Offset Equation No. CorrelationParameter Parameter (α) (β) No. SNe Coefficient
tmax(B) tmax(V ) 0.98 (0.03) 5.17 (1.83) 2 7 0.9994tmax(R) tmax(V ) 1.00 (0.02) −1.47 (1.52) 3 6 0.9997tmax(I) tmax(V ) 1.00 (0.04) −4.41 (2.79) 4 6 0.9996tmax(r) tmax(V ) · · · · · · · · · 4 0.958tmax(i) tmax(V ) · · · · · · · · · 4 0.947
∆m15(B) ∆m15(V ) 0.40 (0.12) 0.32 (0.20) 5 7 0.959∆m15(R) ∆m15(V ) 0.77 (0.26) 0.46 (0.18) 6 6 0.9660∆m15(I) ∆m15(V ) 1.35 (0.66) 0.27 (0.34) 7 6 0.929∆m15(r) ∆m15(V ) · · · · · · · · · 4 −0.277∆m15(i) ∆m15(V ) · · · · · · · · · 4 0.471
MB MV 0.95 (0.09) −1.22 (1.45) 8 7 0.996MR MV 0.96 (0.10) −0.37 (1.74) 9 6 0.997MI MV 0.97 (0.12) −0.09 (2.13) 10 6 0.992Mr MV · · · · · · · · · 4 −0.310Mi MV · · · · · · · · · 4 −0.311
∆m15(V ) MV 10.7 (2.4) −27.4 (2.3) 11 9 0.980∆m15(R) MV 8.3 (2.0) −22.3 (1.3) 12 6 0.982
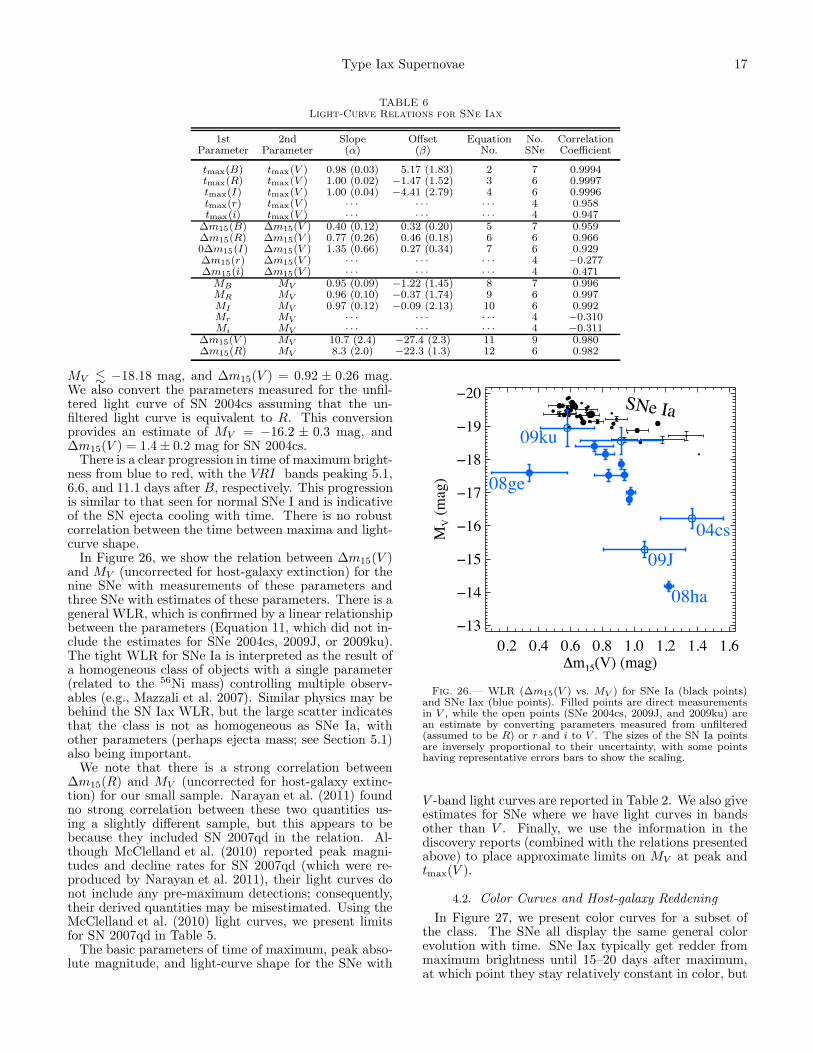
MV ! −18.18 mag, and ∆m15(V ) = 0.92 ± 0.26 mag.We also convert the parameters measured for the unfil-tered light curve of SN 2004cs assuming that the un-filtered light curve is equivalent to R. This conversionprovides an estimate of MV = −16.2 ± 0.3 mag, and∆m15(V ) = 1.4± 0.2 mag for SN 2004cs.There is a clear progression in time of maximum bright-
ness from blue to red, with the VRI bands peaking 5.1,6.6, and 11.1 days after B, respectively. This progressionis similar to that seen for normal SNe I and is indicativeof the SN ejecta cooling with time. There is no robustcorrelation between the time between maxima and light-curve shape.In Figure 26, we show the relation between ∆m15(V )
and MV (uncorrected for host-galaxy extinction) for thenine SNe with measurements of these parameters andthree SNe with estimates of these parameters. There is ageneral WLR, which is confirmed by a linear relationshipbetween the parameters (Equation 11, which did not in-clude the estimates for SNe 2004cs, 2009J, or 2009ku).The tight WLR for SNe Ia is interpreted as the result ofa homogeneous class of objects with a single parameter(related to the 56Ni mass) controlling multiple observ-ables (e.g., Mazzali et al. 2007). Similar physics may bebehind the SN Iax WLR, but the large scatter indicatesthat the class is not as homogeneous as SNe Ia, withother parameters (perhaps ejecta mass; see Section 5.1)also being important.We note that there is a strong correlation between
∆m15(R) and MV (uncorrected for host-galaxy extinc-tion) for our small sample. Narayan et al. (2011) foundno strong correlation between these two quantities us-ing a slightly different sample, but this appears to bebecause they included SN 2007qd in the relation. Al-though McClelland et al. (2010) reported peak magni-tudes and decline rates for SN 2007qd (which were re-produced by Narayan et al. 2011), their light curves donot include any pre-maximum detections; consequently,their derived quantities may be misestimated. Using theMcClelland et al. (2010) light curves, we present limitsfor SN 2007qd in Table 5.The basic parameters of time of maximum, peak abso-
lute magnitude, and light-curve shape for the SNe with
0.2 0.4 0.6 0.8 1.0 1.2 1.4 1.6∆m15(V) (mag)
−13
−14
−15
−16
−17
−18
−19
−20
MV (m
ag)
SNe Ia
08ge
08ha
09ku
09J04cs
Fig. 26.— WLR (∆m15(V ) vs. MV ) for SNe Ia (black points)and SNe Iax (blue points). Filled points are direct measurementsin V , while the open points (SNe 2004cs, 2009J, and 2009ku) arean estimate by converting parameters measured from unfiltered(assumed to be R) or r and i to V . The sizes of the SN Ia pointsare inversely proportional to their uncertainty, with some pointshaving representative errors bars to show the scaling.
V -band light curves are reported in Table 2. We also giveestimates for SNe where we have light curves in bandsother than V . Finally, we use the information in thediscovery reports (combined with the relations presentedabove) to place approximate limits on MV at peak andtmax(V ).
4.2. Color Curves and Host-galaxy Reddening
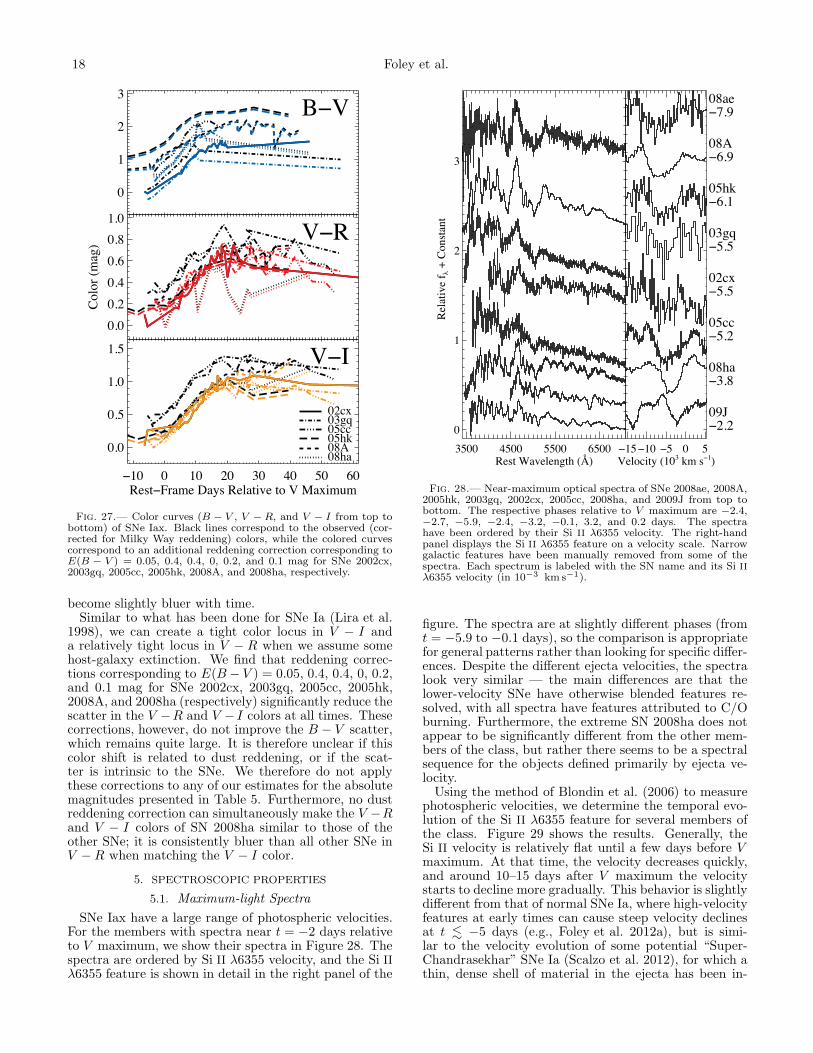
In Figure 27, we present color curves for a subset ofthe class. The SNe all display the same general colorevolution with time. SNe Iax typically get redder frommaximum brightness until 15–20 days after maximum,at which point they stay relatively constant in color, but
18 Foley et al.
0
1
2
3B−V
0.00.20.40.60.81.0
Colo
r (m
ag)
V−R
−10 0 10 20 30 40 50 60Rest−Frame Days Relative to V Maximum
0.0
0.5
1.0
1.5 V−I
02cx03gq05cc05hk08A08ha
Fig. 27.— Color curves (B − V , V − R, and V − I from top tobottom) of SNe Iax. Black lines correspond to the observed (cor-rected for Milky Way reddening) colors, while the colored curvescorrespond to an additional reddening correction corresponding toE(B − V ) = 0.05, 0.4, 0.4, 0, 0.2, and 0.1 mag for SNe 2002cx,2003gq, 2005cc, 2005hk, 2008A, and 2008ha, respectively.
become slightly bluer with time.Similar to what has been done for SNe Ia (Lira et al.
1998), we can create a tight color locus in V − I anda relatively tight locus in V − R when we assume somehost-galaxy extinction. We find that reddening correc-tions corresponding to E(B − V ) = 0.05, 0.4, 0.4, 0, 0.2,and 0.1 mag for SNe 2002cx, 2003gq, 2005cc, 2005hk,2008A, and 2008ha (respectively) significantly reduce thescatter in the V −R and V − I colors at all times. Thesecorrections, however, do not improve the B − V scatter,which remains quite large. It is therefore unclear if thiscolor shift is related to dust reddening, or if the scat-ter is intrinsic to the SNe. We therefore do not applythese corrections to any of our estimates for the absolutemagnitudes presented in Table 5. Furthermore, no dustreddening correction can simultaneously make the V −Rand V − I colors of SN 2008ha similar to those of theother SNe; it is consistently bluer than all other SNe inV −R when matching the V − I color.
5. SPECTROSCOPIC PROPERTIES
5.1. Maximum-light Spectra
SNe Iax have a large range of photospheric velocities.For the members with spectra near t = −2 days relativeto V maximum, we show their spectra in Figure 28. Thespectra are ordered by Si II λ6355 velocity, and the Si IIλ6355 feature is shown in detail in the right panel of the
3500 4500 5500 6500Rest Wavelength (Å)
0
1
2
3
Rela
tive
f λ +
Cons
tant
−15−10 −5 0 5Velocity (103 km s−1)
09J−2.2
08ha−3.8
05cc−5.2
02cx−5.5
03gq−5.5
05hk−6.1
08A−6.9
08ae−7.9
Fig. 28.— Near-maximum optical spectra of SNe 2008ae, 2008A,2005hk, 2003gq, 2002cx, 2005cc, 2008ha, and 2009J from top tobottom. The respective phases relative to V maximum are −2.4,−2.7, −5.9, −2.4, −3.2, −0.1, 3.2, and 0.2 days. The spectrahave been ordered by their Si II λ6355 velocity. The right-handpanel displays the Si II λ6355 feature on a velocity scale. Narrowgalactic features have been manually removed from some of thespectra. Each spectrum is labeled with the SN name and its Si IIλ6355 velocity (in 10−3 km s−1).
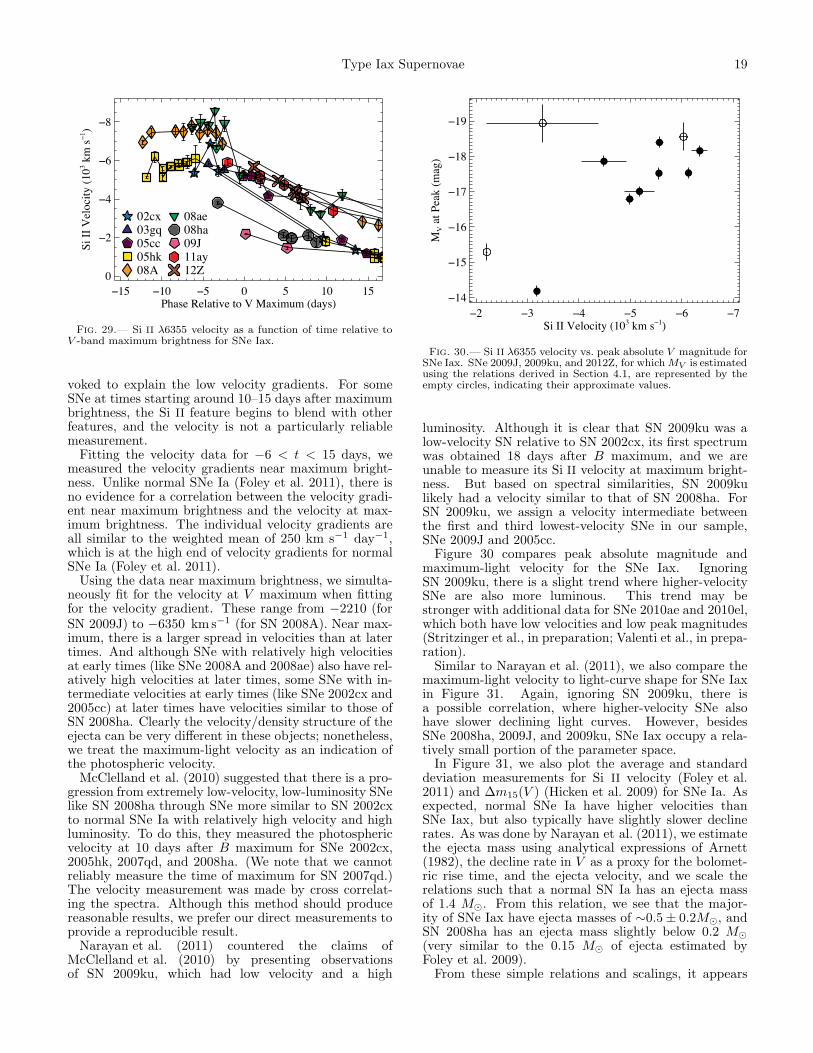
figure. The spectra are at slightly different phases (fromt = −5.9 to −0.1 days), so the comparison is appropriatefor general patterns rather than looking for specific differ-ences. Despite the different ejecta velocities, the spectralook very similar — the main differences are that thelower-velocity SNe have otherwise blended features re-solved, with all spectra have features attributed to C/Oburning. Furthermore, the extreme SN 2008ha does notappear to be significantly different from the other mem-bers of the class, but rather there seems to be a spectralsequence for the objects defined primarily by ejecta ve-locity.Using the method of Blondin et al. (2006) to measure
photospheric velocities, we determine the temporal evo-lution of the Si II λ6355 feature for several members ofthe class. Figure 29 shows the results. Generally, theSi II velocity is relatively flat until a few days before Vmaximum. At that time, the velocity decreases quickly,and around 10–15 days after V maximum the velocitystarts to decline more gradually. This behavior is slightlydifferent from that of normal SNe Ia, where high-velocityfeatures at early times can cause steep velocity declinesat t ! −5 days (e.g., Foley et al. 2012a), but is simi-lar to the velocity evolution of some potential “Super-Chandrasekhar” SNe Ia (Scalzo et al. 2012), for which athin, dense shell of material in the ejecta has been in-
Type Iax Supernovae 19
−15 −10 −5 0 5 10 15Phase Relative to V Maximum (days)
0
−2
−4
−6
−8
Si II
Vel
ocity
(103 k
m s−
1 )
08A05hk05cc03gq02cx
12Z11ay09J08ha08ae
Fig. 29.— Si II λ6355 velocity as a function of time relative toV -band maximum brightness for SNe Iax.
voked to explain the low velocity gradients. For someSNe at times starting around 10–15 days after maximumbrightness, the Si II feature begins to blend with otherfeatures, and the velocity is not a particularly reliablemeasurement.Fitting the velocity data for −6 < t < 15 days, we
measured the velocity gradients near maximum bright-ness. Unlike normal SNe Ia (Foley et al. 2011), there isno evidence for a correlation between the velocity gradi-ent near maximum brightness and the velocity at max-imum brightness. The individual velocity gradients areall similar to the weighted mean of 250 km s−1 day−1,which is at the high end of velocity gradients for normalSNe Ia (Foley et al. 2011).Using the data near maximum brightness, we simulta-
neously fit for the velocity at V maximum when fittingfor the velocity gradient. These range from −2210 (forSN 2009J) to −6350 km s−1 (for SN 2008A). Near max-imum, there is a larger spread in velocities than at latertimes. And although SNe with relatively high velocitiesat early times (like SNe 2008A and 2008ae) also have rel-atively high velocities at later times, some SNe with in-termediate velocities at early times (like SNe 2002cx and2005cc) at later times have velocities similar to those ofSN 2008ha. Clearly the velocity/density structure of theejecta can be very different in these objects; nonetheless,we treat the maximum-light velocity as an indication ofthe photospheric velocity.McClelland et al. (2010) suggested that there is a pro-
gression from extremely low-velocity, low-luminosity SNelike SN 2008ha through SNe more similar to SN 2002cxto normal SNe Ia with relatively high velocity and highluminosity. To do this, they measured the photosphericvelocity at 10 days after B maximum for SNe 2002cx,2005hk, 2007qd, and 2008ha. (We note that we cannotreliably measure the time of maximum for SN 2007qd.)The velocity measurement was made by cross correlat-ing the spectra. Although this method should producereasonable results, we prefer our direct measurements toprovide a reproducible result.Narayan et al. (2011) countered the claims of
McClelland et al. (2010) by presenting observationsof SN 2009ku, which had low velocity and a high
−2 −3 −4 −5 −6 −7Si II Velocity (103 km s−1)
−14
−15
−16
−17
−18
−19
MV a
t Pea
k (m
ag)
Fig. 30.— Si II λ6355 velocity vs. peak absolute V magnitude forSNe Iax. SNe 2009J, 2009ku, and 2012Z, for whichMV is estimatedusing the relations derived in Section 4.1, are represented by theempty circles, indicating their approximate values.
luminosity. Although it is clear that SN 2009ku was alow-velocity SN relative to SN 2002cx, its first spectrumwas obtained 18 days after B maximum, and we areunable to measure its Si II velocity at maximum bright-ness. But based on spectral similarities, SN 2009kulikely had a velocity similar to that of SN 2008ha. ForSN 2009ku, we assign a velocity intermediate betweenthe first and third lowest-velocity SNe in our sample,SNe 2009J and 2005cc.Figure 30 compares peak absolute magnitude and
maximum-light velocity for the SNe Iax. IgnoringSN 2009ku, there is a slight trend where higher-velocitySNe are also more luminous. This trend may bestronger with additional data for SNe 2010ae and 2010el,which both have low velocities and low peak magnitudes(Stritzinger et al., in preparation; Valenti et al., in prepa-ration).Similar to Narayan et al. (2011), we also compare the
maximum-light velocity to light-curve shape for SNe Iaxin Figure 31. Again, ignoring SN 2009ku, there isa possible correlation, where higher-velocity SNe alsohave slower declining light curves. However, besidesSNe 2008ha, 2009J, and 2009ku, SNe Iax occupy a rela-tively small portion of the parameter space.In Figure 31, we also plot the average and standard
deviation measurements for Si II velocity (Foley et al.2011) and ∆m15(V ) (Hicken et al. 2009) for SNe Ia. Asexpected, normal SNe Ia have higher velocities thanSNe Iax, but also typically have slightly slower declinerates. As was done by Narayan et al. (2011), we estimatethe ejecta mass using analytical expressions of Arnett(1982), the decline rate in V as a proxy for the bolomet-ric rise time, and the ejecta velocity, and we scale therelations such that a normal SN Ia has an ejecta massof 1.4 M⊙. From this relation, we see that the major-ity of SNe Iax have ejecta masses of ∼0.5± 0.2M⊙, andSN 2008ha has an ejecta mass slightly below 0.2 M⊙
(very similar to the 0.15 M⊙ of ejecta estimated byFoley et al. 2009).From these simple relations and scalings, it appears
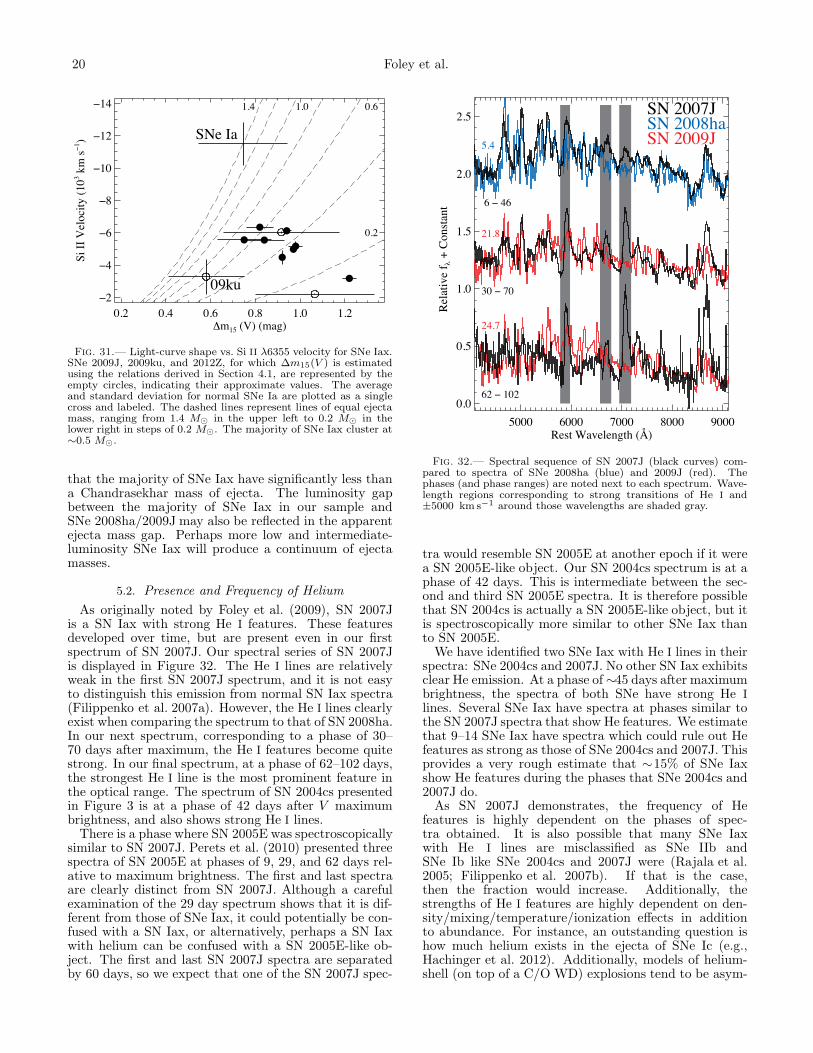
20 Foley et al.
0.2 0.4 0.6 0.8 1.0 1.2∆m15 (V) (mag)
−2
−4
−6
−8
−10
−12
−14
Si II
Vel
ocity
(103 k
m s−
1 )
1.4 1.0 0.6
0.2
SNe Ia
09ku
Fig. 31.— Light-curve shape vs. Si II λ6355 velocity for SNe Iax.SNe 2009J, 2009ku, and 2012Z, for which ∆m15(V ) is estimatedusing the relations derived in Section 4.1, are represented by theempty circles, indicating their approximate values. The averageand standard deviation for normal SNe Ia are plotted as a singlecross and labeled. The dashed lines represent lines of equal ejectamass, ranging from 1.4 M⊙ in the upper left to 0.2 M⊙ in thelower right in steps of 0.2 M⊙. The majority of SNe Iax cluster at∼0.5 M⊙.
that the majority of SNe Iax have significantly less thana Chandrasekhar mass of ejecta. The luminosity gapbetween the majority of SNe Iax in our sample andSNe 2008ha/2009J may also be reflected in the apparentejecta mass gap. Perhaps more low and intermediate-luminosity SNe Iax will produce a continuum of ejectamasses.
5.2. Presence and Frequency of Helium
As originally noted by Foley et al. (2009), SN 2007Jis a SN Iax with strong He I features. These featuresdeveloped over time, but are present even in our firstspectrum of SN 2007J. Our spectral series of SN 2007Jis displayed in Figure 32. The He I lines are relativelyweak in the first SN 2007J spectrum, and it is not easyto distinguish this emission from normal SN Iax spectra(Filippenko et al. 2007a). However, the He I lines clearlyexist when comparing the spectrum to that of SN 2008ha.In our next spectrum, corresponding to a phase of 30–70 days after maximum, the He I features become quitestrong. In our final spectrum, at a phase of 62–102 days,the strongest He I line is the most prominent feature inthe optical range. The spectrum of SN 2004cs presentedin Figure 3 is at a phase of 42 days after V maximumbrightness, and also shows strong He I lines.There is a phase where SN 2005E was spectroscopically
similar to SN 2007J. Perets et al. (2010) presented threespectra of SN 2005E at phases of 9, 29, and 62 days rel-ative to maximum brightness. The first and last spectraare clearly distinct from SN 2007J. Although a carefulexamination of the 29 day spectrum shows that it is dif-ferent from those of SNe Iax, it could potentially be con-fused with a SN Iax, or alternatively, perhaps a SN Iaxwith helium can be confused with a SN 2005E-like ob-ject. The first and last SN 2007J spectra are separatedby 60 days, so we expect that one of the SN 2007J spec-
5000 6000 7000 8000 9000Rest Wavelength (Å)
0.0
0.5
1.0
1.5
2.0
2.5
Rela
tive
f λ +
Cons
tant
SN 2007JSN 2008haSN 2009J5.4
21.8
24.7
6 − 46
30 − 70
62 − 102
Fig. 32.— Spectral sequence of SN 2007J (black curves) com-pared to spectra of SNe 2008ha (blue) and 2009J (red). Thephases (and phase ranges) are noted next to each spectrum. Wave-length regions corresponding to strong transitions of He I and±5000 km s−1 around those wavelengths are shaded gray.
tra would resemble SN 2005E at another epoch if it werea SN 2005E-like object. Our SN 2004cs spectrum is at aphase of 42 days. This is intermediate between the sec-ond and third SN 2005E spectra. It is therefore possiblethat SN 2004cs is actually a SN 2005E-like object, but itis spectroscopically more similar to other SNe Iax thanto SN 2005E.We have identified two SNe Iax with He I lines in their
spectra: SNe 2004cs and 2007J. No other SN Iax exhibitsclear He emission. At a phase of∼45 days after maximumbrightness, the spectra of both SNe have strong He I
lines. Several SNe Iax have spectra at phases similar tothe SN 2007J spectra that show He features. We estimatethat 9–14 SNe Iax have spectra which could rule out Hefeatures as strong as those of SNe 2004cs and 2007J. Thisprovides a very rough estimate that ∼15% of SNe Iaxshow He features during the phases that SNe 2004cs and2007J do.As SN 2007J demonstrates, the frequency of He
features is highly dependent on the phases of spec-tra obtained. It is also possible that many SNe Iaxwith He I lines are misclassified as SNe IIb andSNe Ib like SNe 2004cs and 2007J were (Rajala et al.2005; Filippenko et al. 2007b). If that is the case,then the fraction would increase. Additionally, thestrengths of He I features are highly dependent on den-sity/mixing/temperature/ionization effects in additionto abundance. For instance, an outstanding question ishow much helium exists in the ejecta of SNe Ic (e.g.,Hachinger et al. 2012). Additionally, models of helium-shell (on top of a C/O WD) explosions tend to be asym-
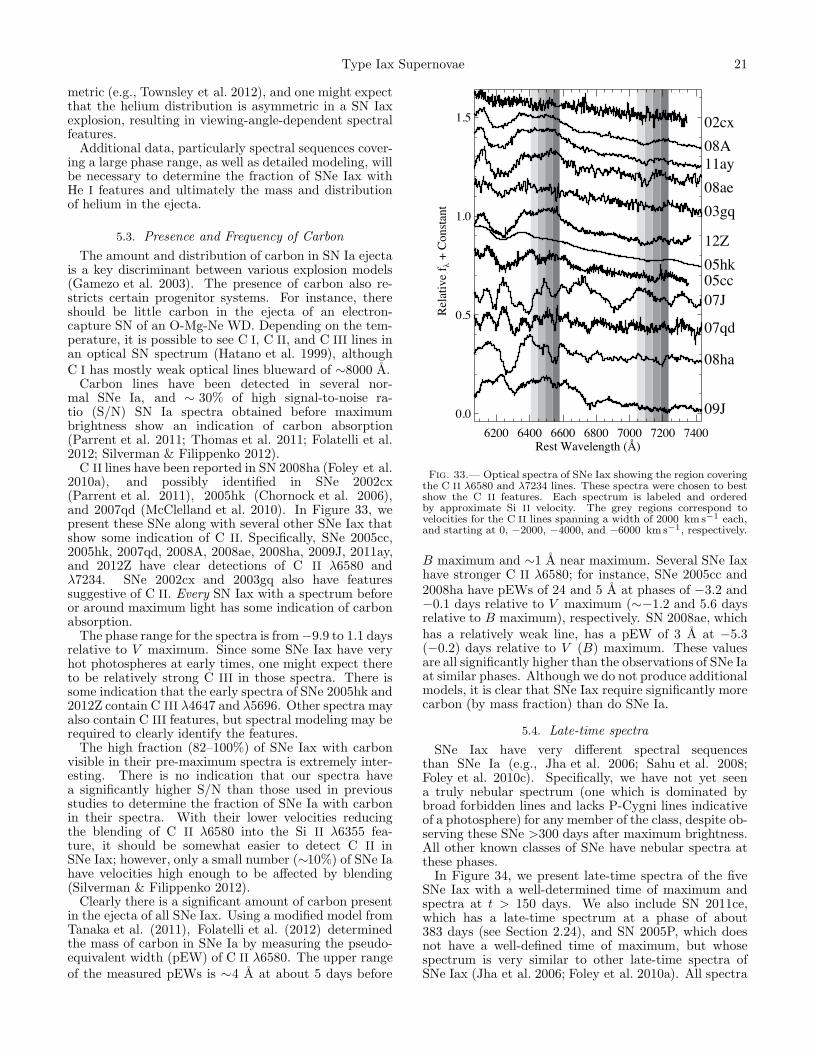
Type Iax Supernovae 21
metric (e.g., Townsley et al. 2012), and one might expectthat the helium distribution is asymmetric in a SN Iaxexplosion, resulting in viewing-angle-dependent spectralfeatures.Additional data, particularly spectral sequences cover-
ing a large phase range, as well as detailed modeling, willbe necessary to determine the fraction of SNe Iax withHe I features and ultimately the mass and distributionof helium in the ejecta.
5.3. Presence and Frequency of Carbon
The amount and distribution of carbon in SN Ia ejectais a key discriminant between various explosion models(Gamezo et al. 2003). The presence of carbon also re-stricts certain progenitor systems. For instance, thereshould be little carbon in the ejecta of an electron-capture SN of an O-Mg-Ne WD. Depending on the tem-perature, it is possible to see C I, C II, and C III lines inan optical SN spectrum (Hatano et al. 1999), althoughC I has mostly weak optical lines blueward of ∼8000 A.Carbon lines have been detected in several nor-
mal SNe Ia, and ∼ 30% of high signal-to-noise ra-tio (S/N) SN Ia spectra obtained before maximumbrightness show an indication of carbon absorption(Parrent et al. 2011; Thomas et al. 2011; Folatelli et al.2012; Silverman & Filippenko 2012).C II lines have been reported in SN 2008ha (Foley et al.
2010a), and possibly identified in SNe 2002cx(Parrent et al. 2011), 2005hk (Chornock et al. 2006),and 2007qd (McClelland et al. 2010). In Figure 33, wepresent these SNe along with several other SNe Iax thatshow some indication of C II. Specifically, SNe 2005cc,2005hk, 2007qd, 2008A, 2008ae, 2008ha, 2009J, 2011ay,and 2012Z have clear detections of C II λ6580 andλ7234. SNe 2002cx and 2003gq also have featuressuggestive of C II. Every SN Iax with a spectrum beforeor around maximum light has some indication of carbonabsorption.The phase range for the spectra is from−9.9 to 1.1 days
relative to V maximum. Since some SNe Iax have veryhot photospheres at early times, one might expect thereto be relatively strong C III in those spectra. There issome indication that the early spectra of SNe 2005hk and2012Z contain C III λ4647 and λ5696. Other spectra mayalso contain C III features, but spectral modeling may berequired to clearly identify the features.The high fraction (82–100%) of SNe Iax with carbon
visible in their pre-maximum spectra is extremely inter-esting. There is no indication that our spectra havea significantly higher S/N than those used in previousstudies to determine the fraction of SNe Ia with carbonin their spectra. With their lower velocities reducingthe blending of C II λ6580 into the Si II λ6355 fea-ture, it should be somewhat easier to detect C II inSNe Iax; however, only a small number (∼10%) of SNe Iahave velocities high enough to be affected by blending(Silverman & Filippenko 2012).Clearly there is a significant amount of carbon present
in the ejecta of all SNe Iax. Using a modified model fromTanaka et al. (2011), Folatelli et al. (2012) determinedthe mass of carbon in SNe Ia by measuring the pseudo-equivalent width (pEW) of C II λ6580. The upper rangeof the measured pEWs is ∼4 A at about 5 days before
0.0
0.5
1.0
1.5
Rela
tive
f λ +
Cons
tant
09J
08ha
07qd
07J05cc05hk12Z
03gq08ae11ay08A02cx
6200 6400 6600 6800 7000 7200 7400Rest Wavelength (Å)
Fig. 33.— Optical spectra of SNe Iax showing the region coveringthe C II λ6580 and λ7234 lines. These spectra were chosen to bestshow the C II features. Each spectrum is labeled and orderedby approximate Si II velocity. The grey regions correspond tovelocities for the C II lines spanning a width of 2000 km s−1 each,and starting at 0, −2000, −4000, and −6000 kms−1, respectively.
B maximum and ∼1 A near maximum. Several SNe Iaxhave stronger C II λ6580; for instance, SNe 2005cc and2008ha have pEWs of 24 and 5 A at phases of −3.2 and−0.1 days relative to V maximum (∼−1.2 and 5.6 daysrelative to B maximum), respectively. SN 2008ae, whichhas a relatively weak line, has a pEW of 3 A at −5.3(−0.2) days relative to V (B) maximum. These valuesare all significantly higher than the observations of SNe Iaat similar phases. Although we do not produce additionalmodels, it is clear that SNe Iax require significantly morecarbon (by mass fraction) than do SNe Ia.
5.4. Late-time spectra
SNe Iax have very different spectral sequencesthan SNe Ia (e.g., Jha et al. 2006; Sahu et al. 2008;Foley et al. 2010c). Specifically, we have not yet seena truly nebular spectrum (one which is dominated bybroad forbidden lines and lacks P-Cygni lines indicativeof a photosphere) for any member of the class, despite ob-serving these SNe >300 days after maximum brightness.All other known classes of SNe have nebular spectra atthese phases.In Figure 34, we present late-time spectra of the five
SNe Iax with a well-determined time of maximum andspectra at t > 150 days. We also include SN 2011ce,which has a late-time spectrum at a phase of about383 days (see Section 2.24), and SN 2005P, which doesnot have a well-defined time of maximum, but whosespectrum is very similar to other late-time spectra ofSNe Iax (Jha et al. 2006; Foley et al. 2010a). All spectra
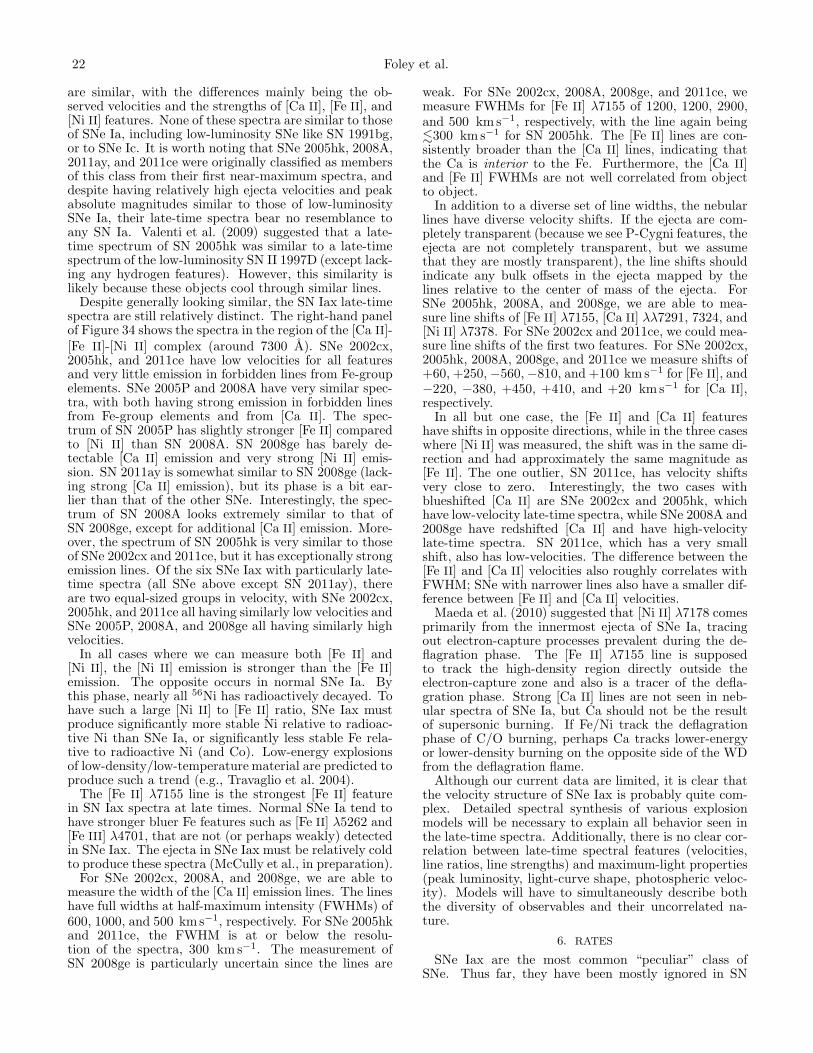
22 Foley et al.
are similar, with the differences mainly being the ob-served velocities and the strengths of [Ca II], [Fe II], and[Ni II] features. None of these spectra are similar to thoseof SNe Ia, including low-luminosity SNe like SN 1991bg,or to SNe Ic. It is worth noting that SNe 2005hk, 2008A,2011ay, and 2011ce were originally classified as membersof this class from their first near-maximum spectra, anddespite having relatively high ejecta velocities and peakabsolute magnitudes similar to those of low-luminositySNe Ia, their late-time spectra bear no resemblance toany SN Ia. Valenti et al. (2009) suggested that a late-time spectrum of SN 2005hk was similar to a late-timespectrum of the low-luminosity SN II 1997D (except lack-ing any hydrogen features). However, this similarity islikely because these objects cool through similar lines.Despite generally looking similar, the SN Iax late-time
spectra are still relatively distinct. The right-hand panelof Figure 34 shows the spectra in the region of the [Ca II]-[Fe II]-[Ni II] complex (around 7300 A). SNe 2002cx,2005hk, and 2011ce have low velocities for all featuresand very little emission in forbidden lines from Fe-groupelements. SNe 2005P and 2008A have very similar spec-tra, with both having strong emission in forbidden linesfrom Fe-group elements and from [Ca II]. The spec-trum of SN 2005P has slightly stronger [Fe II] comparedto [Ni II] than SN 2008A. SN 2008ge has barely de-tectable [Ca II] emission and very strong [Ni II] emis-sion. SN 2011ay is somewhat similar to SN 2008ge (lack-ing strong [Ca II] emission), but its phase is a bit ear-lier than that of the other SNe. Interestingly, the spec-trum of SN 2008A looks extremely similar to that ofSN 2008ge, except for additional [Ca II] emission. More-over, the spectrum of SN 2005hk is very similar to thoseof SNe 2002cx and 2011ce, but it has exceptionally strongemission lines. Of the six SNe Iax with particularly late-time spectra (all SNe above except SN 2011ay), thereare two equal-sized groups in velocity, with SNe 2002cx,2005hk, and 2011ce all having similarly low velocities andSNe 2005P, 2008A, and 2008ge all having similarly highvelocities.In all cases where we can measure both [Fe II] and
[Ni II], the [Ni II] emission is stronger than the [Fe II]emission. The opposite occurs in normal SNe Ia. Bythis phase, nearly all 56Ni has radioactively decayed. Tohave such a large [Ni II] to [Fe II] ratio, SNe Iax mustproduce significantly more stable Ni relative to radioac-tive Ni than SNe Ia, or significantly less stable Fe rela-tive to radioactive Ni (and Co). Low-energy explosionsof low-density/low-temperature material are predicted toproduce such a trend (e.g., Travaglio et al. 2004).The [Fe II] λ7155 line is the strongest [Fe II] feature
in SN Iax spectra at late times. Normal SNe Ia tend tohave stronger bluer Fe features such as [Fe II] λ5262 and[Fe III] λ4701, that are not (or perhaps weakly) detectedin SNe Iax. The ejecta in SNe Iax must be relatively coldto produce these spectra (McCully et al., in preparation).For SNe 2002cx, 2008A, and 2008ge, we are able to
measure the width of the [Ca II] emission lines. The lineshave full widths at half-maximum intensity (FWHMs) of600, 1000, and 500 kms−1, respectively. For SNe 2005hkand 2011ce, the FWHM is at or below the resolu-tion of the spectra, 300 km s−1. The measurement ofSN 2008ge is particularly uncertain since the lines are
weak. For SNe 2002cx, 2008A, 2008ge, and 2011ce, wemeasure FWHMs for [Fe II] λ7155 of 1200, 1200, 2900,and 500 km s−1, respectively, with the line again being!300 km s−1 for SN 2005hk. The [Fe II] lines are con-sistently broader than the [Ca II] lines, indicating thatthe Ca is interior to the Fe. Furthermore, the [Ca II]and [Fe II] FWHMs are not well correlated from objectto object.In addition to a diverse set of line widths, the nebular
lines have diverse velocity shifts. If the ejecta are com-pletely transparent (because we see P-Cygni features, theejecta are not completely transparent, but we assumethat they are mostly transparent), the line shifts shouldindicate any bulk offsets in the ejecta mapped by thelines relative to the center of mass of the ejecta. ForSNe 2005hk, 2008A, and 2008ge, we are able to mea-sure line shifts of [Fe II] λ7155, [Ca II] λλ7291, 7324, and[Ni II] λ7378. For SNe 2002cx and 2011ce, we could mea-sure line shifts of the first two features. For SNe 2002cx,2005hk, 2008A, 2008ge, and 2011ce we measure shifts of+60, +250,−560,−810, and +100 km s−1 for [Fe II], and−220, −380, +450, +410, and +20 km s−1 for [Ca II],respectively.In all but one case, the [Fe II] and [Ca II] features
have shifts in opposite directions, while in the three caseswhere [Ni II] was measured, the shift was in the same di-rection and had approximately the same magnitude as[Fe II]. The one outlier, SN 2011ce, has velocity shiftsvery close to zero. Interestingly, the two cases withblueshifted [Ca II] are SNe 2002cx and 2005hk, whichhave low-velocity late-time spectra, while SNe 2008A and2008ge have redshifted [Ca II] and have high-velocitylate-time spectra. SN 2011ce, which has a very smallshift, also has low-velocities. The difference between the[Fe II] and [Ca II] velocities also roughly correlates withFWHM; SNe with narrower lines also have a smaller dif-ference between [Fe II] and [Ca II] velocities.Maeda et al. (2010) suggested that [Ni II] λ7178 comes
primarily from the innermost ejecta of SNe Ia, tracingout electron-capture processes prevalent during the de-flagration phase. The [Fe II] λ7155 line is supposedto track the high-density region directly outside theelectron-capture zone and also is a tracer of the defla-gration phase. Strong [Ca II] lines are not seen in neb-ular spectra of SNe Ia, but Ca should not be the resultof supersonic burning. If Fe/Ni track the deflagrationphase of C/O burning, perhaps Ca tracks lower-energyor lower-density burning on the opposite side of the WDfrom the deflagration flame.Although our current data are limited, it is clear that
the velocity structure of SNe Iax is probably quite com-plex. Detailed spectral synthesis of various explosionmodels will be necessary to explain all behavior seen inthe late-time spectra. Additionally, there is no clear cor-relation between late-time spectral features (velocities,line ratios, line strengths) and maximum-light properties(peak luminosity, light-curve shape, photospheric veloc-ity). Models will have to simultaneously describe boththe diversity of observables and their uncorrelated na-ture.
6. RATES
SNe Iax are the most common “peculiar” class ofSNe. Thus far, they have been mostly ignored in SN
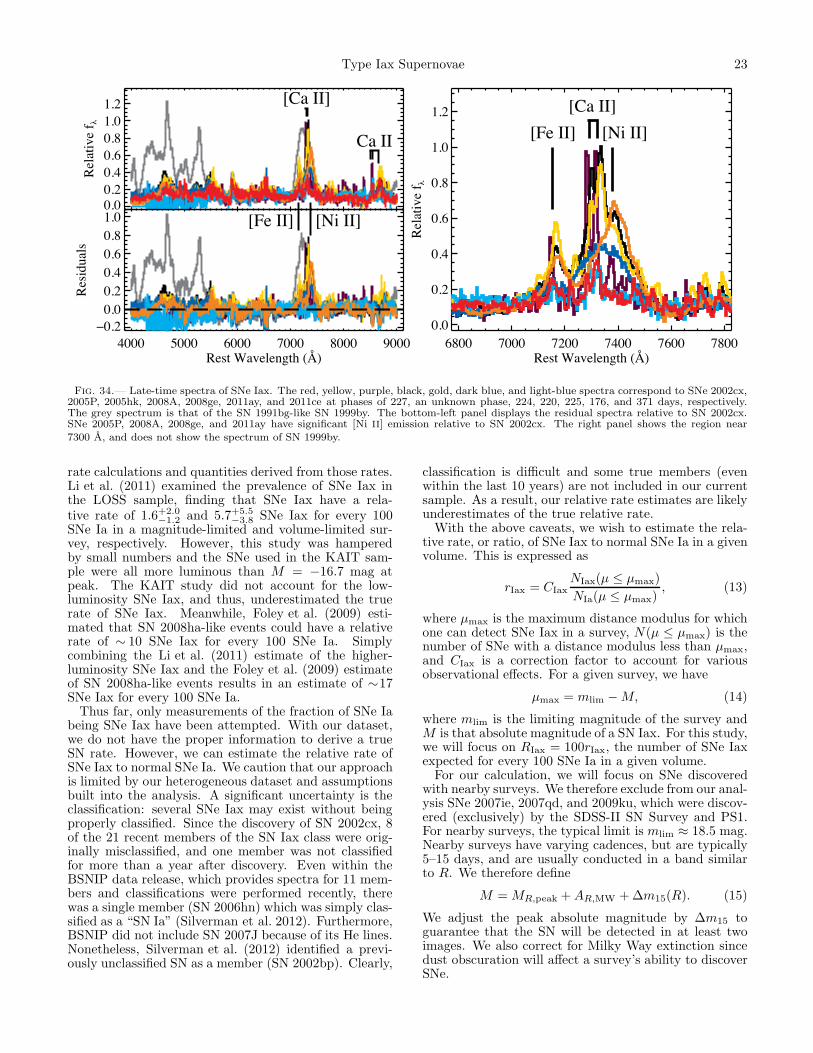
Type Iax Supernovae 23
0.00.20.40.60.81.01.2
Rela
tive
f λ[Ca II]
Ca II
4000 5000 6000 7000 8000 9000Rest Wavelength (Å)
−0.20.00.20.40.60.81.0
Resid
uals
[Fe II] [Ni II]
6800 7000 7200 7400 7600 7800Rest Wavelength (Å)
0.0
0.2
0.4
0.6
0.8
1.0
1.2
Rela
tive
f λ
[Ca II][Fe II] [Ni II]
Fig. 34.— Late-time spectra of SNe Iax. The red, yellow, purple, black, gold, dark blue, and light-blue spectra correspond to SNe 2002cx,2005P, 2005hk, 2008A, 2008ge, 2011ay, and 2011ce at phases of 227, an unknown phase, 224, 220, 225, 176, and 371 days, respectively.The grey spectrum is that of the SN 1991bg-like SN 1999by. The bottom-left panel displays the residual spectra relative to SN 2002cx.SNe 2005P, 2008A, 2008ge, and 2011ay have significant [Ni II] emission relative to SN 2002cx. The right panel shows the region near7300 A, and does not show the spectrum of SN 1999by.
rate calculations and quantities derived from those rates.Li et al. (2011) examined the prevalence of SNe Iax inthe LOSS sample, finding that SNe Iax have a rela-tive rate of 1.6+2.0
−1.2 and 5.7+5.5−3.8 SNe Iax for every 100
SNe Ia in a magnitude-limited and volume-limited sur-vey, respectively. However, this study was hamperedby small numbers and the SNe used in the KAIT sam-ple were all more luminous than M = −16.7 mag atpeak. The KAIT study did not account for the low-luminosity SNe Iax, and thus, underestimated the truerate of SNe Iax. Meanwhile, Foley et al. (2009) esti-mated that SN 2008ha-like events could have a relativerate of ∼ 10 SNe Iax for every 100 SNe Ia. Simplycombining the Li et al. (2011) estimate of the higher-luminosity SNe Iax and the Foley et al. (2009) estimateof SN 2008ha-like events results in an estimate of ∼17SNe Iax for every 100 SNe Ia.Thus far, only measurements of the fraction of SNe Ia
being SNe Iax have been attempted. With our dataset,we do not have the proper information to derive a trueSN rate. However, we can estimate the relative rate ofSNe Iax to normal SNe Ia. We caution that our approachis limited by our heterogeneous dataset and assumptionsbuilt into the analysis. A significant uncertainty is theclassification: several SNe Iax may exist without beingproperly classified. Since the discovery of SN 2002cx, 8of the 21 recent members of the SN Iax class were orig-inally misclassified, and one member was not classifiedfor more than a year after discovery. Even within theBSNIP data release, which provides spectra for 11 mem-bers and classifications were performed recently, therewas a single member (SN 2006hn) which was simply clas-sified as a “SN Ia” (Silverman et al. 2012). Furthermore,BSNIP did not include SN 2007J because of its He lines.Nonetheless, Silverman et al. (2012) identified a previ-ously unclassified SN as a member (SN 2002bp). Clearly,
classification is difficult and some true members (evenwithin the last 10 years) are not included in our currentsample. As a result, our relative rate estimates are likelyunderestimates of the true relative rate.With the above caveats, we wish to estimate the rela-
tive rate, or ratio, of SNe Iax to normal SNe Ia in a givenvolume. This is expressed as
rIax = CIaxNIax(µ ≤ µmax)
NIa(µ ≤ µmax), (13)
where µmax is the maximum distance modulus for whichone can detect SNe Iax in a survey, N(µ ≤ µmax) is thenumber of SNe with a distance modulus less than µmax,and CIax is a correction factor to account for variousobservational effects. For a given survey, we have
µmax = mlim −M, (14)
where mlim is the limiting magnitude of the survey andM is that absolute magnitude of a SN Iax. For this study,we will focus on RIax = 100rIax, the number of SNe Iaxexpected for every 100 SNe Ia in a given volume.For our calculation, we will focus on SNe discovered
with nearby surveys. We therefore exclude from our anal-ysis SNe 2007ie, 2007qd, and 2009ku, which were discov-ered (exclusively) by the SDSS-II SN Survey and PS1.For nearby surveys, the typical limit is mlim ≈ 18.5 mag.Nearby surveys have varying cadences, but are typically5–15 days, and are usually conducted in a band similarto R. We therefore define
M = MR,peak +AR,MW +∆m15(R). (15)
We adjust the peak absolute magnitude by ∆m15 toguarantee that the SN will be detected in at least twoimages. We also correct for Milky Way extinction sincedust obscuration will affect a survey’s ability to discoverSNe.
24 Foley et al.
Although we do not know the SN Iax luminosity func-tion, we have measured the peak absolute magnitude anddecline rate for several members. From these measure-ments, we determined a set of µmax, which are the max-imum distance moduli at which we would detect each ofthose SNe.The least luminous SN in the class is SN 2008ha, which
is at µ = 31.65 mag. The nominal scheme outlined aboveyields µlim = 31.60 mag for SN 2008ha. Having µlim <µ is likely the result of faster cadences for very nearbygalaxies; thus we choose µlim = 31.65 mag for SN 2008ha.If there are no SNe significantly fainter than SN 2008ha,we expect the sample within this volume to be reasonablycomplete, resulting in a relatively unbiased first look atthe relative rate.In the 10 years following the discovery of SN 2002cx,
there have been 22 normal SNe Ia and 4 SNe Iax(SNe 2008ge, 2008ha, 2010ae, and 2010el) discoveredwithin µlim = 31.65 mag (from the Asiago SN cata-log; Barbon et al. 1989). Unless there are significantlymore SNe Iax with luminosities less than SN 2008ha,this sample should be relatively complete for monitoredgalaxies (with the exception of misclassification, cadence,seasons, and weather). Using Poisson statistics withinthis volume, the uncorrected (CIax = 1) relative rateis RIax = 18+12
−9 . SNe 2010ae and 2010el have peakluminosities similar to that of SN 2008ha (Stritzingeret al., in preparation; Valenti et al., in preparation),while SN 2008ge is much more luminous than SN 2008ha(Foley et al. 2010c). If SNe 2008ha, 2010ae, or 2010elhad exploded when they were in close proximity to theSun, we would not have detected the SNe, while anySN Ia within that distance could have been discoveredmore than six months after explosion. Because of thatand other factors (host-galaxy dust reddening, weather,etc.), we perform the same analysis, but with CIax = 2for SNe 2008ha, 2010ae, and 2010el, and CIax = 1 forSN 2008ge. This then gives a corrected relative rate ofRIax = 30+21
−15.We can also place a relatively robust lower limit on the
relative rate using all 19 members found by nearby sur-veys since the discovery of SN 2002cx. Of the membersof the class with good R-band light curves, SN 2008Ais the most luminous. Within the volume defined byits µlim, there have been 573 spectroscopically normalSNe Ia as derived from the Asiago catalog with dis-tances cross-matched to NED. Within this volume, allSNe Ia (with the exception of those with extreme dustextinction) should be detectable for several months. Weexclude the peculiar SNe 2006bt (Foley et al. 2010b)and 2009dc (e.g., Yamanaka et al. 2009; Tanaka et al.2010; Silverman et al. 2011b), as well as SNe with red-shifts only derived from SN features (since these SNecould be potential SNe Iax). Without any correctionsfor luminosity or effects related to the surveys, we findRIax = 3.3+0.8
−0.7. This method is similar to what wasdone by Li et al. (2011), where only the most luminousSNe Iax were included in the rate calculation. Unsur-prisingly, our derived fraction is similar to the fractionfrom Li et al. (2011).We now perform a more thorough treatment with the
19 members found by nearby surveys since the discoveryof SN 2002cx, including SN 2002cx. For this, we assume
a luminosity function that has equal probability of a SNhaving the luminosity of any of the 6 SNe with measuredMR,peak and another, SN 2009J, which has a first mea-surement that appears to be at peak. Our sample, whichis composed of SNe discovered by magnitude-limited sur-veys, almost certainly underrepresents the fraction oflow-luminosity SNe Iax, which should result in an un-derestimated relative rate.The flat luminosity function produces 7 nested vol-
umes. If a member lies within the first volume (de-fined by SN 2008ha), it could have a luminosity simi-lar to any of the SNe defining the luminosity function.We therefore assign it a fractional membership to eachvolume (in this case, 1/7th of a SN per volume). Foreach SN without a well-defined peak magnitude, we at-tempt to determine limits on its absolute magnitude fromphotometry reported in the literature and its distancemodulus. We use this information to place further con-straints on the fraction of SNe in each volume. Forexample, SN 2008ge, which was discovered within thevolume defined by SN 2008ha, is much more luminous(MV ,peak = −17.60 mag) than SN 2008ha. It there-fore does not contribute to the rate of “SN 2008ha-like”SNe. SNe 2010ae and 2010el have MV ,peak ≈ −15.0and −14.7 mag, respectively (Stritzinger et al., in prep.;Valenti et al., in prep.). These magnitudes were esti-mated from B and r light curves and converted using therelations outlined in Section 4. However, these relationsmay not adequately describe SNe similar to SN 2008ha.For instance, from the B-band light curve, SN 2010aehas MB,peak ≈ −13.9 mag, only 0.2 mag brighter thanSN 2008ha, but after converting the estimated MV ,peakfor SN 2010ae is 0.8 mag brighter than SN 2008ha. Be-cause of the potential errors in the peak-magnitude es-timates along with uncertainties in reddening and dis-tance moduli, we include SNe 2010ae and 2010el as hav-ing equal chance of being in the first two volumes.For the reasons listed above as well as possible misclas-
sifications for fainter SNe, we assume CIax = 2. However,if CIax = 2 for the three closest volumes and CIax = 1 forthe rest or if CIax = 1.5 for all volumes, the relative ratedecreases by 13% and 8%, respectively. The correctedrelative rate (with CIax = 2) is RIax = 31+17
−13; however,as seen in Figure 35, the probability distribution functionis slightly skewed with there being 3% and 14% chancesthat the relative rate is RIax < 10 and RIax > 50, respec-tively.Our final, best relative rate of RIax = 31+17
−13 is verysimilar to what was found using only the most nearbySNe: RIax = 30+21
−15. This agreement provides an ad-ditional level of confidence for our values. Both valuesare marginally consistent with the combined Foley et al.(2009) and Li et al. (2011) rates of RIax ≈ 17.We can now estimate the amount of Fe generated by
SN Iax explosions relative to that of SNe Ia. Our es-timate relies on the assumption that the luminosity ofSNe Iax are powered primarily by 56Ni and its radioac-tive products; if they are powered by other radioactiveelements, the scalings assumed here would not apply.The other assumption is that the ratio of 56Ni to stable54Fe is the same (on average) for SNe Ia and SNe Iax.For our estimate, we use the 56Ni masses estimated byFoley et al. (2009) for SN 2008ha ((3.0±0.9)×10−3 M⊙)
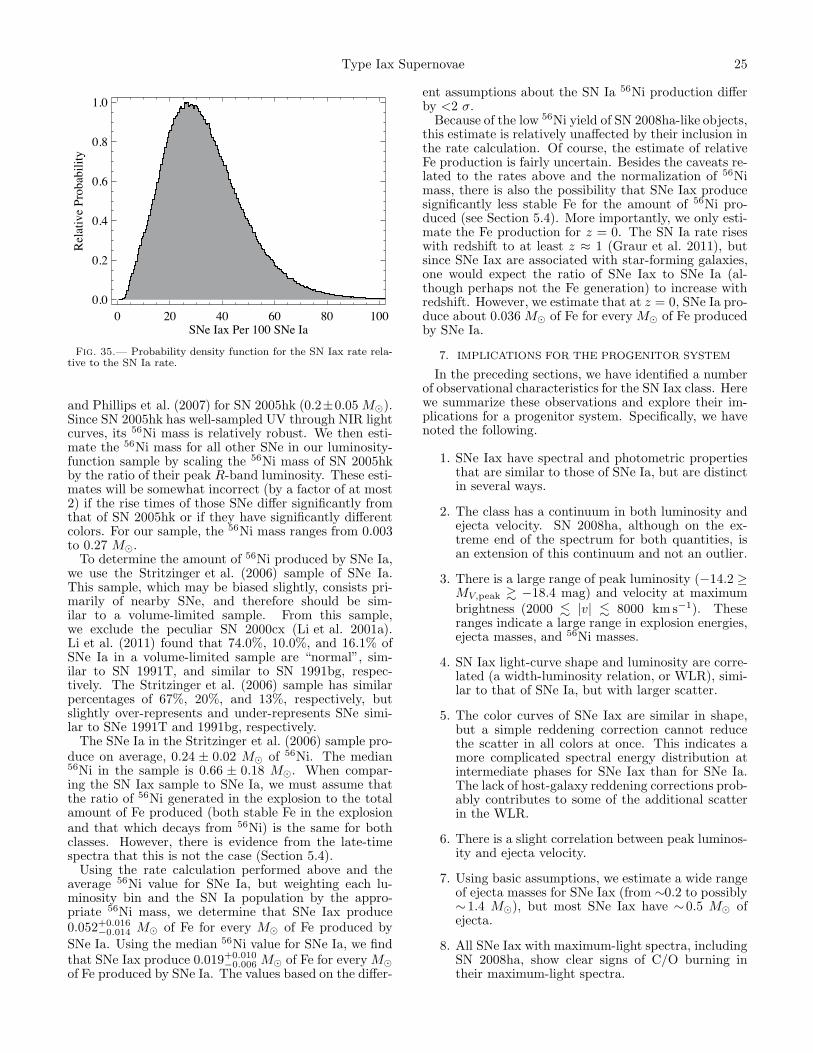
Type Iax Supernovae 25
0 20 40 60 80 100SNe Iax Per 100 SNe Ia
0.0
0.2
0.4
0.6
0.8
1.0
Rela
tive
Prob
abili
ty
Fig. 35.— Probability density function for the SN Iax rate rela-tive to the SN Ia rate.
and Phillips et al. (2007) for SN 2005hk (0.2±0.05 M⊙).Since SN 2005hk has well-sampled UV through NIR lightcurves, its 56Ni mass is relatively robust. We then esti-mate the 56Ni mass for all other SNe in our luminosity-function sample by scaling the 56Ni mass of SN 2005hkby the ratio of their peak R-band luminosity. These esti-mates will be somewhat incorrect (by a factor of at most2) if the rise times of those SNe differ significantly fromthat of SN 2005hk or if they have significantly differentcolors. For our sample, the 56Ni mass ranges from 0.003to 0.27 M⊙.To determine the amount of 56Ni produced by SNe Ia,
we use the Stritzinger et al. (2006) sample of SNe Ia.This sample, which may be biased slightly, consists pri-marily of nearby SNe, and therefore should be sim-ilar to a volume-limited sample. From this sample,we exclude the peculiar SN 2000cx (Li et al. 2001a).Li et al. (2011) found that 74.0%, 10.0%, and 16.1% ofSNe Ia in a volume-limited sample are “normal”, sim-ilar to SN 1991T, and similar to SN 1991bg, respec-tively. The Stritzinger et al. (2006) sample has similarpercentages of 67%, 20%, and 13%, respectively, butslightly over-represents and under-represents SNe simi-lar to SNe 1991T and 1991bg, respectively.The SNe Ia in the Stritzinger et al. (2006) sample pro-
duce on average, 0.24 ± 0.02 M⊙ of 56Ni. The median56Ni in the sample is 0.66 ± 0.18 M⊙. When compar-ing the SN Iax sample to SNe Ia, we must assume thatthe ratio of 56Ni generated in the explosion to the totalamount of Fe produced (both stable Fe in the explosionand that which decays from 56Ni) is the same for bothclasses. However, there is evidence from the late-timespectra that this is not the case (Section 5.4).Using the rate calculation performed above and the
average 56Ni value for SNe Ia, but weighting each lu-minosity bin and the SN Ia population by the appro-priate 56Ni mass, we determine that SNe Iax produce0.052+0.016
−0.014 M⊙ of Fe for every M⊙ of Fe produced bySNe Ia. Using the median 56Ni value for SNe Ia, we findthat SNe Iax produce 0.019+0.010
−0.006 M⊙ of Fe for every M⊙
of Fe produced by SNe Ia. The values based on the differ-
ent assumptions about the SN Ia 56Ni production differby <2 σ.Because of the low 56Ni yield of SN 2008ha-like objects,
this estimate is relatively unaffected by their inclusion inthe rate calculation. Of course, the estimate of relativeFe production is fairly uncertain. Besides the caveats re-lated to the rates above and the normalization of 56Nimass, there is also the possibility that SNe Iax producesignificantly less stable Fe for the amount of 56Ni pro-duced (see Section 5.4). More importantly, we only esti-mate the Fe production for z = 0. The SN Ia rate riseswith redshift to at least z ≈ 1 (Graur et al. 2011), butsince SNe Iax are associated with star-forming galaxies,one would expect the ratio of SNe Iax to SNe Ia (al-though perhaps not the Fe generation) to increase withredshift. However, we estimate that at z = 0, SNe Ia pro-duce about 0.036 M⊙ of Fe for every M⊙ of Fe producedby SNe Ia.
7. IMPLICATIONS FOR THE PROGENITOR SYSTEM
In the preceding sections, we have identified a numberof observational characteristics for the SN Iax class. Herewe summarize these observations and explore their im-plications for a progenitor system. Specifically, we havenoted the following.
1. SNe Iax have spectral and photometric propertiesthat are similar to those of SNe Ia, but are distinctin several ways.
2. The class has a continuum in both luminosity andejecta velocity. SN 2008ha, although on the ex-treme end of the spectrum for both quantities, isan extension of this continuum and not an outlier.
3. There is a large range of peak luminosity (−14.2 ≥MV,peak " −18.4 mag) and velocity at maximumbrightness (2000 ! |v| ! 8000 km s−1). Theseranges indicate a large range in explosion energies,ejecta masses, and 56Ni masses.
4. SN Iax light-curve shape and luminosity are corre-lated (a width-luminosity relation, or WLR), simi-lar to that of SNe Ia, but with larger scatter.
5. The color curves of SNe Iax are similar in shape,but a simple reddening correction cannot reducethe scatter in all colors at once. This indicates amore complicated spectral energy distribution atintermediate phases for SNe Iax than for SNe Ia.The lack of host-galaxy reddening corrections prob-ably contributes to some of the additional scatterin the WLR.
6. There is a slight correlation between peak luminos-ity and ejecta velocity.
7. Using basic assumptions, we estimate a wide rangeof ejecta masses for SNe Iax (from ∼0.2 to possibly∼1.4 M⊙), but most SNe Iax have ∼0.5 M⊙ ofejecta.
8. All SNe Iax with maximum-light spectra, includingSN 2008ha, show clear signs of C/O burning intheir maximum-light spectra.
26 Foley et al.
9. There is significant mixing of the ejecta with bothIMEs and Fe-group elements in all layers.
10. There are two SNe Iax that show helium lines intheir spectra. Because of radiative-transfer effects,viewing-angle dependencies, and other effects, per-haps all SNe Iax have significant amounts of he-lium in their ejecta. Since helium should not besynthesized in the explosion, there must be heliumsomewhere in the progenitor systems of these twoevents.
11. Every SN Iax with a premaximum spectrum hassome indication of carbon in the spectrum, with82% having clear absorption. SNe Ia, on the otherhand, show carbon in only 30% of SNe Ia withpremaximum spectra. By mass fraction, SNe Iaxshould have significantly more carbon than SNe Ia.
12. Late-time spectra of SNe Iax are very different fromthose of SNe Ia, with no truly nebular spectrum ofa SN Iax yet being observed.
13. In detail, the late-time spectra of SNe Iax differsignificantly from object to object. Specifically, thestrengths of various forbidden lines and the veloci-ties of both the permitted and forbidden lines varysignificantly between different SNe.
14. Unlike SNe 2002cx and 2005hk (Jha et al. 2006;Sahu et al. 2008), not all SNe Iax have exclu-sively low-velocity features in their late-time spec-tra. Some have [Fe II] FWHMs of ∼3000 km s−1.
15. All SNe Iax for which we have late-time spectrahave calcium interior to iron. This is the oppositeof what is seen in SNe Ia.
16. In the late-time spectra, the [Ni II] λ7378 featureis typically stronger than the [Fe II] λ7155 feature.This indicates that SNe Iax either produce muchmore stable Ni or much less stable Fe than SNe Ia.This is a prediction of a low-energy, low-densityexplosion (e.g., Travaglio et al. 2004).
17. The large-velocity line shifts of forbidden nebularlines suggest that the explosion was asymmetric.
18. The late-time spectra can be divided into distinctgroups having lower and higher velocities. Thelower-velocity group tends to have blueshifted Caand redshifted Fe, as determined by velocity shiftsin forbidden lines, along our line of site. The op-posite is true for the higher-velocity group. Thereis no evidence for a correlation between the lineshifts (or equivalently velocities at late times) andmaximum-light observables.
19. Because of their large range in luminosity, SNe Iaxhave been undercounted in previous rate estimates.Through a basic analysis, we find that in a givenvolume, for every 100 SNe Ia there should be 31+17
−13SNe Iax, although even this number is likely a lowestimate.
20. Although SNe Iax are relatively numerous, alarge fraction of the population consists of low-luminosity events which likely produce little Fe.We estimate that SNe Iax produce ∼0.036 M⊙ ofFe for every M⊙ of Fe produced by SNe Ia.
In addition to these findings, others have noted thefollowing.
21. A lack of a second maximum in the NIR (Li et al.2003).
22. A host-galaxy morphology distribution highlyskewed to late-type galaxies (Foley et al. 2009;Valenti et al. 2009).
23. SN 2005hk had very low polarization near maxi-mum brightness, indicating nearly spherical outerejecta (Chornock et al. 2006; Maund et al. 2010).
24. A lack of X-ray detections with 5 SNe Ia hav-ing 3σ luminosity limits below 9 × 1039 erg s−1
and 3 (SNe 2008ge, 2008ha, and 2010ae) below2.7× 1039 erg s−1 (Russell & Immler 2012). Theselimits are below most, but not all, detections andlimits for stripped-envelope core-collapse SNe atearly times (Perna et al. 2008).
25. The host galaxy of SN 2008ge is an S0 galaxy withno signs of star formation to deep limits. Addition-ally, pre-explosion HST images indicate that thereare no massive stars at or near the SN site to deeplimits.
It is remarkable that a long list of common propertiesapplies to a large sample given the small number of ob-servational criteria used to define the class. This is aclear indication that the SNe classified as Type Iax arephysically similar, representing a physical class and notsimply an observational class.The above list of properties for SNe Iax provides robust
tests for progenitor/explosion models. Below we exam-ine the various properties to constrain the set of possiblescenarios. During this analysis, we assume that all mem-bers identified as SNe Iax share a common progenitorsystem and explosion mechanism, although the detailsof that explosion may vary. However, it is possible thatwe have incorrectly grouped physically distinct SNe intothis single class. There may also be multiple progenitorpaths to create a SN Iax. Because of the relatively smalldata, we do not attempt to further subdivide the class.First, there are many reasons to believe that the pro-
genitor star was a WD. The progenitor of SN 2008ge wasmost likely a WD with no indication of massive stars nearthe SN site and strict limits on star formation in its hostgalaxy. More broadly, the estimated ejecta masses areall equal to or below a Chandrasekhar mass. If the pro-genitors were massive stars, then one would expect thatat least occasionally this limit would be exceeded. Ad-ditionally, SNe Iax over the full luminosity range showsclear signs of C/O burning, which is not expected in acore-collapse SN.However, complete thermonuclear burning of a WD
cannot reproduce the velocities observed and ejectamasses inferred. Roughly, a 0.5 M⊙ WD will be
Type Iax Supernovae 27
completely unbound and have ejecta velocities >2000(6000) km s−1 for pure helium to nickel or pure car-bon to nickel burning efficiencies of >4% and 7% (15%and 24%), respectively. That is, if 10% of the carbonin a 0.5 M⊙ WD is burned to 56Ni, then the star willbe unbound and the ejecta velocity will be larger than6000 km s−1. This implies incredibly inefficient burn-ing, either by traditional burning of a small percentageof the WD mass or by a more exotic, less efficient nuclearburning through the entire star.Furthermore, SNe 2004cs and 2007J have helium in
their spectra, and therefore there must be helium in theprogenitor system. There is no hydrogen in any spec-tra, suggesting that hydrogen is most likely absent inthe progenitor system. This indicates that either a HeWD or a nondegenerate He star is in the system. Theejecta mass from a He WD explosion should not exceed∼0.4 M⊙, making it an unlikely progenitor star. It ispossible that a He WD could be the binary companionof the primary star, but then one would expect there tobe many SNe Iax in early-type host galaxies. Having anyHe WD in the progenitor system is unlikely, and instead,a He-burning-star companion to a C/O WD is the mostlikely progenitor system.Tutukov & Yungelson (1996) predicted that C/O-He-
burning-star progenitor systems could have a rate sim-ilar to the Galactic SN Ia rate, but would not explainthe SNe Ia in older stellar populations. Performing a de-tailed population-synthesis analysis, Ruiter et al. (2011)found that 13% of sub-Chandrasekhar mass thermonu-clear SNe could come from a C/O WD-He star channel.Assuming that this channel produces SNe Iax and otherchannels produce SNe Ia, the population-synthesis rateis roughly consistent with our measured rate. This chan-nel has a relatively short delay time of ∼500 Myr, whichshould restrict the host-galaxy population to mostly spi-ral galaxies, but could include some SNe in S0 galaxies(like SN 2008ge).A single system has been identified as a C/O WD
with a He-burning-star companion for which mass trans-fer will begin before the end of the He-burning phase(Geier et al. 2012; Vennes et al. 2012). This systemshould be able to transfer mass for ∼50 Myr at a rate of∼10−9M⊙ year−1 for a potential total mass of ∼0.05 M⊙
of material.At certain accretion rates, He mass transfer to a C/O
WD can occur without periodic He flashes, resulting in amassive He shell. In this scenario (e.g., Iben & Tutukov1991; Tutukov & Yungelson 1996), after the WD ac-quires a significant He layer, the He layer can deto-nate, possibly causing a thermonuclear explosion withinthe C/O layer (Livne 1990; Woosley & Weaver 1994;Livne & Arnett 1995); this is sometimes called an “edge-lit” explosion.For C/O WDs with large He layers, most theoreti-
cal studies have focused on “double-detonation” mod-els where the He layer detonates (e.g., Nomoto 1982;Sim et al. 2012; Townsley et al. 2012), which in turncauses a detonation with the C/O layer (e.g., Nomoto1982; Fink et al. 2010; Sim et al. 2012). Although thereis still some discussion about the details of these explo-sions, the consensus is that it is difficult to reproduce thefull diversity of SNe Iax with this mechanism.
In addition to “double-detonation” models, it is pos-sible to detonate the He layer without causing the restof the star to explode. This “.Ia” model (Bildsten et al.2007; Shen et al. 2010) shares many characteristics withSNe Iax. Shen et al. (2010) and Waldman et al. (2011)examine the details of this model for high-mass and low-mass C/O cores, respectively. These models roughlymatch the characteristics and the diversity of SNe Iax,but it is unclear if they reproduce the explosions in de-tail. In particular, it is difficult to produce IMEs in theseexplosions, particularly for those on top of a high-masscore. These explosions also have low luminosity, so itappears difficult to reproduce SN 2002cx and more lumi-nous SNe using this model. Foley et al. (2009) examinehow these models match observations in detail.The single C/O WD/He-burning-star system should
produce a helium layer that is ∼ 0.05 M⊙ to per-haps 0.3 M⊙ (Iben & Tutukov 1991). Although thismass may not be enough to account for all of theejecta in SNe Iax, it should be massive enough to det-onate, perhaps triggering a double-detonation on a sub-Chandrasekhar mass SN (Fink et al. 2010). Sim et al.(2012) examined double-detonation models for relativelylow-mass sub-Chandrasekhar C/O WDs with ∼0.2 M⊙
He shells. The resulting observables were somewhat con-sistent with some SNe Iax (∆m15 ≈ 2 mag, trise ≈10 days, low luminosity, low velocity).Woosley & Kasen (2011) explored possible sub-
Chandrasekhar-mass explosion models, some of whichhad a He-layer detonation or deflagration. The mod-els, which only burned the He layer, and are somewhatsimilar to the .Ia model of Bildsten et al. (2007), roughlymatch the observables of SNe Iax. However, these mod-els should be exclusively low luminosity, low ejecta mass,and contain a significant amount of unburned He. Thesemodels have difficulty reproducing all of the character-istics of all SNe Iax and the full ranges of those charac-teristics, particularly the luminosity range. Because ofnon-thermal effects that are not fully modeled in the ra-diative transfer, it is unclear if He lines should be strongin the spectra of these events.A promising model for SNe Iax is a failed deflagration
of a C/O WD. In this model, a burning flame within theWD rises to the surface, expelling ∼0.2–0.4 M⊙ of mate-rial, some of which is the ash from the burning. In thismodel, the full WD is not consumed by the nuclear burn-ing, and the entire star is not disrupted. This model wasfirst proposed by Foley et al. (2009) as a possible expla-nation for SNe Iax. Model luminosity, ejecta mass, andvelocity are all consistent with SNe Iax (Jordan et al.2012; Kromer et al. 2012). It is unclear if this scenariorequires a thick He shell or if the He shell potentiallychanges the explosion properties, but it is possible thata He-shell explosion could trigger a failed deflagrationwithin the C/O core. Stable helium accretion occurs ata higher rate than stable hydrogen accretion, and thusthe WD density and temperature structure are differentfor the two scenarios. These differences may be impor-tant in understanding the nature of SN Iax explosions.Alternatively, since a He layer appears to be importantin creating SNe Iax, one might assume that an initial He-layer explosion is necessary to produce SNe Iax. Detailedmodeling of nucleosynthetic products and the resultinglight curves and spectra are still required, but one ex-
28 Foley et al.
pects products similar to those of a normal SN Ia withperhaps additional unburned material. This model con-tinues to be the most promising yet proposed.Assuming that all SNe Iax come from the same progen-
itor system and have the same explosion mechanism, themost promising model for SNe Iax is the deflagration ofa C/O WD, either triggered by an explosion in an outerHe layer or under conditions only met when stable Heaccretion occurs. The C/O WD would have a He-starbinary companion. A scenario very similar to this wasfirst proposed by Iben & Tutukov (1991). At least someof the time, and perhaps in all cases, the deflagrationfails to unbind the WD, leaving a stellar remnant thatmay be observationally distinct from most WDs. Specif-ically, given the large velocity shifts for nebular lines inthe late-time spectra of SNe Iax, one might expect a largekick for the remnant. Similarly, the energy injection andchemical enrichment may produce a puffed-up WD withpeculiar abundances (Jordan et al. 2012; Kromer et al.2012). This remnant may have particular observationalsignatures.Perets et al. (2010) and Sullivan et al. (2011) both sug-
gested similar explosion mechanisms, particularly Hedetonations on C/OWDs, for SN 2005E and PTF 09dav,respectively. These SNe share many characteristics withSNe Iax, including luminosity, velocity, and ejecta mass.However, both SN 2005E and PTF 09dav appear to comefrom old stellar populations (although PTF 09dav hadhydrogen in its late-time spectrum; Kasliwal et al. 2012).In particular, the host-galaxy morphology distribution ofSNe similar to SN 2005E is highly skewed to early-typegalaxies (Perets et al. 2010), the opposite of SNe Iax.SN 2005E and similar objects all show relatively strongHe at early times, again indicating He in the progeni-tor system. Perhaps SNe Iax are created in the abovescenario and SN 2005E was produced in a very similarscenario, except with a He WD companion instead of anondegenerate He star. This difference would accountfor the difference in stellar populations, and the accre-tion of degenerate and nondegenerate He could changethe stable accretion rates and/or nucleosynthesis enoughto create noticeably different events.
8. CONCLUSIONS
We have described in detail the observational proper-ties of the Type Iax class of SNe. A SN is a member ofthis class if it has four observational properties, three ofwhich can be determined from a single maximum-lightspectrum: (1) no evidence of hydrogen in any spectrum,(2) relatively low ejecta velocity near maximum bright-ness (|v| ! 8000 km s−1), (3) an absolute magnitude thatis low relative to a SN Ia with the same light-curve shape,and (4) spectra that are similar to SN 2002cx at similarepochs. Using these criteria, we have identified 25 mem-bers of this class. We presented optical photometry andspectroscopy for various members of this class.SNe Iax represent a distinct stellar endpoint from
SNe Ia and other common SNe. The class has alarge range of luminosities, ejecta velocities, and inferredejecta masses. Although there are clear signs of C/Oburning in their ejecta, some SNe Iax also have He I linesin their spectra. As a possible progenitor system, a C/OWD that accretes from a nondegenerate He star and un-dergoes a (sometimes partial) deflagration matches the
SN observables. The lifetimes of such systems are con-sistent with the SN Iax host-galaxy morphology distri-bution. Similarly, the rates of explosions from these sys-tems roughly match the measured rates of 31+17
−13 SNe Iaxfor every 100 SNe Ia. This is perhaps a simplified viewof the real physical picture, and future observations willtest this model.Additional studies of the details of the properties of
SNe Iax should improve our knowledge of both this classof SN as well as providing insight into normal SNe Ia. Forinstance, if C/O WD-He-star systems exclusively pro-duce SNe Iax, then we can rule out these systems asnormal SN Ia progenitors.SNe Iax are relatively common (about a third as com-
mon as SNe Ia at z = 0), and deep transient surveysof the local universe should discover a significant num-ber. LSST is expected to discover ∼106 SNe over its life-time. Even taking the conservative, magnitude-limitedrate for SNe Iax, LSST should discover more than 104
SNe Iax, similar to the number of SNe Ia discovered tothis day. Additionally, because of their frequency, wewill continue to discover many in the very local universe(D ! 20 Mpc), allowing detailed studies of individual ob-jects and their stellar environments. The combination ofthorough studies of local events and an upcoming largesample will undoubtedly improve our understanding ofthis recently discovered class of stellar explosion.
Facilities: du Pont(Tek5), ESO:3.6m(EFOSC),FLWO:1.5m(FAST), Keck:I(LRIS), KAIT, Shane(Kast),Magellan:Baade(IMACS), Magellan:Clay(LDSS3),NTT(EMMI), PROMPT, Swope(SITe3)
R.J.F. is supported by a Clay Fellowship. Supernovaresearch at Harvard is supported by NSF grant AST–1211196. A.V.F.’s supernova group at U.C. Berkeleyis supported by Gary & Cynthia Bengier, the Richard& Rhoda Goldman Fund, the Christopher R. RedlichFund, the TABASGO Foundation, and NSF grants AST-0908886 and AST-1211916. KAIT and its ongoing opera-tion were made possible by donations from Sun Microsys-tems, Inc., the Hewlett-Packard Company, AutoScopeCorporation, Lick Observatory, the NSF, the Universityof California, the Sylvia & Jim Katzman Foundation, andthe TABASGO Foundation. CSP material is based uponwork supported by the NSF under grants AST-0306969,AST-0607438, and AST-1008343. M.S. acknowledgesgenerous support provided by the Danish Agency for Sci-ence and Technology and Innovation through a SapereAude Level 2 grant. J.A., M.H., and G.P. acknowledgesupport provided by the Millennium Center for Super-nova Science through grant P10-064-F (funded by “Pro-grama Bicentenario de Ciencia y Tecnologıa de CON-ICYT” and “Programa Iniciativa Cientıfica Milenio deMIDEPLAN”), with input from ‘Fondo de Innovacionpara la Competitividad, del Ministerio de Economıa, Fo-mento y Turismo de Chile’. J.A. and G.P. also acknowl-edge support by CONICYT through FONDECYT grants3110142 and 11090421, respectively. Support for this re-search at Rutgers University was provided in part byNSF CAREER award AST-0847157 to S.W.J.We thank all of the amateur astronomers who have
searched for supernovae. The discovery of many SNe Iax
Type Iax Supernovae 29
is the result of their tireless effort. We especially thank C.Moore, discoverer of SN 2008ha. We gratefully acknowl-edge L. Bildsten, A. Gal-Yam, M. Hicken, D. Leonard, R.Margutti, T. Matheson, K. Moore, J. Nordin, L. Ostman,H. Perets, T. Piro, E. Ramirez-Ruiz, D. Sahu, K. Shen,V. Stanishev, and S. Valenti for providing data, insights,and/or help for this study. R. Assef, A. Barth, V. Ben-nert, P. Berlind, P. Blanchard, G. Canalizo, B. Cenko,K. Clubb, D. Cohen, A. Diamond-Stanic, G. Folatelli, S.Hoenig, J. Irwin, M. Lazarova, N. Lee, A. Miller, A. Mor-gan, P. Nugent, D. Poznanski, J. Rex, A. Sonnenfeld, T.Steele, B. Tucker, and J. Walsh helped obtain some datapresented in this paper; we thank them for their time.We are indebted to the staffs at the La Silla, Las Cam-panas, Lick, Keck, and Fred L. Whipple Observatoriesfor their dedicated services.Some of the data presented herein were obtained at
the W. M. Keck Observatory, which is operated as ascientific partnership among the California Institute ofTechnology, the University of California, and the Na-
tional Aeronautics and Space Administration (NASA);the observatory was made possible by the generous fi-nancial support of the W. M. Keck Foundation. Thisresearch has made use of the NASA/IPAC ExtragalacticDatabase (NED), which is operated by the Jet Propul-sion Laboratory, California Institute of Technology, un-der contract with NASA. The analysis pipeline used toreduce the DEIMOS data was developed at UC Berkeleywith support from NSF grant AST-0071048. NTT datawas obtained under ESO Programme was 080.A-0516.Part of the analysis occurred when R.J.F. visited the
Aspen Center for Physics during the Summer 2012 work-shops, “Non-Gaussianity as a Window to the PrimordialUniverse” and “The Evolution of Massive Stars and Pro-genitors of GRBs”, as well as during his time at the Cen-ter as an independent researcher. This material is basedupon work supported in part by the National ScienceFoundation under Grant No. 1066293 and the hospital-ity of the Aspen Center for Physics. Some analysis wasperformed at the Woody Creek Community Center inWoody Creek, CO.
REFERENCES
Abazajian, K. N., et al. 2009, ApJS, 182, 543Alard, C. 2000, A&AS, 144, 363Alard, C., & Lupton, R. H. 1998, ApJ, 503, 325Anderson, J., & Morrell, N. 2011, Central Bureau Electronic
Telegrams, 2715, 2Antilogus, P., et al. 2005, The Astronomer’s Telegram, 502, 1Arnett, W. D. 1982, ApJ, 253, 785Barbon, R., Cappellaro, E., & Turatto, M. 1989, A&AS, 81, 421Barentine, J., et al. 2005, Central Bureau Electronic Telegrams,
268, 1Bassett, B., et al. 2007a, Central Bureau Electronic Telegrams,
1137, 1——. 2007b, Central Bureau Electronic Telegrams, 1057, 1Benetti, S., et al. 2005, ApJ, 623, 1011Bessell, M. S., Schmidt, B. P., & Foley, R. J. 2010, Central
Bureau Electronic Telegrams, 2337, 1Bildsten, L., Shen, K. J., Weinberg, N. N., & Nelemans, G. 2007,
ApJ, 662, L95Blanchard, P., Cenko, S. B., Li, W., & Filippenko, A. V. 2011,
Central Bureau Electronic Telegrams, 2678, 1Blondin, S., & Berlind, P. 2008, Central Bureau Electronic
Telegrams, 1198, 1Blondin, S., & Calkins, M. 2008, Central Bureau Electronic
Telegrams, 1250, 1Blondin, S., et al. 2006, AJ, 131, 1648——. 2012, AJ, 143, 126Blondin, S., & Tonry, J. L. 2007, ApJ, 666, 1024Branch, D., Baron, E., Thomas, R. C., Kasen, D., Li, W., &
Filippenko, A. V. 2004, PASP, 116, 903Branch, D., Fisher, A., & Nugent, P. 1993, AJ, 106, 2383Burket, J., & Li, W. 2005a, IAU Circ., 8625, 2——. 2005b, IAU Circ., 8472, 1Buzzoni, B., et al. 1984, The Messenger, 38, 9Cenko, S. B., et al. 2012, Central Bureau Electronic Telegrams,
3014, 1Chomiuk, L., et al. 2011, ApJ, 743, 114Chornock, R., Filippenko, A. V., Branch, D., Foley, R. J., Jha, S.,
& Li, W. 2006, PASP, 118, 722Contreras, C., et al. 2010, AJ, 139, 519Copin, Y., et al. 2012, The Astronomer’s Telegram, 4476, 1Dekker, H., Delabre, B., & Dodorico, S. 1986, in Society of
Photo-Optical Instrumentation Engineers (SPIE) ConferenceSeries, Vol. 627, Society of Photo-Optical InstrumentationEngineers (SPIE) Conference Series, ed. D. L. Crawford,339–348
Dressler, A., et al. 2011, PASP, 123, 288Fabricant, D., Cheimets, P., Caldwell, N., & Geary, J. 1998,
PASP, 110, 79Filippenko, A. V. 1997, ARA&A, 35, 309
Filippenko, A. V., & Chornock, R. 2003, IAU Circ., 8211, 2Filippenko, A. V., & Foley, R. J. 2005, IAU Circ., 8486, 3Filippenko, A. V., Foley, R. J., & Desroches, L. 2003, IAU Circ.,
8170, 2Filippenko, A. V., Foley, R. J., Silverman, J. M., Blondin, S.,
Matheson, T., & Berlind, P. 2007a, Central Bureau ElectronicTelegrams, 817, 1
Filippenko, A. V., Foley, R. J., Silverman, J. M., Chornock, R.,Li, W., Blondin, S., & Matheson, T. 2007b, Central BureauElectronic Telegrams, 926, 1
Filippenko, A. V., Li, W. D., Treffers, R. R., & Modjaz, M. 2001,in ASP Conf. Ser. 246: IAU Colloq. 183: Small TelescopeAstronomy on Global Scales, ed. B. Paczynski, W.-P. Chen, &C. Lemme, 121–+
Filippenko, A. V., et al. 1992a, AJ, 104, 1543——. 1992b, ApJ, 384, L15Fink, M., Ropke, F. K., Hillebrandt, W., Seitenzahl, I. R., Sim,
S. A., & Kromer, M. 2010, A&A, 514, A53+Folatelli, G., et al. 2012, ApJ, 745, 74Foley, R. J. 2008, Central Bureau Electronic Telegrams, 1576, 2Foley, R. J., Brown, P. J., Rest, A., Challis, P. J., Kirshner, R. P.,
& Wood-Vasey, W. M. 2010a, ApJ, 708, L61Foley, R. J., et al. 2012a, ApJ, 744, 38——. 2009, AJ, 138, 376Foley, R. J., & Filippenko, A. V. 2005, IAU Circ., 8465, 2Foley, R. J., & Kasen, D. 2011, ApJ, 729, 55Foley, R. J., Moore, M., Wong, D. S., Pooley, D., & Filippenko,
A. V. 2006, Central Bureau Electronic Telegrams, 694, 1Foley, R. J., Narayan, G., Challis, P. J., Filippenko, A. V.,
Kirshner, R. P., Silverman, J. M., & Steele, T. N. 2010b, ApJ,708, 1748
Foley, R. J., et al. 2003, PASP, 115, 1220——. 2010c, AJ, 140, 1321Foley, R. J., Sanders, N. E., & Kirshner, R. P. 2011, ApJ, 742, 89Foley, R. J., et al. 2012b, ApJ, 752, 101Gal-Yam, A. 2005, The Astronomer’s Telegram, 391, 1Gal-Yam, A., & Maoz, D. 1999, IAU Circ., 7130, 1Gal-Yam, A., Maoz, D., Guhathakurta, P., & Filippenko, A. V.
2008, ApJ, 680, 550Gal-Yam, A., Maoz, D., Stathakis, R. A., & Aldering, G. 2000,
IAU Circ., 7357, 2Gamezo, V. N., Khokhlov, A. M., Oran, E. S., Chtchelkanova,
A. Y., & Rosenberg, R. O. 2003, Science, 299, 77Ganeshalingam, M., Li, W., & Filippenko, A. V. 2011, MNRAS,
416, 2607Ganeshalingam, M., et al. 2010, ApJS, 190, 418——. 2012, ApJ, 751, 142Garavini, G., et al. 2004, AJ, 128, 387Geier, S., et al. 2012, ArXiv e-prints, 1209.4740
30 Foley et al.
Gomez, G., Lopez, R., & Sanchez, F. 1996, AJ, 112, 2094Graham, J., Weisz, D., Li, W., Puckett, T., Langoussis, A., &
Marcus, M. 2003, IAU Circ., 8168, 1Graur, O., et al. 2011, MNRAS, 417, 916Hachinger, S., Mazzali, P. A., Taubenberger, S., Hillebrandt, W.,
Nomoto, K., & Sauer, D. N. 2012, MNRAS, 422, 70Hamuy, M., et al. 2006, PASP, 118, 2Hatano, K., Branch, D., Fisher, A., Millard, J., & Baron, E. 1999,
ApJS, 121, 233Hicken, M., et al. 2009, ApJ, 700, 331——. 2012, ApJS, 200, 12Hicken, M., Garnavich, P. M., Prieto, J. L., Blondin, S., DePoy,
D. L., Kirshner, R. P., & Parrent, J. 2007, ApJ, 669, L17Horne, K. 1986, PASP, 98, 609Howell, D. A., et al. 2006, Nature, 443, 308Iben, Jr., I., & Tutukov, A. V. 1991, ApJ, 370, 615Jha, S., Branch, D., Chornock, R., Foley, R. J., Li, W., Swift,
B. J., Casebeer, D., & Filippenko, A. V. 2006, AJ, 132, 189Jordan, IV, G. C., Perets, H. B., Fisher, R. T., & van Rossum,
D. R. 2012, ArXiv e-prints, 1208.5069Kasliwal, M. M., et al. 2012, ApJ, 755, 161——. 2010, ApJ, 723, L98Kelly, B. C. 2007, ApJ, 665, 1489Khokhlov, A. M. 1991, A&A, 245, 114Kromer, M., et al. 2012, ArXiv e-prints, 1210.5243Landolt, A. U. 1992, AJ, 104, 340Lee, N., Li, W., Newton, J., & Puckett, T. 2007, Central Bureau
Electronic Telegrams, 809, 1Leibundgut, B., et al. 1993, AJ, 105, 301Li, W., et al. 2003, PASP, 115, 453——. 2001a, PASP, 113, 1178Li, W., Filippenko, A. V., Treffers, R. R., Riess, A. G., Hu, J., &
Qiu, Y. 2001b, ApJ, 546, 734Li, W., et al. 2011, MNRAS, 412, 1441Li, W., Singer, D., & Boles, T. 2004, IAU Circ., 8361, 1Li, W. D., et al. 2000, in American Institute of Physics
Conference Series, Vol. 522, American Institute of PhysicsConference Series, ed. S. S. Holt & W. W. Zhang, 103–106
Lira, P., et al. 1998, AJ, 115, 234Livne, E. 1990, ApJ, 354, L53Livne, E., & Arnett, D. 1995, ApJ, 452, 62Maeda, K., Taubenberger, S., Sollerman, J., Mazzali, P. A.,
Leloudas, G., Nomoto, K., & Motohara, K. 2010, ApJ, 708,1703
Maund, J. R., et al. 2010, ApJ, 722, 1162Maza, J., et al. 2011, Central Bureau Electronic Telegrams, 2715,
1Mazzali, P. A., Ropke, F. K., Benetti, S., & Hillebrandt, W. 2007,
Science, 315, 825McClelland, C. M., et al. 2010, ApJ, 720, 704Miller, J. S., & Stone, R. P. S. 1993, Lick Obs. Tech. Rep. 66
(Santa Cruz: Lick Obs.)Milne, P. A., et al. 2010, ApJ, 721, 1627Minkowski, R. 1941, PASP, 53, 224Monard, L. A. G. 2010, Central Bureau Electronic Telegrams,
2334, 1Moriya, T., Tominaga, N., Tanaka, M., Nomoto, K., Sauer, D. N.,
Mazzali, P. A., Maeda, K., & Suzuki, T. 2010, ApJ, 719, 1445Nakano, S., Ichimura, Y., Itagaki, K., Kadota, K., & Hirose, Y.
2008, Central Bureau Electronic Telegrams, 1193, 1Narayan, G., et al. 2011, ApJ, 731, L11+Nomoto, K. 1982, ApJ, 257, 780Oke, J. B., et al. 1995, PASP, 107, 375Ostman, L., et al. 2011, A&A, 526, A28+Parrent, J. T., et al. 2011, ApJ, 732, 30Pastorello, A., et al. 2010, ApJ, 724, L16Perets, H. B., et al. 2010, Nature, 465, 322Perna, R., Soria, R., Pooley, D., & Stella, L. 2008, MNRAS, 384,
1638Phillips, M. M. 1993, ApJ, 413, L105Phillips, M. M., et al. 2007, PASP, 119, 360Phillips, M. M., Wells, L. A., Suntzeff, N. B., Hamuy, M.,
Leibundgut, B., Kirshner, R. P., & Foltz, C. B. 1992, AJ, 103,1632
Pignata, G., et al. 2010, Central Bureau Electronic Telegrams,2184, 1
——. 2008, Central Bureau Electronic Telegrams, 1531, 1——. 2009, Central Bureau Electronic Telegrams, 1661, 1Pogge, R. W., Garnavich, P., & Pedani, M. 2011, Central Bureau
Electronic Telegrams, 2678, 2Pollas, C., Filippenko, A. V., Cappellaro, E., & della Valle, M.
1992, IAU Circ., 5420, 2Poznanski, D., et al. 2010, Science, 327, 58Puckett, T., & Ireland, R. 2004, Central Bureau Electronic
Telegrams, 102, 1Puckett, T., & Langoussis, A. 2002, IAU Circ., 7847, 2Puckett, T., Langoussis, A., & Harris, B. 2005, Central Bureau
Electronic Telegrams, 154, 1Puckett, T., Langoussis, A., & Marcus, M. 2003, Central Bureau
Electronic Telegrams, 38, 1Puckett, T., Moore, C., Newton, J., & Orff, T. 2008, Central
Bureau Electronic Telegrams, 1567, 1Quimby, R. M., et al. 2011, Nature, 474, 487Quimby, R. M., Yuan, F., Akerlof, C., Wheeler, J. C., & Warren,
M. S. 2012, ArXiv e-prints, 1210.3428Rajala, A. M., et al. 2005, PASP, 117, 132Reichart, D., et al. 2005, Nuovo Cimento C Geophysics Space
Physics C, 28, 767Rest, A., et al. 2009, Central Bureau Electronic Telegrams, 2012,
1Riess, A. G., Press, W. H., & Kirshner, R. P. 1996, ApJ, 473, 88Ruiter, A. J., Belczynski, K., Sim, S. A., Hillebrandt, W., Fryer,
C. L., Fink, M., & Kromer, M. 2011, MNRAS, 417, 408Russell, B. R., & Immler, S. 2012, ApJ, 748, L29Sahu, D. K., et al. 2008, ApJ, 680, 580Scalzo, R., et al. 2012, ApJ, 757, 12Sehgal, A., Gagliano, R., & Puckett, T. 2006, Central Bureau
Electronic Telegrams, 653, 1Shen, K. J., Kasen, D., Weinberg, N. N., Bildsten, L., &
Scannapieco, E. 2010, ApJ, 715, 767Silverman, J. M., & Filippenko, A. V. 2012, MNRAS, 425, 1917Silverman, J. M., Filippenko, A. V., Barth, A. J., Walsh, J. L., &
Assef, R. J. 2011a, Central Bureau Electronic Telegrams, 2681,1
Silverman, J. M., et al. 2012, MNRAS, 425, 1789Silverman, J. M., Ganeshalingam, M., Li, W., Filippenko, A. V.,
Miller, A. A., & Poznanski, D. 2011b, MNRAS, 410, 585Sim, S. A., Fink, M., Kromer, M., Ropke, F. K., Ruiter, A. J., &
Hillebrandt, W. 2012, MNRAS, 420, 3003Sostero, G., Puckett, T., & Orff, T. 2008, Central Bureau
Electronic Telegrams, 1247, 1Stanishev, V., et al. 2007, in American Institute of Physics
Conference Series, Vol. 924, The Multicolored Landscape ofCompact Objects and Their Explosive Origins, ed. T. di Salvo,G. L. Israel, L. Piersant, L. Burderi, G. Matt, A. Tornambe, &M. T. Menna, 336–341
Stritzinger, M. 2009, Central Bureau Electronic Telegrams, 1665,1
Stritzinger, M., Folatelli, G., Pignata, G., & Phillips, M. M.2010a, Central Bureau Electronic Telegrams, 2184, 2
Stritzinger, M., Leibundgut, B., Walch, S., & Contardo, G. 2006,A&A, 450, 241
Stritzinger, M., Phillips, M. M., Folatelli, G., & Foley, R. J.2010b, Central Bureau Electronic Telegrams, 2191, 1
Stritzinger, M., et al. 2012, ApJ, 756, 173Stritzinger, M. D., et al. 2011, AJ, 142, 156Sullivan, M., et al. 2011, ApJ, 732, 118Tanaka, M., et al. 2010, ApJ, 714, 1209Tanaka, M., Mazzali, P. A., Stanishev, V., Maurer, I., Kerzendorf,
W. E., & Nomoto, K. 2011, MNRAS, 410, 1725Thomas, R. C., et al. 2011, ApJ, 743, 27Townsley, D. M., Moore, K., & Bildsten, L. 2012, ApJ, 755, 4Travaglio, C., Hillebrandt, W., Reinecke, M., & Thielemann,
F.-K. 2004, A&A, 425, 1029Tutukov, A., & Yungelson, L. 1996, MNRAS, 280, 1035Valenti, S., et al. 2009, Nature, 459, 674Vennes, S., Kawka, A., O’Toole, S. J., Nemeth, P., & Burton, D.
2012, ApJ, 759, L25Wade, R. A., & Horne, K. 1988, ApJ, 324, 411Waldman, R., Sauer, D., Livne, E., Perets, H., Glasner, A.,
Mazzali, P., Truran, J. W., & Gal-Yam, A. 2011, ApJ, 738, 21Wood-Vasey, W. M., Aldering, G., Nugent, P., Helin, E. F.,
Pravdo, S., Hicks, M., & Lawrence, K. 2002, IAU Circ., 7902, 3
Type Iax Supernovae 31
Woosley, S. E., & Kasen, D. 2011, ApJ, 734, 38Woosley, S. E., & Weaver, T. A. 1994, ApJ, 423, 371
Wright, D., et al. 2012, The Astronomer’s Telegram, 4516, 1Yamanaka, M., et al. 2009, ApJ, 707, L118