Embed Size (px)
Citation preview
The VVV Survey reveals classical Cepheids tracing a young and
thin stellar disk across the Galaxy’s bulge
I. Dekany1,2, D. Minniti3,1,4, D. Majaess5,6, M. Zoccali2,1, G. Hajdu2,1, J. Alonso-Garcıa7,1,
M. Catelan2,1, W. Gieren8,1, J. Borissova9,1
1Instituto Milenio de Astrofısica, Santiago, Chile.
2Instituto de Astrofısica, Facultad de Fısica, Pontificia Universidad Catolica de Chile, Av.
Vicuna Mackenna 4860, Santiago, Chile.
3Departamento de Fısica, Facultad de Ciencias Exactas, Universidad Andres Bello,
Republica 220, Santiago, Chile.
4Vatican Observatory, V00120 Vatican City State, Italy.
5Saint Mary’s University, Halifax, Nova Scotia, Canada.
6Mount Saint Vincent University, Halifax, Nova Scotia, Canada.
7Unidad de Astronomıa, Universidad de Antofagasta, Av. U. de Antofagasta 02800,
Antofagasta, Chile.
8Departamento de Astronomıa, Universidad de Concepcion, Casilla 160-C, Concepcion,
Chile
9Instituto de Fısica y Astronomıa, Universidad de Valparaıso, Av. Gran Bretana 1111,
Valparaso, Chile.
ABSTRACT
Solid insight into the physics of the inner Milky Way is key to understand-
ing our Galaxy’s evolution, but extreme dust obscuration has historically hin-
dered efforts to map the area along the Galactic mid-plane. New comprehensive
near-infrared time-series photometry from the VVV Survey has revealed 35 clas-
sical Cepheids, tracing a previously unobserved component of the inner Galaxy,
namely a ubiquitous inner thin disk of young stars along the Galactic mid-plane,
traversing across the bulge. The discovered period (age) spread of these classical
Cepheids implies a continuous supply of newly formed stars in the central region
of the Galaxy over the last 100 million years.
Subject headings: Galaxy:general, Galaxy:bulge, Galaxy:disk, Galaxy:stellar con-
tent, stars: variables: Cepheids
– 2 –
1. Introduction
The inner Milky Way is dominated by a peanut-shaped bulge (McWilliam & Zoccali
2010; Wegg & Gerhard 2013) that flares up from a prominent Galactic bar (Nakada et al.
1991), and its structural and kinematical properties are consistent with a formation scenario
driven by the instabilities of a multi-component stellar disk (Ness et al. 2013; Zoccali et al.
2014; Gardner et al. 2014; Ness et al. 2014; Di Matteo et al. 2015). The majority of its
constituent stars are very (& 8 billion years) old (Ortolani et al. 1995; Zoccali et al. 2003;
Brown et al. 2010), implying that its formation occurred at early epochs of the Milky Way’s
evolution. Although intermediate-age stars are also present in the bulge (van Loon et al. 2003;
Bensby et al. 2013), their origin, nature and ubiquity are poorly understood, owing partly
to sizable age uncertainties and possible biases from small sample sizes and contamination
by foreground disk stars. Yet it is well known that the innermost core (R . 300 pc) of the
Galaxy hosts stars with ages ranging from a few million to several billion years (e.g., Serabyn
& Morris 1996; van Loon et al. 2003; Matsunaga et al. 2011). This “nuclear bulge” has rather
distinct physical properties from the rest of the bulge and is related to the Central Molecular
Zone, but neither its transition to the surrounding bulge regions nor the triggering process
for star formation and its history are well understood (see, e.g., Launhardt et al. 2002).
Our global picture of the inner Galaxy is linked primarily to observations of the outer
bulge, i.e., at Galactic latitudes higher than ∼ 2◦. That deficit arises from extreme obscura-
tion by interstellar dust, high source density, and confusion with foreground disk populations.
The properties of the bulge region at low latitudes have thus remained largely unexplored,
leaving ambiguities concerning the interplay of the nuclear bulge and the various components
of the boxy bulge and surrounding outer stellar disk. The VISTA Variables in the Vıa Lactea
(VVV) ESO Public Survey (Minniti et al. 2010) presents a means to ameliorate the situation
by opening the time-domain in the near-infrared. That is particularly important as classes
of variable stars, such as classical Cepheids, are indicators of young stellar populations (e.g.,
Catelan & Smith 2015), and can yield critical insight as demonstrated here.
2. Discovery and Characterisation of the Cepheids
We performed a comprehensive near-infrared variability search using VVV Survey data
collected between 2010 and 2014, in a ∼ 66 square degree area in the central bulge (−10.5◦ .l . +10◦,−1.7◦ . b . +2◦, aligned with VVV image borders). We excluded two fields
lying toward the nuclear bulge owing to extreme source crowding. Time-series photometry
for ∼ 108 point sources were analyzed, with up to 70 Ks-band measurements per object,
together with color information from 1–5 independent measurements in the Z, Y , J , and
– 3 –
H bands. The data processing, calibration, and light-curve analysis were conducted in the
same way as in our previous study on the Twin Cepheids beyond the bulge (Dekany et al.
2015), and are based on standard VVV Survey data products (Minniti et al. 2010; Irwin et
al. 2004; Catelan et al. 2013). We detected a sample of approximately 3 · 105 objects which
displayed putative light variations, and scanned the results for Cepheids possessing pulsation
periods in the range of 4–50 days. The lower limit mitigates confusion between the pulsation
modes (e.g., Macri et al. 2015), while the upper limit was constrained by the sampling of
the photometric time-series. We found 655 fundamental-mode Cepheid candidates based
on their periods, amplitudes, and asymmetric light-curve shapes. A large fraction of these
objects were only detected in the H and Ks bands given the extreme reddening.
For computing the distances and extinctions of the Cepheids, we employed the period-
luminosity (PL) relations (a.k.a. Leavitt Law, Monson et al. 2012; Matsunaga et al. 2009)
adopted in our previous study (Dekany et al. 2015), adjusted to match the latest and most
accurate distance modulus for the Large Magellanic Cloud (LMC, Pietrzynski et al. 2013).
The color excess was converted to an extinction using a selective-to-absolute extinction
ratio found towards the Galactic Center (GC, Nishiyama et al. 2009), once converted into
the VISTA photometric system (see Dekany et al. 2015). For each object, a distance and
extinction were computed under both the assumptions that the target is a classical and a
type II Cepheid. We subsequently identified the correct solution and class upon further
analysis.
Following the approach adopted in our previous study (Dekany et al. 2015), uncertainties
tied to the distance and extinction were estimated by Monte Carlo simulations. The distances
exhibit 1-3% precision and 8-10% accuracy. The latter is dominated by the uncertainty in
the adopted extinction curve. The systematic uncertainty might be larger, possibly up
to ∼ 20%, if variations in the extinction’s wavelength dependence, either as a function of
Galactic longitude or along the sight-line, significantly exceed those found previously toward
the inner bulge (Nishiyama et al. 2009).
Type II Cepheids, i.e. old, low-mass, He-shell burning pulsating stars in the classical
instability strip (Catelan & Smith 2015), populate the same range of periods as classical
Cepheids. The two Cepheid classes share similar near-infrared light-curves (see, e.g. Catelan
& Smith 2015; Matsunaga et al. 2011; Dekany et al. 2015). Since the bulge contains a
sizable population of type II Cepheids with a centrally concentrated distribution (Soszynski
et al. 2011), our sample is expected to be dominated by these objects. Therefore, additional
observational information is required to identify classical Cepheids in our sample. The critical
information is conveyed by an extinction map of the bulge, based on the analysis of its red
clump stars (Gonzalez et al. 2012).
– 4 –
Classical and type II Cepheids have similar intrinsic colors but rather different lumi-
nosities (Monson et al. 2012; Matsunaga et al. 2009), and consequently their PL relations
yield similar extinctions but very different distances when applied to the same object. A
Cepheid’s type can be determined if its distance and extinction are inconsistent with the
cumulative extinction up to the bulge in its direction, computed under one of the two possi-
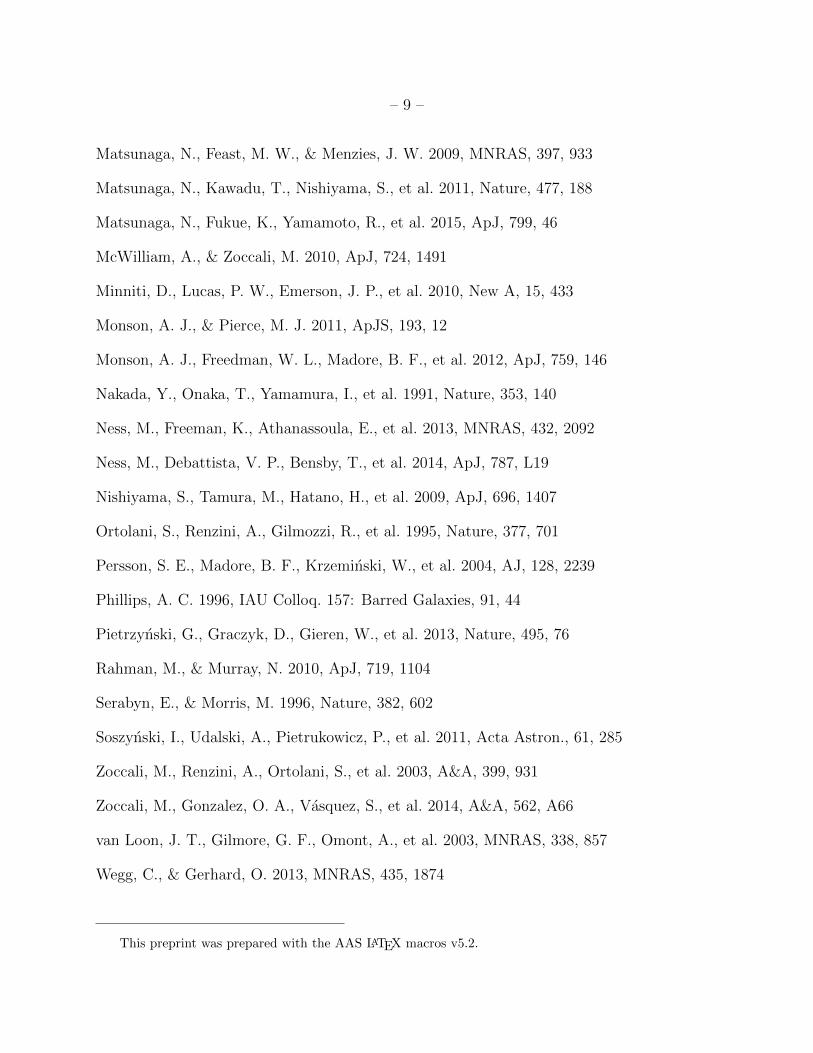
ble assumptions for its type (Matsunaga et al. 2011; Dekany et al. 2015). Figure. 1a-b show
the difference between the extinction values predicted by the PL relations and the bulge
extinction map, normalized by its uncertainty as a function of distance, when extinction and
distance are computed under the assumption that all detected Cepheids are either classical
or type II. There are several Cepheids in our sample for which the computed extinction was
within 3σ agreement with, or higher than the predicted cumulative extinction up to the
bulge towards their sight-lines, but for which the type II assumption yields short distances
(3− 4 kpc), making them bona fide classical Cepheid candidates. While most of them reside
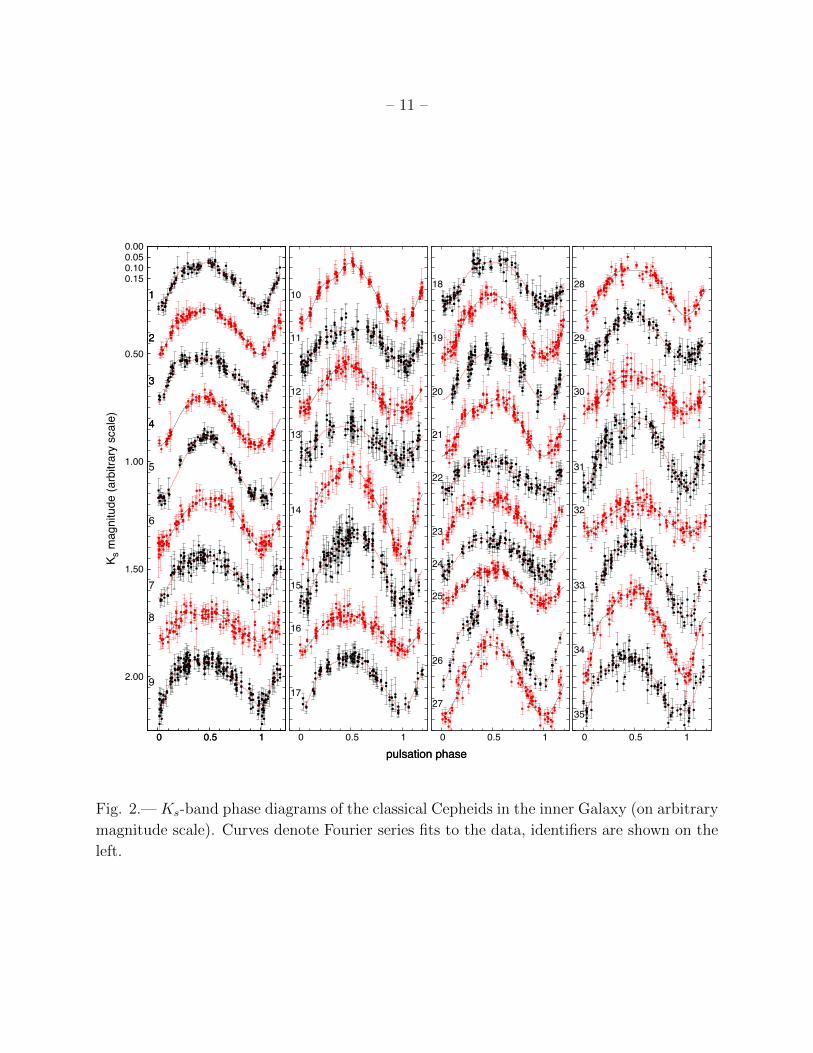
in the disk at the far side of the bulge as expected, we found 35 stars (green points in Fig. 1)
that are likewise located within the bulge volume (see, e.g., Wegg & Gerhard 2013).
These 35 stars could be type II Cepheids only if they were located by chance beyond thick
dust clouds of small angular sizes (< 1′), otherwise the 2′×2′ resolution of the VVV reddening
map would be sensitive to those. To investigate this unlikely possibility, we examined the
color images and analyzed the color-magnitude diagrams (CMD’s) of the stellar fields around
these Cepheids, in search of anomalously high gradients in the foreground extinction. In all
cases, the CMDs are inconsistent with the presence of such nearby foreground clouds, down
to angular sizes of ∼ 10′′, where the surface density of the disk population becomes too
low for drawing such conclusion. That limiting angular scale would correspond to physical
sizes of . 0.2 pc, smaller than a typical Bok globule (Das et al. 2015). The probability
for such chance alignment is negligible, and that it affects all 35 objects is virtually zero.
Consequently, we rule out the possibility that they are nearby type II Cepheids in the
Galactic disk, and classify them as classical Cepheids located inside the bulge volume. Their
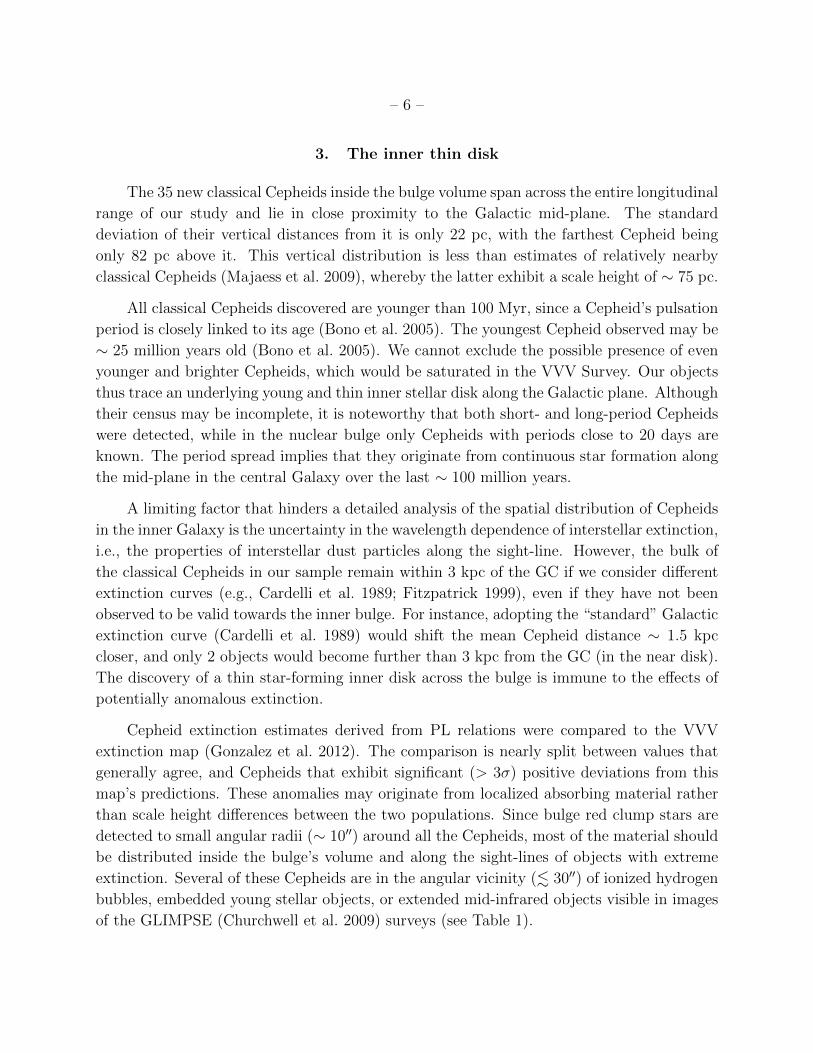
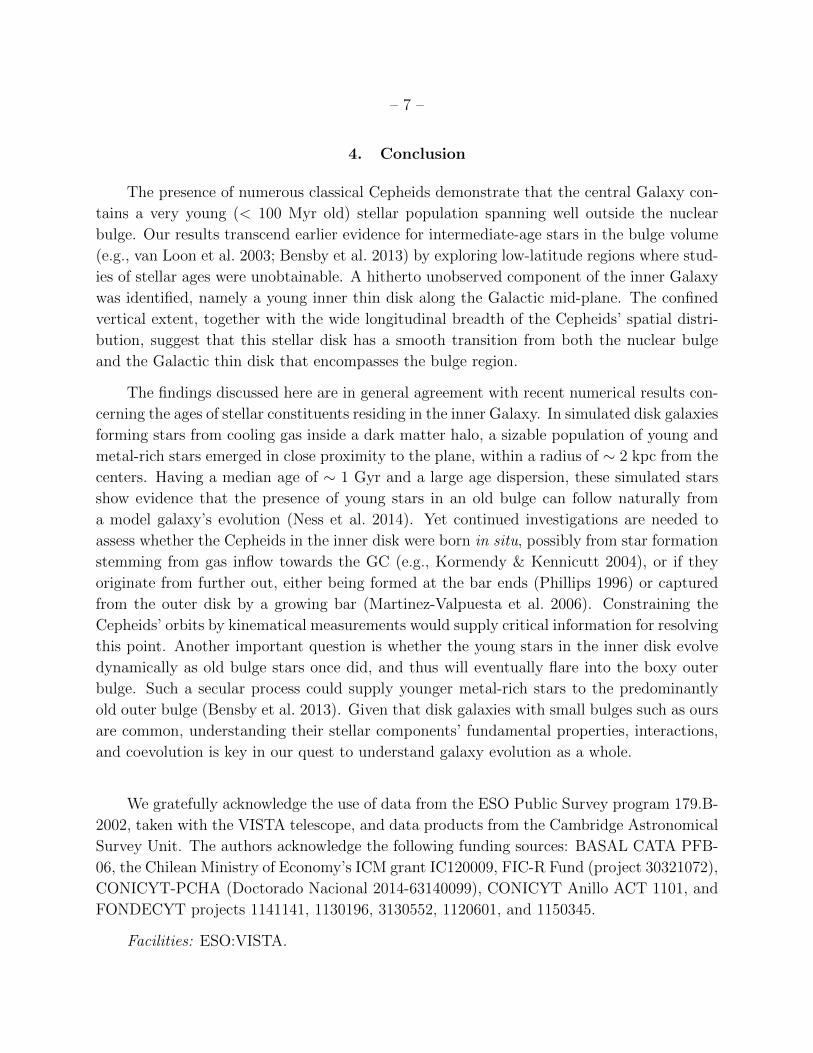
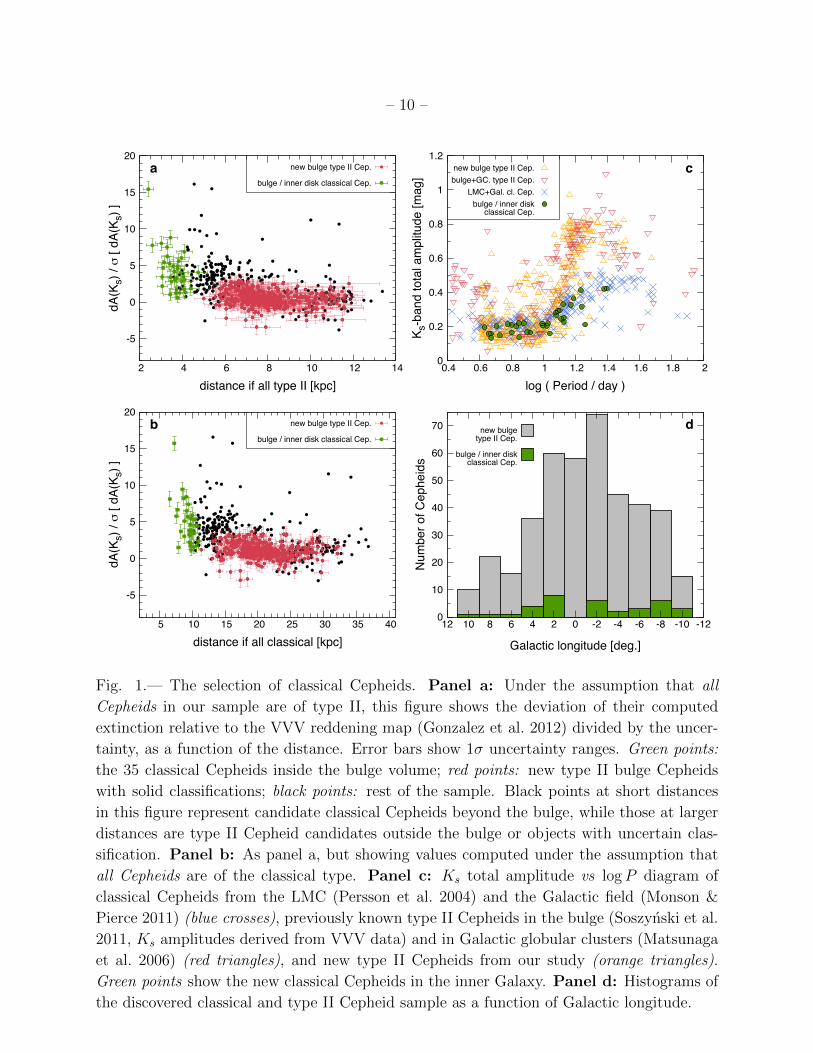
light-curves are presented in Fig. 2, while Fig. 3 conveys their spatial distribution. Their
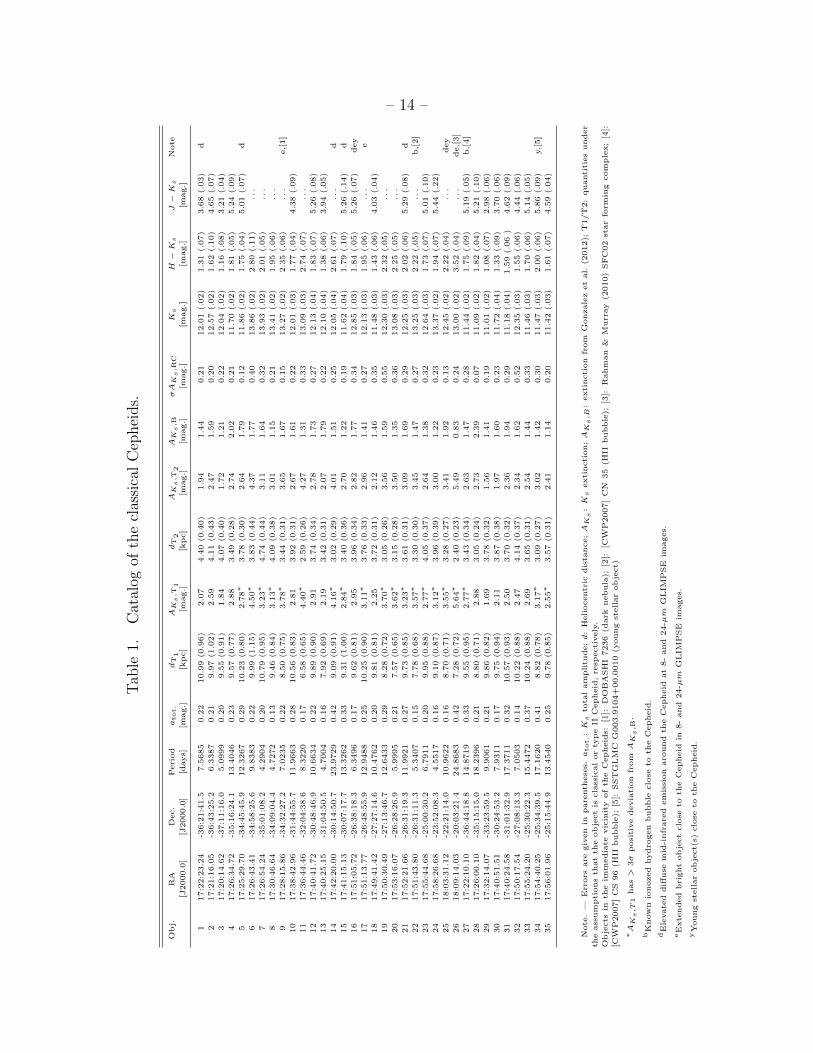
properties are summarized in Table 1.
By reversing the arguments above, 425 new type II Cepheids are identified in the central
bulge (Fig. 1a-b, red points), with extinctions consistent with predictions from the VVV
reddening map (Gonzalez et al. 2012). If these stars were classical Cepheids, they would be
located far beyond the bulge, and their corresponding extinctions would be inconsistent with
such large distances. The detailed study of these objects and the rest of the new classical
Cepheids beyond the bulge will be presented in forthcoming papers.
To bolster the classification of the classical and type II Cepheids in our sample, the
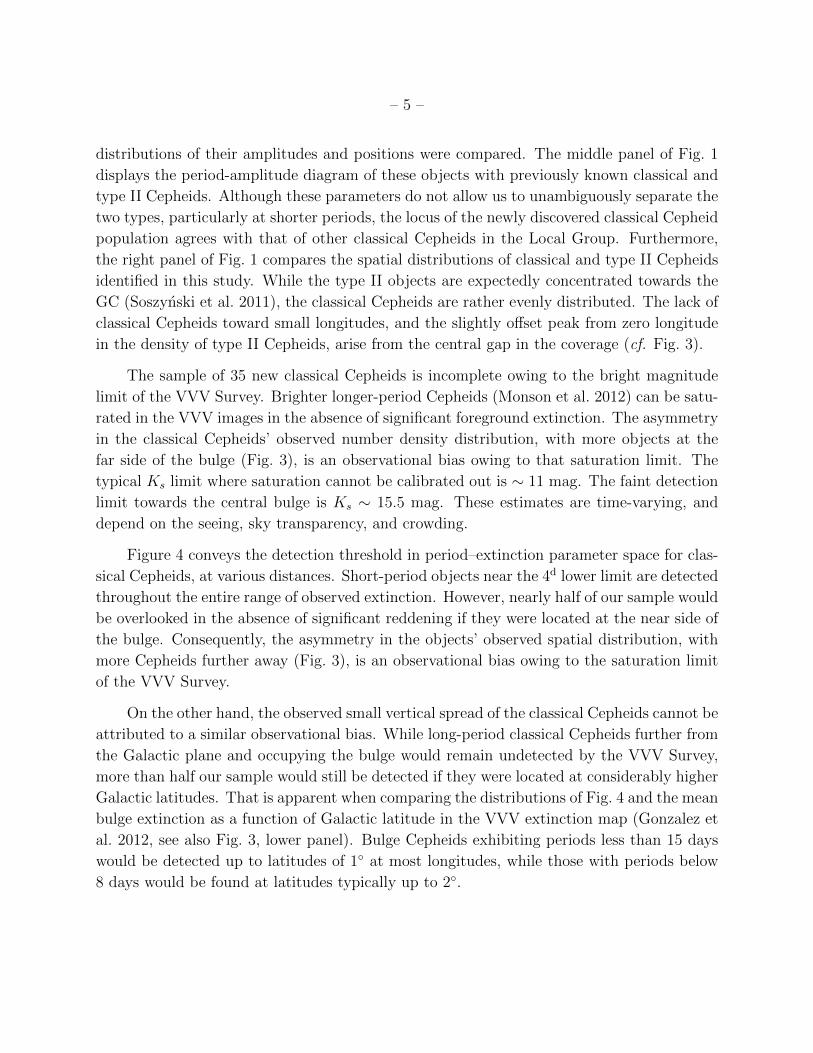
– 5 –
distributions of their amplitudes and positions were compared. The middle panel of Fig. 1
displays the period-amplitude diagram of these objects with previously known classical and
type II Cepheids. Although these parameters do not allow us to unambiguously separate the
two types, particularly at shorter periods, the locus of the newly discovered classical Cepheid
population agrees with that of other classical Cepheids in the Local Group. Furthermore,
the right panel of Fig. 1 compares the spatial distributions of classical and type II Cepheids
identified in this study. While the type II objects are expectedly concentrated towards the
GC (Soszynski et al. 2011), the classical Cepheids are rather evenly distributed. The lack of
classical Cepheids toward small longitudes, and the slightly offset peak from zero longitude
in the density of type II Cepheids, arise from the central gap in the coverage (cf. Fig. 3).
The sample of 35 new classical Cepheids is incomplete owing to the bright magnitude
limit of the VVV Survey. Brighter longer-period Cepheids (Monson et al. 2012) can be satu-
rated in the VVV images in the absence of significant foreground extinction. The asymmetry
in the classical Cepheids’ observed number density distribution, with more objects at the
far side of the bulge (Fig. 3), is an observational bias owing to that saturation limit. The
typical Ks limit where saturation cannot be calibrated out is ∼ 11 mag. The faint detection
limit towards the central bulge is Ks ∼ 15.5 mag. These estimates are time-varying, and
depend on the seeing, sky transparency, and crowding.
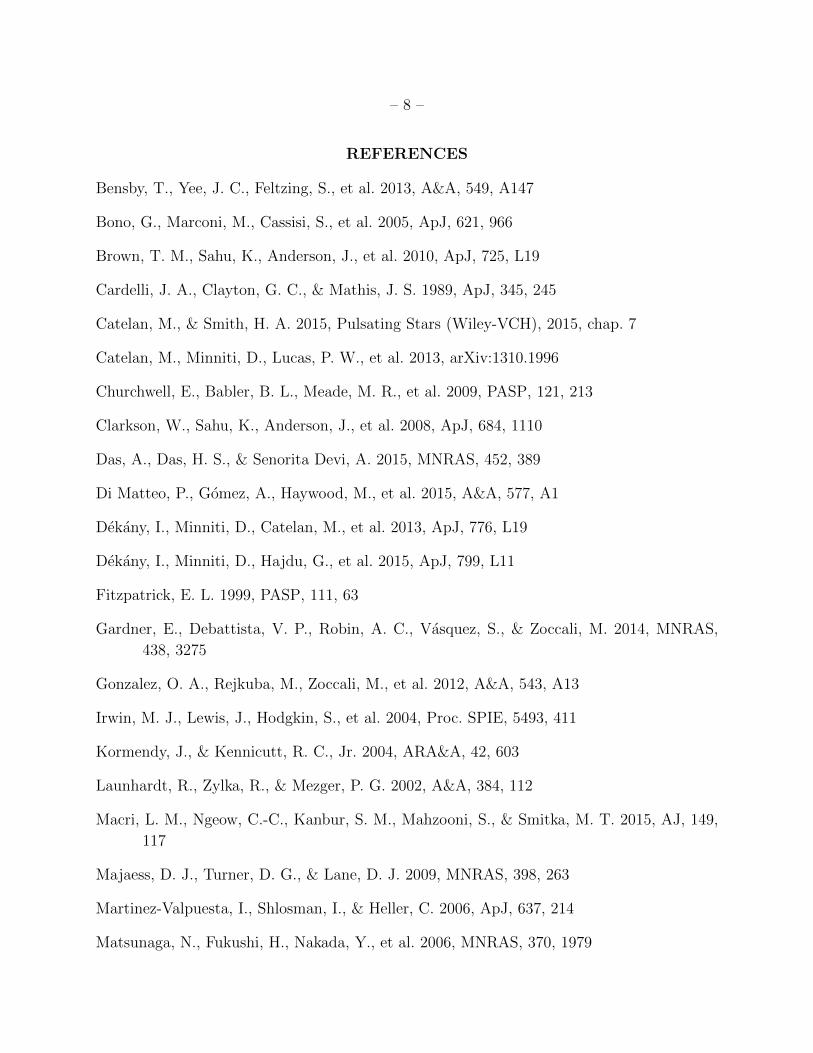
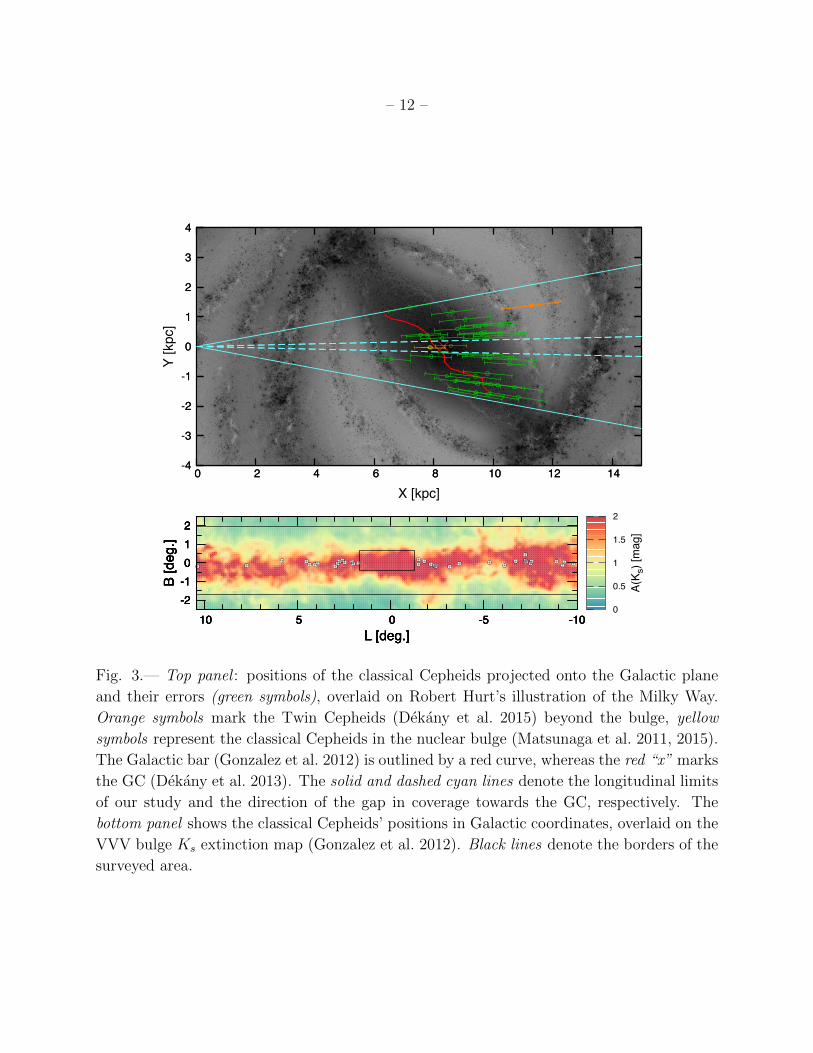
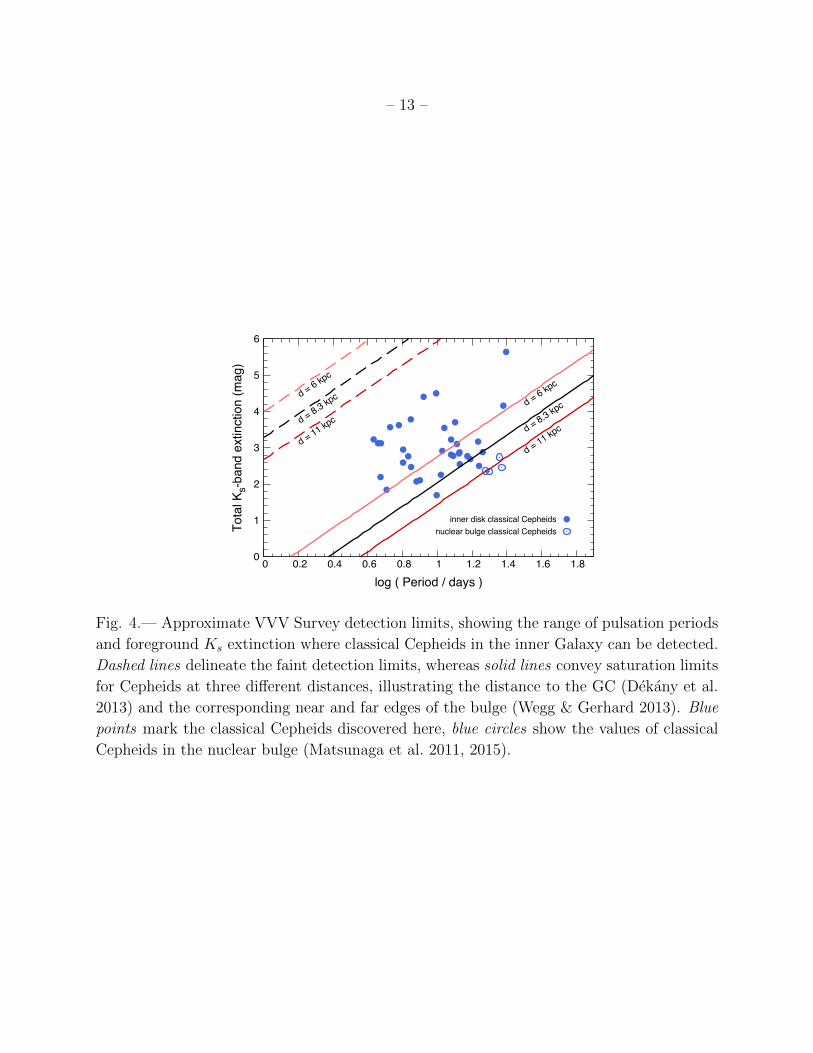
Figure 4 conveys the detection threshold in period–extinction parameter space for clas-
sical Cepheids, at various distances. Short-period objects near the 4d lower limit are detected
throughout the entire range of observed extinction. However, nearly half of our sample would
be overlooked in the absence of significant reddening if they were located at the near side of
the bulge. Consequently, the asymmetry in the objects’ observed spatial distribution, with
more Cepheids further away (Fig. 3), is an observational bias owing to the saturation limit
of the VVV Survey.
On the other hand, the observed small vertical spread of the classical Cepheids cannot be
attributed to a similar observational bias. While long-period classical Cepheids further from
the Galactic plane and occupying the bulge would remain undetected by the VVV Survey,
more than half our sample would still be detected if they were located at considerably higher
Galactic latitudes. That is apparent when comparing the distributions of Fig. 4 and the mean
bulge extinction as a function of Galactic latitude in the VVV extinction map (Gonzalez et
al. 2012, see also Fig. 3, lower panel). Bulge Cepheids exhibiting periods less than 15 days
would be detected up to latitudes of 1◦ at most longitudes, while those with periods below
8 days would be found at latitudes typically up to 2◦.
– 6 –
3. The inner thin disk
The 35 new classical Cepheids inside the bulge volume span across the entire longitudinal
range of our study and lie in close proximity to the Galactic mid-plane. The standard
deviation of their vertical distances from it is only 22 pc, with the farthest Cepheid being
only 82 pc above it. This vertical distribution is less than estimates of relatively nearby
classical Cepheids (Majaess et al. 2009), whereby the latter exhibit a scale height of ∼ 75 pc.
All classical Cepheids discovered are younger than 100 Myr, since a Cepheid’s pulsation
period is closely linked to its age (Bono et al. 2005). The youngest Cepheid observed may be
∼ 25 million years old (Bono et al. 2005). We cannot exclude the possible presence of even
younger and brighter Cepheids, which would be saturated in the VVV Survey. Our objects
thus trace an underlying young and thin inner stellar disk along the Galactic plane. Although
their census may be incomplete, it is noteworthy that both short- and long-period Cepheids
were detected, while in the nuclear bulge only Cepheids with periods close to 20 days are
known. The period spread implies that they originate from continuous star formation along
the mid-plane in the central Galaxy over the last ∼ 100 million years.
A limiting factor that hinders a detailed analysis of the spatial distribution of Cepheids
in the inner Galaxy is the uncertainty in the wavelength dependence of interstellar extinction,
i.e., the properties of interstellar dust particles along the sight-line. However, the bulk of
the classical Cepheids in our sample remain within 3 kpc of the GC if we consider different
extinction curves (e.g., Cardelli et al. 1989; Fitzpatrick 1999), even if they have not been
observed to be valid towards the inner bulge. For instance, adopting the “standard” Galactic
extinction curve (Cardelli et al. 1989) would shift the mean Cepheid distance ∼ 1.5 kpc
closer, and only 2 objects would become further than 3 kpc from the GC (in the near disk).
The discovery of a thin star-forming inner disk across the bulge is immune to the effects of
potentially anomalous extinction.
Cepheid extinction estimates derived from PL relations were compared to the VVV
extinction map (Gonzalez et al. 2012). The comparison is nearly split between values that
generally agree, and Cepheids that exhibit significant (> 3σ) positive deviations from this
map’s predictions. These anomalies may originate from localized absorbing material rather
than scale height differences between the two populations. Since bulge red clump stars are
detected to small angular radii (∼ 10′′) around all the Cepheids, most of the material should
be distributed inside the bulge’s volume and along the sight-lines of objects with extreme
extinction. Several of these Cepheids are in the angular vicinity (. 30′′) of ionized hydrogen
bubbles, embedded young stellar objects, or extended mid-infrared objects visible in images
of the GLIMPSE (Churchwell et al. 2009) surveys (see Table 1).
– 7 –
4. Conclusion
The presence of numerous classical Cepheids demonstrate that the central Galaxy con-
tains a very young (< 100 Myr old) stellar population spanning well outside the nuclear
bulge. Our results transcend earlier evidence for intermediate-age stars in the bulge volume
(e.g., van Loon et al. 2003; Bensby et al. 2013) by exploring low-latitude regions where stud-
ies of stellar ages were unobtainable. A hitherto unobserved component of the inner Galaxy
was identified, namely a young inner thin disk along the Galactic mid-plane. The confined
vertical extent, together with the wide longitudinal breadth of the Cepheids’ spatial distri-
bution, suggest that this stellar disk has a smooth transition from both the nuclear bulge
and the Galactic thin disk that encompasses the bulge region.
The findings discussed here are in general agreement with recent numerical results con-
cerning the ages of stellar constituents residing in the inner Galaxy. In simulated disk galaxies
forming stars from cooling gas inside a dark matter halo, a sizable population of young and
metal-rich stars emerged in close proximity to the plane, within a radius of ∼ 2 kpc from the
centers. Having a median age of ∼ 1 Gyr and a large age dispersion, these simulated stars
show evidence that the presence of young stars in an old bulge can follow naturally from
a model galaxy’s evolution (Ness et al. 2014). Yet continued investigations are needed to
assess whether the Cepheids in the inner disk were born in situ, possibly from star formation
stemming from gas inflow towards the GC (e.g., Kormendy & Kennicutt 2004), or if they
originate from further out, either being formed at the bar ends (Phillips 1996) or captured
from the outer disk by a growing bar (Martinez-Valpuesta et al. 2006). Constraining the
Cepheids’ orbits by kinematical measurements would supply critical information for resolving
this point. Another important question is whether the young stars in the inner disk evolve
dynamically as old bulge stars once did, and thus will eventually flare into the boxy outer
bulge. Such a secular process could supply younger metal-rich stars to the predominantly
old outer bulge (Bensby et al. 2013). Given that disk galaxies with small bulges such as ours
are common, understanding their stellar components’ fundamental properties, interactions,
and coevolution is key in our quest to understand galaxy evolution as a whole.
We gratefully acknowledge the use of data from the ESO Public Survey program 179.B-
2002, taken with the VISTA telescope, and data products from the Cambridge Astronomical
Survey Unit. The authors acknowledge the following funding sources: BASAL CATA PFB-
06, the Chilean Ministry of Economy’s ICM grant IC120009, FIC-R Fund (project 30321072),
CONICYT-PCHA (Doctorado Nacional 2014-63140099), CONICYT Anillo ACT 1101, and
FONDECYT projects 1141141, 1130196, 3130552, 1120601, and 1150345.
Facilities: ESO:VISTA.
– 8 –
REFERENCES
Bensby, T., Yee, J. C., Feltzing, S., et al. 2013, A&A, 549, A147
Bono, G., Marconi, M., Cassisi, S., et al. 2005, ApJ, 621, 966
Brown, T. M., Sahu, K., Anderson, J., et al. 2010, ApJ, 725, L19
Cardelli, J. A., Clayton, G. C., & Mathis, J. S. 1989, ApJ, 345, 245
Catelan, M., & Smith, H. A. 2015, Pulsating Stars (Wiley-VCH), 2015, chap. 7
Catelan, M., Minniti, D., Lucas, P. W., et al. 2013, arXiv:1310.1996
Churchwell, E., Babler, B. L., Meade, M. R., et al. 2009, PASP, 121, 213
Clarkson, W., Sahu, K., Anderson, J., et al. 2008, ApJ, 684, 1110
Das, A., Das, H. S., & Senorita Devi, A. 2015, MNRAS, 452, 389
Di Matteo, P., Gomez, A., Haywood, M., et al. 2015, A&A, 577, A1
Dekany, I., Minniti, D., Catelan, M., et al. 2013, ApJ, 776, L19
Dekany, I., Minniti, D., Hajdu, G., et al. 2015, ApJ, 799, L11
Fitzpatrick, E. L. 1999, PASP, 111, 63
Gardner, E., Debattista, V. P., Robin, A. C., Vasquez, S., & Zoccali, M. 2014, MNRAS,
438, 3275
Gonzalez, O. A., Rejkuba, M., Zoccali, M., et al. 2012, A&A, 543, A13
Irwin, M. J., Lewis, J., Hodgkin, S., et al. 2004, Proc. SPIE, 5493, 411
Kormendy, J., & Kennicutt, R. C., Jr. 2004, ARA&A, 42, 603
Launhardt, R., Zylka, R., & Mezger, P. G. 2002, A&A, 384, 112
Macri, L. M., Ngeow, C.-C., Kanbur, S. M., Mahzooni, S., & Smitka, M. T. 2015, AJ, 149,
117
Majaess, D. J., Turner, D. G., & Lane, D. J. 2009, MNRAS, 398, 263
Martinez-Valpuesta, I., Shlosman, I., & Heller, C. 2006, ApJ, 637, 214
Matsunaga, N., Fukushi, H., Nakada, Y., et al. 2006, MNRAS, 370, 1979
– 9 –
Matsunaga, N., Feast, M. W., & Menzies, J. W. 2009, MNRAS, 397, 933
Matsunaga, N., Kawadu, T., Nishiyama, S., et al. 2011, Nature, 477, 188
Matsunaga, N., Fukue, K., Yamamoto, R., et al. 2015, ApJ, 799, 46
McWilliam, A., & Zoccali, M. 2010, ApJ, 724, 1491
Minniti, D., Lucas, P. W., Emerson, J. P., et al. 2010, New A, 15, 433
Monson, A. J., & Pierce, M. J. 2011, ApJS, 193, 12
Monson, A. J., Freedman, W. L., Madore, B. F., et al. 2012, ApJ, 759, 146
Nakada, Y., Onaka, T., Yamamura, I., et al. 1991, Nature, 353, 140
Ness, M., Freeman, K., Athanassoula, E., et al. 2013, MNRAS, 432, 2092
Ness, M., Debattista, V. P., Bensby, T., et al. 2014, ApJ, 787, L19
Nishiyama, S., Tamura, M., Hatano, H., et al. 2009, ApJ, 696, 1407
Ortolani, S., Renzini, A., Gilmozzi, R., et al. 1995, Nature, 377, 701
Persson, S. E., Madore, B. F., Krzeminski, W., et al. 2004, AJ, 128, 2239
Phillips, A. C. 1996, IAU Colloq. 157: Barred Galaxies, 91, 44
Pietrzynski, G., Graczyk, D., Gieren, W., et al. 2013, Nature, 495, 76
Rahman, M., & Murray, N. 2010, ApJ, 719, 1104
Serabyn, E., & Morris, M. 1996, Nature, 382, 602
Soszynski, I., Udalski, A., Pietrukowicz, P., et al. 2011, Acta Astron., 61, 285
Zoccali, M., Renzini, A., Ortolani, S., et al. 2003, A&A, 399, 931
Zoccali, M., Gonzalez, O. A., Vasquez, S., et al. 2014, A&A, 562, A66
van Loon, J. T., Gilmore, G. F., Omont, A., et al. 2003, MNRAS, 338, 857
Wegg, C., & Gerhard, O. 2013, MNRAS, 435, 1874
This preprint was prepared with the AAS LATEX macros v5.2.
– 10 –
-5
0
5
10
15
20
2 4 6 8 10 12 14
dA(K
s) / m
[ dA
(Ks)
]
distance if all type II [kpc]
a new bulge type II Cep.
bulge / inner disk classical Cep.
-5
0
5
10
15
20
5 10 15 20 25 30 35 40
dA(K
s) / m
[ dA
(Ks)
]
distance if all classical [kpc]
b new bulge type II Cep.
bulge / inner disk classical Cep.
0
0.2
0.4
0.6
0.8
1
1.2
0.4 0.6 0.8 1 1.2 1.4 1.6 1.8 2
K s-b
and
tota
l am
plitu
de [m
ag]
log ( Period / day )
cnew bulge type II Cep.bulge+GC. type II Cep.
LMC+Gal. cl. Cep.bulge / inner disk
classical Cep.
Num
ber o
f Cep
heid
s
Galactic longitude [deg.]
dnew bulge type II Cep.
bulge / inner disk classical Cep.
0
10
20
30
40
50
60
70
-12-10-8-6-4-2024681012
Fig. 1.— The selection of classical Cepheids. Panel a: Under the assumption that all
Cepheids in our sample are of type II, this figure shows the deviation of their computed
extinction relative to the VVV reddening map (Gonzalez et al. 2012) divided by the uncer-
tainty, as a function of the distance. Error bars show 1σ uncertainty ranges. Green points:
the 35 classical Cepheids inside the bulge volume; red points: new type II bulge Cepheids
with solid classifications; black points: rest of the sample. Black points at short distances
in this figure represent candidate classical Cepheids beyond the bulge, while those at larger
distances are type II Cepheid candidates outside the bulge or objects with uncertain clas-
sification. Panel b: As panel a, but showing values computed under the assumption that
all Cepheids are of the classical type. Panel c: Ks total amplitude vs logP diagram of
classical Cepheids from the LMC (Persson et al. 2004) and the Galactic field (Monson &
Pierce 2011) (blue crosses), previously known type II Cepheids in the bulge (Soszynski et al.
2011, Ks amplitudes derived from VVV data) and in Galactic globular clusters (Matsunaga
et al. 2006) (red triangles), and new type II Cepheids from our study (orange triangles).
Green points show the new classical Cepheids in the inner Galaxy. Panel d: Histograms of
the discovered classical and type II Cepheid sample as a function of Galactic longitude.
– 11 –
0.000.050.100.15
0.50
1.00
1.50
2.00
0 0.5 1
K s m
agni
tude
(arb
itrar
y sc
ale)
pulsation phase
1
2
3
4
0 0.5 1
pulsation phase
1
2
3
4
5
6
7
8
9
0 0.5 1
10
11
12
13
14
15
16
17
0 0.5 1
18
19
20
21
22
23
24
25
26
27
0 0.5 1
28
29
30
31
32
33
34
35
Fig. 2.— Ks-band phase diagrams of the classical Cepheids in the inner Galaxy (on arbitrary
magnitude scale). Curves denote Fourier series fits to the data, identifiers are shown on the
left.
– 12 –
Y [k
pc]
X [kpc]
-4
-3
-2
-1
0
1
2
3
4
0 2 4 6 8 10 12 14 4
3
2
1
0
1
2
3
4
0 2 4 6 8 10 12 14
-10-5 0 5 10L [deg.]
-2-1 0 1 2
B [d
eg.]
0
0.5
1
1.5
2
A(K s
) [m
ag]
-10-5 0 5 10L [deg.]
-2-1 0 1 2
B [d
eg.]
-10-5 0 5 10L [deg.]
-2-1 0 1 2
B [d
eg.]
-10-5 0 5 10L [deg.]
-2-1 0 1 2
B [d
eg.]
Fig. 3.— Top panel : positions of the classical Cepheids projected onto the Galactic plane
and their errors (green symbols), overlaid on Robert Hurt’s illustration of the Milky Way.
Orange symbols mark the Twin Cepheids (Dekany et al. 2015) beyond the bulge, yellow
symbols represent the classical Cepheids in the nuclear bulge (Matsunaga et al. 2011, 2015).
The Galactic bar (Gonzalez et al. 2012) is outlined by a red curve, whereas the red “x” marks
the GC (Dekany et al. 2013). The solid and dashed cyan lines denote the longitudinal limits
of our study and the direction of the gap in coverage towards the GC, respectively. The
bottom panel shows the classical Cepheids’ positions in Galactic coordinates, overlaid on the
VVV bulge Ks extinction map (Gonzalez et al. 2012). Black lines denote the borders of the
surveyed area.
– 13 –
0
1
2
3
4
5
6
0 0.2 0.4 0.6 0.8 1 1.2 1.4 1.6 1.8
Tota
l Ks-
band
ext
inct
ion
(mag
)
log ( Period / days )
d = 11 kpcd = 8.3 kpcd = 6 kp
c
d = 11 kpcd = 8.3 kpcd = 6 kp
c
inner disk classical Cepheidsnuclear bulge classical Cepheids
Fig. 4.— Approximate VVV Survey detection limits, showing the range of pulsation periods
and foreground Ks extinction where classical Cepheids in the inner Galaxy can be detected.
Dashed lines delineate the faint detection limits, whereas solid lines convey saturation limits
for Cepheids at three different distances, illustrating the distance to the GC (Dekany et al.
2013) and the corresponding near and far edges of the bulge (Wegg & Gerhard 2013). Blue
points mark the classical Cepheids discovered here, blue circles show the values of classical
Cepheids in the nuclear bulge (Matsunaga et al. 2011, 2015).
– 14 –
Tab
le1.
Cat
alog
ofth
ecl
assi
cal
Cep
hei
ds.
Ob
j.R
AD
ec.
Peri
od
atot.
dT1
AK
s,T
1dT2
AK
s,T
2A
Ks,B
σA
Ks,R
CK
sH
−K
sJ
−K
sN
ote
[J2000.0
][J
2000.0
][d
ays]
[mag.]
[kp
c]
[mag.]
[kp
c]
[mag.]
[mag.]
[mag.]
[mag.]
[mag.]
[mag.]
117:2
2:2
3.2
4-3
6:2
1:4
1.5
7.5
685
0.2
210.9
9(0
.96)
2.0
74.4
0(0
.40)
1.9
41.4
40.2
112.0
1(.
02)
1.3
1(.
07)
3.6
8(.
03)
d
217:2
1:1
6.0
5-3
6:4
3:2
5.2
6.3
387
0.2
19.9
7(1
.02)
2.5
94.1
1(0
.43)
2.4
71.5
90.2
012.5
7(.
02)
1.6
2(.
10)
4.6
5(.
07)
317:2
0:1
4.6
2-3
7:1
1:1
6.0
5.0
999
0.2
09.5
5(0
.91)
1.8
44.0
7(0
.40)
1.7
21.2
10.2
212.0
4(.
02)
1.1
6(.
08)
3.2
1(.
04)
417:2
6:3
4.7
2-3
5:1
6:2
4.1
13.4
046
0.2
39.5
7(0
.77)
2.8
83.4
9(0
.28)
2.7
42.0
20.2
111.7
0(.
02)
1.8
1(.
05)
5.2
4(.
09)
517:2
5:2
9.7
0-3
4:4
5:4
5.9
12.3
267
0.2
910.2
3(0
.80)
2.7
8∗
3.7
8(0
.30)
2.6
41.7
90.1
211.8
6(.
02)
1.7
5(.
04)
5.0
1(.
07)
d
617:2
6:4
3.4
1-3
4:5
8:2
5.6
9.8
383
0.2
29.9
9(1
.15)
4.5
0∗
3.8
3(0
.44)
4.3
71.7
70.4
013.8
6(.
02)
2.8
0(.
11)
...
717:2
6:5
4.2
4-3
5:0
1:0
8.2
4.2
904
0.2
010.7
9(0
.95)
3.2
3∗
4.7
4(0
.44)
3.1
11.6
40.3
213.9
3(.
02)
2.0
1(.
05)
...
817:3
0:4
6.6
4-3
4:0
9:0
4.4
4.7
272
0.1
39.4
6(0
.84)
3.1
3∗
4.0
9(0
.38)
3.0
11.1
50.2
113.4
1(.
02)
1.9
5(.
06)
...
917:2
8:1
5.8
6-3
4:3
2:2
7.2
7.0
235
0.2
28.5
0(0
.75)
3.7
8∗
3.4
4(0
.31)
3.6
51.6
70.1
513.2
7(.
02)
2.3
5(.
06)
...
e,[1]
10
17:3
8:4
2.9
6-3
1:4
4:5
5.7
11.9
663
0.2
810.5
6(0
.83)
2.8
13.9
2(0
.31)
2.6
71.6
10.2
212.0
1(.
03)
1.7
7(.
04)
4.3
8(.
09)
11
17:3
6:4
4.4
6-3
2:0
4:3
8.6
8.3
220
0.1
76.5
8(0
.65)
4.4
0∗
2.5
9(0
.26)
4.2
71.3
10.3
313.0
9(.
03)
2.7
4(.
07)
...
12
17:4
0:4
1.7
2-3
0:4
8:4
6.9
10.6
634
0.2
29.8
9(0
.90)
2.9
13.7
4(0
.34)
2.7
81.7
30.2
712.1
3(.
04)
1.8
3(.
07)
5.2
6(.
08)
13
17:4
0:2
5.1
5-3
1:0
4:5
0.5
4.7
004
0.1
67.9
2(0
.69)
2.1
93.4
2(0
.31)
2.0
71.7
90.2
212.1
0(.
04)
1.3
8(.
06)
3.9
4(.
05)
14
17:4
2:2
0.0
0-3
0:1
4:5
0.7
23.9
729
0.4
29.0
9(0
.91)
4.1
6∗
3.0
2(0
.29)
4.0
11.5
10.2
512.0
5(.
04)
2.6
1(.
07)
...
d
15
17:4
1:1
5.1
3-3
0:0
7:1
7.7
13.3
262
0.3
39.3
1(1
.00)
2.8
4∗
3.4
0(0
.36)
2.7
01.2
20.1
911.6
2(.
04)
1.7
9(.
10)
5.2
6(.
14)
d
16
17:5
1:0
5.7
2-2
6:3
8:1
8.3
6.3
496
0.1
79.6
2(0
.81)
2.9
53.9
6(0
.34)
2.8
21.7
70.3
412.8
5(.
03)
1.8
4(.
05)
5.2
6(.
07)
dey
17
17:5
1:1
3.7
7-2
6:4
8:5
5.9
12.9
488
0.2
510.2
5(0
.90)
3.1
1∗
3.7
6(0
.33)
2.9
61.4
10.2
712.1
3(.
03)
1.9
5(.
06)
...
e
18
17:4
9:4
1.4
2-2
7:2
7:1
4.6
10.4
762
0.2
09.8
1(0
.81)
2.2
53.7
2(0
.31)
2.1
21.4
60.3
511.4
8(.
03)
1.4
3(.
06)
4.0
3(.
04)
19
17:5
0:3
0.4
9-2
7:1
3:4
6.7
12.6
433
0.2
98.2
8(0
.72)
3.7
0∗
3.0
5(0
.26)
3.5
61.5
90.5
512.3
0(.
03)
2.3
2(.
05)
...
20
17:5
3:1
6.0
7-2
6:2
8:2
6.9
5.9
995
0.2
17.5
7(0
.65)
3.6
2∗
3.1
5(0
.28)
3.5
01.3
50.3
613.0
8(.
03)
2.2
5(.
05)
...
21
17:5
2:2
1.6
6-2
6:3
1:1
9.3
11.9
921
0.2
79.7
3(0
.85)
3.2
3∗
3.6
1(0
.31)
3.0
91.6
90.2
912.2
5(.
03)
2.0
2(.
06)
5.2
9(.
08)
d
22
17:5
1:4
3.8
0-2
6:3
1:1
1.3
5.3
407
0.1
57.7
8(0
.68)
3.5
7∗
3.3
0(0
.30)
3.4
51.4
70.2
713.2
5(.
03)
2.2
2(.
05)
...
b,[2]
23
17:5
5:4
4.6
8-2
5:0
0:3
0.2
6.7
911
0.2
09.9
5(0
.88)
2.7
7∗
4.0
5(0
.37)
2.6
41.3
80.3
212.6
4(.
03)
1.7
3(.
07)
5.0
1(.
10)
24
17:5
8:2
6.6
8-2
3:5
2:0
8.3
4.5
517
0.1
69.1
0(0
.87)
3.1
2∗
3.9
6(0
.39)
3.0
01.2
20.2
313.3
7(.
02)
1.9
4(.
07)
5.4
4(.
22)
25
18:0
3:3
1.1
2-2
2:2
1:1
4.0
10.9
622
0.1
68.7
0(0
.71)
3.5
5∗
3.2
8(0
.27)
3.4
11.9
20.1
312.4
5(.
02)
2.2
2(.
04)
...
dey
26
18:0
9:1
4.0
3-2
0:0
3:2
1.4
24.8
683
0.4
27.2
8(0
.72)
5.6
4∗
2.4
0(0
.23)
5.4
90.8
30.2
413.0
0(.
02)
3.5
2(.
04)
...
de,[3]
27
17:2
2:1
0.1
0-3
6:4
4:1
8.8
14.8
719
0.3
39.5
5(0
.95)
2.7
7∗
3.4
3(0
.34)
2.6
31.4
70.2
811.4
4(.
02)
1.7
5(.
09)
5.1
9(.
05)
b,[4]
28
17:2
6:0
0.1
0-3
5:1
5:1
5.0
18.2
396
0.2
18.8
0(0
.71)
2.8
83.0
5(0
.24)
2.7
32.3
90.0
711.0
9(.
02)
1.8
2(.
04)
5.2
1(.
10)
29
17:3
2:1
4.0
7-3
3:2
3:5
9.5
9.9
061
0.2
19.8
6(0
.82)
1.6
93.7
8(0
.32)
1.5
61.4
10.1
911.0
1(.
02)
1.0
8(.
07)
2.9
8(.
06)
30
17:4
0:5
1.5
1-3
0:2
4:5
3.2
7.9
311
0.1
79.7
5(0
.94)
2.1
13.8
7(0
.38)
1.9
71.6
00.2
311.7
2(.
04)
1.3
3(.
09)
3.7
0(.
06)
31
17:4
0:2
4.5
8-3
1:0
1:3
2.9
17.3
711
0.3
210.5
7(0
.93)
2.5
03.7
0(0
.32)
2.3
61.9
40.2
911.1
8(.
04)
1.5
9(.
06
)4.6
2(.
09)
32
17:5
0:1
7.5
4-2
7:0
8:1
3.3
7.0
503
0.1
410.2
2(0
.88)
2.4
74.1
4(0
.37)
2.3
41.6
20.5
212.3
5(.
03)
1.5
5(.
06)
4.4
4(.
06)
33
17:5
5:2
4.2
0-2
5:3
0:2
2.3
15.4
472
0.3
710.2
4(0
.88)
2.6
93.6
5(0
.31)
2.5
41.4
40.3
311.4
6(.
03)
1.7
0(.
06)
5.1
4(.
05)
34
17:5
4:4
0.2
5-2
5:3
4:3
9.5
17.1
620
0.4
18.8
2(0
.78)
3.1
7∗
3.0
9(0
.27)
3.0
21.4
20.3
011.4
7(.
03)
2.0
0(.
06)
5.8
6(.
09)
y,[5]
35
17:5
6:0
1.9
6-2
5:1
5:4
4.9
13.4
540
0.2
59.7
8(0
.85)
2.5
5∗
3.5
7(0
.31)
2.4
11.1
40.2
011.4
2(.
03)
1.6
1(.
07)
4.5
9(.
04)
Note
.—
Err
ors
are
giv
en
inpare
nth
ese
s.atot.:K
sto
tal
am
plitu
de;d:
Heliocentr
icdis
tance;A
Ks
:K
sexti
ncti
on;A
Ks,B
:exti
ncti
on
from
Gonzale
zet
al.
(2012);
T1/T
2:
quanti
ties
under
the
ass
um
pti
ons
that
the
ob
ject
iscla
ssic
al
or
typ
eII
Cepheid
,re
specti
vely
.
Ob
jects
inth
eim
media
tevic
init
yof
the
Cepheid
s:[1
]:D
OB
ASH
I7236
(dark
nebula
);[2
]:[C
WP
2007]
CN
35
(HII
bubble
);[3
]:R
ahm
an
&M
urr
ay
(2010)
SF
C02
star
form
ing
com
ple
x;
[4]:
[CW
P2007]
CS
96
(HII
bubble
);[5
]:SST
GL
MC
G003.9
104+
00.0
010
(young
stellar
ob
ject)
∗A
Ks,T
1has>
3σ
posi
tive
devia
tion
fromA
Ks,B
.
bK
now
nio
nozed
hydro
gen
bubble
clo
seto
the
Cepheid
.
dE
levate
ddiff
use
mid
-infr
are
dem
issi
on
aro
und
the
Cepheid
at
8-
and
24-µm
GL
IMP
SE
images.
eE
xte
nded
bri
ght
ob
ject
clo
seto
the
Cepheid
in8-
and
24-µm
GL
IMP
SE
images.
yY
oung
stell
ar
ob
ject(
s)clo
seto
the
Cepheid
.