Embed Size (px)
Citation preview
−90
−80
−70
−60
−50
−1000100200long
lat
Socio-ecological valuation of ecosystem services along the West Antarctic Peninsula
Je� S. Bowman1, Barbara Neumann2, Anton Mikoleit3, Hugh W. Ducklow1
1Lamont-Doherty Earth Observatory, Columbia University, New York, USA2Department of Geography, Kiel University and Cluster of Excellence “The Future Ocean”
3School of Sustainability, Kiel University, Kiel, Germany
[email protected], [email protected]
Introduction The West Antarctic Peninsula (WAP) is one of the most rapidly warming regions on the planet. In addition to this distinction the WAP hosts a rich marine ecosystem and, like most of the Antarctic, has a minimal human presence. Despite this the marine, coastal, and terrestrial ecosystems of the WAP provide a diverse range of ecosystem functions that support services with regional and global importance, facilitating a variety of socio-economic activities. This combination of factors makes the WAP an ideal laboratory for testing the ecosystem services concept and exploring the contributions of the WAP to human well-being and assess-ing the potential impact of climate change. The Palmer Long Term Ecological Research project (PAL-LTER) has documented ecological change in the region since 1993. Here we use the ‘matrix’ method (Burkhard et al. 2009, 2014; Jacobs et al. 2015), an expert-based qualitative evaluation approach, to capatalize on the interdisciplinary expertise of the PAL-LTER team of experts and conduct an initial socio-ecological valuation of the actual and potential �ow of ecosystem services along the WAP during summer months. The matrix method combines formal expert interviews with a spatially explicit analysis of biophysical landscape units (Fig. 3) to quantify the �ow of services from these units. We extend this approach by objectively de�ning seascape units (biomes, Fig. 2) from key biogeo-chemical parameters collected during 21 PAL-LTER research cruises between 1993 and 2014.
Fig. 1. Trophic structure and ecosystem service provisioning along the WAP. A) Oceanographic conditions along the WAP lead to intense phytoplankton blooms and a high rate of primary production. B) Phytoplank-ton blooms support a large population of krill, here being sampled by researchers with the PAL-LTER project. Although the Southern Ocean krill �shery is small, there is signi�cant potential for exploitation. C) Krill pro-vide a critical trophic link with large marine predators, including humpback (shown) and minke whales, vari-ous species of penguin, and seals. D) Charismatic marine megafauna are a major draw for tourists, who pri-marily visit the region on cruise ships (background).
A B
C D
Objectively de�ned ecosystem service providing units (biomes)
ESOM
Chlorophyll
●●●●●●●●●●●●●●●●●●●●●●●●●●●●●●●●●●●●●●●●●●●●●●●●●●●●●●●●●●●●●●●●●●●●●●●●●●●●●●●●●●●●●●●●●●●●●●●●●●●●●●●●●●●●●●●●●●●●●●●●●●●●●●●●●●●●●●●●●●●●●●●●●●●●●●●●●●●●●●●●●●●●●●●●●●●●●●●●●●●●●●●●●●●●●●●●●●●●●●●●●●●●●●●●●●●●●●●●●●●●●●●●●●●●●●●●●●●●●●●●●●●●●●●●●●●●●●●●●●●●●●●●●●●●●●●●●●●●●●●●●●●●●●●●●●●●●●●●●●●●●●●●●●●●●●●●●●●●●●●●●●●●●●●●●●●●●●●●●●●●●●●●●●●●●●●●●●●●●●●●●●●●●●●●●●●●●●●●●●●●●●●●●●●●●●●●●●●●●●●●●●●●●●●●●●●●●●●●●●●●●●●●●●●●●●●●●●●●●●●●●●●●●●●●●●●●●●●●●●●●●●●●●●●●●●●●●●●●●●●●●●●●●●●●●●●●●●●●●●●●●●●●●●●●●●●●●●●●●●●●●●●●●●●●●●●●●●●●●●●●●●●●●●●●●●●●●●●●●●●●●●●●●●●●●●●●●●●●●●●●●●●●●●●●●●●●●●●●●●●●●●●●●●●●●●●●●●●●●●●●●●●●●●●●●●●●●●●●●●●●●●●●●●●●●●●●●●●●●●●●●●●●●●●●●●●●●●●●●●●●●●●●●●●●●●●●●●●●●●●●●●●●●●●●●●●●●●●●●●●●●●●●●●●●●●●●●●●●●●●●●●●●●●●●●●●●●●●●●●●●●●●●●●●●●●●●●●●●●●●●●●●●●●●●●●●●●●●●●●●●●●●●●●●●●●●●●●●●●●●●●●●●●●●●●●●●●●●●●●●●●●●●●●●●●●●●●●●●●●●●●●●●●●●●●●●●●●●●●●●●●●●●●●●●●●●●●●●●●●●●
10
20
30
40
Nitrate + Nitrite
●●●●●●●●●●●●●●●●●●●●●●●●●●●●●●●●●●●●●●●●●●●●●●●●●●●●●●●●●●●●●●●●●●●●●●●●●●●●●●●●●●●●●●●●●●●●●●●●●●●●●●●●●●●●●●●●●●●●●●●●●●●●●●●●●●●●●●●●●●●●●●●●●●●●●●●●●●●●●●●●●●●●●●●●●●●●●●●●●●●●●●●●●●●●●●●●●●●●●●●●●●●●●●●●●●●●●●●●●●●●●●●●●●●●●●●●●●●●●●●●●●●●●●●●●●●●●●●●●●●●●●●●●●●●●●●●●●●●●●●●●●●●●●●●●●●●●●●●●●●●●●●●●●●●●●●●●●●●●●●●●●●●●●●●●●●●●●●●●●●●●●●●●●●●●●●●●●●●●●●●●●●●●●●●●●●●●●●●●●●●●●●●●●●●●●●●●●●●●●●●●●●●●●●●●●●●●●●●●●●●●●●●●●●●●●●●●●●●●●●●●●●●●●●●●●●●●●●●●●●●●●●●●●●●●●●●●●●●●●●●●●●●●●●●●●●●●●●●●●●●●●●●●●●●●●●●●●●●●●●●●●●●●●●●●●●●●●●●●●●●●●●●●●●●●●●●●●●●●●●●●●●●●●●●●●●●●●●●●●●●●●●●●●●●●●●●●●●●●●●●●●●●●●●●●●●●●●●●●●●●●●●●●●●●●●●●●●●●●●●●●●●●●●●●●●●●●●●●●●●●●●●●●●●●●●●●●●●●●●●●●●●●●●●●●●●●●●●●●●●●●●●●●●●●●●●●●●●●●●●●●●●●●●●●●●●●●●●●●●●●●●●●●●●●●●●●●●●●●●●●●●●●●●●●●●●●●●●●●●●●●●●●●●●●●●●●●●●●●●●●●●●●●●●●●●●●●●●●●●●●●●●●●●●●●●●●●●●●●●●●●●●●●●●●●●●●●●●●●●●●●●●●●●●●●●●●●●●●●●●●●●●●●●●●●●●●●●●●●●●●
10
20
30
40
Salinity
●●●●●●●●●●●●●●●●●●●●●●●●●●●●●●●●●●●●●●●●●●●●●●●●●●●●●●●●●●●●●●●●●●●●●●●●●●●●●●●●●●●●●●●●●●●●●●●●●●●●●●●●●●●●●●●●●●●●●●●●●●●●●●●●●●●●●●●●●●●●●●●●●●●●●●●●●●●●●●●●●●●●●●●●●●●●●●●●●●●●●●●●●●●●●●●●●●●●●●●●●●●●●●●●●●●●●●●●●●●●●●●●●●●●●●●●●●●●●●●●●●●●●●●●●●●●●●●●●●●●●●●●●●●●●●●●●●●●●●●●●●●●●●●●●●●●●●●●●●●●●●●●●●●●●●●●●●●●●●●●●●●●●●●●●●●●●●●●●●●●●●●●●●●●●●●●●●●●●●●●●●●●●●●●●●●●●●●●●●●●●●●●●●●●●●●●●●●●●●●●●●●●●●●●●●●●●●●●●●●●●●●●●●●●●●●●●●●●●●●●●●●●●●●●●●●●●●●●●●●●●●●●●●●●●●●●●●●●●●●●●●●●●●●●●●●●●●●●●●●●●●●●●●●●●●●●●●●●●●●●●●●●●●●●●●●●●●●●●●●●●●●●●●●●●●●●●●●●●●●●●●●●●●●●●●●●●●●●●●●●●●●●●●●●●●●●●●●●●●●●●●●●●●●●●●●●●●●●●●●●●●●●●●●●●●●●●●●●●●●●●●●●●●●●●●●●●●●●●●●●●●●●●●●●●●●●●●●●●●●●●●●●●●●●●●●●●●●●●●●●●●●●●●●●●●●●●●●●●●●●●●●●●●●●●●●●●●●●●●●●●●●●●●●●●●●●●●●●●●●●●●●●●●●●●●●●●●●●●●●●●●●●●●●●●●●●●●●●●●●●●●●●●●●●●●●●●●●●●●●●●●●●●●●●●●●●●●●●●●●●●●●●●●●●●●●●●●●●●●●●●●●●●●●●●●●●●●●●●●●●●●●●●●●●●●●●●●●●●●●●
32.5
33
33.5
34
34.5
Biome locations in ESOM
●●●●●●●●●●●●●●●●●●●●●●●●●●●●●●●●●●●●●●●●●●●●●●●●●●●●●●●●●●●●●●●●●●●●●●●●●●●●●●●●●●●●●●●●●●●●●●●●●●●●●●●●●●●●●●●●●●●●●●●●●●●●●●●●●●●●●●●●●●●●●●●●●●●●●●●●●●●●●●●●●●●●●●●●●●●●●●●●●●●●●●●●●●●●●●●●●●●●●●●●●●●●●●●●●●●●●●●●●●●●●●●●●●●●●●●●●●●●●●●●●●●●●●●●●●●●●●●●●●●●●●●●●●●●●●●●●●●●●●●●●●●●●●●●●●●●●●●●●●●●●●●●●●●●●●●●●●●●●●●●●●●●●●●●●●●●●●●●●●●●●●●●●●●●●●●●●●●●●●●●●●●●●●●●●●●●●●●●●●●●●●●●●●●●●●●●●●●●●●●●●●●●●●●●●●●●●●●●●●●●●●●●●●●●●●●●●●●●●●●●●●●●●●●●●●●●●●●●●●●●●●●●●●●●●●●●●●●●●●●●●●●●●●●●●●●●●●●●●●●●●●●●●●●●●●●●●●●●●●●●●●●●●●●●●●●●●●●●●●●●●●●●●●●●●●●●●●●●●●●●●●●●●●●●●●●●●●●●●●●●●●●●●●●●●●●●●●●●●●●●●●●●●●●●●●●●●●●●●●●●●●●●●●●●●●●●●●●●●●●●●●●●●●●●●●●●●●●●●●●●●●●●●●●●●●●●●●●●●●●●●●●●●●●●●●●●●●●●●●●●●●●●●●●●●●●●●●●●●●●●●●●●●●●●●●●●●●●●●●●●●●●●●●●●●●●●●●●●●●●●●●●●●●●●●●●●●●●●●●●●●●●●●●●●●●●●●●●●●●●●●●●●●●●●●●●●●●●●●●●●●●●●●●●●●●●●●●●●●●●●●●●●●●●●●●●●●●●●●●●●●●●●●●●●●●●●●●●●●●●●●●●●●●●●●●●●●●●●●●●●
1
2
3
4
5
6
7
8
12
34
56
78
Station
Line
LMG14−01 1 m
250 200 150 100 50 0
−100
010
020
030
040
050
060
070
080
0
+++
+ + +
+++
+ + +
+ ++ +
+ + +
02
46
810
1214
1618
2022
Station
Line
LMG14−01_1_Chl
250 200 150 100 50 0
−100
010
020
030
040
050
060
070
080
0
+++
+ + +
+++
+ + +
+ ++ +
+ + +
A) Kriging surfaces-Chlorophyll (shown)-Nitrate-Silicate-Phosphate-Temperature-Salinity
C) Biome classi�cation
!!
!!
!!
!!
!!
!!
!!
!!
!!
!!
!!
!!
!!
!!
!!
!!
!!
!!
!!
!!
!!
!!
!!
!!
!!
!!
!!
!!
!!
!!
!!
!!
!!
!!
!!
!!
!!
!!
!!
!!
!!
!!
!!
!!
!!
!!
!!
!!
!!
!!
!!
!!
!!
!!
!!
!!
!!
!!
!!
!!
000
100
200
300
400
500
600
700
800
900
40°0'0"W50°0'0"W
80°0'0"W
60°0
'0"S
70°0
'0"S
Legend
Palmer LTER basic regional survey grid! Grid station and grid line number
Sea ice extent (April 2016)Boundary of April sea ice extend
Bathymetry (NOAA Etopo1 bedrock)Open ocean (below -3000 m)
Shelf break (-3000 m to -750 m
Shelf, deep (-750 m to -500 m)
Shelf, shallow (-500 m to -60 m)
Nearshore (-60 m to 0m)
Land cover (based on Morgan et al. 2007)Ice shelves
Glacier (ice sheets)
Ice-free bedrock
Date Saved: 22.09.2016 09:42:15 Document Name: GISdata_Antarctica_20160919
0 100 20050Kilometers
Antarctic Peninsula
BellinghausenSea
SouthShetland
Islands
SouthernOcean
WeddelSea
Anvers I.
Adelaide I.
Larsen 'C'Ice Shelf
Alexander I.
Antarctic Peninsula - Environmental domains
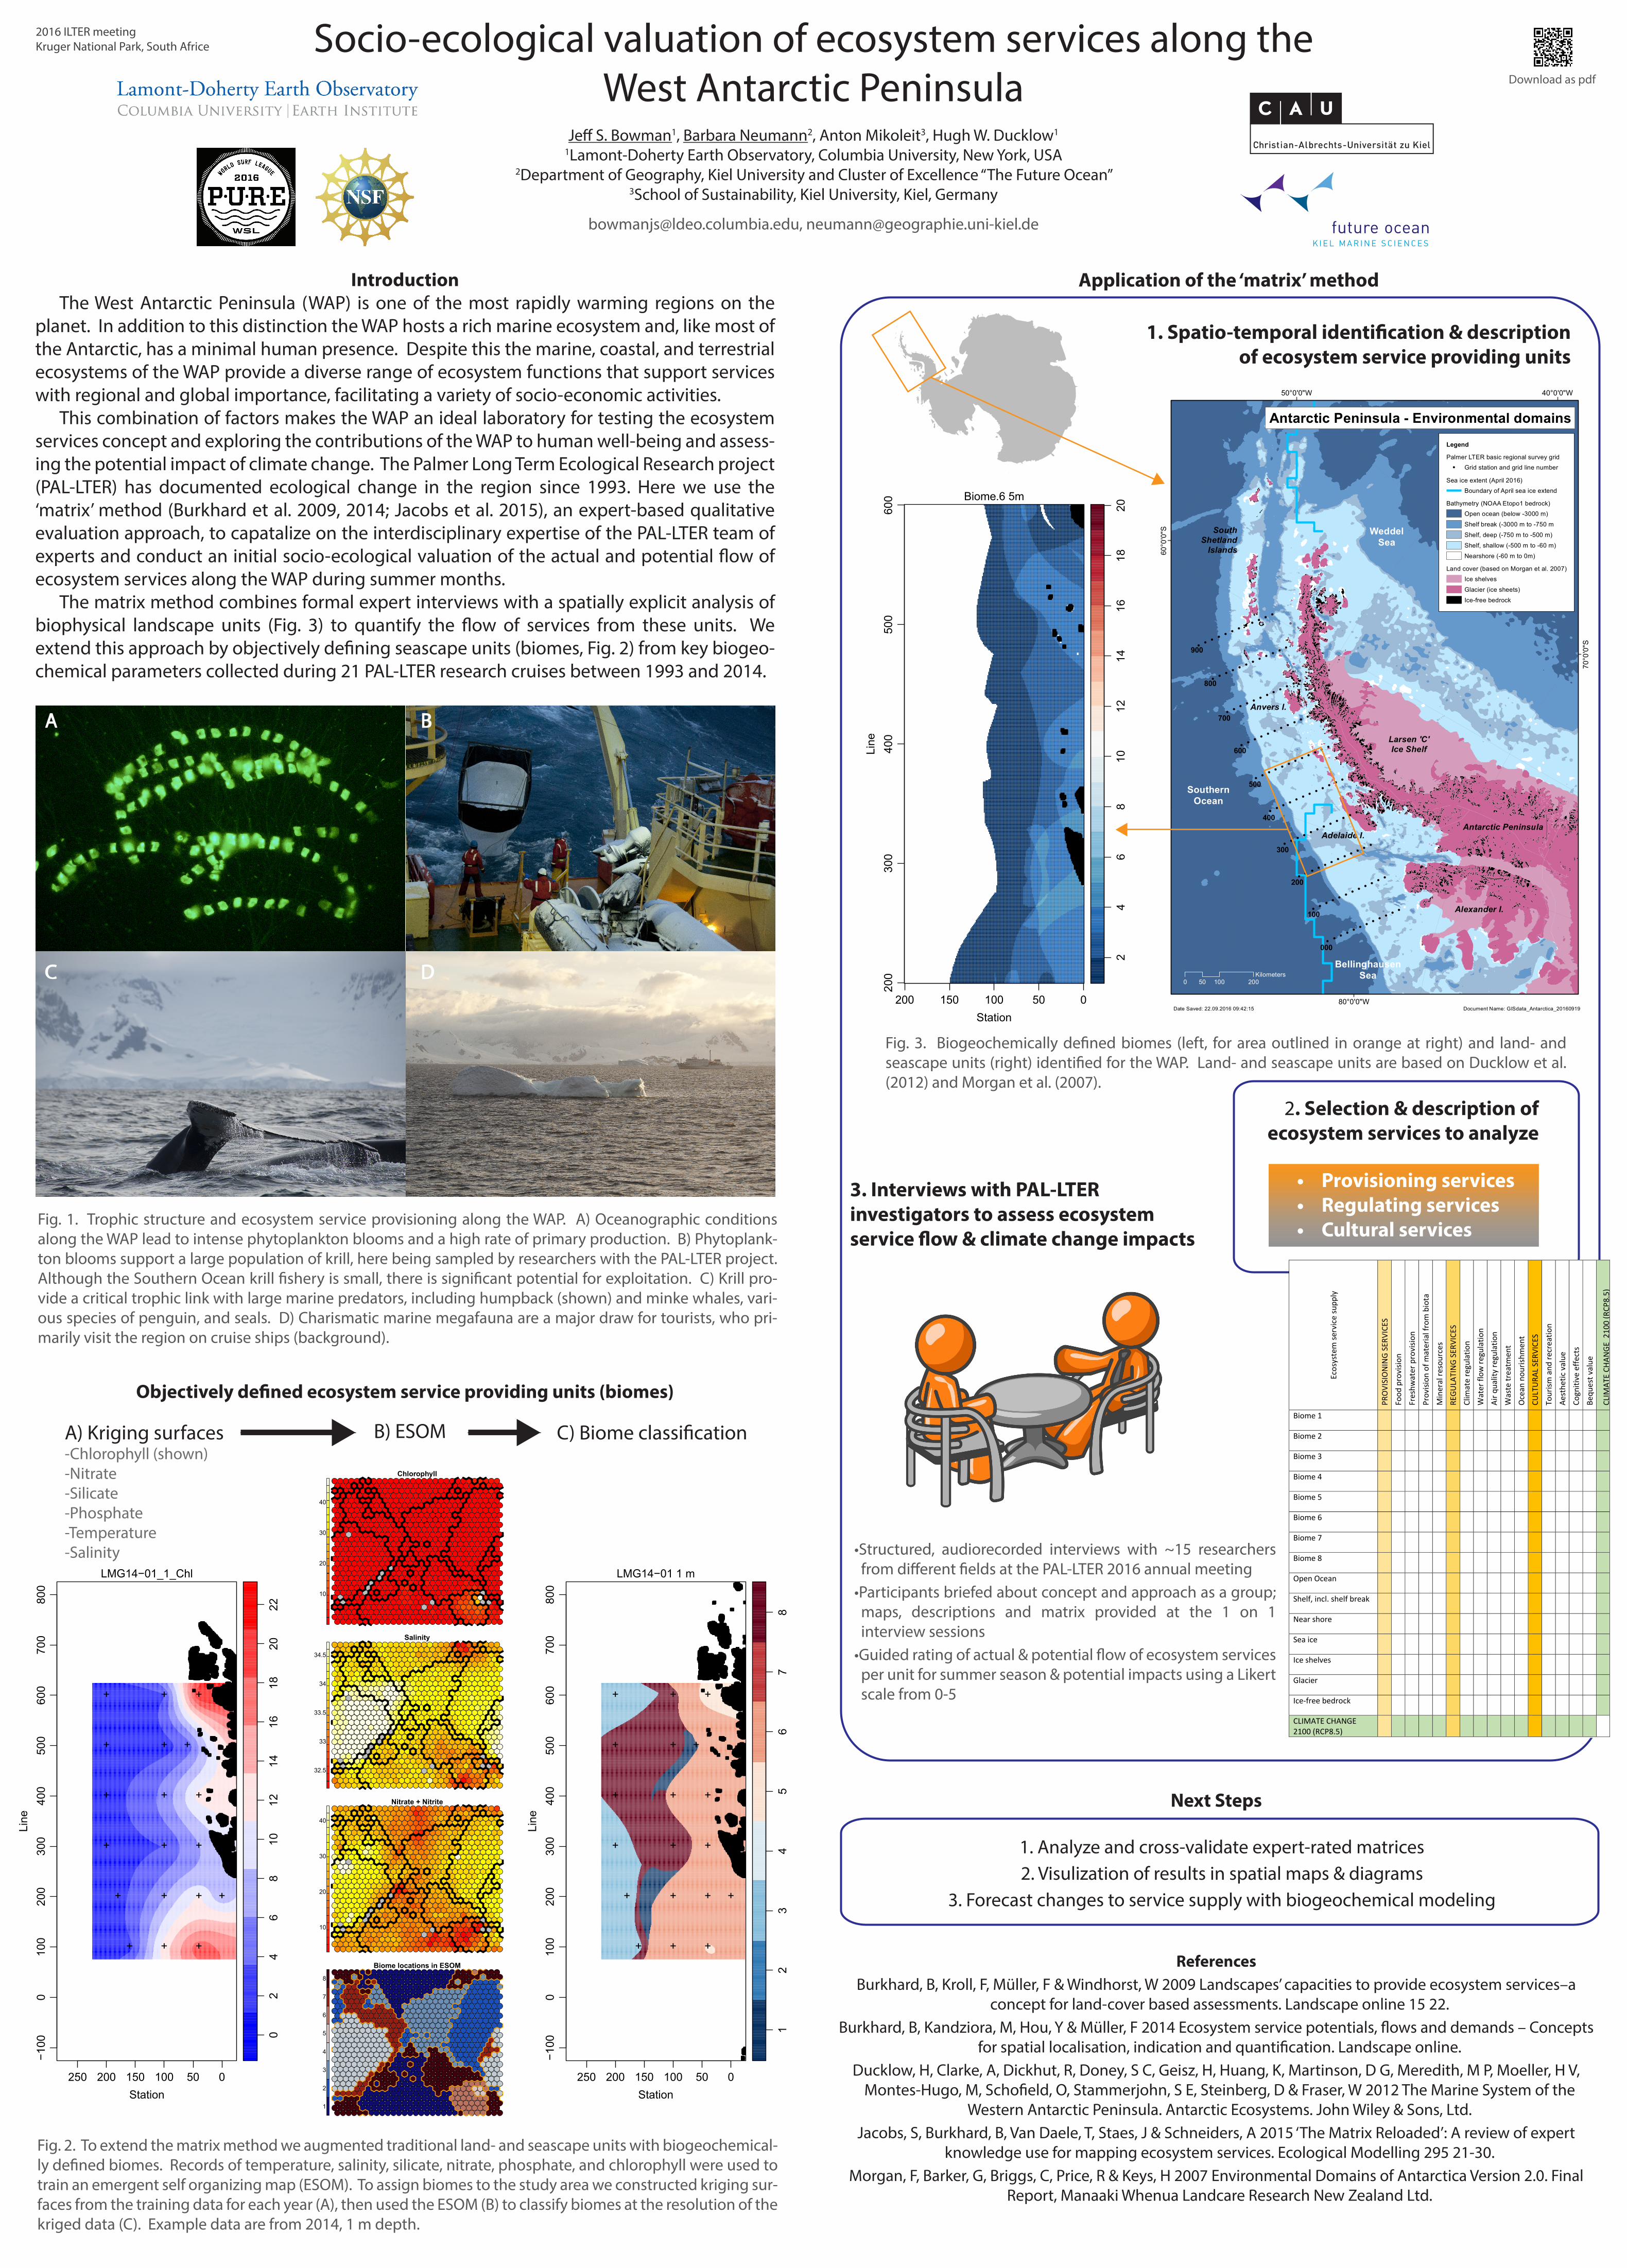
1. Spatio-temporal identi�cation & description of ecosystem service providing units
Fig. 3. Biogeochemically de�ned biomes (left, for area outlined in orange at right) and land- and seascape units (right) identi�ed for the WAP. Land- and seascape units are based on Ducklow et al. (2012) and Morgan et al. (2007).
2. Selection & description of ecosystem services to analyze
• Provisioning services• Regulating services• Cultural services
3. Interviews with PAL-LTER investigators to assess ecosystem service �ow & climate change impacts
•Structured, audiorecorded interviews with ~15 researchers from di�erent �elds at the PAL-LTER 2016 annual meeting
•Participants briefed about concept and approach as a group; maps, descriptions and matrix provided at the 1 on 1 interview sessions
•Guided rating of actual & potential �ow of ecosystem services per unit for summer season & potential impacts using a Likert scale from 0-5
ReferencesBurkhard, B, Kroll, F, Müller, F & Windhorst, W 2009 Landscapes’ capacities to provide ecosystem services–a
concept for land-cover based assessments. Landscape online 15 22.Burkhard, B, Kandziora, M, Hou, Y & Müller, F 2014 Ecosystem service potentials, �ows and demands – Concepts
for spatial localisation, indication and quanti�cation. Landscape online.Ducklow, H, Clarke, A, Dickhut, R, Doney, S C, Geisz, H, Huang, K, Martinson, D G, Meredith, M P, Moeller, H V,
Montes-Hugo, M, Scho�eld, O, Stammerjohn, S E, Steinberg, D & Fraser, W 2012 The Marine System of the Western Antarctic Peninsula. Antarctic Ecosystems. John Wiley & Sons, Ltd.
Jacobs, S, Burkhard, B, Van Daele, T, Staes, J & Schneiders, A 2015 ‘The Matrix Reloaded’: A review of expert knowledge use for mapping ecosystem services. Ecological Modelling 295 21-30.
Morgan, F, Barker, G, Briggs, C, Price, R & Keys, H 2007 Environmental Domains of Antarctica Version 2.0. Final Report, Manaaki Whenua Landcare Research New Zealand Ltd.
1. Analyze and cross-validate expert-rated matrices2. Visulization of results in spatial maps & diagrams
3. Forecast changes to service supply with biogeochemical modeling
24
68
1012
1416
1820
Station
Line
Biome.6 5m
200 150 100 50 0
200
300
400
500
600
Fig. 2. To extend the matrix method we augmented traditional land- and seascape units with biogeochemical-ly de�ned biomes. Records of temperature, salinity, silicate, nitrate, phosphate, and chlorophyll were used to train an emergent self organizing map (ESOM). To assign biomes to the study area we constructed kriging sur-faces from the training data for each year (A), then used the ESOM (B) to classify biomes at the resolution of the kriged data (C). Example data are from 2014, 1 m depth.
B) ESOM
Download as pdf
Application of the ‘matrix’ method
Next Steps
2016 ILTER meetingKruger National Park, South Africe