Embed Size (px)
Citation preview
Physical activity levels, early life events & the nutritional status of Maya children
Inês Varela-Silva, PhDCentre for Global Health & Human Dev.
Loughborough University, UK
Twitter: @inesvarelasilva
mayaproject.org.uk
© Photo by Teresa Castillo, 2011
Background
AAPA 2013 Charles Darwin Award RecipientProf Roberto Frisancho
Nutritional dual-burdenUnder-and-overnutrition
Coexistence of stunting & overweight/obesity
Intergenerational factors
The Maya in Mexico
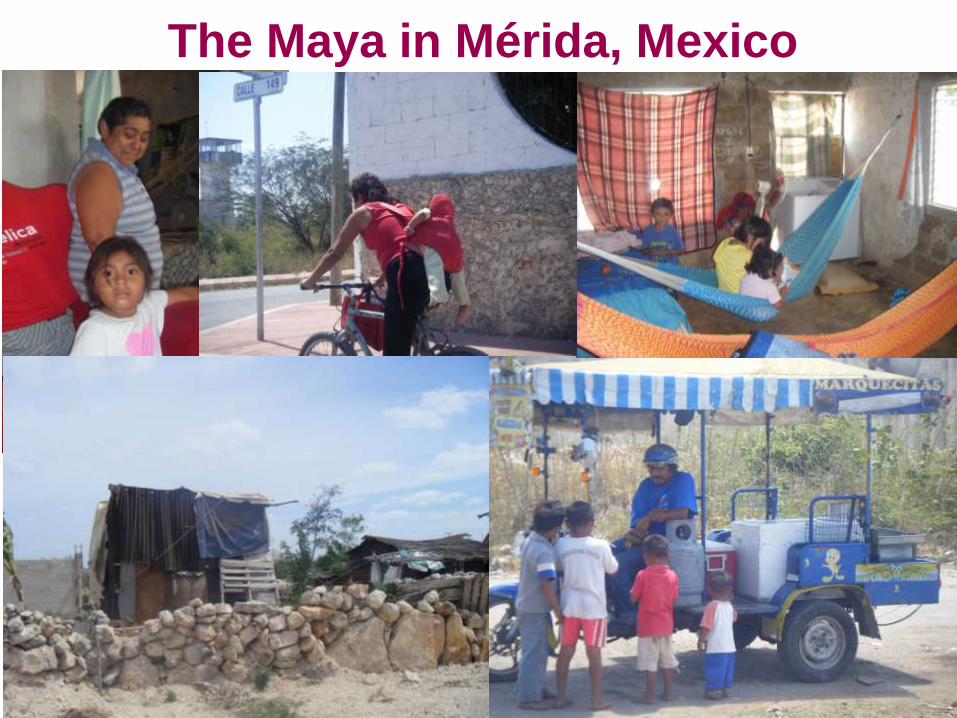
The Maya in Mérida, Mexico
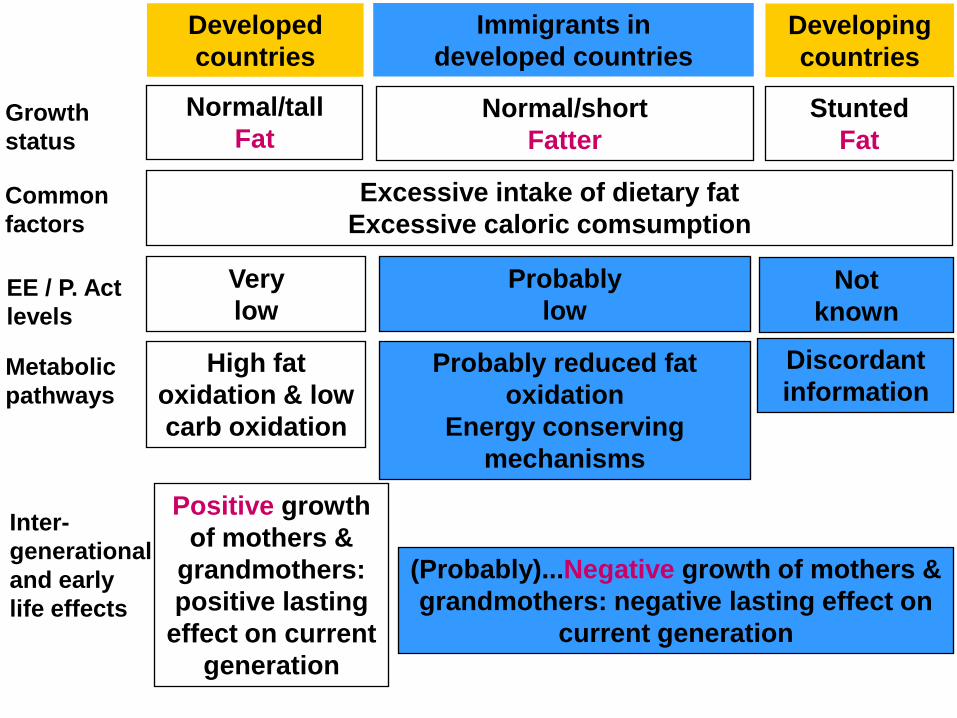
Developed
countries
Immigrants in
developed countries
Developing
countries
Growth
status
Common
factors
EE / P. Act
levels
Metabolic
pathways
Inter-
generational
and early
life effects
Normal/tall
FatNormal/short
Fatter
Stunted
Fat
Excessive intake of dietary fat
Excessive caloric comsumption
Very
low
Probably
lowNot
known
High fat
oxidation & low
carb oxidation
Discordant
informationProbably reduced fat
oxidation
Energy conserving
mechanisms
Positive growth
of mothers &
grandmothers:
positive lasting
effect on current
generation
(Probably)...Negative growth of mothers &
grandmothers: negative lasting effect on
current generation
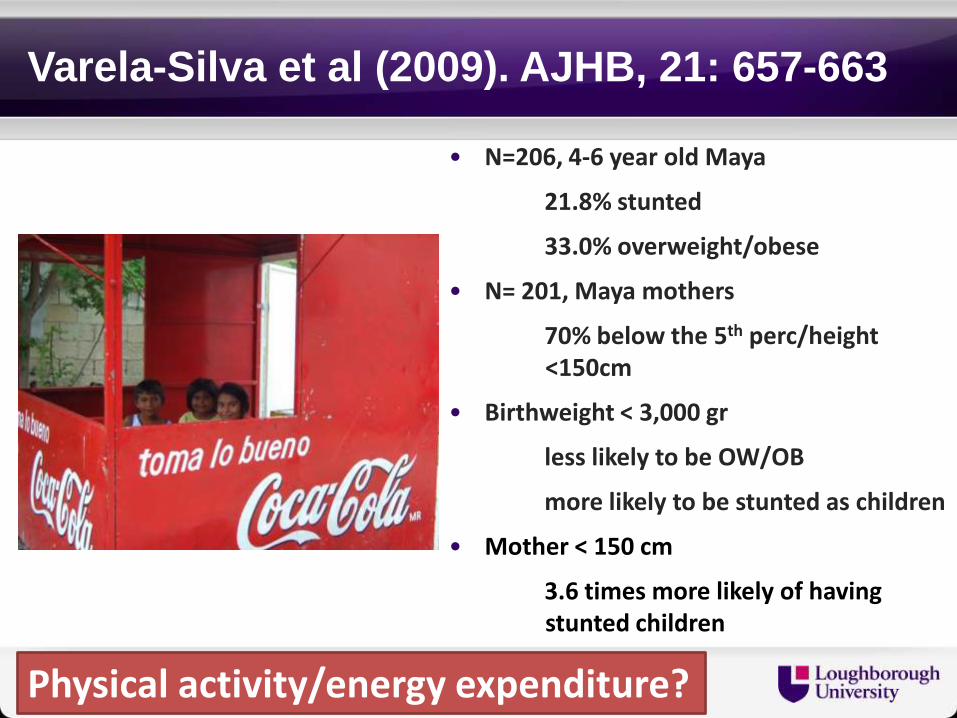
Varela-Silva et al (2009). AJHB, 21: 657-663
• N=206, 4-6 year old Maya
21.8% stunted
33.0% overweight/obese
• N= 201, Maya mothers
70% below the 5th perc/height <150cm
• Birthweight < 3,000 gr
less likely to be OW/OB
more likely to be stunted as children
• Mother < 150 cm
3.6 times more likely of having stunted children
Physical activity/energy expenditure?

Objective measurement of PA - Actiheart
Wilson et al (2011). AJHB, 23: 426-428
• Actiheart® very accurate in estimating EE and PAL
• Well tolerated by children (7days, free-living)
• EKG pads didn’t hold under hot & humid conditions
• Fieldwork conditions more demanding than lab’s
• Several Actihearts damaged/lost
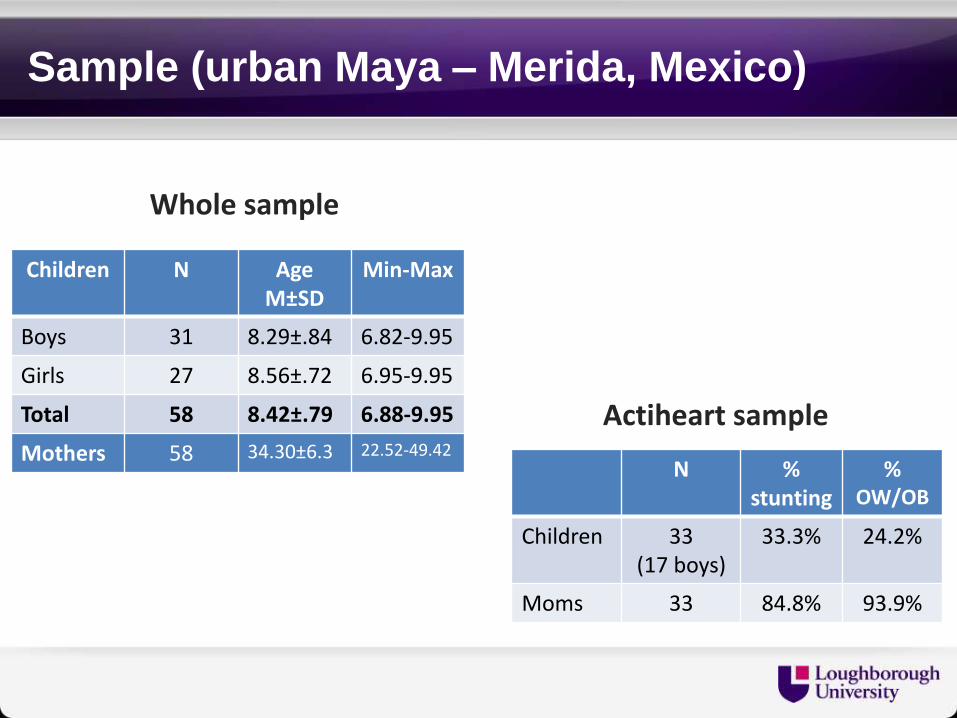
Sample (urban Maya – Merida, Mexico)
Whole sample
Children N Age M±SD
Min-Max
Boys 31 8.29±.84 6.82-9.95
Girls 27 8.56±.72 6.95-9.95
Total 58 8.42±.79 6.88-9.95
Mothers 58 34.30±6.3 22.52-49.42
Actiheart sample
N %stunting
%OW/OB
Children 33(17 boys)
33.3% 24.2%
Moms 33 84.8% 93.9%
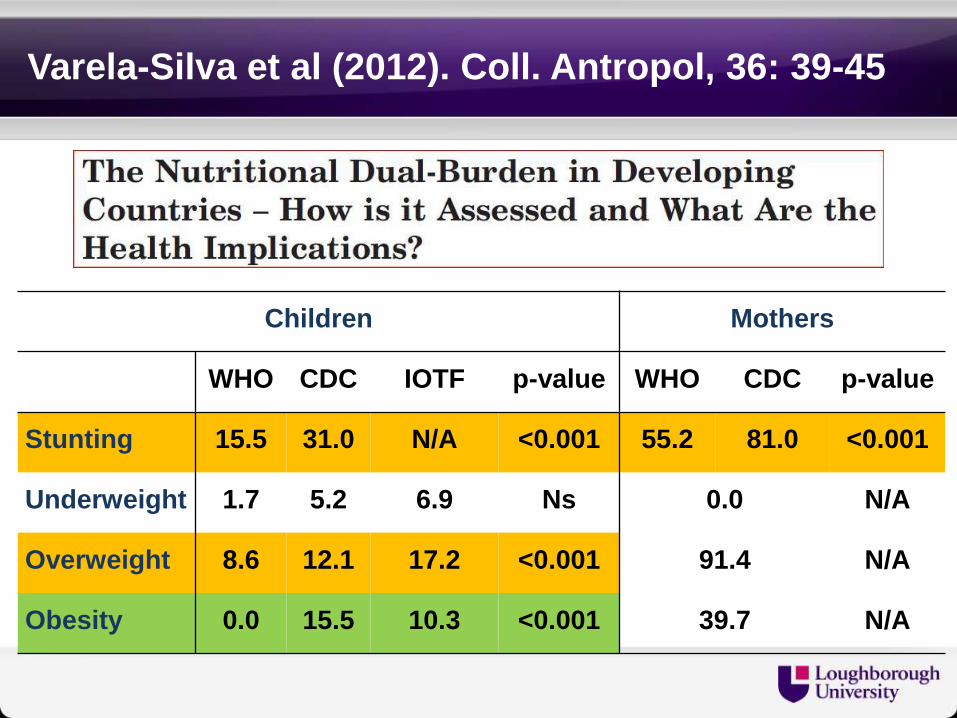
Varela-Silva et al (2012). Coll. Antropol, 36: 39-45
Children Mothers
WHO CDC IOTF p-value WHO CDC p-value
Stunting 15.5 31.0 N/A <0.001 55.2 81.0 <0.001
Underweight 1.7 5.2 6.9 Ns 0.0 N/A
Overweight 8.6 12.1 17.2 <0.001 91.4 N/A
Obesity 0.0 15.5 10.3 <0.001 39.7 N/A
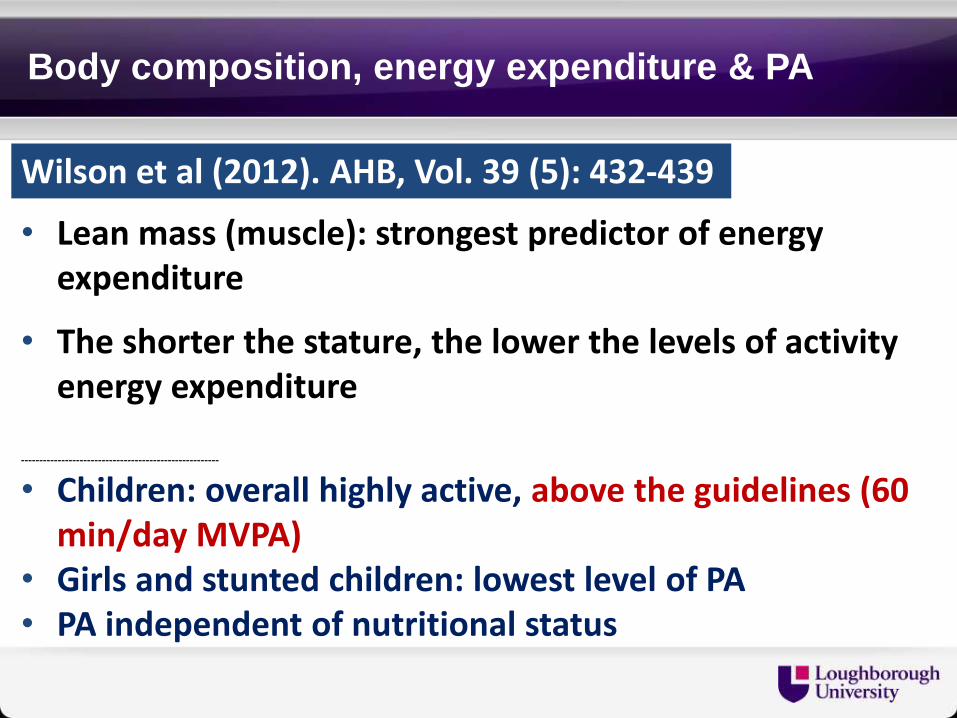
• Lean mass (muscle): strongest predictor of energy expenditure
• The shorter the stature, the lower the levels of activity energy expenditure
------------------------------------------------------
• Children: overall highly active, above the guidelines (60 min/day MVPA)
• Girls and stunted children: lowest level of PA• PA independent of nutritional status
Body composition, energy expenditure & PA
Wilson et al (2012). AHB, Vol. 39 (5): 432-439

Developed
countries
Immigrants in
developed countries
Maya in
Merida
Growth
status
Common
factors
EE / P. Act
levels
Metabolic
pathways
Inter-
generational
and early
life effects
Normal/tall
FatNormal/short
Fatter
Dual-burden
Excessive intake of dietary fat
Excessive caloric comsumption
Very
low
Probably
lowHigh
High fat
oxidation & low
carb oxidation
Discordant
information
Probably reduced fat
oxidation
Energy conserving
mechanisms
Positive growth
of mothers &
grandmothers:
positive lasting
effect on
children
Negative
growth of
mothers &
grandmothers:
negative effect
on children
(Probably)...Negative
growth of mothers &
grandmothers: negative
lasting effect on current
generation
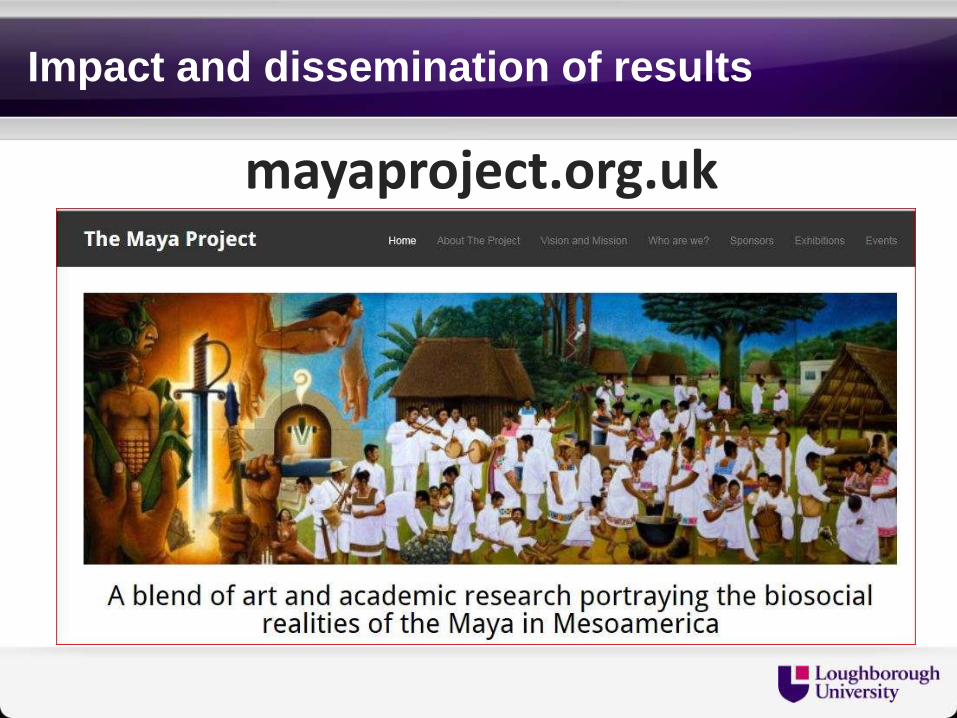
Impact and dissemination of results
mayaproject.org.uk

Impact and dissemination

Impact and dissemination

Impact and dissemination

Funding
• Wenner-Gren Foundation (#ICRG-93)
• Santander Universities
• CONACYT, Mexico
• Loughborough University