Embed Size (px)
Citation preview

Webinar Series National Nutrition Research Roadmap
2016‒2021: Advancing Nutrition Research to
Improve and Sustain Health
Webinar 4:
The National Nutrition Research Roadmap:
Application of Systems Science, Design and
Systems Change to Effect Population Level
Change in Eating Behaviors

A Few Reminders
CPE Credit
• ASN designates this educational activity for
a maximum of 1 CPEUs. Dietitians and
Dietetic Technicians, Registered should only
claim credit commensurate with the extent of
their participation in the activity.
• To claim credit, please take the post webinar
evaluation to be emailed after the webinar.
This webinar is being recorded.
Please mute your phone and/or computer microphone.

Questions & Answers
Please use the “questions” box on
your “Go To Meetings” screen to
submit questions to our presenters.
Please submit your questions at any
time during today’s webinar.

Faculty Speakers
Bruce Y. Lee, MD, MBA
Associate Professor of International Health
Johns Hopkins Bloomberg School of Public Health
Michele Forman, PhD
Head, Department of Nutrition Science
Purdue University
Mark Denbaly, PhD
Deputy Division Director for Food Economics Data
USDA
Elizabeth Larimore, MS
Agricultural Economist, USDA
Moderator
Marian L. Neuhouser, PhD, RD
Fred Hutchinson Cancer Research Center
President, American Society for Nutrition

Learning Objective
At the end of this program, attendees will be
able to:
Describe research gaps and opportunities
related to the application of systems
science, design and systems change to
effect population level change in eating
behaviors, as found in the National Nutrition
Research Roadmap
5

Use of Modeling To Explore Intervention Impact
Bruce Y. Lee, MD, MBA
Executive Director, Global Obesity Prevention Center (GOPC)
Associate Professor, Department of International Health
Twitter: @bruce_y_lee
© 2014, Johns Hopkins University. All rights reserved.
www.globalobesity.org
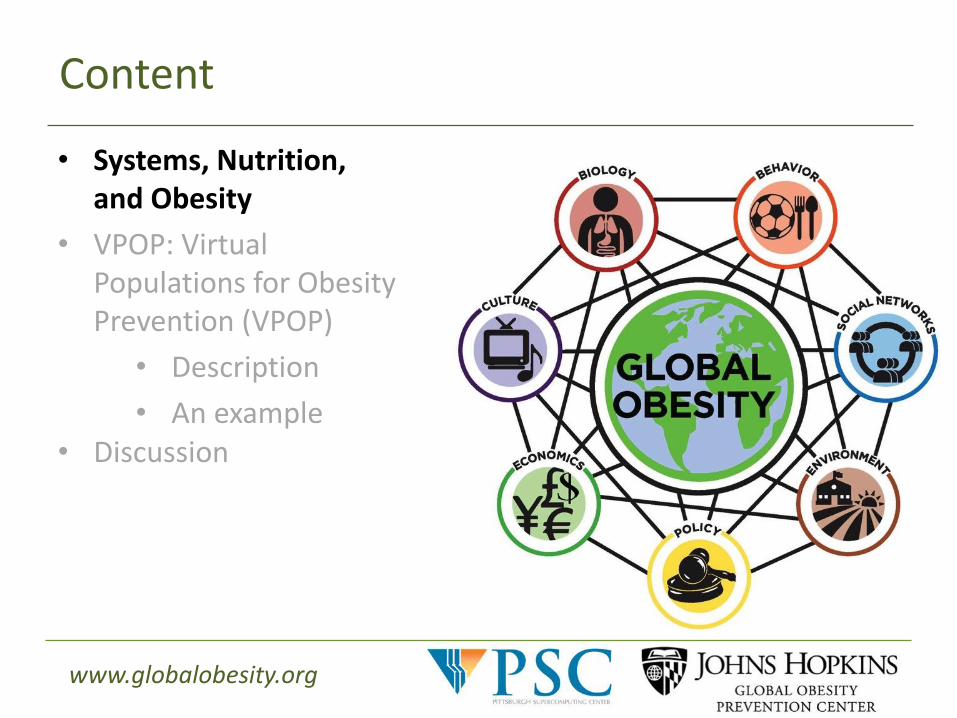
Content
• Systems, Nutrition, and Obesity
• VPOP: Virtual Populations for Obesity Prevention (VPOP)
• Description
• An example • Discussion

© 2014, Johns Hopkins University. All rights reserved.
www.globalobesity.org

© 2014, Johns Hopkins University. All rights reserved.
www.globalobesity.org
What is a system?
Individuals do not exist in isolation; they are all part of many different systems, such as social, political, environment, and economic systems

© 2014, Johns Hopkins University. All rights reserved.
www.globalobesity.org
Dangers of not using a systems approach
Need for systems science
approach
Band-aids rather than solutions
Unsustainable solutions
Missing secondary and tertiary
effects
Unintended consequences
Expended time, effort, and
resources from trial and error
© 2014, Johns Hopkins University. All rights reserved.
www.globalobesity.org
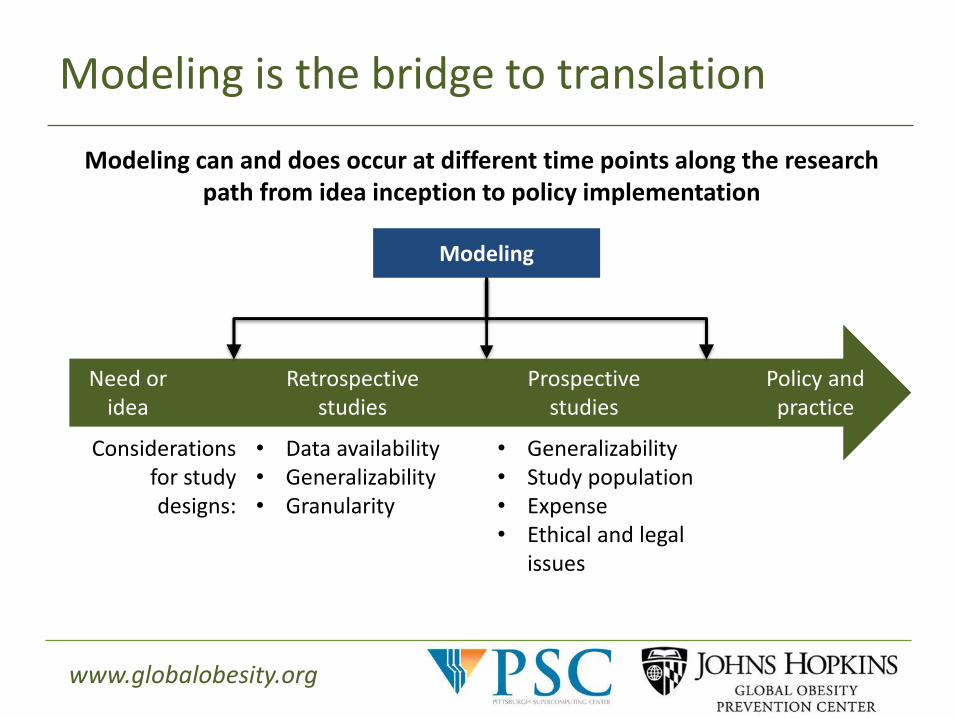
Modeling is the bridge to translation
Need or idea
Retrospective studies
Prospective studies
Policy and practice
Modeling can and does occur at different time points along the research path from idea inception to policy implementation
Modeling
Considerations for study designs:
• Data availability • Generalizability • Granularity
• Generalizability • Study population • Expense • Ethical and legal
issues
© 2014, Johns Hopkins University. All rights reserved.
www.globalobesity.org
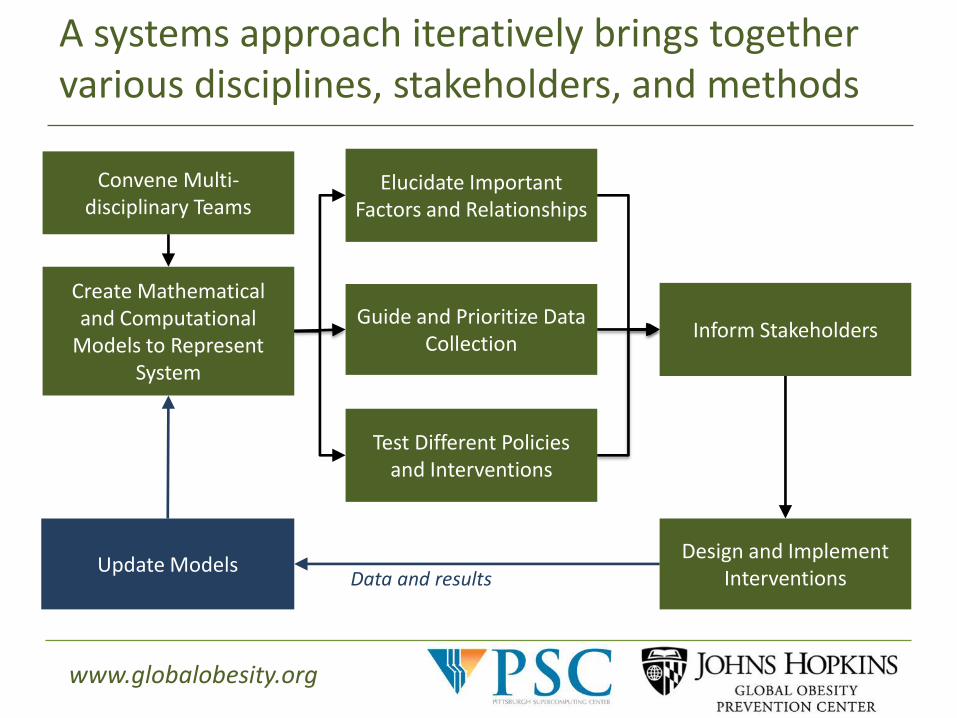
A systems approach iteratively brings together various disciplines, stakeholders, and methods
Create Mathematical and Computational
Models to Represent System
Elucidate Important Factors and Relationships
Convene Multi-disciplinary Teams
Test Different Policies and Interventions
Guide and Prioritize Data Collection
Design and Implement Interventions
Inform Stakeholders
Update Models Data and results

© 2014, Johns Hopkins University. All rights reserved.
www.globalobesity.org
Content
• Systems, Nutrition, and Obesity
• VPOP: Virtual Populations for Obesity Prevention (VPOP)
• Description
• An example • Discussion

© 2014, Johns Hopkins University. All rights reserved.
www.globalobesity.org
Content
• Systems, Nutrition, and Obesity
• VPOP: Virtual Populations for Obesity Prevention (VPOP)
• Description
• An example • Discussion

© 2014, Johns Hopkins University. All rights reserved.
www.globalobesity.org
Virtual Population Obesity Prevention (VPOP) Labs: “SimCity” for obesity prevention

© 2014, Johns Hopkins University. All rights reserved.
www.globalobesity.org
Representations of all key locations in VPOP use geo-coded data
households
schools workplace physical activity locations (parks, gyms, rec centers)
food sources

© 2014, Johns Hopkins University. All rights reserved.
www.globalobesity.org
Each person represented by computational agent
Synthetic population built using census data Each agent has the following characteristics:
• Age • Gender • Race/Ethnicity • Socio-economic status • Home assignment • School assignment • Height • Weight
Data specific to Baltimore allows the model to truly analyze the systems within Baltimore
© 2014, Johns Hopkins University. All rights reserved.
www.globalobesity.org
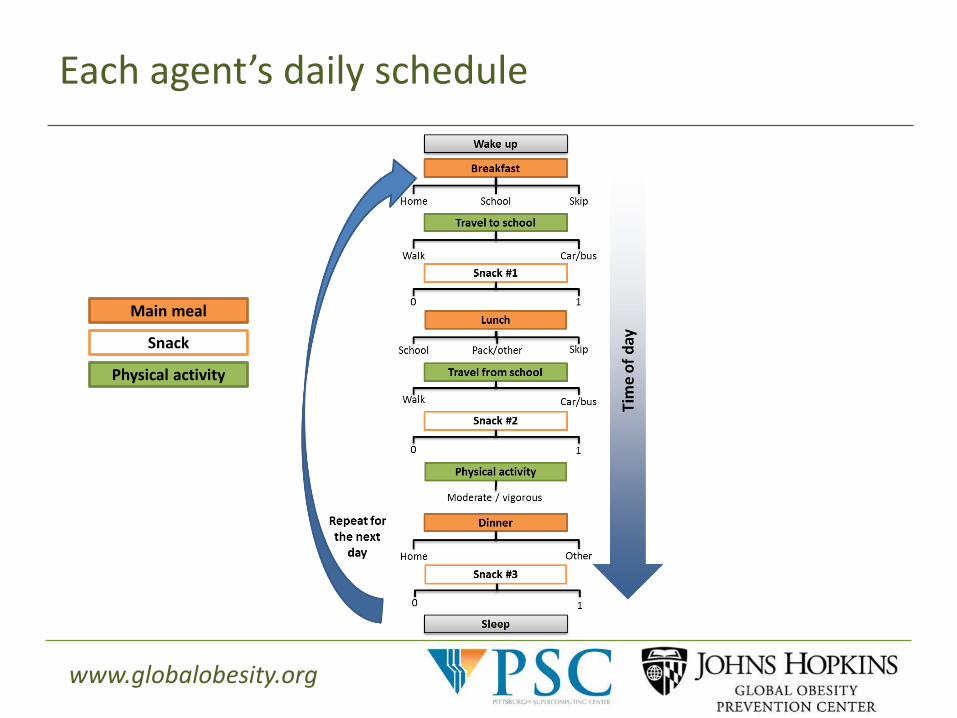
Each agent’s daily schedule
Main meal
Snack
Physical activity

© 2014, Johns Hopkins University. All rights reserved.
www.globalobesity.org
Each agent is embedded with a personalized metabolic model
Exc
ess
calo
ries
co
nsu
med
Excess bodyweight
AGENT 241,205
Gender: M Age: 12 Height: 60 Weight: 95 Metabolic model
Hall et al, 2014
Calories Eaten - Calories Burned = Weight Gain or Loss

© 2014, Johns Hopkins University. All rights reserved.
www.globalobesity.org
Content
• Systems, Nutrition, and Obesity
• VPOP: Virtual Populations for Obesity Prevention (VPOP)
• Description
• An example • Discussion

© 2014, Johns Hopkins University. All rights reserved.
www.globalobesity.org

© 2014, Johns Hopkins University. All rights reserved.
www.globalobesity.org

© 2014, Johns Hopkins University. All rights reserved.
www.globalobesity.org
Economic And Health Impact Of Increasing Children’s Physical Activity In The United States
Average lifetime costs averted by reaching “active to a healthy level” per person, by body mass index (BMI) status.
Bruce Y. Lee et al. Health Aff 2017;36:902-908

© 2014, Johns Hopkins University. All rights reserved.
www.globalobesity.org
Economic And Health Impact Of Increasing Children’s Physical Activity In The United States
US costs averted annually by increasing levels of children’s participation in physical activity
Bruce Y. Lee et al. Health Aff 2017;36:902-908

© 2014, Johns Hopkins University. All rights reserved.
www.globalobesity.org
Economic And Health Impact Of Increasing Children’s Physical Activity In The United States
Changes in US costs averted annually among adults by varying the intensity of physical activity
Bruce Y. Lee et al. Health Aff 2017;36:902-908

© 2014, Johns Hopkins University. All rights reserved.
www.globalobesity.org
Content
• Systems, Nutrition, and Obesity
• VPOP: Virtual Populations for Obesity Prevention (VPOP)
• Description
• An example • GOPC and Discussion
© 2014, Johns Hopkins University. All rights reserved.
www.globalobesity.org
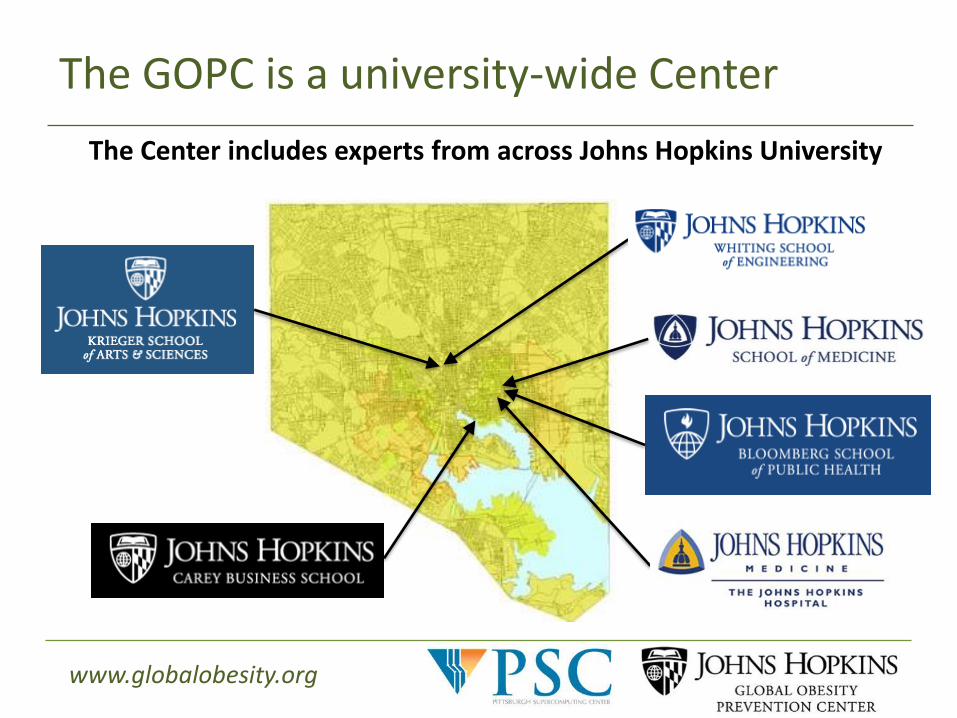
The GOPC is a university-wide Center
The Center includes experts from across Johns Hopkins University

© 2014, Johns Hopkins University. All rights reserved.
www.globalobesity.org
Systems Science Core Team
Bruce Y. Lee, MD, MBA Sindiso Nyathi, BA Mario Solano Gonzalez, BS Marie Spiker, MSPH Patrick Wedlock, MSPH Michelle Wong, BS Eli Zenkov, BS
Atif Adam, MD Cameron Avelis, MA Shawn Brown, PhD Molly Domino, BA Saeideh Fallah-Fini, PhD Marie Ferguson, MSPH Daniel Hertenstein, BS

© 2014, Johns Hopkins University. All rights reserved.
www.globalobesity.org
Recommendations
• Dietary patterns, health, and diseases are linked in a complex system • Systems approaches have transformed many other fields • Systems approaches can transform the way we understand and address
dietary patterns, health, and diseases • Systems approaches can allow us to fully harness the increasing amount of
available data • Incorporate systems methodologies such as systems mapping and
computational modeling into research and decision making • Using systems approaches also includes:
• Convening disciplines not traditionally associated with obesity with those that are
• Bringing together traditional and non-traditional study methodologies
• Iterative collaboration with stakeholders
• More global approaches

© 2014, Johns Hopkins University. All rights reserved.
www.globalobesity.org
Acknowledgements
• Eunice Kennedy Shriver National Institute of Child Health and Human Development (NICHD) and Office of Behavioral and Social Sciences Research (OBSSR) via U54 HD070725
• NICHD via U01HD086861 • NICHD via R01HD086013 • National Heart Lung and Blood Institute
(NHLBI) • Bill & Melinda Gates Foundation • Laureus Sport for Good Foundation • The Aspen Institute’s Sports & Society
Program

© 2014, Johns Hopkins University. All rights reserved.
www.globalobesity.org
Thank you!
www.globalobesity.org [email protected]
Contributor
Bruce Y. Lee I cover the intersection of business, health and public health.
@bruce_y_lee
@GlobalObesity

Nutritional Epidemiology
Big Data in Nutrition and
How to use it
Michele R Forman
Head, Department of Nutrition Science
Purdue University
Application of Systems Science, Design, and Systems
Change to Effect Population Level Change in Eating
Behaviors: Webinar May 31st 2017

Nutritional Epidemiology
Objectives
To examine big data sources in nutrition
– with diet, anthropometrics, biochemical
information--across the world & nation
including:
Cohorts, pooled data and meta-analysis
Future research
To learn uses and limitations of the data

Nutritional Epidemiology

Nutritional Epidemiology
NHANES Sampling
Nationally representative sample of
the civilian, non-institutionalized
population
Primary sampling unit = county with
units based on state groups with
health rankings*
Stratified cluster sampling with
weights to adjust to nationally
representative population
*Health rankings of state groups with highest to lowest health levels based on:
Death rate, infant mortality rate, % adult smokers or with high blood pressure or
overweight & obese or with poor nutrition.

Nutritional Epidemiology
Nutritional Status “cannot be measured by a few simple
indexes”
Clinical physical exam Nutritional status e.g. Ricketts
Skin, eye, dental
Biochemical via blood and urine collection Vitamin A & C, hemoglobin, folate…
Anthropometrics: Height or length
Weight
Skinfolds
DXA
Diet: 24 Hr Recalls—In-person & phone
FFQ
Sociological and psychological evaluations
“Multiple assessments
are required to measure
nutritional status”

Nutritional Epidemiology
Sources of variation in dietary data
Intra-individual
variation in food
consumption by day,
nutrient density
Social desirability
Seasonality
Availability and cost
of food
Age
Sex
Morbidity
Education
Body mass index
Race/ethnicity
Eating out
Willett WC: Nutritional Epidemiology; Forman MR et al Europ J Clin Nutr 2009;
Subar A et al: J Nutr 2015
Reporting
Bias &
Attenuation

Nutritional Epidemiology
1. Essential nutrients – minerals, vitamins,
lipids, amino acids
2. Major energy sources – proteins,
carbohydrates, fats, alcohol
3. Chemicals formed in cooking
4. Branded foods
5. Dietary supplements
*** No food composition data base is
comprehensive
Food Composition: Keeping up with the
Jones’ and We’ve come a long way!

Nutritional Epidemiology
https://www.cdc.gov/nchs/tutorials/dietary/
NHANES Web Tutorial for training in use
Survey sampling statistics: Analysis of Health Surveys, Graubard BI and Korn E, John Wiley and Sons 1999
NHANES Follow-Up Study

Nutritional Epidemiology
Cohort Study with Intent to Pool
European
Prospective
Investigation in
Cancer

Nutritional Epidemiology
EPIC Cohort Study
Aim: Investigate the relation between nutrition
and cancer
Who? 10 European countries with diverse diets
and cancer rates
When? 1990
Nutrition Data: FFQ; Food records;
Anthropometrics
Endpoints: Vital and health status via postal
questionnaires every 3-5 years.
Cancer incidence from annual linkage to cancer
registries.

Nutritional Epidemiology
Rules of the Road for Pooling EPIC
Study Data
First rule: Country specific development
of dietary tools collecting core food
items/questions across countries
Second rule: Calibrate country specific
FFQ with food records and biomarkers
Third rule: Analyze the data at the country
specific level
Then pool the data

Nutritional Epidemiology
BIG DATA Resources like EPIC
NCI (PLCO) Prostate, Lung, Colorectal
Cancer Trial
NCI (AARP) American Association of Retired
Persons (Cohort) Study
NCI Agricultural Health (Cohort) Study

Nutritional Epidemiology
BIG DATA Resources with nutrition data
not collected with intent to pool
NCI Cohort Consortium: Pooling study
CLIC: Childhood Leukemia International
Collaboration of case-control studies

Nutritional Epidemiology
‘ALL OF US’ Cohort Study: NIH
Future research
Volunteers
To address multiple exposures, markers of
and disease states
What nutrition data might be collected?
Anthropometrics: wt/ht; waist circum; BIA
Diet: FFQ; 24 hr recalls; Food environment
Biochemical: Fecal, blood, urine

Nutritional Epidemiology
Intergenerational Cohort Research:
Future Research
Importance of the triad:
mother/partner/offspring in research
Assess the biosocial pathways using
omics, nutrition, environmental data
Identify vulnerable windows across the life
course with potential for intervention

Nutritional Epidemiology
Antenatal Multiple Micronutrient (MM) Supplements:
Meta-Analyses of Effects on Birth Outcomes and
Infant Survival
Global Summary Estimate: MM vs None, Placebo, Iron or IFA:
IronFolicAcid
Basic Finding: Micronutrient Supplements are safe and often
beneficial to health
Haider and Bhutta Cochrane Analysis 2015
Keith West: JHU

Nutritional Epidemiology
MM vs (Nil, PL, FE or IFA) on Small for Gestational Age: RR = 0.90 (0.83-0.97)
= Asian trials
Could there be no effect in Southern Asia?
Haider and Bhutta Cochrane Analysis 2015
Keith West: JHU

Nutritional Epidemiology
Haider and Bhutta Cochrane Analysis 2015
MM vs (PL, Fe or IFA) on Preterm Births: RR = 0.96 (0.89-1.03)
= Asian trials
Could there only be an effect in Southern Asia?
Keith West: JHU

Nutritional Epidemiology
Know the intent/aim of each study, the
advantages and disadvantage of each study
design before pooling or a meta-analysis
Compared to case-control studies, cohort
studies are less affected by recall bias
Everyone is healthy at the beginning of the
cohort study, thus those who develop
disease are as likely to participate in the
study as those who do not

Nutritional Epidemiology
Loss to follow up
If cohort members with poor diets are more likely to drop out
AND
Poor diet is associated with higher risk of cancer/other disease
Beneficial effect of diet will be underestimated, because cohort members with poor diets, who will be more likely to develop cancer may drop out

Nutritional Epidemiology
BIG DATA: BIG Challenges
BIG DATA: What
does it offer?
Challenge: Once a
trial or cohort
participant always
a participant?
What is the
average BMI of
participants since
1960’s? 27
Implications for
health research?

Nutritional Epidemiology
Important to capture the distribution:
food/nutrient/body mass
Nutritional Epidemiology
Thanks
Michele R Forman
Head, Department of Nutrition
Science
Purdue University

National Household Food Acquisition and Purchase Survey
(FoodAPS)
Mark Denbaly and Liz Larimore USDA - Economic Research Service
Application of Systems Science, Design, and Systems Change to Effect Population Level Change in Eating Behaviors
Webinar, May 31st, 2017
The information presented here are those of the authors and not those of USDA or the Economic Research Service.

56
Table of Contents
• Why FoodAPS?
• Research Questions Enabled by FoodAPS-1
• New Insights Provided by FoodAPS-1 Data
• Plans for the Second Round of FoodAPS
57
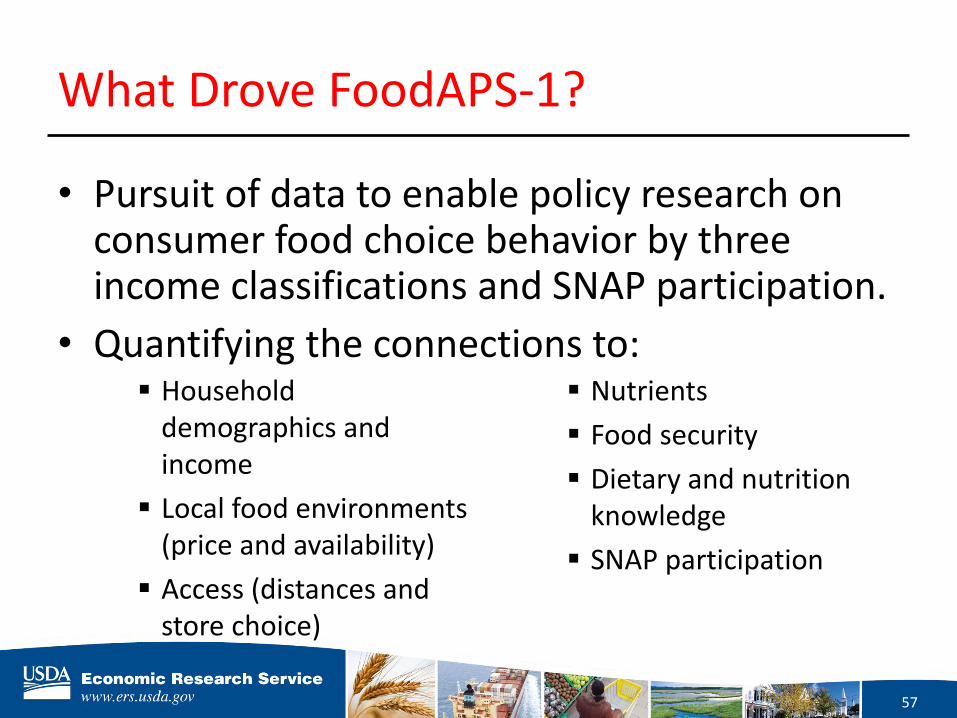
What Drove FoodAPS-1?
• Pursuit of data to enable policy research on consumer food choice behavior by three income classifications and SNAP participation.
• Quantifying the connections to: Household
demographics and income
Local food environments (price and availability)
Access (distances and store choice)
Nutrients
Food security
Dietary and nutrition knowledge
SNAP participation

58
Opportunities for insightful research Data on SNAP participation, shopping habits and store preferences, household expenditures, and food security provide opportunity for new research.
• Restricted FoodAPS-1 data are being used by 168 external researchers across 61 projects
• Recently released public-use data are fueling more research
• Current FoodAPS research includes:
NBER and UKCPR grants
Independent external research projects
USDA cooperative agreements
See the list on the FoodAPS Research Projects and Publications webpage

59
• Food Environment – Where do households shop and how do they get
there?
– How do neighborhood characteristics impact food decisions, and nutrition?
– How does food access impact food security
• Food Prices – How do food prices impact healthy food choices?
• Food Away From Home – How healthy are the food-away-from-home choices
of low-income households?
FoodAPS-1 Data are Sparking Research in a Variety of Areas

60
FoodAPS-1 Data are Sparking Research in a Variety of Areas, continued • SNAP
– Do SNAP recipients pay the best prices?
– What foods do new SNAP recipients acquire?
– Is SNAP like cash for recipients and stores?
• WIC
– Are households less price sensitive when using WIC benefits?
– How does geography impact WIC participation?
• Other Food Assistance Programs
– How do school meal programs impact what children obtain?

61
U.S. households are not limited to food stores in their own neighborhoods
• Roughly 89% of households do their primary shopping at SM/SC
• Similarly, 89% of SNAP and 88% of non-SNAP low-income households do their primary shopping at a SM/SC
• 9 of 10 food-insecure households (w/ difficulty at some time during the year providing enough food due to lack of resources) primarily shop at SM/SCs
Food choices in neighborhoods without supermarkets, even for households without car or other transportation, not constrained to lower variety and higher prices of smaller nearby stores.
SNAP = Supplemental Nutrition Assistance Program. Source: USDA, Economic Research Service using data from the National Household Food Acquisition and Purchase Survey, collected April 2012-January 2013, as presented in Ver Ploeg et al., 2015.
Figure 1. Distance to nearest SNAP-authorized SM/SC and to primary shopping store by travel mode
*SM/SC = Supermarkets and Supercenters. Source: Ver Ploeg, Michele, Lisa Mancino, Jessica E. Todd, Dawn Marie Clay, and Benjamin Scharadin. Where Do Americans Usually Shop for Food and How Do They Travel To Get There? Initial Findings From the National Household Food Acquisition and Purchase Survey, EIB-138, U.S. Department of Agriculture, Economic Research Service, March 2015.

62
Households often bypass the nearest supermarket to obtain groceries
• The average straight-line distance, 2.1 miles
• The average distance to store where household usually shops, 3.8 miles
• This behavior holds even for those who walk, bike, or take public transit traveled
SNAP = Supplemental Nutrition Assistance Program. WIC = Special Supplemental Nutrition Program for Women, Infants, and Children. Source: Ver Ploeg, Michele, Lisa Mancino, Jessica E. Todd, Dawn Marie Clay, and Benjamin Scharadin. Where Do Americans Usually Shop for Food and How Do They Travel To Get There? Initial Findings From the National Household Food Acquisition and Purchase Survey, EIB-138, U.S. Department of Agriculture, Economic Research Service, March 2015.
Figure 2. Distance to nearest SNAP-authorized SM/SC and to primary shopping store for selected subgroups

63
New Insights: SNAP Households Food Shopping Behaviors
Does regional price variation influence the real value of SNAP benefits? • Bronchetti et al. (2015) findings suggest that 20% to 30% of SNAP
households face TFP prices that are high enough to be purchased with their benefits plus 30% of their net income. The proportion increases as the distance increases.
• Basu et al. (2016) find that living in areas with higher cost of living is associated with acquisition of less healthy foods. Authors find that SNAP households are no more likely to live in lower cost of living areas.
• Lyford et al. (2016) find that budgeting plays a crucial role in the affordability of food for individuals receiving SNAP. On average the index of food prices paid by SNAP recipients was 0.09 points lower.
• Chang et al. (2016) find that, while SNAP recipients are better able to employ competent consumer strategies, these strategies are far from ubiquitous.

64
Planning for FoodAPS-2
• Understand how to improve upon FoodAPS-1 – Reports evaluating the strengths and limitations of FoodAPS-1
data are available on the FoodAPS Data Quality and Accuracy webpage
• Building infrastructure – Conducting ADCM Pilot Test
– Real time identification of nutrient information
– Indices of local prices and varieties
– Area-based local demographic and policy characteristics
• Determining desired content
• Preparing RFP for award in FY17

65
Development of FoodAPS-2
Aim to refine FoodAPS-1 data collection
• Capture higher quality data, reduce processing time, and lower respondent burden
• Better measures of SNAP participation
• Greater focus on WIC participants and children
• Reduce reclassification of households by accurately collecting information in screener interviews
• Move to year-round data collection
• Links back to agricultural commodity contents of foods

66
Thank You!
Have ideas and or feedback?
Please contact us: [email protected]
Need further details and information?
Go to: https://www.ers.usda.gov/foodaps

Questions & Answers
Please submit your questions to
via the “questions box” on your
screen.

Thank you for joining us!
Access recordings of all four webinars of the
National Nutrition Research Roadmap
Webinar Series
on www.nutrition.org.