Embed Size (px)
Citation preview
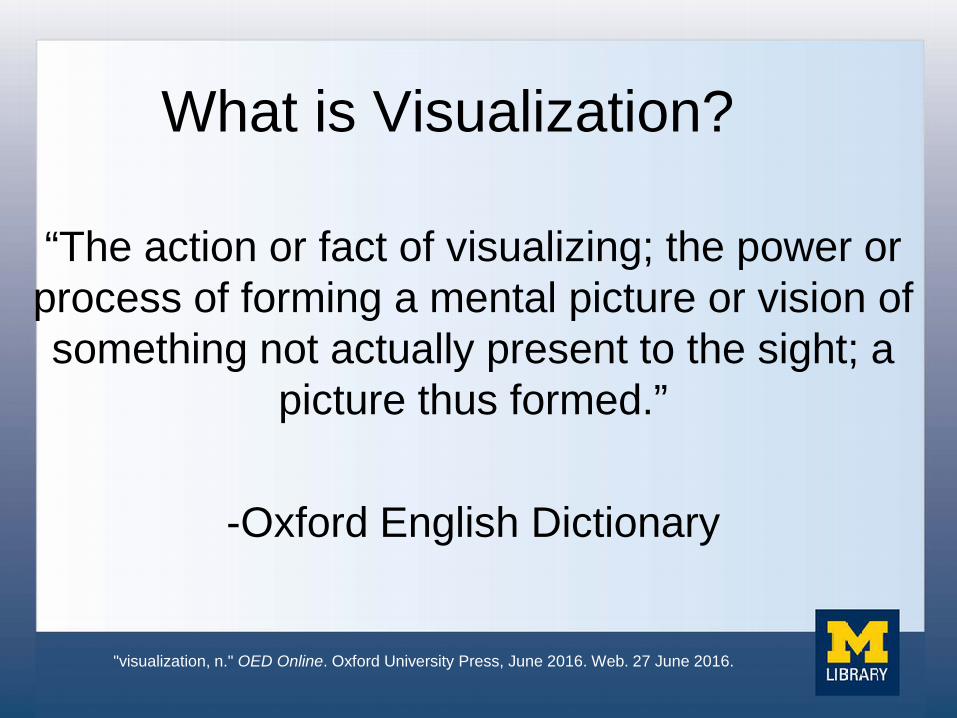
What is Visualization?
“The action or fact of visualizing; the power or process of forming a mental picture or vision of something not actually present to the sight; a
picture thus formed.”
-Oxford English Dictionary
"visualization, n." OED Online. Oxford University Press, June 2016. Web. 27 June 2016.
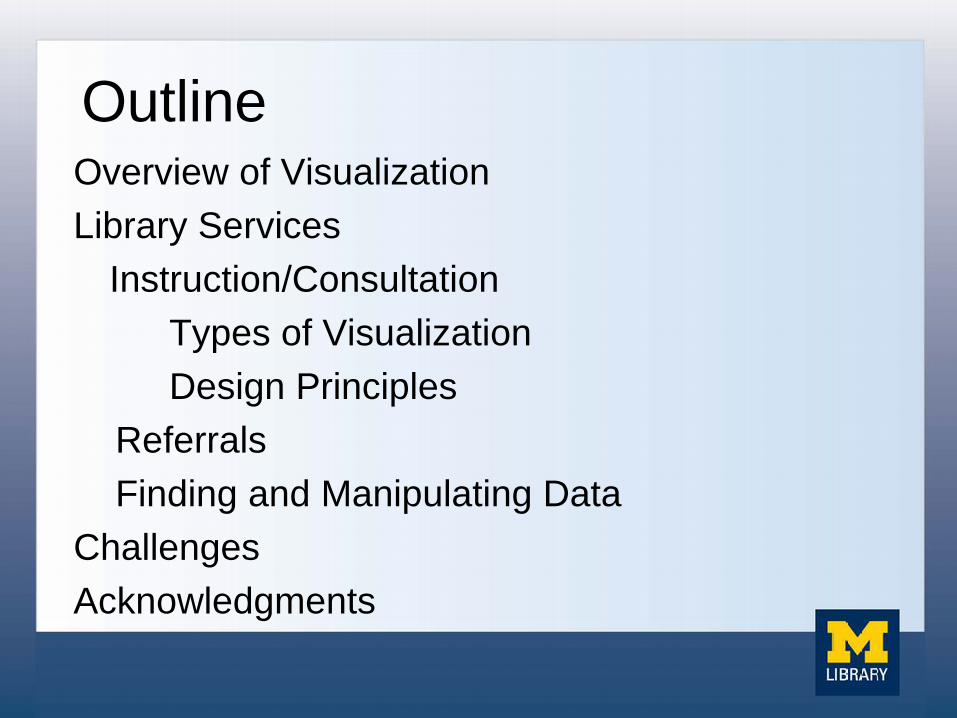
Outline Overview of Visualization Library Services Instruction/Consultation Types of Visualization Design Principles
Referrals Finding and Manipulating Data
Challenges Acknowledgments
OVERVIEW OF VISUALIZATION
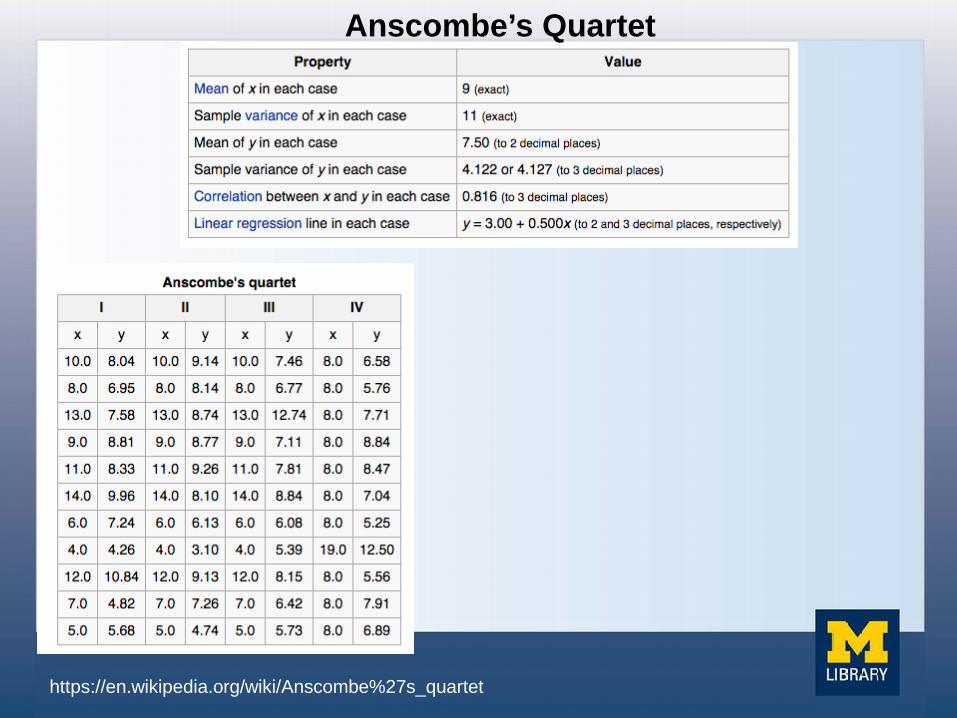
Anscombe’s Quartet
https://en.wikipedia.org/wiki/Anscombe%27s_quartet
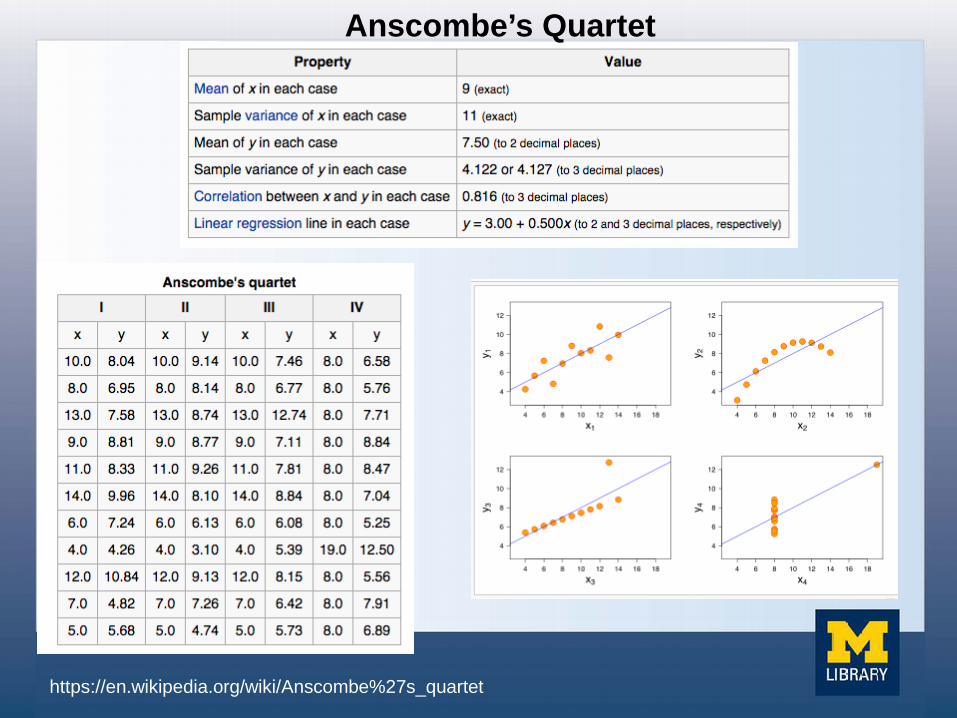
https://en.wikipedia.org/wiki/Anscombe%27s_quartet
Anscombe’s Quartet
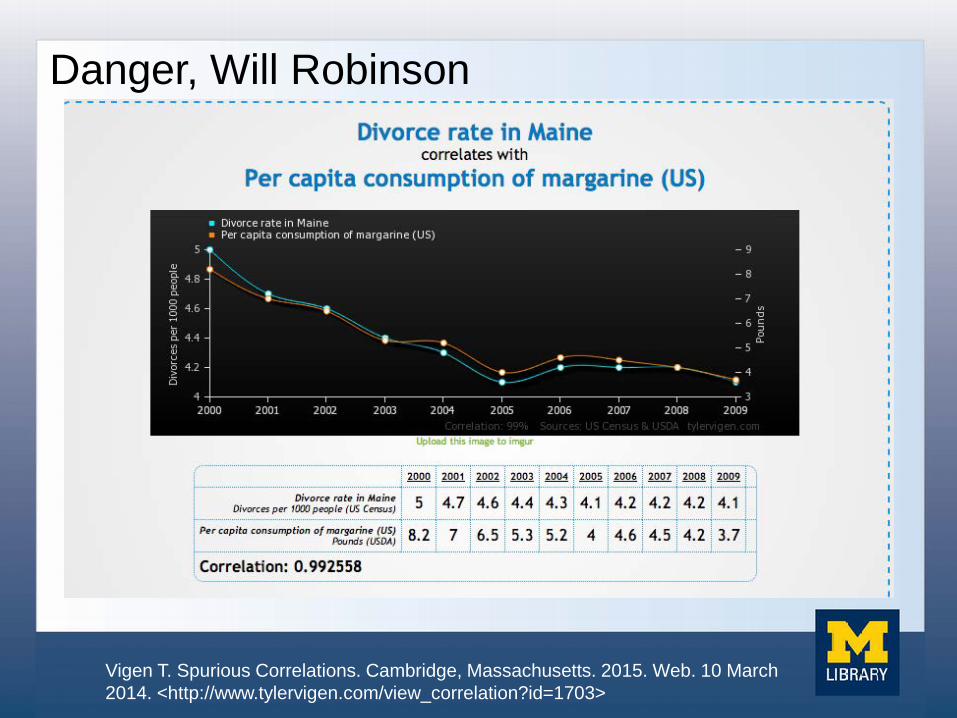
Danger, Will Robinson
Vigen T. Spurious Correlations. Cambridge, Massachusetts. 2015. Web. 10 March 2014. <http://www.tylervigen.com/view_correlation?id=1703>
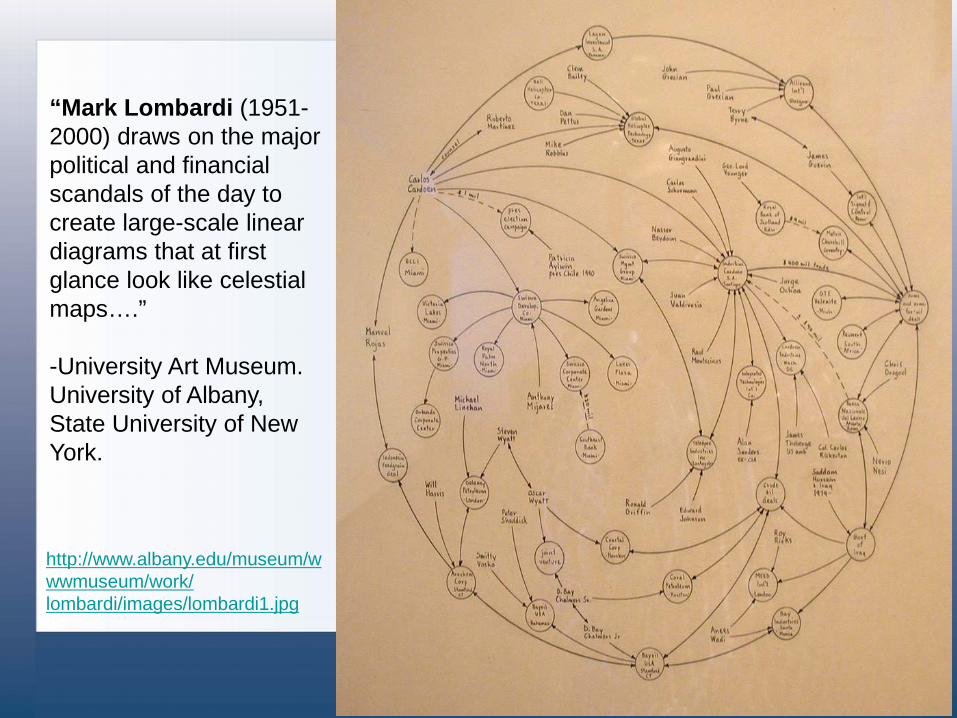
http://www.albany.edu/museum/wwwmuseum/work/ lombardi/images/lombardi1.jpg
“Mark Lombardi (1951-2000) draws on the major political and financial scandals of the day to create large-scale linear diagrams that at first glance look like celestial maps….” -University Art Museum. University of Albany, State University of New York.
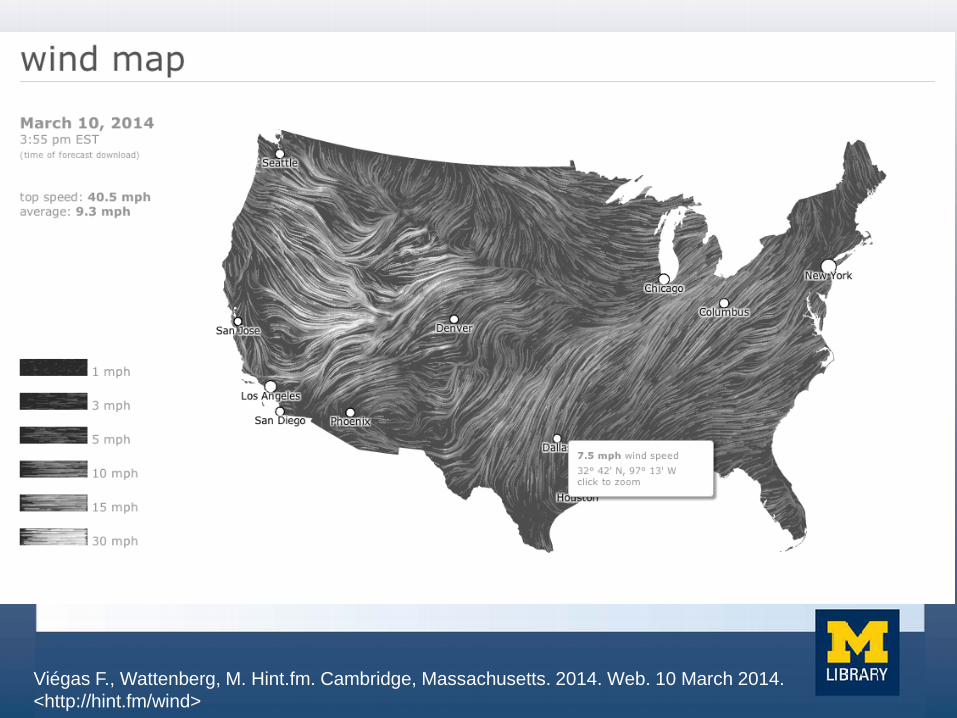
Viégas F., Wattenberg, M. Hint.fm. Cambridge, Massachusetts. 2014. Web. 10 March 2014. <http://hint.fm/wind>
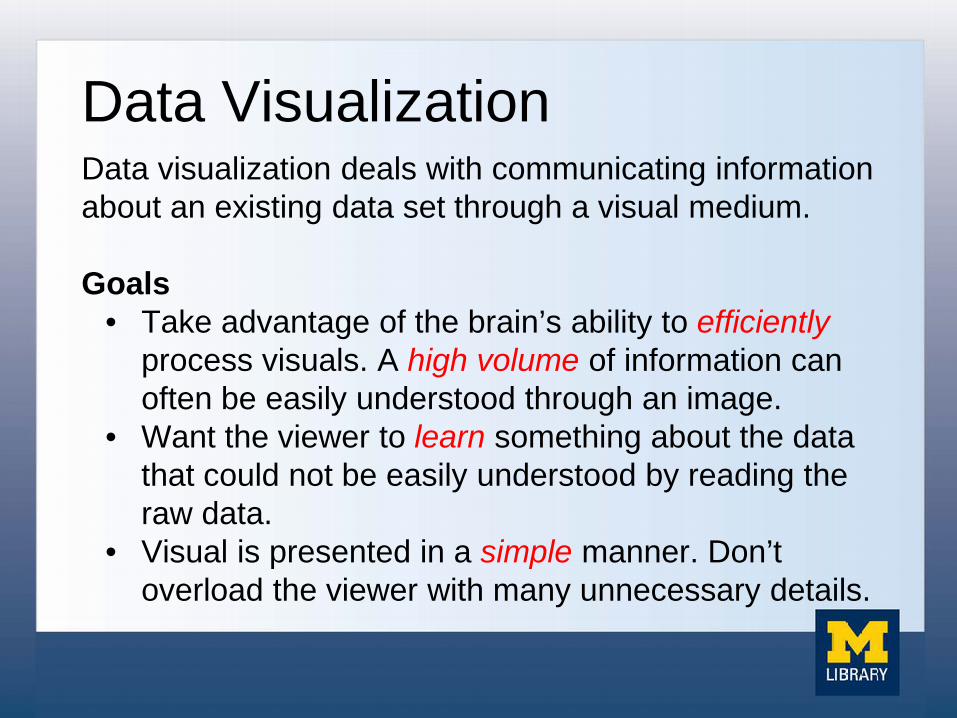
Data Visualization Data visualization deals with communicating information about an existing data set through a visual medium. Goals
• Take advantage of the brain’s ability to efficiently process visuals. A high volume of information can often be easily understood through an image.
• Want the viewer to learn something about the data that could not be easily understood by reading the raw data.
• Visual is presented in a simple manner. Don’t overload the viewer with many unnecessary details.

LIBRARY SERVICES
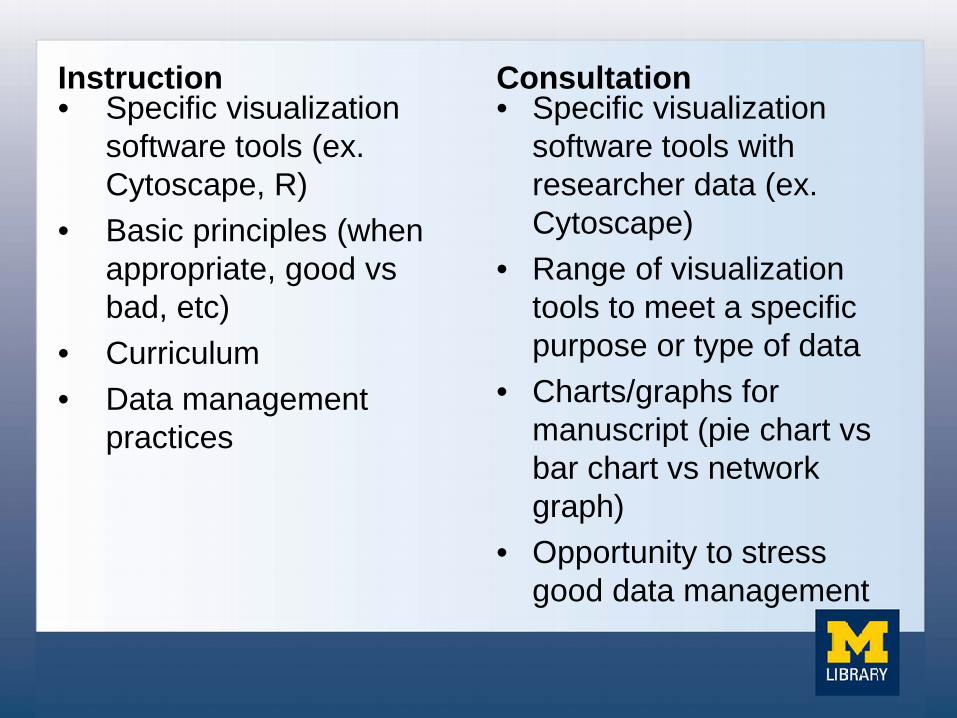
Instruction • Specific visualization
software tools (ex. Cytoscape, R)
• Basic principles (when appropriate, good vs bad, etc)
• Curriculum • Data management
practices
Consultation • Specific visualization
software tools with researcher data (ex. Cytoscape)
• Range of visualization tools to meet a specific purpose or type of data
• Charts/graphs for manuscript (pie chart vs bar chart vs network graph)
• Opportunity to stress good data management
TYPES OF VISUALIZATION Instruction/Consultation
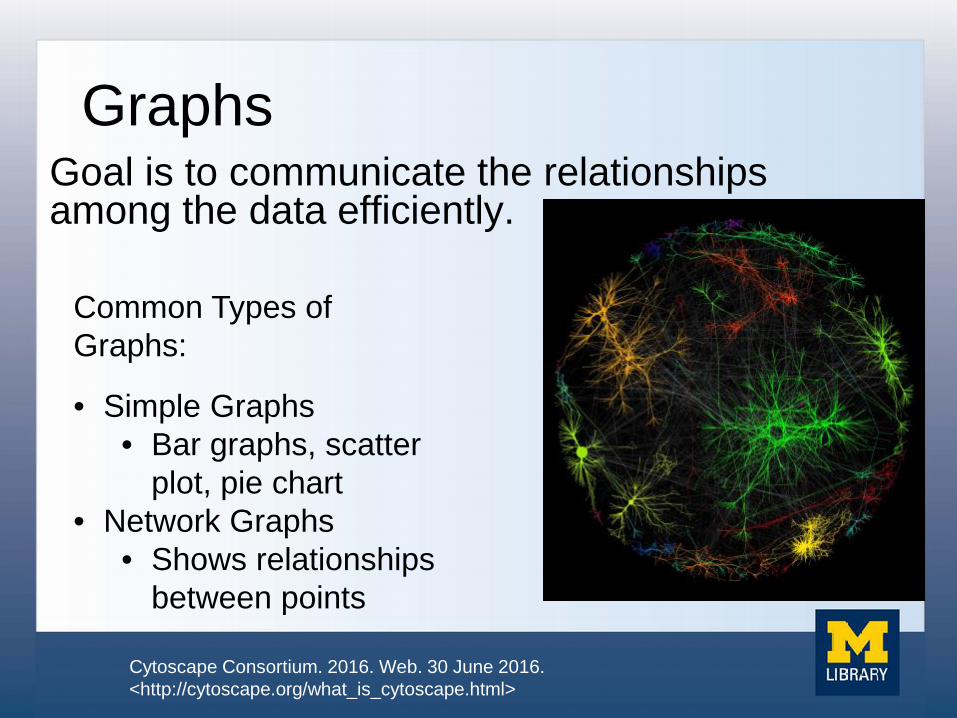
Graphs Goal is to communicate the relationships among the data efficiently.
Common Types of Graphs:
• Simple Graphs • Bar graphs, scatter
plot, pie chart • Network Graphs
• Shows relationships between points
Cytoscape Consortium. 2016. Web. 30 June 2016. <http://cytoscape.org/what_is_cytoscape.html>

http://www.albany.edu/museum/wwwmuseum/work/ lombardi/images/lombardi1.jpg
“Mark Lombardi (1951-2000) draws on the major political and financial scandals of the day to create large-scale linear diagrams that at first glance look like celestial maps….” -University Art Museum. University of Albany, State University of New York.
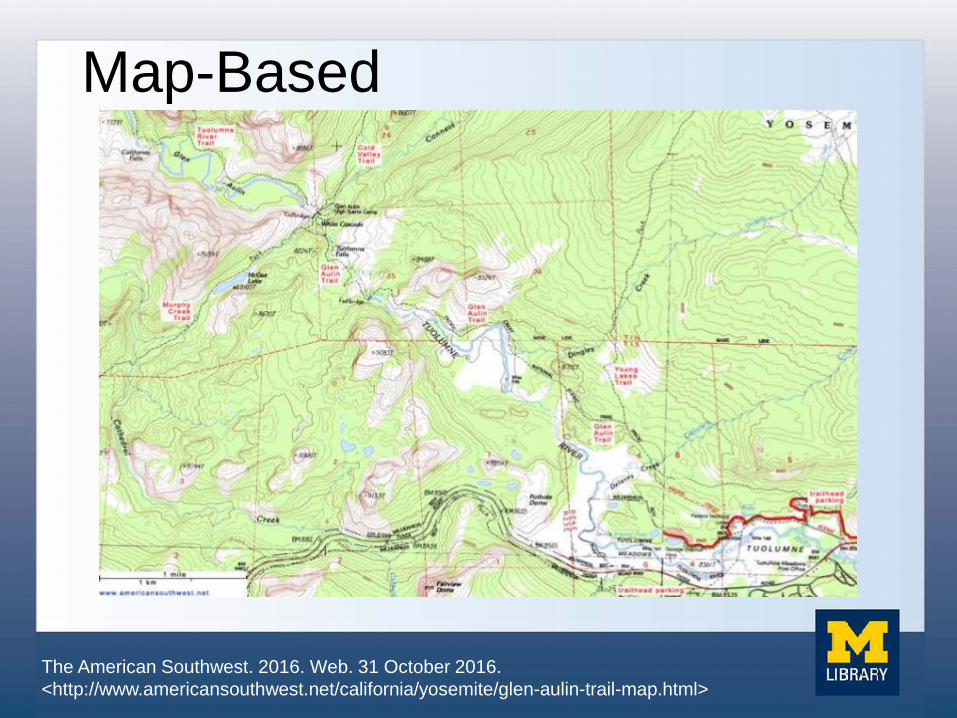
The American Southwest. 2016. Web. 31 October 2016. <http://www.americansouthwest.net/california/yosemite/glen-aulin-trail-map.html>
Map-Based
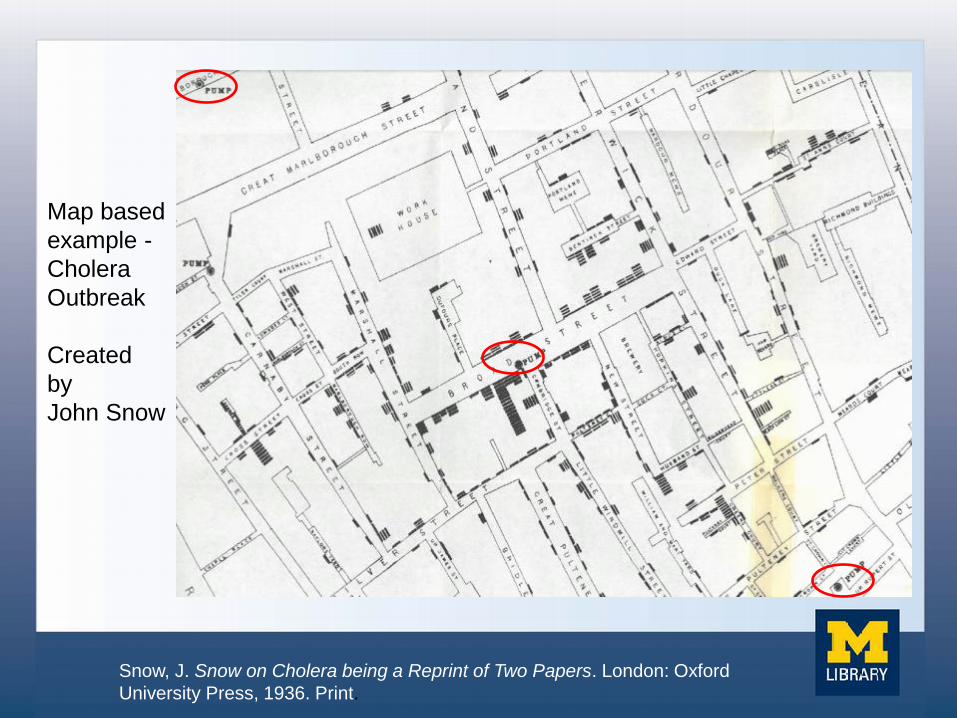
Snow, J. Snow on Cholera being a Reprint of Two Papers. London: Oxford University Press, 1936. Print.
Map based example - Cholera Outbreak Created by John Snow
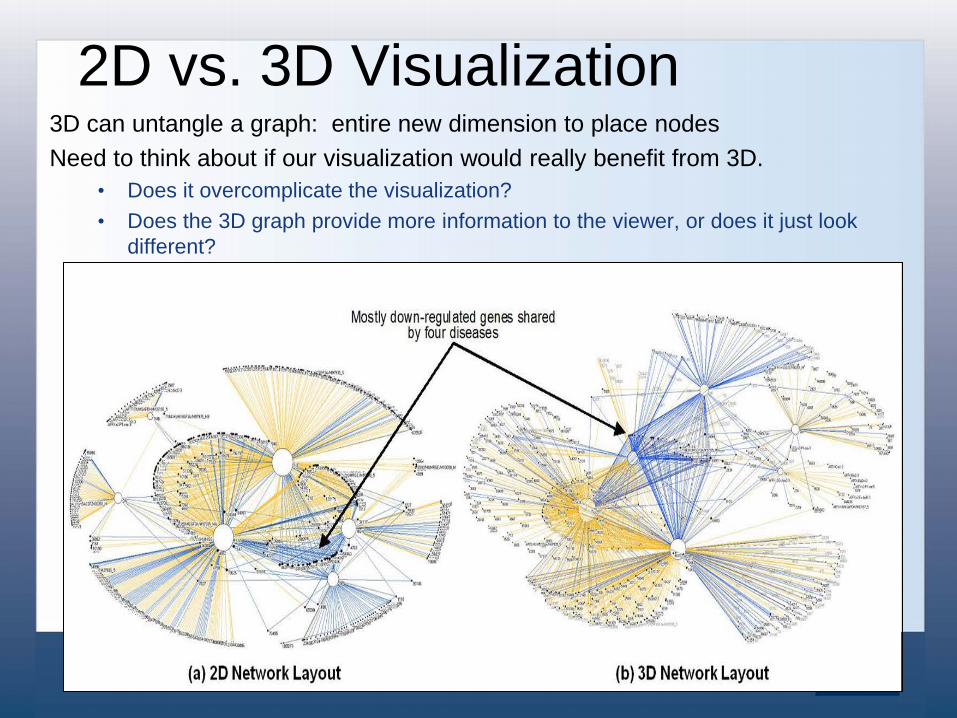
3D can untangle a graph: entire new dimension to place nodes Need to think about if our visualization would really benefit from 3D.
• Does it overcomplicate the visualization? • Does the 3D graph provide more information to the viewer, or does it just look
different?
2D vs. 3D Visualization
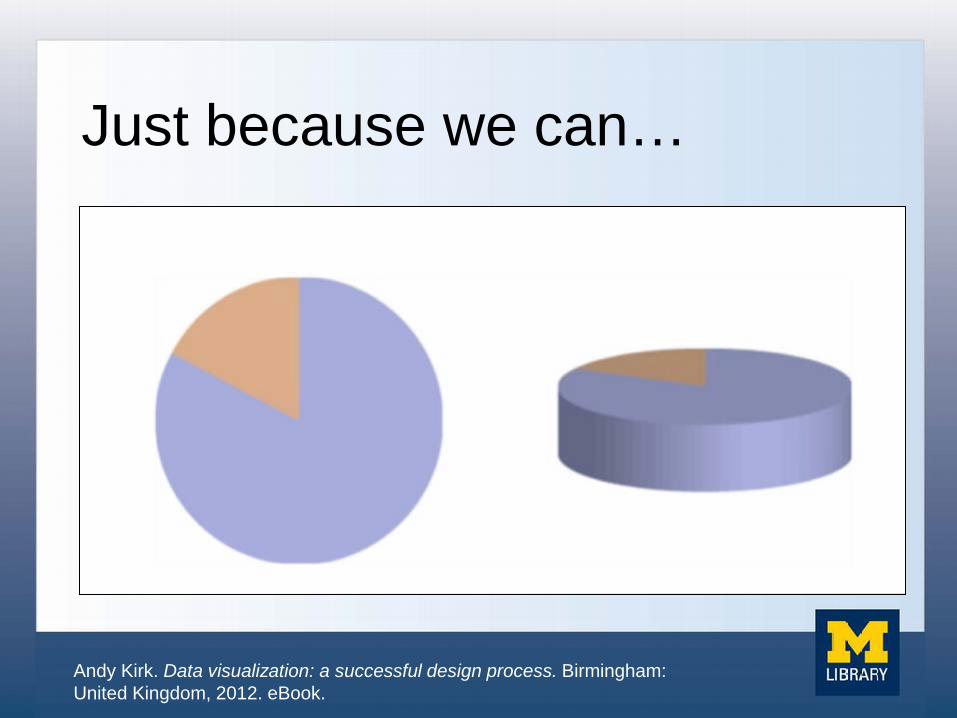
Just because we can…
Andy Kirk. Data visualization: a successful design process. Birmingham: United Kingdom, 2012. eBook.

DESIGN PRINCIPLES Instruction/Consultation
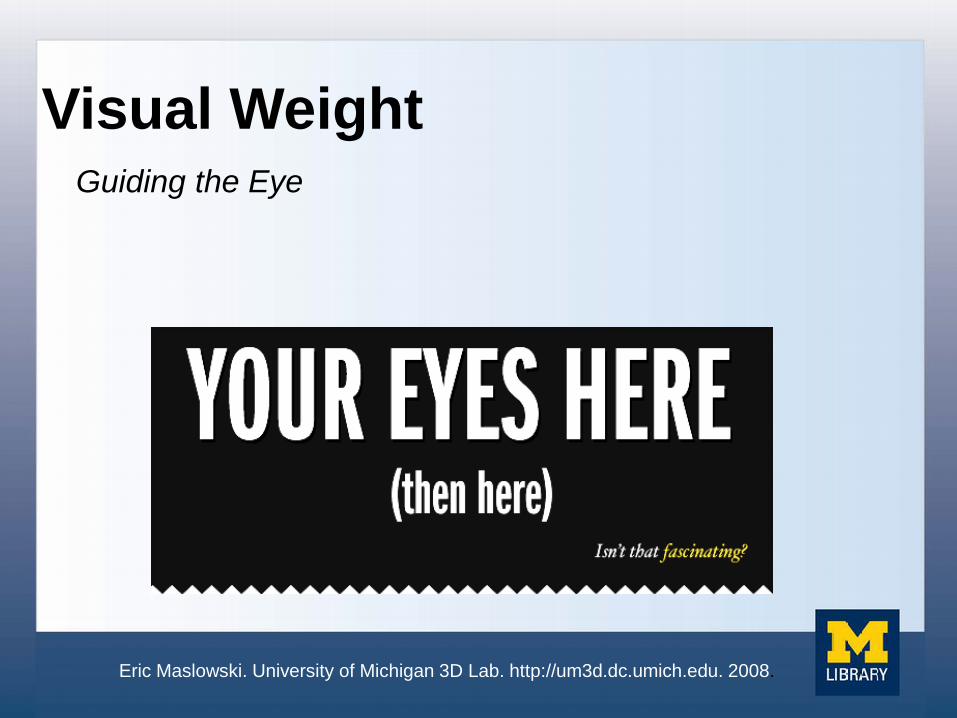
Visual Weight Guiding the Eye
Eric Maslowski. University of Michigan 3D Lab. http://um3d.dc.umich.edu. 2008.
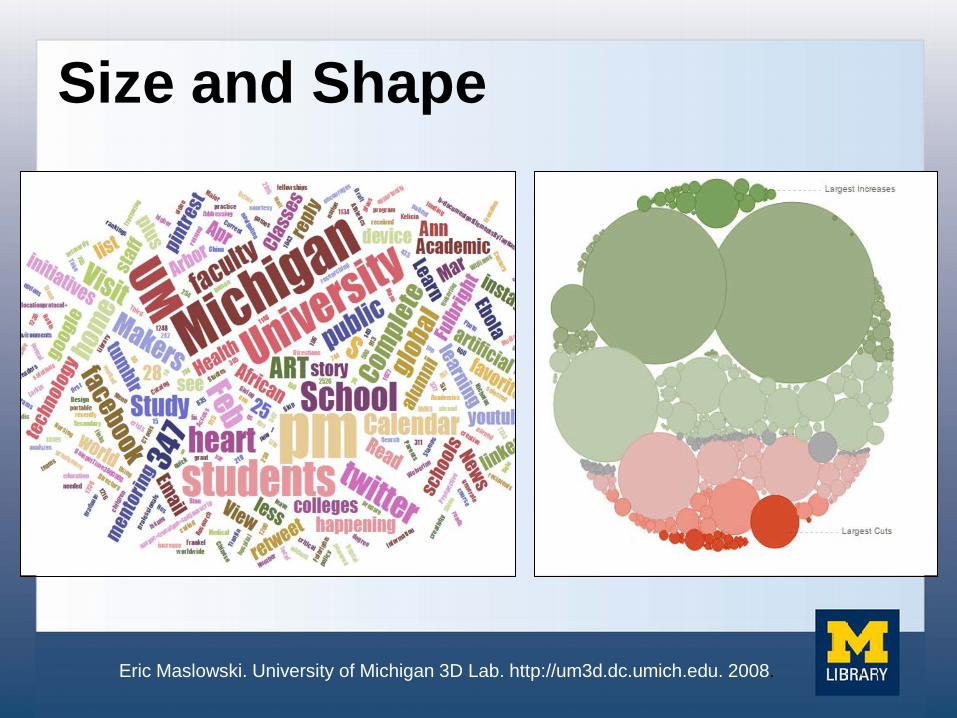
Size and Shape
Eric Maslowski. University of Michigan 3D Lab. http://um3d.dc.umich.edu. 2008.
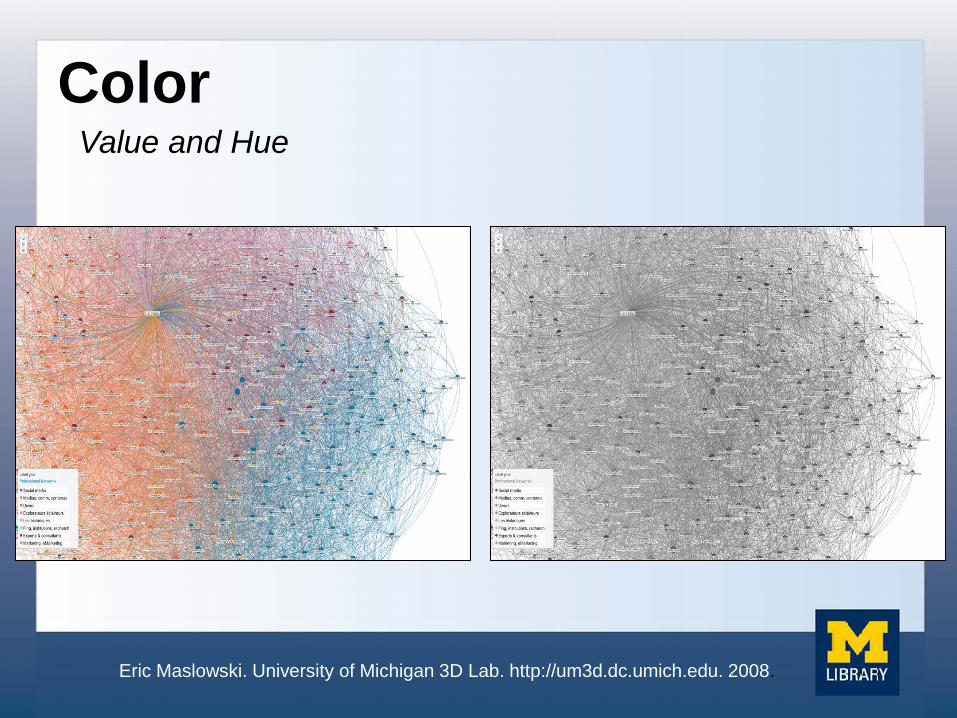
Value and Hue Color
Eric Maslowski. University of Michigan 3D Lab. http://um3d.dc.umich.edu. 2008.
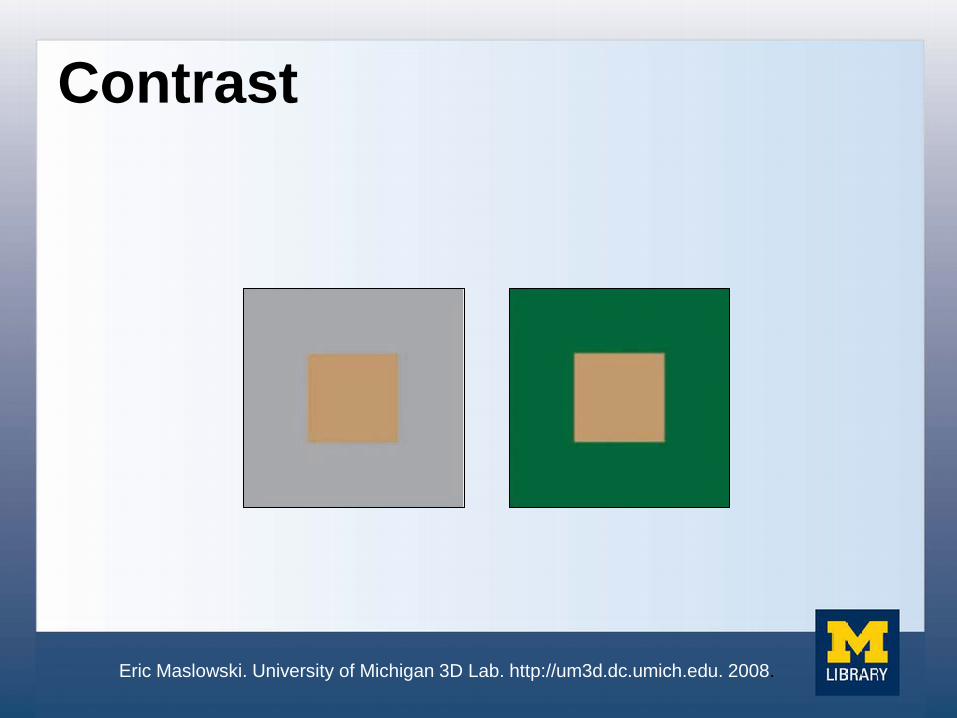
Contrast
Eric Maslowski. University of Michigan 3D Lab. http://um3d.dc.umich.edu. 2008.
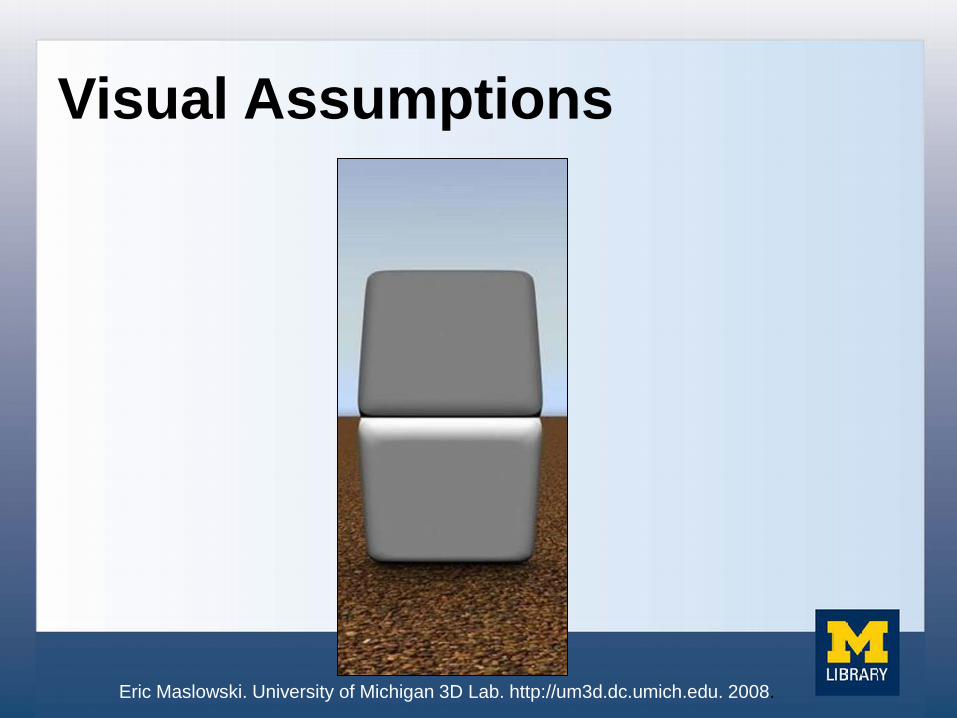
Visual Assumptions
Eric Maslowski. University of Michigan 3D Lab. http://um3d.dc.umich.edu. 2008.
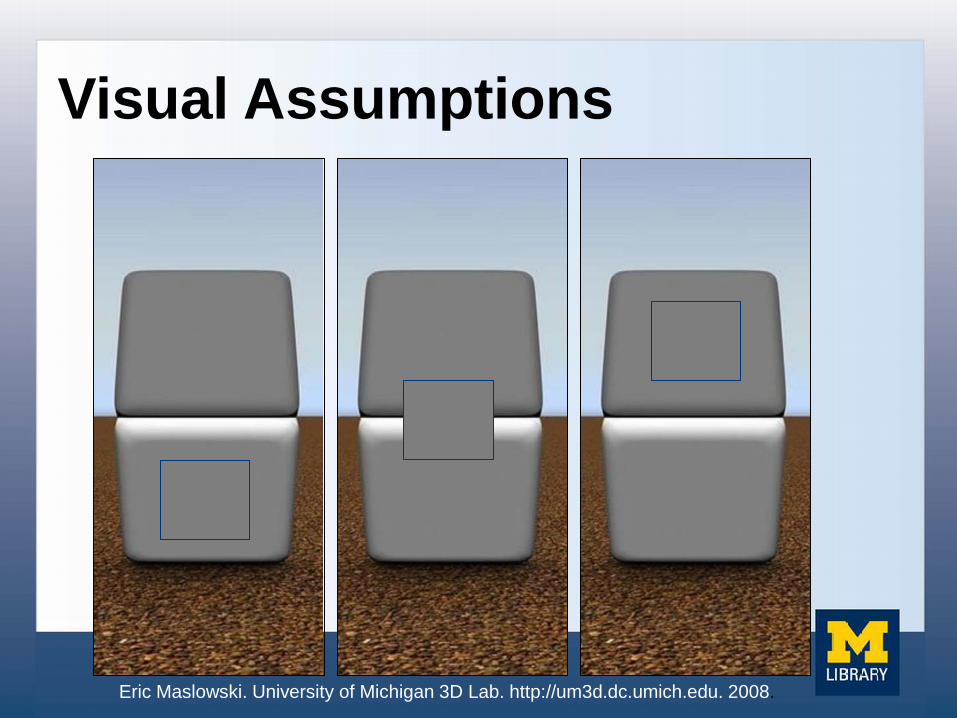
Visual Assumptions
Eric Maslowski. University of Michigan 3D Lab. http://um3d.dc.umich.edu. 2008.
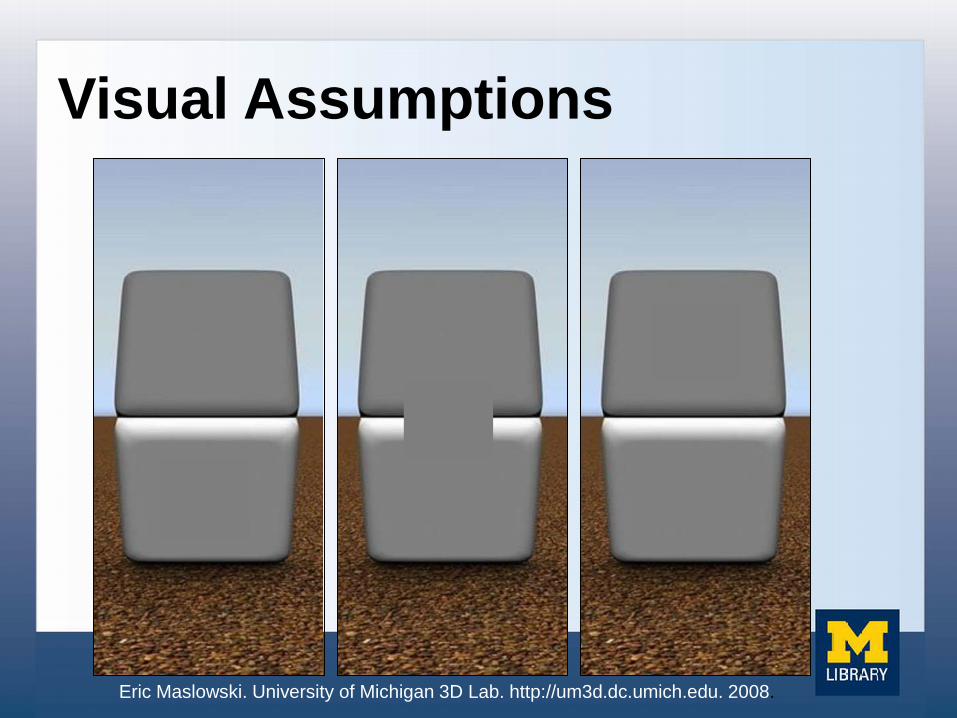
Visual Assumptions
Eric Maslowski. University of Michigan 3D Lab. http://um3d.dc.umich.edu. 2008.
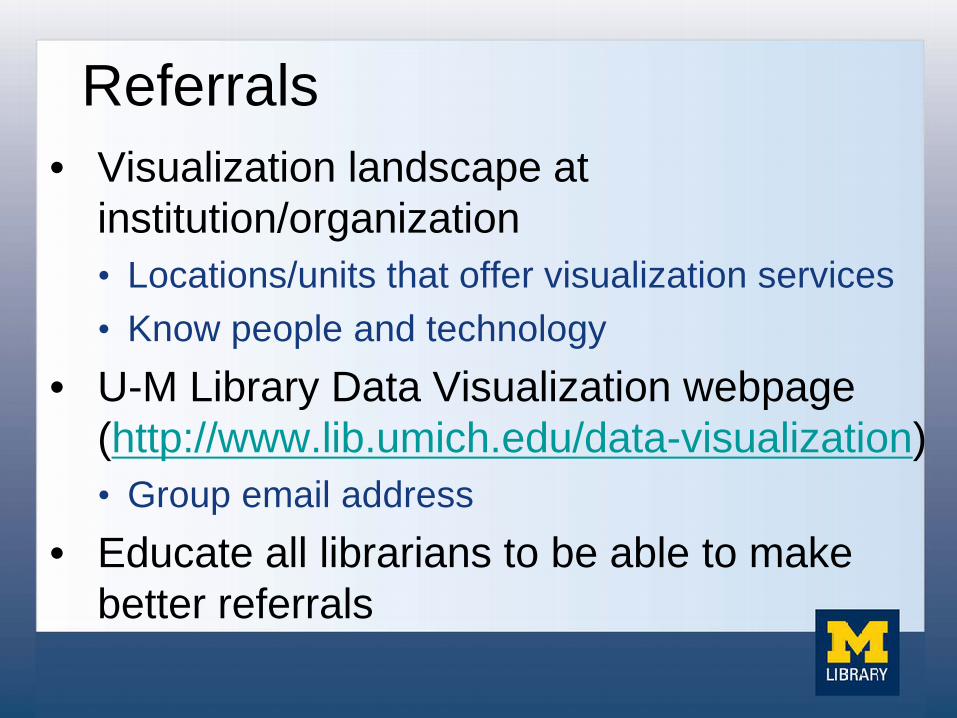
Referrals • Visualization landscape at
institution/organization • Locations/units that offer visualization services • Know people and technology
• U-M Library Data Visualization webpage (http://www.lib.umich.edu/data-visualization) • Group email address
• Educate all librarians to be able to make better referrals
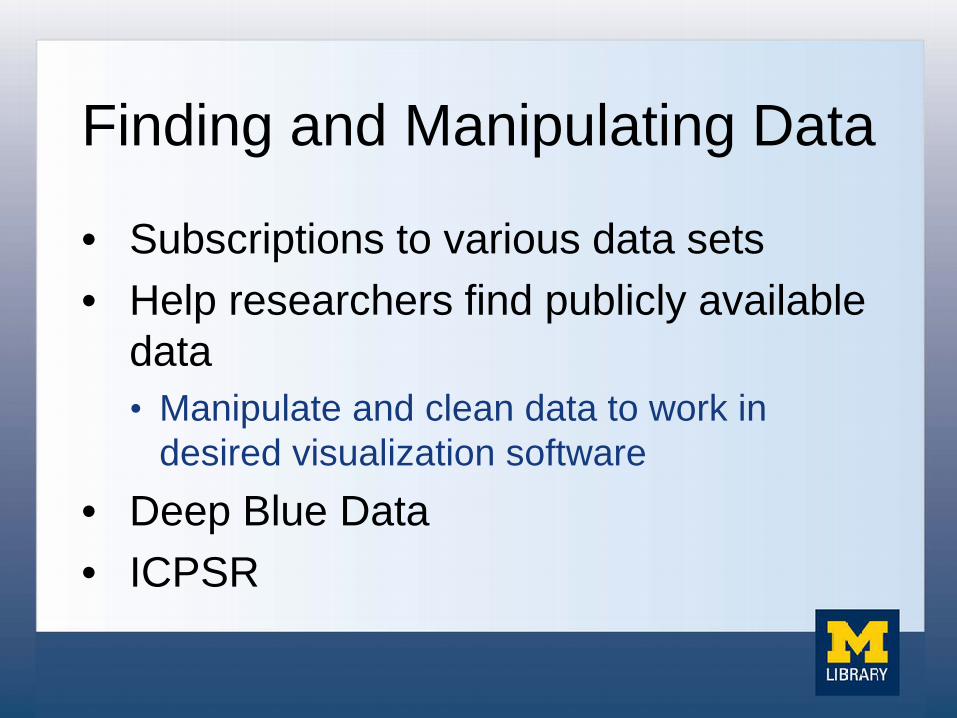
Finding and Manipulating Data
• Subscriptions to various data sets • Help researchers find publicly available
data • Manipulate and clean data to work in
desired visualization software • Deep Blue Data • ICPSR
CHALLENGES
Challenges
• Lot of visualization tools and resources • Constantly changing • Some are very complex
• Wide range of visualization types • Focus on principles; rely on others
• Making the library the go-to place for visualization services
• Resources
Acknowledgments
• Eric Maslowski - Director, Creative Applications. Co-Director, Digital Media Commons. University of Michigan
• Justin Joque - Visualization Librarian, University of Michigan
• Jean Song – Assistant Director Academic and Clinical Engagement, Taubman Health Sciences Library, University of Michigan

Marci Brandenburg [email protected]