Embed Size (px)
Citation preview
Cellulose nanofibers from white and naturally coloredcotton fibers
Eliangela de Morais Teixeira • Ana Carolina Correa •
Alexandra Manzoli • Fabio de Lima Leite •
Caue Ribeiro de Oliveira • Luiz Henrique Capparelli Mattoso
Received: 8 September 2009 / Accepted: 29 January 2010 / Published online: 12 February 2010
� Springer Science+Business Media B.V. 2010
Abstract Suspensions of white and colored nanof-
ibers were obtained by the acid hydrolysis of white
and naturally colored cotton fibers. Possible differ-
ences among them in morphology and other charac-
teristics were investigated. The original fibers were
subjected to chemical analysis (cellulose, lignin and
hemicellulose content), X-ray diffraction (XRD)
analysis, and scanning electron microscopy (SEM).
The nanofibers were analyzed with respect to yield,
elemental composition (to assess the presence of
sulfur), zeta potential, morphology (by scanning
transmission electron microscopy (STEM)) and
atomic force microscopy (AFM), crystallinity
(XRD) and thermal stability by thermogravimetric
analysis in air under dynamic and isothermal tem-
perature conditions. Morphological study of several
cotton nanofibers showed a length of 85–225 nm and
diameter of 6–18 nm. The micrographs also indicated
that there were no significant morphological differ-
ences among the nanostructures from different cotton
fibers. The main differences found were the slightly
higher yield, sulfonation effectiveness and thermal
stability under dynamic temperature conditions of the
white nanofiber. On the other hand, in isothermal
conditions at 180 �C, the colored nanofibers showed
a better thermal stability than the white.
Keywords Naturally colored cotton fibers �Colored cellulose nanofibers � AFM � STEM
Abbreviations
CW White cellulose
CB Brown cellulose
CG Green cellulose
CR Ruby cellulose
CNW White nanocellulose
CNB Brown nanocellulose
CNG Green nanocellulose
CNR Ruby nanocellulsoe
Introduction
Natural cotton fibers (Gossypium hirsutum L.) are
normally white but naturally colored cotton can be
produced by genetic breeding techniques, avoiding
E. de Morais Teixeira (&) � A. C. Correa �A. Manzoli � F. de Lima Leite � C. R. de Oliveira �L. H. C. Mattoso
National Nanotechnology Laboratory for Agribusiness
(LNNA), Embrapa Agricultural Instrumentation,
P.O. Box 741, Sao Carlos, SP 13560-970, Brazil
e-mail: [email protected]
A. C. Correa
Federal University of Sao Carlos (UFSCar),
via Washington Luiz, km 235, Monjolinho,
P.O. Box 676, Sao Carlos, SP 13565-905, Brazil
F. de Lima Leite
Federal University of Sao Carlos (UFSCar), Rodovia Joao
Leme dos Santos, km 110 (SP 264), P.O. Box: 3031,
Sorocaba, SP 18052-780, Brazil
123
Cellulose (2010) 17:595–606
DOI 10.1007/s10570-010-9403-0
the need for synthetic dyes that may pollute the
environmental and affect human health. Additionally,
the elimination of chemical dyeing from textile
manufacturing could make the product cheaper
(Zhu et al. 2006).
Colored cottons were cultivated and used as long
ago as 2300 B.C. in South and Central America
(Murthy 2001). These are regarded as inferior to
white cotton, in virtue of the lower yield, shorter and
weaker fibers and variably of the color. Hence, cotton
breeders are trying to improve these characteristics to
produce better and more productive varieties of
colored cotton (Murthy 2001; Dutt et al. 2004).
Commercially, the colored fibers gained greater
prominence after the impressive efforts made by
Sally Fox to improve the fiber quality of colored
cottons by selective breeding, resulting in colored
hybrids able to produce machine-spinnable colored
cotton (Murthy 2001). Currently, researchers have
developed the breeding program, to encompass
studies on the structure, quality, chemistry, color
measurement and standardization of colored cottons
(Rodgers et al. 2008). Applications such as ecological
textile products have been promoted by the United
States Department of Agriculture—Agricultural
Research Service (USDA-ARS) (Chen et al. 2004).
Specifically the Cotton Division National Agency for
Advancement of Agribusiness (EMBRAPA Algodao,
Brazil), has been developing novel colored cotton
cultivars in their breeding program (Rocha et al.
2008).
It has been shown experimentally that the pig-
ments in naturally colored fibers might be flavonoid
compounds, such as flavonone, flavonol and antho-
cyanidin (Xiao et al. 2007; Hua et al. 2007). The
color is controlled by a dominant gene (the genetic
factor) and environmental factors that influence
mainly the intensity of the color (De Carvalho and
dos Santos 2003; Xiao et al. 2007), but the identities
of the pigments in colored fibers are essentially
unknown yet.
Nowadays, there is growing interest in the use of
more environment-friendly materials and polymers of
natural occurrence, such as cellulose, have had a lot
of attention from those endeavoring to develop
materials, especially as reinforcement in polymer
matrices. Cellulose is a versatile polymer that can be
extracted in a nanofiber form. Needle-like cellulose
nanofibers (known as whiskers) have been studied
intensively, owing to their high performance when
used as reinforcement in polymer matrices to produce
‘‘green’’ nanocomposites (Samir et al. 2005; Bhatna-
gar and Sain 2005; Gardner et al. 2008). In brief, one
way of obtaining such nanofibers is by acid hydro-
lysis the cellulose being exposed to sulfuric acid for a
controlled period of time and temperature. This
process removes the amorphous parts of the cellulose,
leaving single and well-defined crystals in a stable
colloidal suspension and promotes the grafting of
sulfate groups on cellulose microfibril surface. The
stability of this suspension is due to the electrostatic
repulsion between the negative sulfate groups on the
surface of nanofibers (Lima and Borsali 2004;
Dufresne 2006).
The geometric properties of the nanocellulose
structures (shape, length and diameter) depend
mainly on the origin of the cellulose and the
extraction process (acid hydrolysis, shearing and
high-pressure homogenization, biosynthesis by bac-
teria or electrospinning). Several sources of cellulose
have been used to obtain cellulose nanostructures, not
necessarily needle-shaped, which have high crystal-
linity. Examples include tunicin (Angles and Duf-
resne 2000, 2001), wheat straw (Alemdar and Sain
2008), bacterial cellulose (Nakagaito et al. 2005, sisal
De Rodriguez et al. 2006; Moran et al. 2008), banana
residues (Zuluaga et al. 2007; Cherian et al. 2008),
hemp (Bhatnagar and Sain 2005) and microcrystal-
line cellulose (Wang et al. 2007b). Recently, cellu-
lose nanoparticles have been also synthesized in
spherical form (Pu et al. 2007; Zhang et al. 2007,
2008).
Conventional cotton nanocellulose obtained from
white microcrystalline fibers has been studied by
several authors (Dong et al. 1998; Orts et al. 2005;
Wang et al. 2006; Medeiros et al. 2008).
In this study, fibers and nanofibers extracted from
white and naturally colored cotton (brown, green and
ruby) were characterized in terms of chemical
composition, (content of cellulose, lignin, hemicellu-
lose and elemental analysis), zeta potential, morphol-
ogy (SEM for fibers, STEM and AFM for nanofibers),
crystallinity (XRD) and thermal stability (TG). The
original colored fibers were developed by Empresa
Brasileira de Pesquisa Agropecuaria (EMBRAPA
Algodao, Brazil).
596 Cellulose (2010) 17:595–606
123
Experimental
Materials
White (commercial type) (CW) and colored cotton
fibers were supplied by Embrapa Algodao (Campina
Grande, Paraiba, Brazil). The colored fibers employed
were: brown (CB), green (CG) and ruby (CR).
Aqueous 72 wt% sulfuric acid (Synth), 17.5 wt%
aqueous NaOH solution (Qhemis), sodium chlorite
(NaClO2, J. T. Baker) and glacial acetic acid (Synth)
were used to determine the chemical composi-
tion of the fibers. Cellulose was hydrolyzed with
6.5 M sulfuric acid (Synth) and cellulose membrane
(Sigma–Aldrich: D9402) was used to dialyze the
products.
Methods
Chemical composition of original cotton fibers
The cotton fibers were finely chopped in a knife mill,
passed through a 10-mesh sieve, dewaxed with 1:1
(v/v) ethanol:cyclohexane (Synth) for 12 h in a
soxhlet apparatus and then vigorously washed with
tap water. The dewaxed samples were dried for 12 h
at 100 �C in an air-circulating oven. The colored
cotton fibers were not discolored by this treatment.
The lignin content of the fibers was analyzed by
reaction with sulfuric acid, using a standard method
recommended in TAPPI-T222 om-88, and the holo-
cellulose (cellulose ? hemicelluloses) content was
determined as described in TAPPI T19m-54. The
a-cellulose was removed from the holocellulose by
alkali extraction and the hemicellulose content was
found by subtracting the a-cellulose part from the
holocellulose content. The average of three replicates
was calculated for each cotton fiber sample.
Preparation of the cellulose nanofibers, yield
and total sulfur content
Except for the dewaxing treatment, the cotton fibers
were used without any type of bleaching. About 5.0 g
of fibers were dispersed in 100 mL of 6.5 M sulfuric
acid at 45 �C and stirred vigorously for 75 min. After
that, 500 mL of cold distilled water was added to stop
the reaction. The sulfuric acid was partially removed
from the resulting suspension by centrifugation at
10,000 rpm for 10 min. The non reactive sulfate
groups are removed by centrifugation following by
dialysis. Them the fibers were resuspended and
dialyzed against tap water with a cellulose mem-
brane, until the pH reached 6–7. The resulting
suspension was ultrasonicated for 5 min and stored
in a refrigerator after the addition of drops of
chloroform. Nanofiber suspensions were labeled
CNW, CNB, CNG and CNR, according to the cotton
fibers used—CW, CB, CG and CR, respectively. For
elemental analysis, XRD and TG an aliquot of 25 mL
for each analysis was drying at 35 �C for 12 h in an
air-circulating oven.
The yield of cellulose nanofibers was determined
by weighing a 10 mL aliquot of the suspension after
standing overnight to dry. Yield (%) and concentra-
tion (g mL-1) were calculated from the difference
between initial and final weight.
Elemental analysis was performed mainly to
determine the total sulphur content before and after
the extraction of nanofibers. It was carried out with
EA1110-CHNS-O elemental analyzer from a CE
Instruments.
Zeta potential
Electrophoretic mobilities of aliquots of aqueous
nanocellulose suspensions (concentration equalized
to 0.005 wt%) were measured with a Malverne 3000
Zetasizer NanoZS, (Malverne Instruments, UK).
Microscopic analyses
Scanning electron microscopy The morphology of
each cotton fiber was examined under a Zeiss DSM
960 microscope. A drop of aqueous dispersed
suspension of each fiber was dried and a thin layer
(ca. 15 nm) of gold was sputtered on the surface.
Scanning transmission electron microscopy Nanofiber
samples for scanning transmission electron micro-
scopy (STEM) were examined in TecnaiTM G2 F20
equipment. The images were acquired with a bright-
field (BF) detector. A droplet of diluted suspension
was deposited on a carbon microgrid (400 mesh) and
allowed to dry. The grid was stained with a 1.5%
solution of uranyl acetate and dried at room
temperature.
Cellulose (2010) 17:595–606 597
123
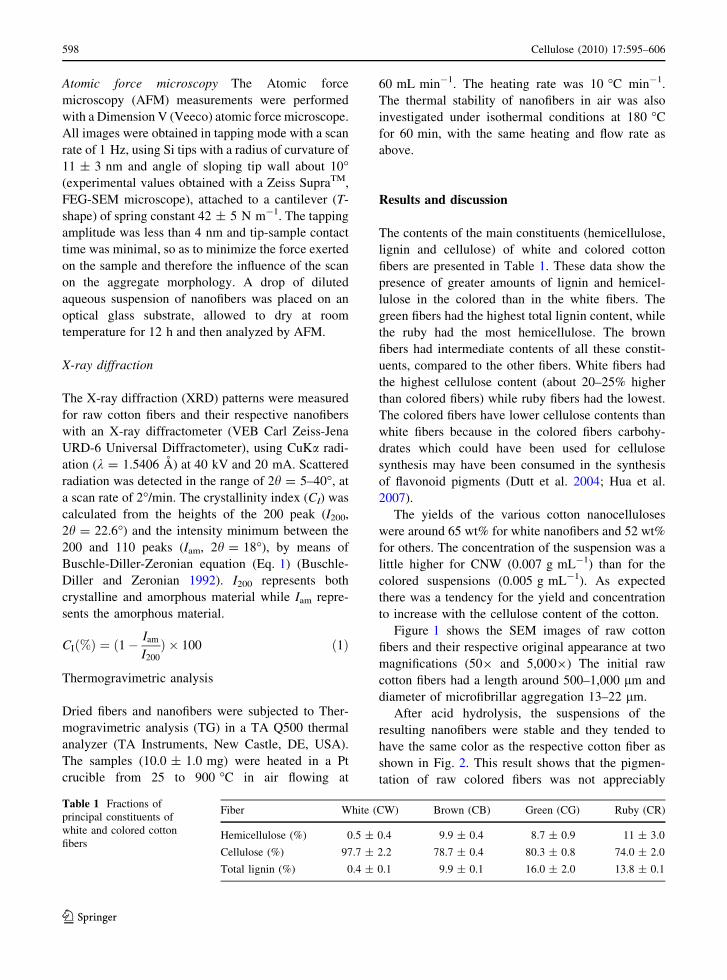
Atomic force microscopy The Atomic force
microscopy (AFM) measurements were performed
with a Dimension V (Veeco) atomic force microscope.
All images were obtained in tapping mode with a scan
rate of 1 Hz, using Si tips with a radius of curvature of
11 ± 3 nm and angle of sloping tip wall about 10�(experimental values obtained with a Zeiss SupraTM,
FEG-SEM microscope), attached to a cantilever (T-
shape) of spring constant 42 ± 5 N m-1. The tapping
amplitude was less than 4 nm and tip-sample contact
time was minimal, so as to minimize the force exerted
on the sample and therefore the influence of the scan
on the aggregate morphology. A drop of diluted
aqueous suspension of nanofibers was placed on an
optical glass substrate, allowed to dry at room
temperature for 12 h and then analyzed by AFM.
X-ray diffraction
The X-ray diffraction (XRD) patterns were measured
for raw cotton fibers and their respective nanofibers
with an X-ray diffractometer (VEB Carl Zeiss-Jena
URD-6 Universal Diffractometer), using CuKa radi-
ation (k = 1.5406 A) at 40 kV and 20 mA. Scattered
radiation was detected in the range of 2h = 5–40�, at
a scan rate of 2�/min. The crystallinity index (CI) was
calculated from the heights of the 200 peak (I200,
2h = 22.6�) and the intensity minimum between the
200 and 110 peaks (Iam, 2h = 18�), by means of
Buschle-Diller-Zeronian equation (Eq. 1) (Buschle-
Diller and Zeronian 1992). I200 represents both
crystalline and amorphous material while Iam repre-
sents the amorphous material.
CIð%Þ ¼ ð1�Iam
I200
Þ � 100 ð1Þ
Thermogravimetric analysis
Dried fibers and nanofibers were subjected to Ther-
mogravimetric analysis (TG) in a TA Q500 thermal
analyzer (TA Instruments, New Castle, DE, USA).
The samples (10.0 ± 1.0 mg) were heated in a Pt
crucible from 25 to 900 �C in air flowing at
60 mL min-1. The heating rate was 10 �C min-1.
The thermal stability of nanofibers in air was also
investigated under isothermal conditions at 180 �C
for 60 min, with the same heating and flow rate as
above.
Results and discussion
The contents of the main constituents (hemicellulose,
lignin and cellulose) of white and colored cotton
fibers are presented in Table 1. These data show the
presence of greater amounts of lignin and hemicel-
lulose in the colored than in the white fibers. The
green fibers had the highest total lignin content, while
the ruby had the most hemicellulose. The brown
fibers had intermediate contents of all these constit-
uents, compared to the other fibers. White fibers had
the highest cellulose content (about 20–25% higher
than colored fibers) while ruby fibers had the lowest.
The colored fibers have lower cellulose contents than
white fibers because in the colored fibers carbohy-
drates which could have been used for cellulose
synthesis may have been consumed in the synthesis
of flavonoid pigments (Dutt et al. 2004; Hua et al.
2007).
The yields of the various cotton nanocelluloses
were around 65 wt% for white nanofibers and 52 wt%
for others. The concentration of the suspension was a
little higher for CNW (0.007 g mL-1) than for the
colored suspensions (0.005 g mL-1). As expected
there was a tendency for the yield and concentration
to increase with the cellulose content of the cotton.
Figure 1 shows the SEM images of raw cotton
fibers and their respective original appearance at two
magnifications (509 and 5,0009) The initial raw
cotton fibers had a length around 500–1,000 lm and
diameter of microfibrillar aggregation 13–22 lm.
After acid hydrolysis, the suspensions of the
resulting nanofibers were stable and they tended to
have the same color as the respective cotton fiber as
shown in Fig. 2. This result shows that the pigmen-
tation of raw colored fibers was not appreciably
Table 1 Fractions of
principal constituents of
white and colored cotton
fibers
Fiber White (CW) Brown (CB) Green (CG) Ruby (CR)
Hemicellulose (%) 0.5 ± 0.4 9.9 ± 0.4 8.7 ± 0.9 11 ± 3.0
Cellulose (%) 97.7 ± 2.2 78.7 ± 0.4 80.3 ± 0.8 74.0 ± 2.0
Total lignin (%) 0.4 ± 0.1 9.9 ± 0.1 16.0 ± 2.0 13.8 ± 0.1
598 Cellulose (2010) 17:595–606
123
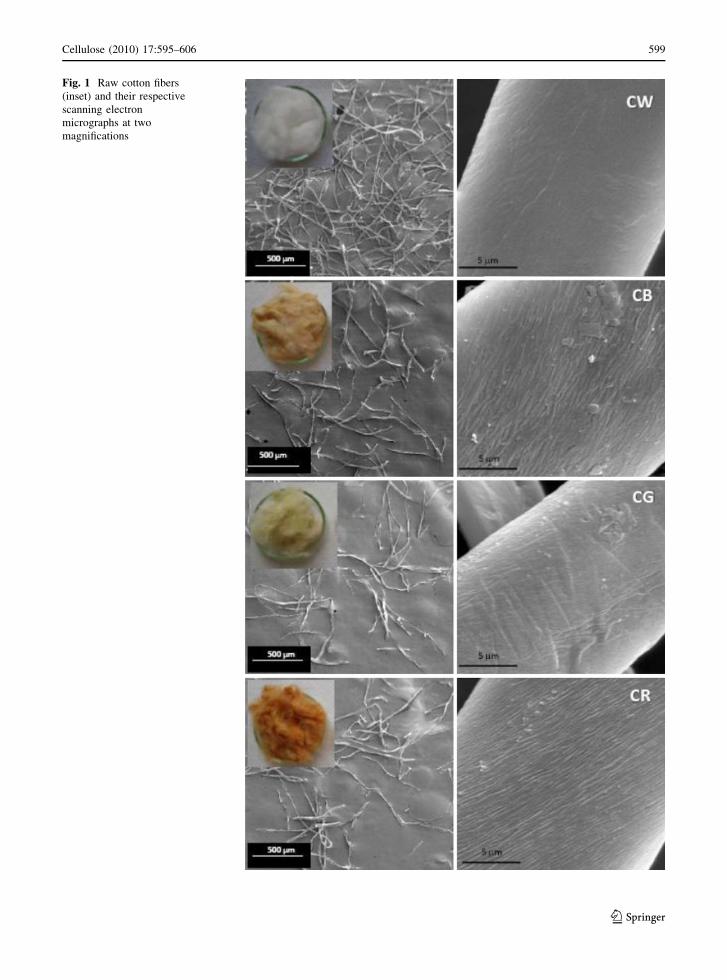
Fig. 1 Raw cotton fibers
(inset) and their respective
scanning electron
micrographs at two
magnifications
Cellulose (2010) 17:595–606 599
123
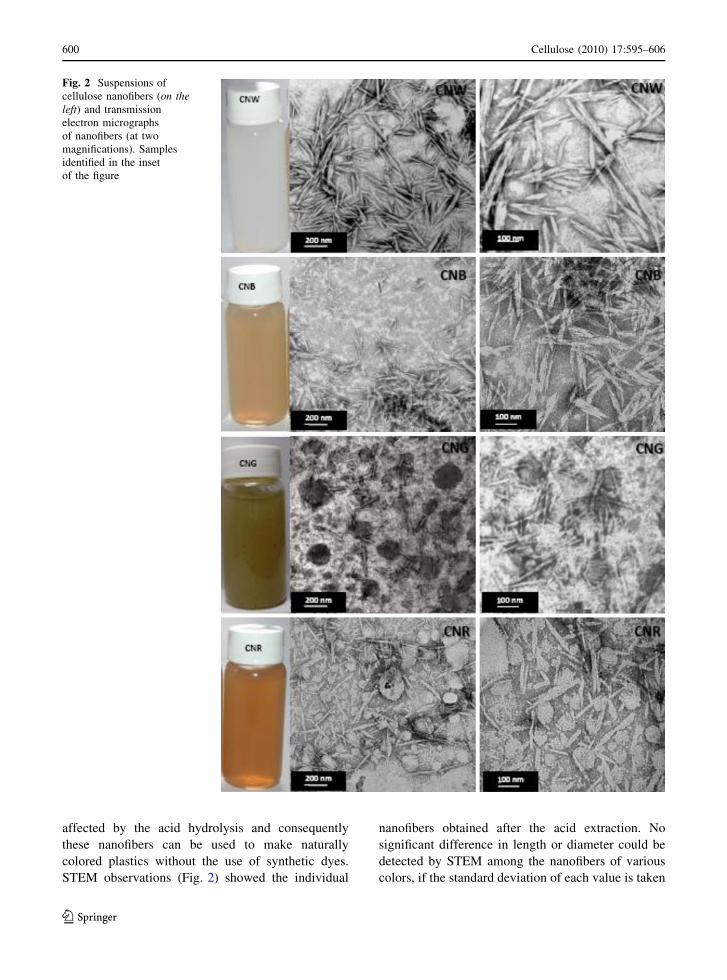
affected by the acid hydrolysis and consequently
these nanofibers can be used to make naturally
colored plastics without the use of synthetic dyes.
STEM observations (Fig. 2) showed the individual
nanofibers obtained after the acid extraction. No
significant difference in length or diameter could be
detected by STEM among the nanofibers of various
colors, if the standard deviation of each value is taken
Fig. 2 Suspensions of
cellulose nanofibers (on theleft) and transmission
electron micrographs
of nanofibers (at two
magnifications). Samples
identified in the inset
of the figure
600 Cellulose (2010) 17:595–606
123
into account (Table 2). These dimensions were
calculated with the ImageJ software from about 100
nanofibers. These values are consistent with those
obtained for white cotton nanofibers in the literature
(Dong et al. 1998; Dufresne 2006).
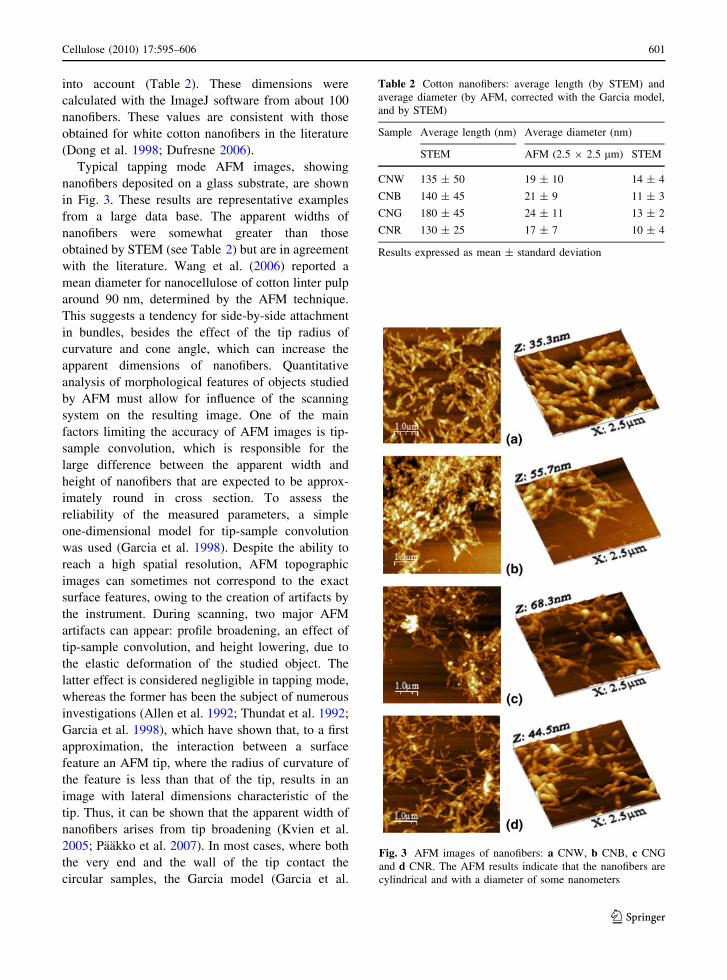
Typical tapping mode AFM images, showing
nanofibers deposited on a glass substrate, are shown
in Fig. 3. These results are representative examples
from a large data base. The apparent widths of
nanofibers were somewhat greater than those
obtained by STEM (see Table 2) but are in agreement
with the literature. Wang et al. (2006) reported a
mean diameter for nanocellulose of cotton linter pulp
around 90 nm, determined by the AFM technique.
This suggests a tendency for side-by-side attachment
in bundles, besides the effect of the tip radius of
curvature and cone angle, which can increase the
apparent dimensions of nanofibers. Quantitative
analysis of morphological features of objects studied
by AFM must allow for influence of the scanning
system on the resulting image. One of the main
factors limiting the accuracy of AFM images is tip-
sample convolution, which is responsible for the
large difference between the apparent width and
height of nanofibers that are expected to be approx-
imately round in cross section. To assess the
reliability of the measured parameters, a simple
one-dimensional model for tip-sample convolution
was used (Garcia et al. 1998). Despite the ability to
reach a high spatial resolution, AFM topographic
images can sometimes not correspond to the exact
surface features, owing to the creation of artifacts by
the instrument. During scanning, two major AFM
artifacts can appear: profile broadening, an effect of
tip-sample convolution, and height lowering, due to
the elastic deformation of the studied object. The
latter effect is considered negligible in tapping mode,
whereas the former has been the subject of numerous
investigations (Allen et al. 1992; Thundat et al. 1992;
Garcia et al. 1998), which have shown that, to a first
approximation, the interaction between a surface
feature an AFM tip, where the radius of curvature of
the feature is less than that of the tip, results in an
image with lateral dimensions characteristic of the
tip. Thus, it can be shown that the apparent width of
nanofibers arises from tip broadening (Kvien et al.
2005; Paakko et al. 2007). In most cases, where both
the very end and the wall of the tip contact the
circular samples, the Garcia model (Garcia et al.
Table 2 Cotton nanofibers: average length (by STEM) and
average diameter (by AFM, corrected with the Garcia model,
and by STEM)
Sample Average length (nm) Average diameter (nm)
STEM AFM (2.5 9 2.5 lm) STEM
CNW 135 ± 50 19 ± 10 14 ± 4
CNB 140 ± 45 21 ± 9 11 ± 3
CNG 180 ± 45 24 ± 11 13 ± 2
CNR 130 ± 25 17 ± 7 10 ± 4
Results expressed as mean ± standard deviation
Fig. 3 AFM images of nanofibers: a CNW, b CNB, c CNG
and d CNR. The AFM results indicate that the nanofibers are
cylindrical and with a diameter of some nanometers
Cellulose (2010) 17:595–606 601
123
1998) should be applied. For an ordinary AFM tip
with a radius of 11 ± 3 nm, the average dimensions
obtained are presented in Table 2. The results
compare well with those obtained by STEM.
The total contents of sulfur, nitrogen, carbon and
hydrogen and the zeta potential (estimated as surface
charge) are shown in Table 3. The total sulfur content
and zeta potential were higher for CNW than for the
colored nanofibers, as were the yield results presented
previously. This indicates a greater incorporation of
sulfate groups into the cellulose chains of the white
fibers, since they have higher cellulose content
(Table 1).
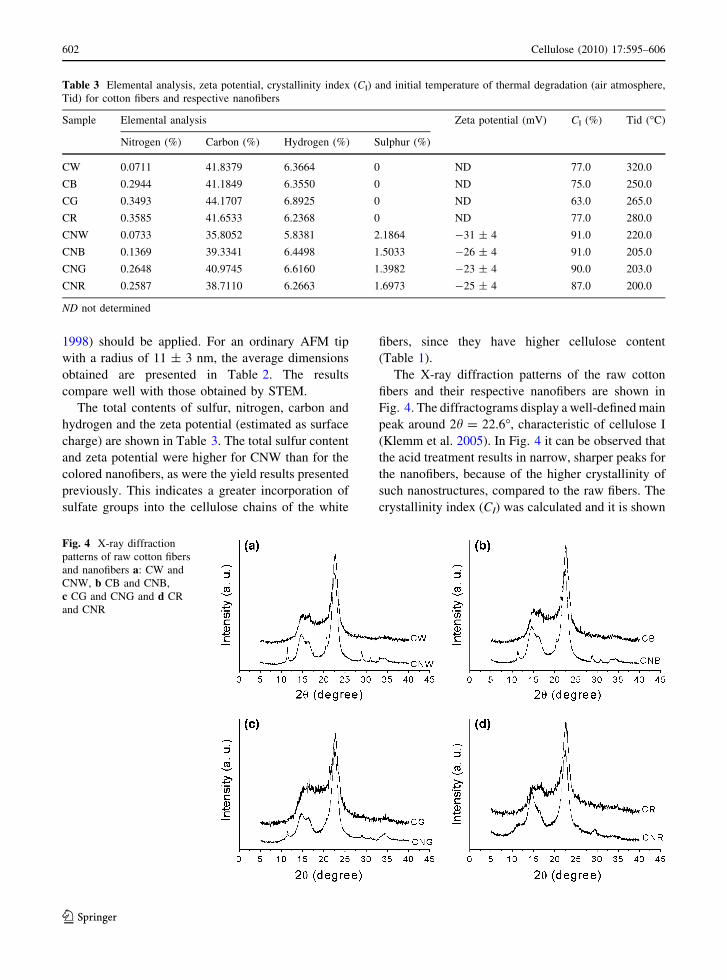
The X-ray diffraction patterns of the raw cotton
fibers and their respective nanofibers are shown in
Fig. 4. The diffractograms display a well-defined main
peak around 2h = 22.6�, characteristic of cellulose I
(Klemm et al. 2005). In Fig. 4 it can be observed that
the acid treatment results in narrow, sharper peaks for
the nanofibers, because of the higher crystallinity of
such nanostructures, compared to the raw fibers. The
crystallinity index (CI) was calculated and it is shown
Table 3 Elemental analysis, zeta potential, crystallinity index (CI) and initial temperature of thermal degradation (air atmosphere,
Tid) for cotton fibers and respective nanofibers
Sample Elemental analysis Zeta potential (mV) CI (%) Tid (�C)
Nitrogen (%) Carbon (%) Hydrogen (%) Sulphur (%)
CW 0.0711 41.8379 6.3664 0 ND 77.0 320.0
CB 0.2944 41.1849 6.3550 0 ND 75.0 250.0
CG 0.3493 44.1707 6.8925 0 ND 63.0 265.0
CR 0.3585 41.6533 6.2368 0 ND 77.0 280.0
CNW 0.0733 35.8052 5.8381 2.1864 -31 ± 4 91.0 220.0
CNB 0.1369 39.3341 6.4498 1.5033 -26 ± 4 91.0 205.0
CNG 0.2648 40.9745 6.6160 1.3982 -23 ± 4 90.0 203.0
CNR 0.2587 38.7110 6.2663 1.6973 -25 ± 4 87.0 200.0
ND not determined
Fig. 4 X-ray diffraction
patterns of raw cotton fibers
and nanofibers a: CW and
CNW, b CB and CNB,
c CG and CNG and d CR
and CNR
602 Cellulose (2010) 17:595–606
123
in Table 3, where it is seen that every cotton nanofiber
had markedly higher crystallinity than its raw cotton
fiber. The CI values of nanofibers were 18% (CNW),
21% (CNB), 43% (CNG) and 13% (CNR) higher than
those of their fibers. The increase in crystallinity after
acid extraction of the cotton fibers is due to the
different arrangements of the glucose chains in
cellulose molecules (Wang et al. 2007b) after removal
of the amorphous phase.
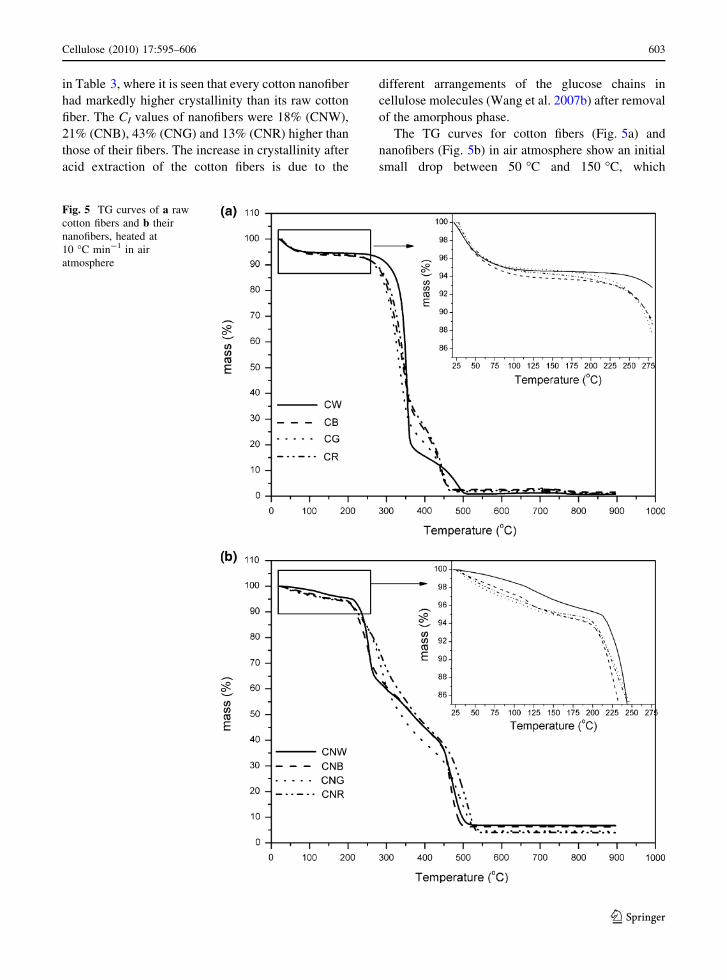
The TG curves for cotton fibers (Fig. 5a) and
nanofibers (Fig. 5b) in air atmosphere show an initial
small drop between 50 �C and 150 �C, which
Fig. 5 TG curves of a raw
cotton fibers and b their
nanofibers, heated at
10 �C min-1 in air
atmosphere
Cellulose (2010) 17:595–606 603
123
corresponds to a mass loss of approximately 5%
absorbed moisture. The initial temperatures of thermal
degradation (Tid) of the samples are presented in
Table 3 and were attributed to cellulose depolymer-
isation. In this step, the thermal degradation of
nanofibers proceeded at lower temperatures than their
respective raw cotton fiber. According to Roman and
Winter (2004) sulfuric acid hydrolysis diminishes the
thermostability of cellulose crystals. This can be
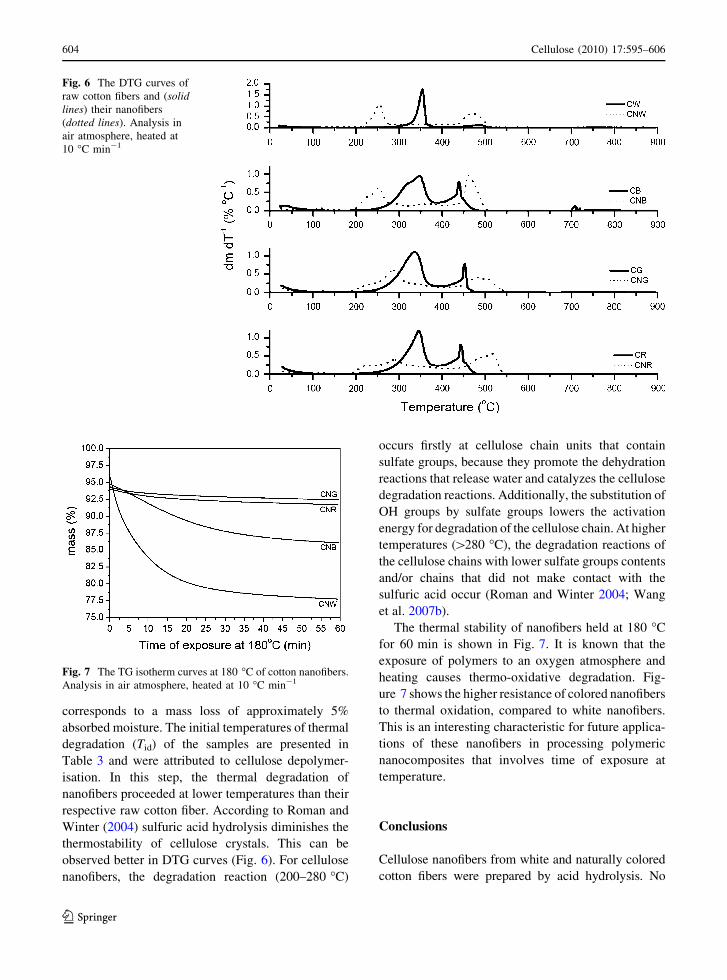
observed better in DTG curves (Fig. 6). For cellulose
nanofibers, the degradation reaction (200–280 �C)
occurs firstly at cellulose chain units that contain
sulfate groups, because they promote the dehydration
reactions that release water and catalyzes the cellulose
degradation reactions. Additionally, the substitution of
OH groups by sulfate groups lowers the activation
energy for degradation of the cellulose chain. At higher
temperatures ([280 �C), the degradation reactions of
the cellulose chains with lower sulfate groups contents
and/or chains that did not make contact with the
sulfuric acid occur (Roman and Winter 2004; Wang
et al. 2007b).
The thermal stability of nanofibers held at 180 �C
for 60 min is shown in Fig. 7. It is known that the
exposure of polymers to an oxygen atmosphere and
heating causes thermo-oxidative degradation. Fig-
ure 7 shows the higher resistance of colored nanofibers
to thermal oxidation, compared to white nanofibers.
This is an interesting characteristic for future applica-
tions of these nanofibers in processing polymeric
nanocomposites that involves time of exposure at
temperature.
Conclusions
Cellulose nanofibers from white and naturally colored
cotton fibers were prepared by acid hydrolysis. No
Fig. 6 The DTG curves of
raw cotton fibers and (solidlines) their nanofibers
(dotted lines). Analysis in
air atmosphere, heated at
10 �C min-1
Fig. 7 The TG isotherm curves at 180 �C of cotton nanofibers.
Analysis in air atmosphere, heated at 10 �C min-1
604 Cellulose (2010) 17:595–606
123
significant morphological differences in shape and size
were observed among them and between those already
observed by other researching in cotton nanofibers.
STEM and AFM analyses revealed that the nanofibers
had a length of the 85–225 nm and diameter of 6–
18 nm (by STEM measures). The nanofibers retained
their original color even after acid extraction, giving
colored suspensions in water. This characteristic was an
interesting point because we obtain nanofiber of
cellulose without pretreatment by bleaching and main-
tenance of the color of the suspensions after the
extraction. In this way, these colored nanofiber sus-
pensions could be tested as reinforcement for polymer
matrices, with the aim of making naturally colored
plastic products without the use of synthetic dyes. The
main differences found were the higher extraction
yield, sulfonation efficiency and initial degradation
temperature of the white nanofiber under dynamic
conditions of temperature. However, the colored
nanofibers were thermally more stable in isothermal
oxidizing conditions at 180 �C than white nanofibers.
Acknowledgments The authors gratefully acknowledge the
supply of cotton fiber samples by Dr. Odilon R. R. F. Silva and
Dr. Luiz P. de Carvalho (Embrapa Algodao, Brazil) and financial
support provided by FAPESP (Process No. 07/50863-4), FINEP,
CNPq and EMBRAPA.
References
Alemdar A, Sain M (2008) Isolation and characterization of
nanofibers from agricultural residues—Wheat straw and
soy hulls. Bioresour Technol 99:1664–1671
Allen MJ, Hud NV, Balooch M, Tench RJ, Siekhaus WJ,
Balhorn R (1992) Tip-radius-induced artifacts in AFM
images of protamine-complexed DNA fibers. Ultrami-
croscopy 42:1095–1100
Angles MN, Dufresne A (2000) Plasticized starch/tunicin
whiskers nanocomposites. 1. Structural analysis. Macro-
molecules 33:8344–8353
Angles MN, Dufresne A (2001) Plasticized starch/tunicin
whiskers nanocomposites materials. 2. Mechanical
behavior. Macromolecules 34:2921–2931
Bhatnagar A, Sain M (2005) Processing of cellulose nanofi-
bers-reinforced composites. J Reinf Plas Compos 24:
1259–1268
Buschle-Diller G, Zeronian SH (1992) Enhancing the reactivity
and strength of cotton fibers. J Appl Polym Sci 45:967–979
Carvalho LP, Dos Santos JW (2003) Respostas correlacionadas
do algodoeiro com a selecao para a coloracao da fibra.
Pesq Agropec Bras 38:79–83
Chen Y, Sun L, Cui X, Calamari Jr TA, Kimmel LB, Parikh
DV (2004) Naturally colored cotton for geocomposites.
In: Processing of Beltwide Cotton Conference, p 2750
Cherian BM, Pothan LA, Nguyen-Chung T, Mennig G, Kott-
aisamy M, Thomas S (2008) A novel method for the syn-
thesis of cellulose nanofibril whiskers from banana fibers
and characterization. J Agric Food Chem 56:5617–5627
De Rodriguez NLG, Thielemans W, Dufresne A (2006) Sisal
cellulose whiskers reinforced polyvinyl acetate nano-
composites. Cellulose 13:261–270
Dong XM, Revol J-F, Gray DG (1998) Effect of microcrys-
tallite preparation conditions on the formation of colloid
crystal of cellulose. Cellulose 5:19–32
Dufresne A (2006) Comparing the mechanical properties of
high performances polymer nanocomposites from bio-
logical sources. J Nanosci Nanotechnol 6:322–330
Dutt Y, Wang XD, Zhu YG, Li YY (2004) Breeding for high
yield and fibre quality in coloured cotton. Plant Breed
123:141–151
Garcia VJ, Martinez L, Briceno-Valero JM, Schilling CH
(1998) Dimensional Metrology of nanometric spherical
particles using AFM: II, application of model-tapping
mode. Probe Microsc 1:117–125
Gardner DJ, Oporto GS, Mills R, Samir MASA (2008)
Adhesion and surface issues in cellulose and nanocellu-
lose. J Adhesion Sci Technol 22:545–567
Hua S, Wang X, Yuan S, Shao M, Zhao X, Zhu S, Jiang L
(2007) Characterization of pigmentation and cellulose
synthesis in colored cotton fibers. Crop Sci 47:1–7
Klemm D, Heublein B, Fink HP, Bohn A (2005) Cellulose:
fascinating biopolymer and sustainable raw material.
Angew Chem Int Ed 44:2–37
Kvien I, Tanem BS, Oksman K (2005) Characterization of
cellulose whiskers and their nanocomposites by atomic
force and electron microscopy. Biomacromolecules
6:3160–3163
Lima MMS, Borsali R (2004) Rodlike cellulose microcrystals:
structure, properties, and applications. Macromol Rapid
Commun 25:771–787
Medeiros E, Mattoso LHC, Bernades-Filho R, Wood WJO
(2008) Self-assembled films of cellulose nanofibrils and
poly (o-ethoxyaniline). Colloid Polym Sci 286:1265–1272
Moran JI, Alvarez VA, Cyras VP, Vazquez A (2008) Extrac-
tion of cellulose and preparation of nanocellulose from
sisal fibers. Cellulose 15:149–159
Murthy MSS (2001) Never say dye: the story of coloured
cotton. Resonance 6:29–35
Nakagaito AN, Iwamoto S, Yano H (2005) Bacterial cellulose:
the ultimate nano-scalar cellulose morphology for the
production of high-strength composites. Appl Phys A Mat
Mater Sci Process 80:93–97
Orts WJ, Shey J, Iman SH, Glenn GM, Guttman ME, Revol J-F
(2005) Application of cellulose microfibrils in polymer
nanocomposites. J Polym Environ 13:301–306
Paakko M, Ankerfors M, Kosonen H, Nykanen A, Ahola S,
Osterberg M, Ruokolainen J, Laine J, Larsson PT, Ikkala
O, Lindstrom T (2007) Enzymatic hydrolysis combined
with mechanical shearing and high-pressure. Biomacro-
molecules 8:1934–1941
Pu YQ, Zhang JG, Elder T, Deng Y, Gatenholm P, Ragauskas
AJ (2007) Investigation into nanocellulosics versus acacia
reinforced acrylic films. Compos Part B-Eng 38:360–366
Rocha MS, Carvalho JMFC, Mata MERMC, Lopes KP (2008)
Inducao de superbrotamento e regeneracao de plantas in
Cellulose (2010) 17:595–606 605
123
vitro, nas cultivares de algodao colorido. R Bras Eng
Agric Ambiental 12:503–506
Rodgers J, Thibodeaux D, Cui X, Martin V, Watson M,
Knowlton J (2008) Instrumental and operational impacts
on spectrophotometer color measurements. J Cotton Sci
12:287–297
Roman M, Winter WT (2004) Effect of sulfate groups from
sulfuric acid hydrolysis on the thermal degradation
behavior of bacterial cellulose. Biomacromolecules
5:1671–1677
Samir MASA, Alloin F, Dufresne A (2005) Review of recent
research into cellulosic whiskers, their properties and their
application in nanocomposite field source. Biomacro-
molecules 6:612–626
Thundat T, Zheng X-Y, Sharp SI, Allison DP, Warmack BJ,
Joy DC, Ferrell TL (1992) Calibration of atomic force
microscope tips using biomolecules. Scanning Microsc
6:903–910
Wang Y, Cao X, Zhang L (2006) Effects of cellulose whiskers
on properties of soy protein thermoplastics. Macromol
Biosci 6:524–531
Wang N, Ding E, Cheng R (2007a) Thermal degradation
behavior of spherical cellulose nanocrystals with sulfate
groups. Polymer 48:3486–3493
Wang B, Sain M, Oksman K (2007b) Study of structural
morphology of hemp fiber from the micro to the nano-
scale. Appl Compos Mater 14:89–103
Xiao YH, Zhang Z-S, Yin M-H, Luo M, Li X-B, Hou L, Pei Y
(2007) Cotton flavonoid structural genes related to the
pigmentation in brown fibers. Biochem Biophys Res
Commun 358:73–78
Zhang JG, Elder TJ, Pu YQ, Ragauskas AJ (2007) Facile
synthesis of spherical cellulose nanoparticles. Carbohydr
Polym 69:607–611
Zhang J, Jiang N, Dang Z, Elder TJ, Ragauskas AJ (2008)
Oxidation and sulfonation of cellulosic. Cellulose 15:
489–496
Zhu S-E, Gao P, Sun J-S, Wang H-H, Luo X-M, Jiao M-Y,
Wang Z-Y, Xia G-X (2006) Genetic transformation of
green-colored cotton. In vitro Cell Dev Biol Plant 42:
439–444
Zuluaga R, Putaux JL, Restrepo A, Mondragon I, Ganan P
(2007) Cellulose microfibrils from banana farming resi-
dues: isolation and characterization. Cellulose 14:
585–592
606 Cellulose (2010) 17:595–606
123


![Cellulose Nanofibers and Other Biopolymers for Biomedical ... · pretreatments, such as enzymatic hydrolysis [14], partial carboxymethylation [15], ... protein animal-based polymers,](https://img.pdfslide.us/doc/110x75/5f4f8508db49655ce34d6e0e/cellulose-nanofibers-and-other-biopolymers-for-biomedical-pretreatments-such.jpg)