Embed Size (px)
Citation preview
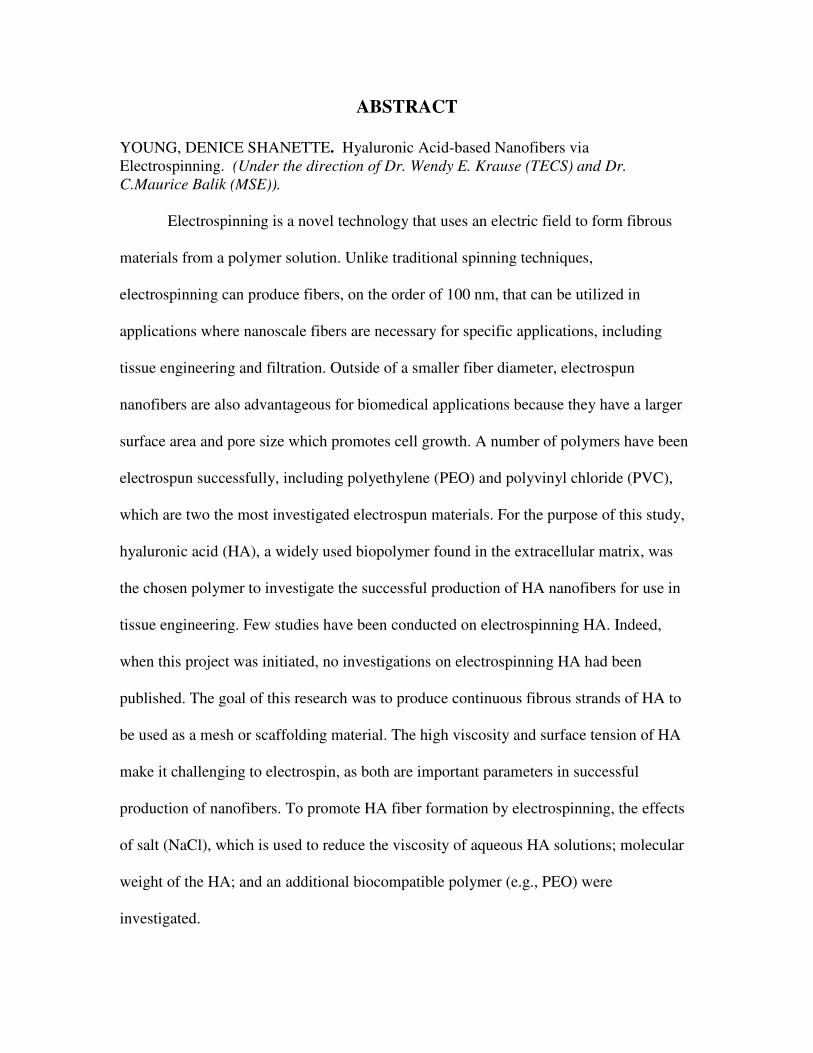
ABSTRACT
YOUNG, DENICE SHANETTE. Hyaluronic Acid-based Nanofibers via Electrospinning. (Under the direction of Dr. Wendy E. Krause (TECS) and Dr. C.Maurice Balik (MSE)).
Electrospinning is a novel technology that uses an electric field to form fibrous
materials from a polymer solution. Unlike traditional spinning techniques,
electrospinning can produce fibers, on the order of 100 nm, that can be utilized in
applications where nanoscale fibers are necessary for specific applications, including
tissue engineering and filtration. Outside of a smaller fiber diameter, electrospun
nanofibers are also advantageous for biomedical applications because they have a larger
surface area and pore size which promotes cell growth. A number of polymers have been
electrospun successfully, including polyethylene (PEO) and polyvinyl chloride (PVC),
which are two the most investigated electrospun materials. For the purpose of this study,
hyaluronic acid (HA), a widely used biopolymer found in the extracellular matrix, was
the chosen polymer to investigate the successful production of HA nanofibers for use in
tissue engineering. Few studies have been conducted on electrospinning HA. Indeed,
when this project was initiated, no investigations on electrospinning HA had been
published. The goal of this research was to produce continuous fibrous strands of HA to
be used as a mesh or scaffolding material. The high viscosity and surface tension of HA
make it challenging to electrospin, as both are important parameters in successful
production of nanofibers. To promote HA fiber formation by electrospinning, the effects
of salt (NaCl), which is used to reduce the viscosity of aqueous HA solutions; molecular
weight of the HA; and an additional biocompatible polymer (e.g., PEO) were
investigated.
HYALURONIC ACID-BASED NANOFIBERS VIA ELECTROSPINNING
by
DENICE S. YOUNG
A thesis submitted to the Graduate Faculty of North Carolina State University
in partial fulfillment of the requirements for the Degree of
Master of Science
MATERIALS SCIENCE & ENGINEERING
Raleigh
2006
APPROVED BY
_____________________________ _____________________________ Dr. C. Maurice Balik Dr. Wendy E. Krause
(Co-Chair of Advisory Committee) (Co-Chair of Advisory Committee)
_____________________________ Dr. Richard J. Spontak

ii
BIOGRAPHY Denice Shanette Young was born in Fayetteville, NC on February 23, 1982 to Franklin
and Rebecca Young. After attending Pine Forest High School and becoming very
interested in pursuing an engineering career in college, she enrolled at North Carolina
State University as a student in Textile Engineering. Upon graduation in May 2004,
Denice decided to take a summer internship with the Intel Corporation in Phoenix, AZ
where she gained experience as a researcher in the area of Advanced Materials and
Semiconductors. She thus decided to pursue a M.S. degree in Materials Science &
Engineering in order to obtain a position in Research & Development. She enrolled at
North Carolina State University in the Department of Materials Science & Engineering in
August 2000 on a National Science Foundation GK-12 fellowship. Over the course of
her graduate career she worked heavily with K-12 outreach in Wake County, NC at
Southeast Raleigh High School and with the National Society of Black Engineers,
serving as Region 2 Chairperson in 2005-2006. Upon graduating in May 2006, Denice
will be entering industry as a Project Engineer for the Goodyear Tire & Rubber Company
in Spring Hope, NC. Her career aspirations include work in research & development and
the eventual promotion to Plant Manager.
iii
ACKNOWLEDGEMENTS
I would like to thank God for allowing me the strength to successfully complete
my thesis, graduate work, and other opportunities throughout the duration of my graduate
career. My family, including my mother and father, Rebecca and Franklin Young, have
truly been a blessing in my abilities and I love them for always being there to encourage
and motivate me. To my sister, I want to say thank you for being a great role model and
shoulder to lean on.
To my advisors and committee, this research was definitely a challenge for me
and it has been great working with you over the course of the last two years. I would also
like to recognize members of my research group, Hailey Queen, Seth McCullen, Jing
Liang, and Rebecca Klossner for all of their contributions to the success of my work.
To my RAMP-UP fellows and director, Dr. Laura Bottomley and Liz Parry, K-12
outreach has been the driving force behind me continuing to do well in graduate school
and motivating others. You all have been awesome in my academic and personal life.
Lastly, to the National Society of Black Engineers (NSBE), I thank you for being
the only student organization geared towards increasing Black engineers, scientists, and
mathematicians. I have enjoyed my reign on the Regional Executive Board and National
Executive Board and will continue to make huge strides in NSBE and in my professional
career due to the personal and professional development that I have gained from this
honorable organization.
iv
TABLE OF CONTENTS
LIST OF TABLES............................................................................................................. vi LIST OF FIGURES .......................................................................................................... vii 1.0 RESEARCH OBJECTIVES ................................................................................... 1
1.1 Goals and Objectives ............................................................................................... 1 1.2 References................................................................................................................. 3
2.0 INTRODUCTION ........................................................................................................ 4 2.1 Introduction to Fiber Technology ............................................................................. 4
2.1.1 Definition of fibers............................................................................................. 4 2.1.2 Synthetic versus Natural ................................................................................... 4
2.2 Traditional Fiber Formation Processes ..................................................................... 6 2.2.1 Technology of the Spinneret .............................................................................. 7 2.2.2 Difficulties in Traditional Spinning Processes .................................................. 8
2.3 Fiber formation by Electrical Stimulation .............................................................. 10 2.4 Summary........................................................................................................... 10 2.5 References......................................................................................................... 11
3.0 LITERATURE REVIEW ........................................................................................... 12 3.1 Nanotechnology and Nanofibers............................................................................. 12 3.2 Electrospinning of Nanofibers ................................................................................ 13 3.3 Polymer Selection in Electrospinning..................................................................... 16 3.4 Hyaluronan.............................................................................................................. 18 3.5 Electrospinning versus Electroblowing of Nanofibers ........................................... 22 3.6 Electrospinning Parameters .................................................................................... 24
3.6.1 Process Parameters........................................................................................... 24 3.6.2 Solution Parameters ......................................................................................... 25
3.7 Applications for Nanofibers................................................................................... 26 3.7.1 Filtration........................................................................................................... 26 3.7.2 Tissue Engineering Scaffolds .......................................................................... 27 3.7.3 Challenges with Nanofibers ............................................................................ 30
3.8 References............................................................................................................... 31 4.0 EXPERIMENTAL...................................................................................................... 33
4.1 Materials ................................................................................................................. 33 4.2 Rheological Measurements..................................................................................... 33
4.2.1 Electrospinning ................................................................................................ 34 4.2 Characterization Techniques................................................................................... 36 4.3 Solution properties .................................................................................................. 36
4.3.1 Rheology Measurements.................................................................................. 37 4.3.2 Operating parameters ....................................................................................... 39 4.3.3 Fiber characterization....................................................................................... 40
4.4 Preliminary Results ................................................................................................. 41 5.0 DATA & ANALYSIS................................................................................................. 44
5.1 Design of Experiment ............................................................................................. 44 5.2. Processing effects on the performance of electrospinning .................................... 45
5.2.1 Effect of HA concentration.............................................................................. 45
v
5.2.2 Effect of solution feeding rate.......................................................................... 57 5.2.3 Effect of electric field ...................................................................................... 59
5.3 Additional Experimentation.................................................................................... 60 5.3.1 Electrospinning on Seprafilm® ................................................................ 61 5.3.2 Energy Dispersive X-Ray Spectroscopy (EDS) Analysis .............................. 62
5.4 Summary of Results ................................................................................................ 64 6.0 CONCLUSIONS......................................................................................................... 67 7.0 FUTURE WORK........................................................................................................ 69 8.0 FELLOWSHIP EFFORTS ......................................................................................... 71 9.0 REFERENCES ........................................................................................................... 90 10.0 APPENDIX............................................................................................................... 95
A. DOE of Experimental Trials ................................................................................... 96 B. Electrospinning Parameters...................................................................................... 97
vi
LIST OF TABLES
Table 1: Polymer solvent systems for electrospinning…………………………………17 Table 2: Hyaluronic Acid and the Wound Healing Process…………………………....19 Table 3. DOE for PVA Electrospinning………………………………………………..42 Table 4. DOE for PEO Electrospinning…………………………………………..……42 Table 5: Zero Shear Rate Viscosity Measurements for Pure HA Solutions……………46 Table 6: Southeast Raleigh Magnet High School students enrolled in Algebra 1 in 2004-2005 by count and overall percentage based on math-enrolled student population……………………………………………………………………………….77 Table 7: Southeast Raleigh Magnet High School students enrolled in Algebra 1 in 2004-2005 broken up by grade-level…………………………………………………...77 Table 8: Percentage of Southeast Raleigh Magnet High School students enrolled in Algebra 1 in 2004-2005 based on grade level. ………………………………………...78 Table 9: Additional Student Characteristics not included in Figure 8…………………81
Table 10: Miscellaneous Student Characteristics not included in Figure 32…………..82
vii
LIST OF FIGURES Figure 1: SEM image of PVA electrospun nanofibers. ………………………………..12 Figure 2: Illustration of Taylor Cone formation from the Syringe Needle Tip…………14 Figure 3. General Electrospinning schematic……………………………………………15 Figure 4. Molecular Structure of Hyaluronic Acid……………………………………....18 Figure 5: Schematic of Stony Brook Electroblowing Apparatus………………………..23 Figure 6: HYAFF® 3-dimensional Matrix…………………………………………...….28 Figure 7: Illustration of Cell Growth on PEO Nanofibers………………………………29 Figure 8: Skin formed from nanofiber mesh……………………………………………30 Figure 9: Plate and Stand Design of Electrospinning Apparatus……..………………...33 Figure 10: Digital Image of Electrospinning Apparatus………………………………...35 Figure 11: Schematic parallel plates………………………………………………….….37
Figure 12: SEM image of 5wt% PVA…………………………………………………..41 Figure 13: SEM image of 5wt% PEO nanofibers………………………………………44 Figure 14: Shear Viscosity of HA solutions with various concentrations (wt%)………47 Figure 15: SEM image of 1.5 wt% HA Solutions…………………………………….…48 Figure 16: Viscosity versus Shear Rate of 2wt% HA………………………………......49 Figure 17: Viscosity versus Shear Rate of 2wt% HA at various concentrations…….…50 Figure 18: SEM image of 2wt% HA Solutions (diluted with 1M NaCl)……………….51 Figure 19: SEM image of non-electrospun 2wt% HA Solutions……………………….52 Figure 20: SEM image of 2wt% HA Solutions (diluted with 0.5M NaCl)………………….….53 . Figure 21: Rheology of HA:PEO Blended Solutions Versus Pure PEO………………54 Figure 22: SEM image of 1wt% HA:PEO (70:30) Solutions……………….…………..55
viii
Figure 23: SEM image of 1wt% HA:PEO (60:40) Solutions…………….……………..56 Figure 24: SEM image of 1wt% HA:PEO (60:40) Solutions…………….……………..58 Figure 25: Effect of Blend Concentration on Fiber Diameter…………………………...59 Figure 26: SEM image of 1wt% HA:PEO (60:40) Solutions at 25kV…………………..60 Figure 27: SEM Image of Electrospun HA-PEO (60:40 blend) on Seprafilm®………..62 Figure 28: SEM Image of Electrospun HA-PEO (60:40 blend) for EDS Analysis……..63 Figure 29: Graphical Representation of Algebra I Levels for SRMHS RAMP UP Students and Comparison Students………………………………………………………78 Figure 30: Graphical Representation of EOG Versus EOC Algebra 1 Scores……..…...79 Figure 31: Graphical Representation of Algebra I Performance for 9th Graders by Group, Ethnicity, and Gender……………………………………………………………………81 Figure 32: Graphical Representation of 2004-2005 Percentages of 10th Grade Students at Each Algebra 1 Level……………………………..……………………………………..82 Figure 33: Graphical Representation of 2004-2005 Algebra 1 Performance for 10th Grade Students by Group, Ethnicity, and Gender……………………………..………………..83 Figure 34: Matt Gossett’s The Cereal Spool…………………………………………….85 Figure 35: Brandon Shaw’s Mechanical Pencil…………………………………………85 Figure 36: Jef Farmer’s Lock…………………………………………………………….86 Figure 37: Rim Design by Kelly Justice………………………………………………....86 Figure 38: Kyle (center) building, Sarah and Kevin (left to right) painting their puzzle cubes……………………………………………………………………………………..87 Figure 39: Jaqueline Wright receiving assistance with classwork in modeling project...40 �
Figure 40: Kindergarten students at Willow Springs Elementary receive instruction at September 2005 Math Night. ……………………………..……………………………..88
1
INFLUENCE OF CONCENTRATION ON THE FABRICATION OF BIOPOLYMER NANOFIBERS OF
HYALURONIC ACID VIA ELECTROSPINNING
1.0 RESEARCH OBJECTIVES
1.1 Goals and Objectives The objective of this research was to electrospin biopolymers into nanofibers.
Traditional spinning techniques, i.e. wet spinning, gel spinning, etc., are not capable of
producing fibers on the nanoscale. With this, the technique known as electrospinning is
necessary to form nanofibers using a controlled electric field to pull fibers from an
electrically charged polymer jet. There are hundreds of polymers that are electrospun for
various applications, including polyethylene oxide (PEO), polyvinyl alcohol (PVA),
polyethylene terephthalate (PET), nylon, and polyvinyl chloride (PVC). The polymer
chosen for this research is that of hyaluronic acid or hyaluronan. Hyaluronic acid is a
natural biopolymer ubiquitously distributed in the extracellular space, particularly in the
extracellular matrix (ECM), but also found in synovial fluid of joints, the vitreous humor
of eyes, and the scaffolding comprising cartilage [1,2].
As hyaluronic acid (HA) is known to have a high viscosity at relatively low
concentrations [2], electrospinning the polymer is very challenging. However HA is an
ideal biomaterial for drug-delivery, ophthalmology, and even dermatology as it is
immuno-neutral and has excellent properties for these applications, including a high
surface tension and viscosity [3]. Overcoming this high viscosity to successfully find the
threshold between molecular weight, viscosity, and spinning parameters, are the
challenges faced in fabricating nanofibers of HA for potential use in tissue engineering
applications.
2
The successful development of biocompatible nanofibers for use in tissue
engineering and bio-engineered material is critical to the advancement of medical
textiles. Utilizing natural polymers, these fibers will allow access to new technology to
treat diseases, burn victims, and provide materials for organ and tissue transplants. The
U.S. Scientific Registry of Transplant Recipients reports that the number of Americans
on the waiting list for organ transplants has doubled from 1995 to 2005 all due to the
resources available in finding donors [4]. Since 1995, research in tissue and organ
transplant has also doubled in order to find alternative means for meeting the high
demands associated with transplants. One of the most researched areas is that of tissue
engineering scaffolds [4]. However, a limited number of polymers and materials which
can be utilized in such biomedical applications as the risk of thrombosis and rejection
from the body are prevalent. The use of biodegradable and biocompatible polymers as
tissue–engineering scaffolds is more attractive as the inflammatory response to the
implant recedes after the scaffold is resorbed. The only potential drawback is the risk of
triggering debris particle regeneration [3].
Through this study, the biodegradable polymer hyaluronic acid (HA) will be used
in the fabrication of nanofibers thus providing adequate surface area, wide range of pore
size, and a highly porous structure to allow and support cell, including cartilage
(chondrocyte) cell growth at the nanoscale. In addition, the polymer blending with
another biocompatible and successfully electrospun polymer of polyethylene oxide
(PEO) will expand the opportunities for mesh and scaffold designs and functions.
3
The precise goals of the research for developing a polymer tissue engineering
scaffold of HA through electrospinning are as follows:
• Determine the influence of molecular weight and sodium chloride (NaCl) concentration on the solution viscosity and ability to electrospin HA.
• Identify threshold for successful electrospinning of NaHA.
• Investigate the influence of blending HA with other electrospun polymers (i.e.
PEO, PVA) in terms of solution viscosity and nanofiber production. • Identify key parameters in electrospinning such as electric field, feed rate,
concentration, and solvent evaporation rate.
1.2 References 1.) Balazs, E. A.; Gibbs, D. A. The rheological properties and biological function of hyaluronic acid. Chemistry and Molecular Biology of the Intercellular Matrix 1970, 3, 1241. 2.) Krause, W.; Bellamo, E.; Colby, R. Rheology of Sodium Hyaluronate under Physiological Conditions. Biomacromolecules 2001, 2, 69. 3.) Li, W.; Laurencin, C. T.; Caterson, E. J.; Tuan, R. S.; Ko, F. K. J of Biomedical Materials Research 2002, 60, 613. 4.) Ma, H.; Zeng, J.; Realff, M. L.; Kumar, S.; Schiraldi, D. A. Composites Science and Technology 2003, 63, 1617.
4
2.0 INTRODUCTION
2.1 Introduction to Fiber Technology
2.1.1 Definition of fibers Fiber is a general term for a filament with a finite length that is at least 100 times
its diameter (typically 0.10 to 0.13 mm). In most cases, fibers are prepared by drawing
from a molten bath, spinning, or deposition on a substance.
2.1.2 Synthetic versus Natural Fibers can be classified as natural or synthetic and either continuous or staple.
Natural fibers, of course, can come from either animals or plants and probably the most
well-known example of each are wool and cotton, respectively. Their chemical structure
is polymer-based, in that a regular, repeat structure can be found in natural fibers.
Synthetic fibers, too, are based on a regular polymeric structure. However, synthetic
fibers are manufactured, or “synthesized,” usually from petroleum products, but
sometimes from coal or natural gas.
The term fiber is often used synonymously with filament. A filament is the
smallest unit of a fibrous material. They are the basic units formed during drawing and
spinning, which are gathered into strands of fibers to be fabricated into yarns and
eventually fabrics. Filaments are of extreme length and very small diameter (usually less
than 25 micrometers). Normally, filaments are not used individually but are bundled or
twisted to form fibers. All natural fibers have a finite length associated with them,
ranging from about 5 to 20 cm. This could be the length of the hair on a sheep (wool) or
the length of a cotton filament in a cotton plant. In order to be woven into a fabric, these
filaments must first be aligned together into a continuous strand, called yarn or thread.
Spinning machines are used to accomplish this. The filaments are held together by van
5
der Waal forces. The thread and yarn produced in this way contain occasional filaments
which stick out away from the continuous strand; this is somewhat like branch groups on
a polymer, albeit at a much larger scale. In any case, these filament branches help to
provide the woven fabric with greater bulk and porosity and are associated with other
positive aesthetic features of the fabric. Synthetic fibers, however, can be made into
continuous filaments which are practically infinite in length. Even though the individual
polymer molecules in the filament are 1000x longer than they are wide, they are still
usually tiny fractions of millimeters in length. A “yarn” can be made of these filaments
simply by bringing the filaments together continuously as the filaments are produced.
This will not produce a yarn with filaments which occasionally stick out from the strand.
In order to produce such a result, in some processes the continuous strands are chopped
into strands of finite length, so that there is a somewhat closer match between the
synthetic and the natural fibers. These chopped-up sections are called “staple” and the
staple is brought together again in spinning machines which operate just like those used
with natural fiber [1].
Another difference between natural and synthetic fibers is that the natural ones are
usually curlier. Two techniques have been used to make the synthetic fibers and yarn
curlier: one is to pass the yarn between two heated gears which can impart a permanent
crimp to the yarn and the second is to produce the synthetic filaments from two different
polymers passing out of a common die. The resulting filament will exhibit varying
curliness, based on humidity conditions if the two polymers absorb water to differing
degrees and if the absorption changes the shape of the filaments accordingly.
6
2.2 Traditional Fiber Formation Processes Spinning has long been used as the process for the production of synthetic fibers.
Presently, the world is consuming vast quantities of these fibers in the form of clothing,
carpets, furniture upholstery, etc. and the demand is likely to increase in the future. Thus,
spinning and fiber formation are processes of great industrial importance. The three basic
spinning processes: (1) dry spinning, (2) wet spinning, and (3) melt spinning. All three
steps involve the formation of continuous filament strands by forcing the material
through circular dies, but melt spinning involves cooling of the subsequent strand to form
the solid filament, whereas dry and wet-spinning involves removal of a solvent to form
the solid filament.
In dry spinning, the solvent evaporates into a gas and in wet spinning the solvent
is leached into a liquid bath. A mixture of polymer and volatile solvent is extruded
through a capillary, the solvent is vaporized and the remaining polymer forms the
synthetic fiber. This is a fairly costly process due to the extra costs for equipment to
prepare the polymer-solvent mixture and for solvent recovery. In wet spinning, a
polymer-nonvolatile solvent mixture is extruded through a spinneret into a coagulating
solution, resulting in a fiber. Wet spinning is also fairly costly. Melt spinning, on the
other hand, utilizes only the raw polymer. This raw polymer is melted and extruded
through a spinneret to produce the fiber [1].
In addition to wet, dry, and melt spinning, two relatively newer spinning
techniques include gel spinning and reaction spinning. In gel spinning, the primary
mechanism of solidification is the gelling of the polymer solution by cooling to form a
7
gel filament consisting of precipitated polymer and solvent. Reaction spinning utilizes
both polymerization and spinning of the filaments simultaneously as one reactant is
extruded into a bath containing another reactant [1].
2.2.1 Technology of the Spinneret The one feature which is common to all the traditional spinning methods
mentioned above is the step in which the very viscous liquid fiber forming material is
forced under pressure through a spinneret. The spinneret serves as the actual capillary
and is composed of a number of small holes, generally in the order of 0.1mm in diameter.
This action involves two technical requirements: the use of high pressures behind the
spinneret in order to force the viscous liquid through the holes at the required/set rate; the
necessity for very efficient filtration of the liquid in order to prevent the blocking of the
spinneret holes by solid impurities.
These conditions are particularly hard to meet in the case of melt spinning, where
the liquid must be pumped, filtered and extruded at a temperature in the approximate
range of 220ºC to 290ºC and at a viscosity of about 1000 poise. With regard to filtration,
one is more or less limited to two filter media only, namely fine stainless steel gauze and
sand layers of varying fineness. These are often used together. Glass and asbestos fiber
filters are not successful, as these materials are too brittle, and they are apt to allow small
bits of broken fiber to pass into the filtered polymer stream [2].
Research has also indicated that there is a lower limit to the spinneret hole size. It
is evident that from the point of view of ‘practical’ spinners, larger holes require less
pressure to produce a given rate of extrusion, and rates of extrusion are relatively slow.
Filtration requirements would be minimal and consist only of removing such particles as
8
would show in the finished product. Cleaning of the spinneret holes would also be
greatly simplified. A further result of using large spinneret holes would be that by
changing the take-up speed or extrusion speed, a large range of diameters, including
filaments, might be spun from the same spinneret.
The main factor operating against the use of large spinnerets seems to be the
belief of many that larger holes lead to more irregular filaments. The importance of this
effect does not lie directly in the increase in irregularity, but in the additional fact that
irregular filaments cannot be drawn at a sufficiently high draw ratio to give them
acceptable properties such a tenacity and extensibility.
2.2.2 Difficulties in Traditional Spinning Processes Among the different processes (dry, melt, wet, reaction, and gel) of producing
synthetic fibers, melt spinning has been most extensively studied because it is relatively
simple to treat, both theoretically and experimentally. However, a clear understanding of
all the phenomena occurring in melt spinning is far from complete. The difficulty lies
mainly in that although one may be primarily interested in the fiber-forming step where
stretching and re-orientation of molecules occur, this step is governed to a large extent by
the steps which precede it; namely the deformation of the polymer melt in the spinneret,
and the relaxation of the stresses in the melt upon exiting the die [1].
Wet-spinning, used for cellulose, proteins, polyvinyl alcohol, polyacrylonitrile,
and polyvinyl chloride, is the most complex spinning procedure. From the technological
point of view the most important problems involve obtaining fibers of optimum
morphological structure (very sensitive to the composition and conditions within the
precipitation bath) and efficient recuperation of the individual components of the solvent
9
and precipitating bath. The wet-spinning procedure, however, provides the possibility of
obtaining fibers from materials which cannot be spun in other ways (proteins, cellulose,
aromatic polyamides).
Dry spinning is the fiber formation process potentially emitting the largest amount
of volatile organic compounds (VOCs) per pound of fiber produced. Air pollutant
emissions include volatilized residual monomer, organic solvents, additives, and other
organic compounds used in fiber processing. Unrecovered solvent constitutes the major
substance. The largest amounts of unrecovered solvent are emitted from the fiber
spinning step and drying the fiber. Other emission sources include dope preparation
(dissolving polymer, blending the spinning solution, and filtering the dope), fiber
processing (drawing, washing, and crimping), and solvent recovery [2, 3].
When a polymer melt exits from the spinneret, it swells and gives rise to a
maximum thread diameter at a short distance from the spinneret face. Given a material,
the exact location at which the maximum swelling occurs and the maximum thread
diameter itself, depends on the deformation history of the melt in the spinneret holes.
Due to the technological importance of the extrudate swell behavior from the
point of view of polymer processing, much attention has been given to seeking a better
understanding of the cause(s) of extrudate swell in fiber spinning.
Traditional spinning methods are not capable of producing woven or nonwoven
fibers on the order of 100nm. With this, the diameter of the fibers fabricated by
traditional methods far exceeds that of the typical collagen fiber of the extracellular
matrix (ECM) in the body (ca.50-500 nm) [4]. Thus, another technique must be used to
produce fibers with a diameter on the order of 100 nm. This technique, as explained in
10
more detail in Section 2.3 and Section 3.2, is known as electrospinning and is capable of
producing nanofibers using electrical stimulation.
2.3 Fiber formation by Electrical Stimulation In comparison to traditional spinning techniques, electrospinning is a
straightforward, inexpensive, and unique method to produce novel fibers with diameter in
the range of 100 nm or even less. Polymer solutions, liquid crystals, suspensions of solid
particles and emulsions have been electrospun. The electric force results in an
electrically charged jet of polymer solution outflowing from a droplet tip. After the jet
flows away from the droplet in a nearly straight line, it bends into a complex path and
other changes in shape occur, during which electrical forces stretch and thin it by very
large ratios. After the solvent evaporates, a grounded collector plate will hold a mass of
nanofibers. The process of electrospinning is explained in greater detail in Section 3.2.
2.4 Summary
This research investigates the fabrication of nanoscale fibers of hyaluronic acid
(HA) using the technology of electrospinning. Hyaluronic acid is a naturally occurring
polymer that is used in various biomedical applications and is important in joint
lubrication [5]. Hyaluronic acid is an important polymer because it aids in cellular repair,
keeps skin moist, and also helps to heal wounds faster. Non-woven nano-webs of
hyaluronic acid have been produced using electrospinning and the webs are being tested
in wound healing and compared to the Vaseline gauze present on the market [6]. These
non-woven webs are fabricated solely through electrospinning as traditional fiber
spinning technologies are unable to produce fibers on the nanoscale. Electrospun fibers
of HA will provide the small diameter, small pore size, and large surface area needed for
11
such applications. This project utilized electrospinning to fabricate HA-based
nanofibers. HA’s high solution viscosity presents a challenge in electrospinning. The
influence of HA concentration and molecular weight, sodium chloride concentration, and
blending HA with other polymers was studied as a function of nanofiber production,
ability to electrospin, and solution viscosity.
2.5 References 1.) Subbiah, T; Ramkumar, S. S. Proc International Conf, High Performance Textiles and Apparels, July 2004, 81. 2.) Li, W.; Laurencin, C. T.; Caterson, E. J.; Tuan, R. S.; Ko, F. K. Journal of Biomedical Materials Research 2002, 60, 613. 3.) Ma, H.; Zeng, J.; Realff, M. L.; Kumar, S.; Schiraldi, D. A. Composites Science and Technology 2003, 63, 1617. 4.) Gibson, H.; Gibson, P.; Senecal, K.; Sennett, M.; Walker, J.; Yeomans, W.; Ziegler, D. J of Advanced Materials 2002, 34, 44. 5.) Kim, J. S.; Reneker, D. H. Polymer Composites 1999, 20, 124. 6.) Megelski, S.; Stephens, J. S.; Chase, D. B.; Rabolt, J. F. Macromolecules 2002, 35, 8456. 7.) Srinivasarao, M.; Collings, D.; Philips, A.; Patel, S. Science 2001, 292, 79. 8.) Zong, X. H.; Kim, K.; Fang, D. F.; Ran, S. F.; Hsiao, B. S.; Chu, B. Polymer 2002, 43, 4403. 9.) Bognitzki, M.; Frese, T.; Steinhart, M.; Greiner, A.; Wendorff, J. H. Polymer Engineering and Science 2001, 41, 982.
12
3.0 LITERATURE REVIEW
3.1 Nanotechnology and Nanofibers The non-woven industry generally considers nanofibers as having a diameter of
less than one micron, although the National Science Foundation (NSF) defines nanofibers
as having at least one dimension of 100 nanometer (nm) or less [1]. The name derives
from the nanometer, a scientific measurement unit representing a billionth of a meter, or
three to four atoms wide.
Nanofibers are an exciting new class of materials used for several value added
applications such as medical, filtration, barrier, wipes, personal care, composite,
garments, insulation, and energy storage [2]. Special properties of nanofibers make them
suitable for a wide range of applications from medical to consumer products and
industrial to high-tech applications for aerospace, capacitors, transistors, drug delivery
systems, battery separators, energy storage, fuel cells, and information technology [3,4].
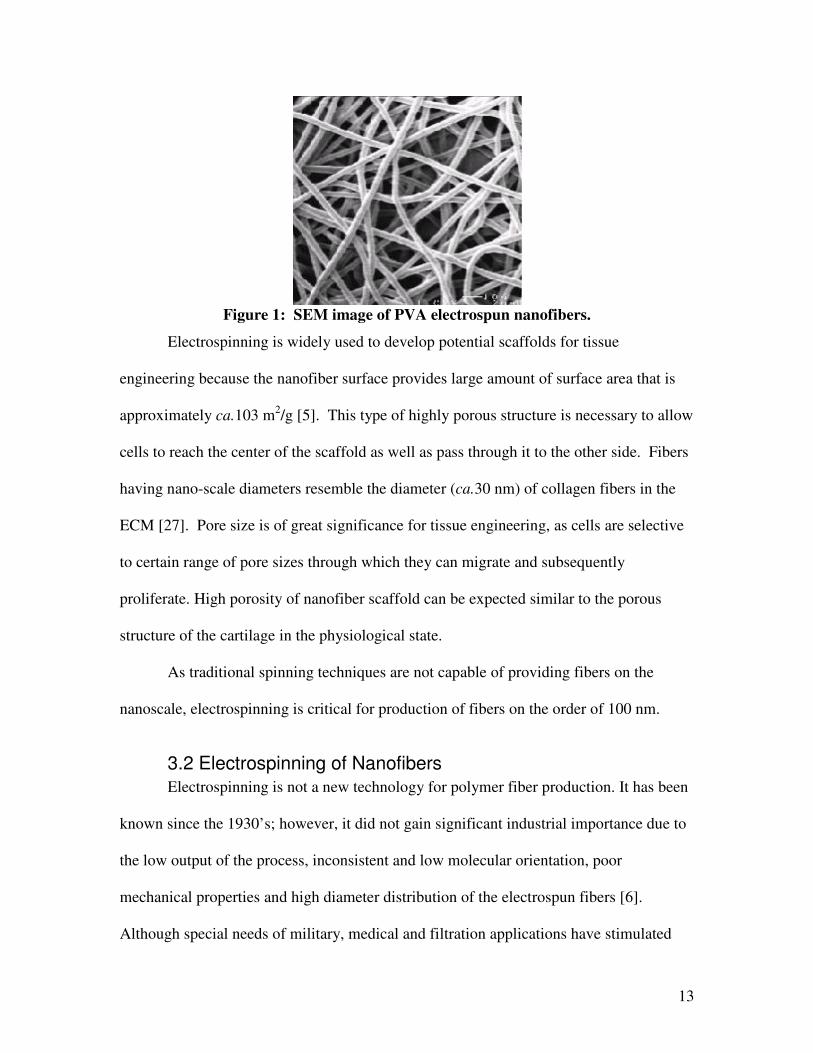
Generally, polymeric nanofibers are produced by an electrospinning process
(Figure 1). Electrospinning is a process that spins fibers of diameters ranging from 10 nm
to several hundred nanometers. This method has been known since 1934 when the first
patent on electrospinning was filed. Fiber properties depend on field uniformity, polymer
viscosity, electric field strength and TCD (distance between the needle tip and collector)
[4]. Scanning electron microscopy (SEM) allows us to explore the structure and
morphology of electrospun nanofibers.
13
Figure 1: SEM image of PVA electrospun nanofibers.
Electrospinning is widely used to develop potential scaffolds for tissue
engineering because the nanofiber surface provides large amount of surface area that is
approximately ca.103 m2/g [5]. This type of highly porous structure is necessary to allow
cells to reach the center of the scaffold as well as pass through it to the other side. Fibers
having nano-scale diameters resemble the diameter (ca.30 nm) of collagen fibers in the
ECM [27]. Pore size is of great significance for tissue engineering, as cells are selective
to certain range of pore sizes through which they can migrate and subsequently
proliferate. High porosity of nanofiber scaffold can be expected similar to the porous
structure of the cartilage in the physiological state.
As traditional spinning techniques are not capable of providing fibers on the
nanoscale, electrospinning is critical for production of fibers on the order of 100 nm.
3.2 Electrospinning of Nanofibers Electrospinning is not a new technology for polymer fiber production. It has been
known since the 1930’s; however, it did not gain significant industrial importance due to
the low output of the process, inconsistent and low molecular orientation, poor
mechanical properties and high diameter distribution of the electrospun fibers [6].
Although special needs of military, medical and filtration applications have stimulated
14
recent studies and renewed interest in the process, quantitative technical and scientific
information regarding process and product characterization are extremely limited [7].
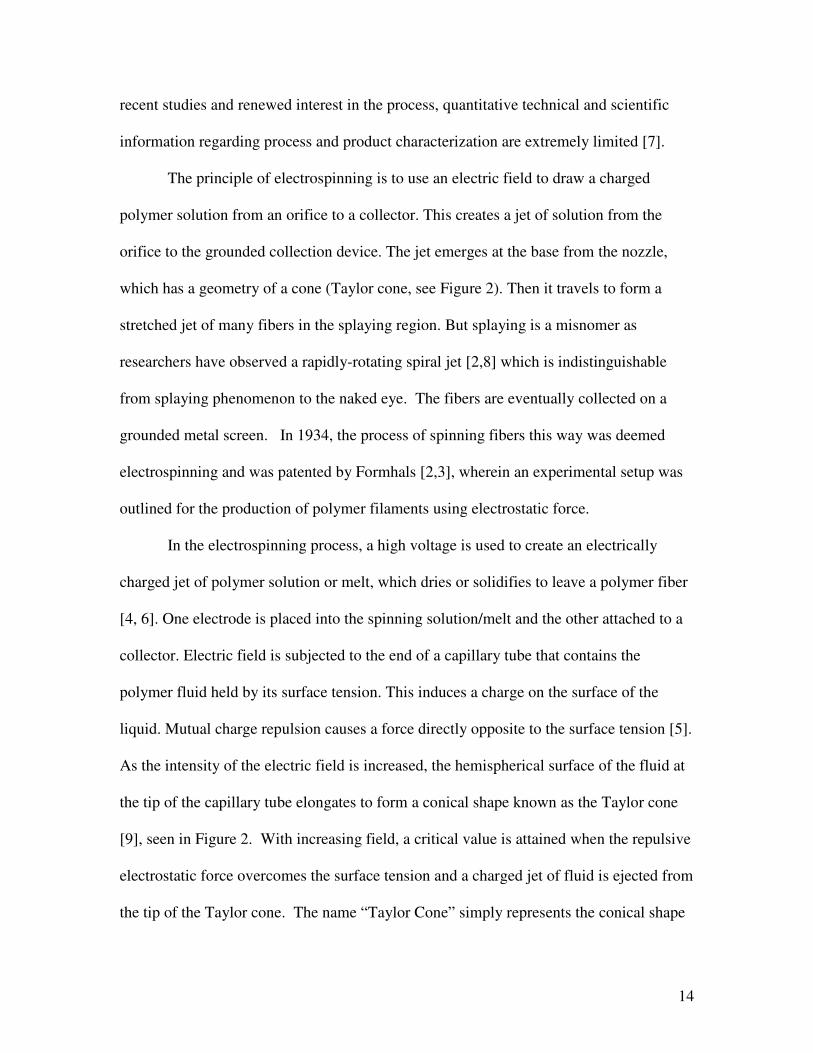
The principle of electrospinning is to use an electric field to draw a charged
polymer solution from an orifice to a collector. This creates a jet of solution from the
orifice to the grounded collection device. The jet emerges at the base from the nozzle,
which has a geometry of a cone (Taylor cone, see Figure 2). Then it travels to form a
stretched jet of many fibers in the splaying region. But splaying is a misnomer as
researchers have observed a rapidly-rotating spiral jet [2,8] which is indistinguishable
from splaying phenomenon to the naked eye. The fibers are eventually collected on a
grounded metal screen. In 1934, the process of spinning fibers this way was deemed
electrospinning and was patented by Formhals [2,3], wherein an experimental setup was
outlined for the production of polymer filaments using electrostatic force.
In the electrospinning process, a high voltage is used to create an electrically
charged jet of polymer solution or melt, which dries or solidifies to leave a polymer fiber
[4, 6]. One electrode is placed into the spinning solution/melt and the other attached to a
collector. Electric field is subjected to the end of a capillary tube that contains the
polymer fluid held by its surface tension. This induces a charge on the surface of the
liquid. Mutual charge repulsion causes a force directly opposite to the surface tension [5].
As the intensity of the electric field is increased, the hemispherical surface of the fluid at
the tip of the capillary tube elongates to form a conical shape known as the Taylor cone
[9], seen in Figure 2. With increasing field, a critical value is attained when the repulsive
electrostatic force overcomes the surface tension and a charged jet of fluid is ejected from
the tip of the Taylor cone. The name “Taylor Cone” simply represents the conical shape
15
formed at the needle tip (see Figure 2). This cone was described by Sir Geoffrey Ingram
Taylor in 1964 [9] as a continuation of the work of Zeleny in 1917 [9] on the formation
of a cone-jet of glycerine exposed to high electric fields. Several others continued
researching this area, including Wilson & Taylor (1925), Nolan (1926), and Macky
(1931) [9]. However it was Taylor who looked further into the reactions between
droplets and electric fields.
Figure 2: Illustration of Taylor Cone formation from the Syringe Needle Tip
Taylor's derivation is based on two assumptions: (1) that the surface of the cone is
an equipotential surface and (2) that the cone exists in a steady state equilibrium. Once
discharged and the Taylor cone activated, the polymer jet undergoes a whipping process
[10] wherein the solvent evaporates, leaving behind a charged polymer fiber, which lays
itself randomly on a grounded collecting metal screen. In the case of the melt the
discharged jet solidifies when it travels in the air and is collected on the grounded metal
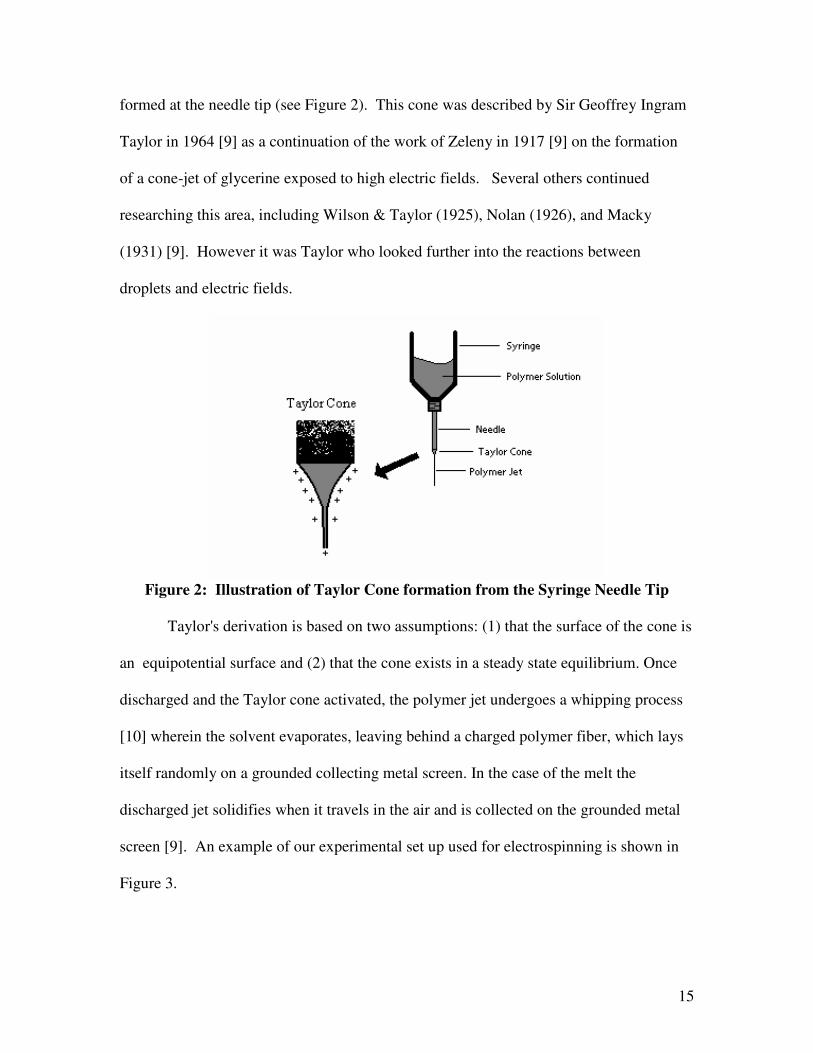
screen [9]. An example of our experimental set up used for electrospinning is shown in
Figure 3.
16
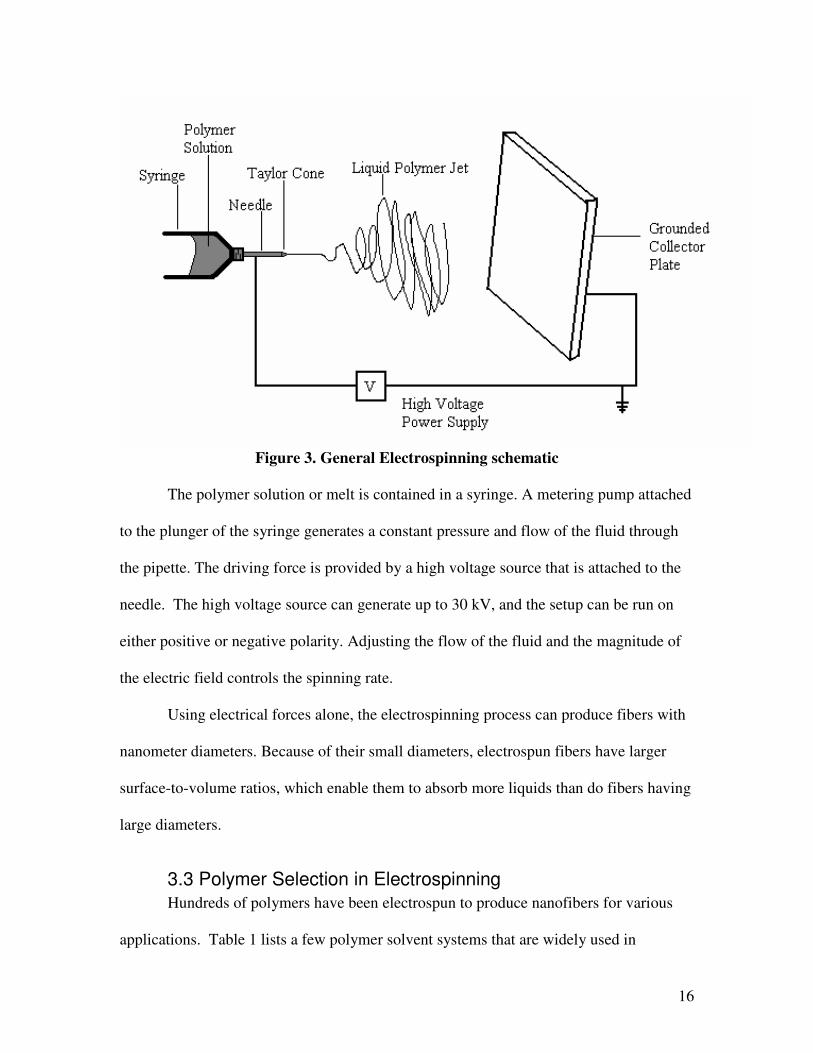
Figure 3. General Electrospinning schematic
The polymer solution or melt is contained in a syringe. A metering pump attached
to the plunger of the syringe generates a constant pressure and flow of the fluid through
the pipette. The driving force is provided by a high voltage source that is attached to the
needle. The high voltage source can generate up to 30 kV, and the setup can be run on
either positive or negative polarity. Adjusting the flow of the fluid and the magnitude of
the electric field controls the spinning rate.
Using electrical forces alone, the electrospinning process can produce fibers with
nanometer diameters. Because of their small diameters, electrospun fibers have larger
surface-to-volume ratios, which enable them to absorb more liquids than do fibers having
large diameters.
3.3 Polymer Selection in Electrospinning Hundreds of polymers have been electrospun to produce nanofibers for various
applications. Table 1 lists a few polymer solvent systems that are widely used in
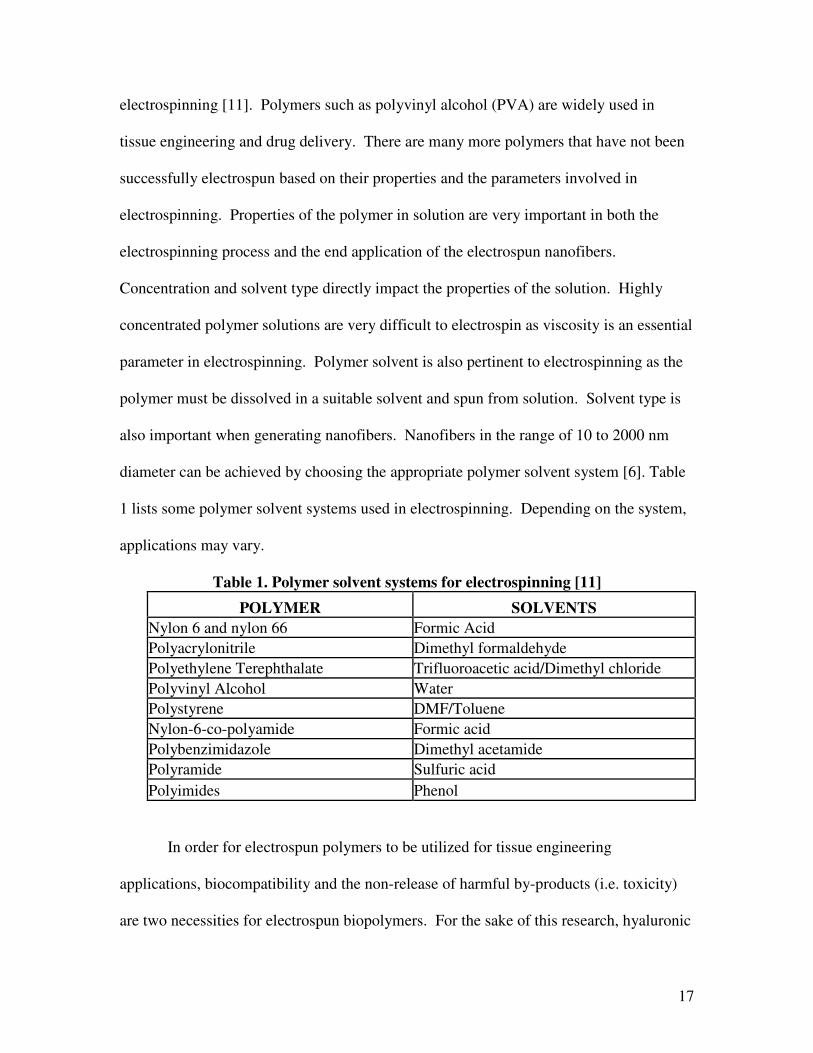
17
electrospinning [11]. Polymers such as polyvinyl alcohol (PVA) are widely used in
tissue engineering and drug delivery. There are many more polymers that have not been
successfully electrospun based on their properties and the parameters involved in
electrospinning. Properties of the polymer in solution are very important in both the
electrospinning process and the end application of the electrospun nanofibers.
Concentration and solvent type directly impact the properties of the solution. Highly
concentrated polymer solutions are very difficult to electrospin as viscosity is an essential
parameter in electrospinning. Polymer solvent is also pertinent to electrospinning as the
polymer must be dissolved in a suitable solvent and spun from solution. Solvent type is
also important when generating nanofibers. Nanofibers in the range of 10 to 2000 nm
diameter can be achieved by choosing the appropriate polymer solvent system [6]. Table
1 lists some polymer solvent systems used in electrospinning. Depending on the system,
applications may vary.
Table 1. Polymer solvent systems for electrospinning [11] POLYMER SOLVENTS
Nylon 6 and nylon 66 Formic Acid Polyacrylonitrile Dimethyl formaldehyde Polyethylene Terephthalate Trifluoroacetic acid/Dimethyl chloride Polyvinyl Alcohol Water Polystyrene DMF/Toluene Nylon-6-co-polyamide Formic acid Polybenzimidazole Dimethyl acetamide Polyramide Sulfuric acid Polyimides Phenol
In order for electrospun polymers to be utilized for tissue engineering
applications, biocompatibility and the non-release of harmful by-products (i.e. toxicity)
are two necessities for electrospun biopolymers. For the sake of this research, hyaluronic
18
acid (hyaluronan) is the polymer of choice based on its commercial availability, polymer
properties, and influence in the medical industry.
3.4 Hyaluronan Hyaluronan is a naturally occurring biopolymer used in medical applications
ranging from cataract surgery and post-surgical adhesion prevention to hydrophilic
coatings [12]. A unique biopolymer, hyaluronan is one of a number of polysaccharides
that occur in the body's mucous membranes and are known as mucopolysaccharides. It
was first isolated from the vitreous body of the eye in 1934 by Karl Meyer, who called it
hyaluronic acid [12]. The term hyaluronan is attributed to Endre Balazs, who coined it to
encompass the different forms the molecule can take—for example, the acid form,
hyaluronic acid, and the salts, such as sodium hyaluronate, which form at physiological
pH of 3 [3].
Over the years, quite a lot is known about the appearance of the hyaluronan
molecule; its behavior; its occurrence in different tissues and body fluids; the manner in
which it is synthesized by the cells, metabolized, and cleared from the body; and the
nature of some of the functions it performs. Hyaluronan and related polysaccharides are
called glycosaminoglycans [13-14]. These substances are made up largely of repeating
disaccharide units containing a derivative of an aminosugar. The most abundant
glycosaminoglycans in the body are chondroitin sulfates; others are keratin sulfate,
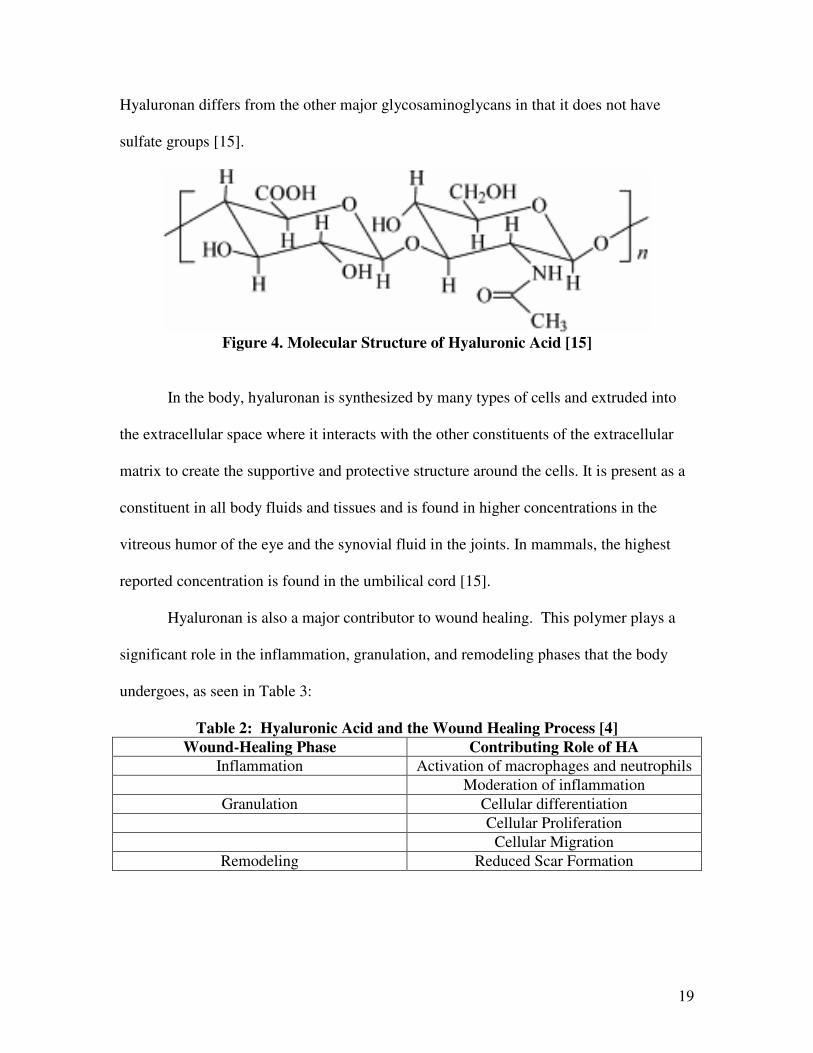
heparin and heparin sulfate, and dermatan sulfate. Figure 4 shows the disaccharide unit of
hyaluronan, consisting of alternating glucuronic acid and N-acetylglucosamine units,
which are repeated over and over to form long chains [15]. Each repeating disaccharide
unit has one carboxylate group, four hydroxyl groups, and an acetamido group.
19
Hyaluronan differs from the other major glycosaminoglycans in that it does not have
sulfate groups [15].
Figure 4. Molecular Structure of Hyaluronic Acid [15]
In the body, hyaluronan is synthesized by many types of cells and extruded into
the extracellular space where it interacts with the other constituents of the extracellular
matrix to create the supportive and protective structure around the cells. It is present as a
constituent in all body fluids and tissues and is found in higher concentrations in the
vitreous humor of the eye and the synovial fluid in the joints. In mammals, the highest
reported concentration is found in the umbilical cord [15].
Hyaluronan is also a major contributor to wound healing. This polymer plays a
significant role in the inflammation, granulation, and remodeling phases that the body
undergoes, as seen in Table 3:
Table 2: Hyaluronic Acid and the Wound Healing Process [4] Wound-Healing Phase Contributing Role of HA
Inflammation Activation of macrophages and neutrophils Moderation of inflammation
Granulation Cellular differentiation Cellular Proliferation Cellular Migration
Remodeling Reduced Scar Formation
20
Polymer Characteristics
Hyaluronan possesses a unique set of characteristics: its solutions manifest very unusual
rheological properties and are exceedingly lubricious, and it is very hydrophilic.
• Rheological Properties. In solution, the hyaluronan polymer chain takes on the
form of an expanded, random coil. These chains entangle with each other at very
low concentrations, which may contribute to the unusual rheological properties.
At higher concentrations, solutions have an extremely high but shear-dependent
viscosity [4].
• Lubricity. The extraordinary rheological properties of hyaluronan solutions make
them ideal as lubricants. There is evidence that hyaluronan separates most tissue
surfaces that slide along each other. Solutions of hyaluronan are extremely
lubricious and have been shown to reduce postoperative adhesion formation
following abdominal and orthopedic surgery [4].
• Hydrophilicity. As mentioned, the polymer in solution assumes a stiffened helical
configuration, which can be attributed to hydrogen bonding between the hydroxyl
groups along the chain. As a result, a coil structure is formed that traps
approximately 1000 times its weight in water [4].
• Commercial Availability. The classical sources for the isolation of hyaluronan
have been either from rooster combs, mammalian tissues, or from certain strains
of cultured bacteria. At one time, the material was isolated from human umbilical
cords collected in hospitals. One company, Pharmacia AB (Uppsala, Sweden),
developed a special strain of roosters with very luxuriant combs, from which the
compound was isolated. More recently, submerged cell-culture techniques using
21
certain strains of streptococci have been developed to produce hyaluronan. The
commercially available material comes in molecular weights ranging from less
than 1 million to as high as 8 million [4,6].
o There are a large number of hyaluronan producers around the world.
Biomatrix Inc. (Ridgefield, NJ), a U.S. company, operates a plant that
produces hyaluronan from mammalian sources in Canada. Anika
(Woburn, MA), Genzyme Corp. (Framingham, MA), and Lifecore
Biomedical (Chaska, MN) are other domestic suppliers. Pharmacia
produces hyaluronan in Sweden, Fidia Advanced Biopolymers (Brindisi)
in Italy, Bio-Technology General Corp. (Iselin, NJ) in Israel, and a
number of companies, including Kibun Food Chemifa Co. and Seikagaku
Corp. (both Tokyo), in Japan [16].
• Challenges. As a widely used polymer throughout various applications,
hyaluronic acid does present some disadvantages and challenges when dealing
with electrospinning the polymer. Its high viscosity and surface tension at
relatively low concentrations are indeed ideal in the medical industry for
ophthalmology, tissue engineering, and drug delivery. However, viscosity is an
important parameter in electrospinning and to achieve successful spinning, a low
viscosity and low concentration are needed. In addition, the short residence time
of HA due to biodegradability limits the possibility to widen its range of
biomedical application. To overcome this problem, many methods may be
adopted including: chemically modifying HA by crosslink or coupling reactions
and most effective, by blending HA with other polymers [17,18].
22
3.5 Electrospinning versus Electroblowing of Nanofibers Many researchers have been successful in electrospinning nanofibers from
polymers including PVA, PVP, and PEO. To our knowledge, no published work reports
the successful electrospinning of hylauronic acid nanofibers. However, one team in
particular, led by Chu, et al.[16], has successfully fabricated nanofibers of HA utilizing a
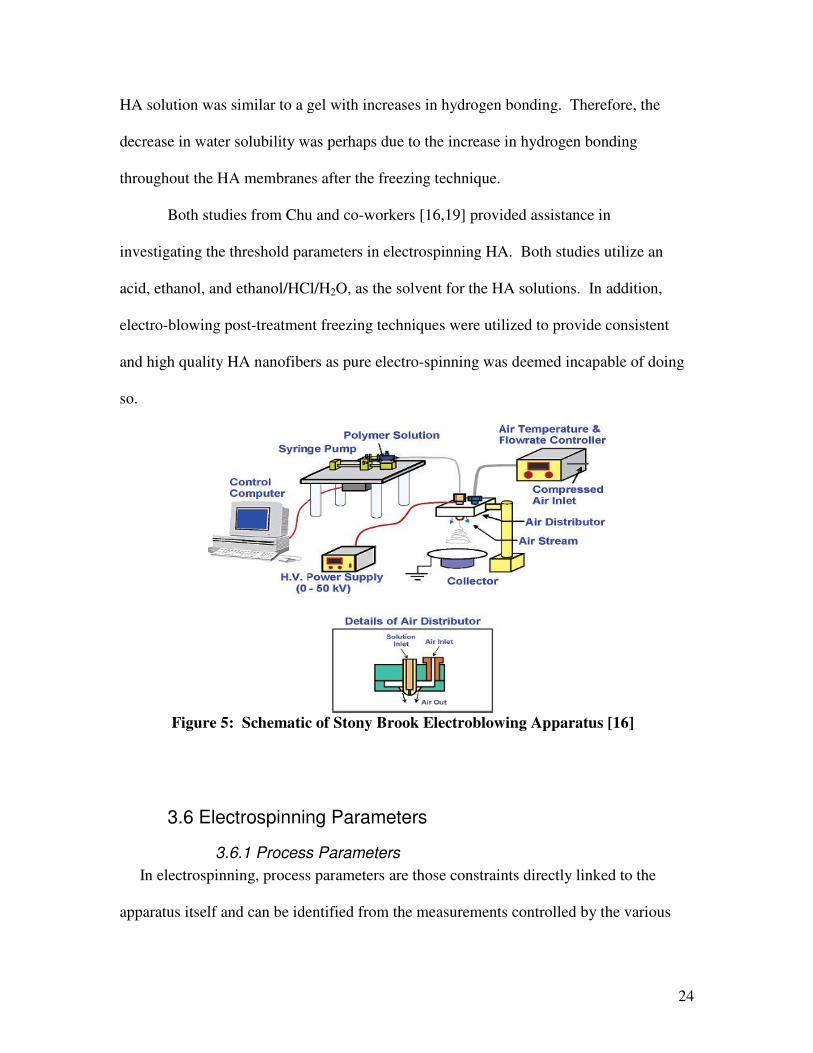
technique similar to electrospinning known as “electroblowing.” Figure 4 is an
illustration of the electrospinning apparatus used by Chu, et al. [16]. The apparatus is
identical to typical electrospinning devices with the addition of a blowing machine,
which is equipped with an air temperature and flowrate controller, air distributor, and
steam system. Using this additional system did result in the fabrication of HA
nanofibers; however, several key parameters were modified to stabilize the process. The
effects of various experimental parameters, such as air-blowing rate, HA concentration,
feeding rate of HA solution, applied electric field, and type of collector on the
performance of blowing-assisted electro-spinning of HA solution were major areas of
investigation.
In their first report [16], the group successfully produced HA nanofibers with
electo-blowing assisted procedures, as illustrated in Figure 5. The nonwoven mat HA
nanofibers were characterized using scanning electron microscopy (SEM) and
morphology characterization techniques to observe the porosity and fiber morphology of
the electrospun nanofibers and verify the presence of beads and scales on the fibers.
23
After testing several solutions through numerous trials, the researchers concluded the
following parameters as optimal conditions for the process:
Solution Concentration: 1.3-1.5 w/v% Solution Viscosity: 3-30 Pa.s Flow Rate: 20 to 60 �L/min.
From these parameters, the researchers concluded that the effect on polymer
concentration by blending, solvent evaporation by the addition of ethanol, and solution
feed rate all improved the quality of HA fibers. Consequently, these improvements were
deemed inadequate as they were not able to be replicated over a series of experimental
trials. To overcome this issue, the electro-blowing assistance was introduced and from
further testing, the researchers found that at a blowing rate of ���C at a 70 ft3/hr. flow
rate, the nanofiber production was of high quality and consistency.
In their second publication [19], two methods to fabricate water-resistant HA
nanofibrous membranes without the use of reactive chemical agents were demonstrated
with the exposure of HA membranes in hydrochloric acid (HCl) vapor, followed by a
freezing treatment at -20°C for 20-40 days; and the immersion of HA membranes in an
acidic mixture of ethanol/HCl/H2O at 4°C for 1-2 days. Although both methods could
produce hydrophilic, substantially water-resistant HA nanofibrous membranes (the
treated membranes could keep their shape intact in neutral water at 25°C for about 1
week), the immersion method was shown to be more versatile and effective.
Characterization techniques utilized in this study included IR spectroscopy (for cross-
linking mechanisms) and rheological studies (for viscosity measurements of the
solutions). IR spectroscopy was used to investigate this 'cross-linking' mechanism in the
solid HA membrane. The researchers concluded that after a freezing time of 8 hours, the
24
HA solution was similar to a gel with increases in hydrogen bonding. Therefore, the
decrease in water solubility was perhaps due to the increase in hydrogen bonding
throughout the HA membranes after the freezing technique.
Both studies from Chu and co-workers [16,19] provided assistance in
investigating the threshold parameters in electrospinning HA. Both studies utilize an
acid, ethanol, and ethanol/HCl/H2O, as the solvent for the HA solutions. In addition,
electro-blowing post-treatment freezing techniques were utilized to provide consistent
and high quality HA nanofibers as pure electro-spinning was deemed incapable of doing
so.
Figure 5: Schematic of Stony Brook Electroblowing Apparatus [16]
3.6 Electrospinning Parameters
3.6.1 Process Parameters In electrospinning, process parameters are those constraints directly linked to the
apparatus itself and can be identified from the measurements controlled by the various
25
devices throughout the process. The devices contributing to the electrospinning set-up
are a high voltage power supply, syringe pump, and collector. Unlike previous research
in electrospinning HA, no other assisted techniques were utilized. The power supply
used throughout this experimentation has the capacity to output up to 60,000 volts and as
mentioned earlier, electric field strength is a critical process parameter in electrospinning.
The syringe pump serves as a metering device in both securing the capillary/syringe in
which the liquid polymer is contained and generates a constant pressure and flow of the
fluid through the syringe needle. Flow rate is thus another process parameter in the
system. The collector in the system is a grounded metal plate that is mobile in supplying
a tip-to-collector distance for collecting the spun fibers as they travel from the needle tip
to the collector. Tip to collector distance, varied by the plate distance from the needle, is
another important parameter as it is responsible for providing a collector surface for spun
fibers and enough distance between the tip and collector for solvent evaporation. Other
process parameters include, temperature, humidity, and air velocity in the hood in which
the apparatus is contained.
3.6.2 Solution Parameters In electrospinning hyaluronic acid, there are several key solution parameters that
must be accounted for to achieve successful spinning. As stated previously, HA is
known to have a high viscosity and surface tension. High values of these two parameters
make successful electrospinning extremely challenging. The key solution parameters
investigated throughout this research include solution concentration, viscosity, pH,
solvent evaporation rate, and molecular weight. To ensure successful electrospinning, it
is critical that the viscosity of the HA solutions be controlled. Sodium chloride (NaCl)
26
and polyethylene oxide (PEO) were used as viscosity modifiers. PEO is another
biocompatible, non-toxic, and non-mutagenic polymer that is capable of producing
electrospun nanofibers. Over fifty studies have been published illustrating the potential
applications, successful manipulations, and properties of electrospun PEO fibers. The
possible blending of PEO and HA has not previously been reported in electrospinning.
3.7 Applications for Nanofibers Nanofibers exhibit special properties mainly due to their extremely high surface
to weight ratio compared to conventional nonwovens. Low density, large surface area to
mass, high pore volume, and tight pore size make the nanofiber non-woven mats
appropriate for a wide range of applications from filtration to drug delivery. In
comparison to an average human hair fiber, which is about 50-150 µm, electrospun fibers
are on the order of 100 nm. Those nanofibers used in industrial applications are at a
diameter of 350 nm or less.
Typically, controlled fiber materials can yield products such as braided and
woven structures, conductive fibers, filters, and fiber reinforced support. Braided and
woven nano- & micro- structures can be utilized in applications such as tissue
engineering, the aerospace industry, and military purpose [20]. The use of electrospun
fibers at critical places in advanced composites to improve crack resistance is also
another promising area [20]. Filtration and tissue engineering are currently the two
major areas for nanofiber utilization.
3.7.1 Filtration Nanofibers utilized as filters and filtration systems have been a growing field for
over a decade [20]. Research is growing in this area as scientists attempt to develop
27
nanofibers potentially capable of filtering out viruses, bacteria and hazardous nano-
particles. However, in the case of thin webs, the mechanical properties are poor when not
used in conjunction with a substrate material capable of being processed into a filtration
medium.
Regardless of the weak points involved with nanofibers in filtration, the area
continues to grow as the potential for nanofibers webs is endless. New research is
evolving for the development of a high-tech, nanoscale fiber spinning process capable of
producing nanofibers for high-performance filtration of contaminants, biological agents
and hazardous but very small particles [10]. These novel filtration systems are expected
to be capable of providing protection against such hazardous substances as toxic mold
and infectious agents, including severe acute respiratory syndrome (SARS) and various
strains of influenza [21].
3.7.2 Tissue Engineering Scaffolds In terms of tissue engineering, an ideal scaffold for tissue engineering should be
compatible to the tissue environment. It must not initiate any antigenic or toxic reactions
in the body. The scaffold should be mechanically strong enough in order to maintain
itself inside the body at physiological state. The scaffold should show rapid adherence to
the wound area when implanted. They should either be biodegradable and completely
excreted from the body eventually after regeneration of the new tissue, or they should be
bio-stable and able to resist wear and tear. The small wear particles from the non-
degradable polymer may act as toxic foreign element to the surrounding tissue. Over all,
28
for being available to the patient of all economic classes, the cost of the scaffold has to be
low. Finally, an indefinite shelf life and easy, inexpensive storage is expected from an
ideal synthetic scaffold [2].
Nanofibers are highly promising and effective as their high surface area and
porosity provide the biological functionality necessary for in vivo stability and
maintenance [12]. When selecting polymers for use in tissue engineering scaffolds,
biological function is of high importance as the polymer must be biocompatible with cells
in the body. Biological interactions in the body, the extracellular matrix (ECM), and cell
growth and regulation also aid in mechanical support. Both hyaluronic acid and PEO
(secondary), the polymers of choice throughout this research, are biocompatible, non-
mutagenic, and non-carcinogenic, providing healthy interactions in the body [16,19]. As
a natural non-immunogenic polymer, HA plays a vital role in wound-healing processes, is
a component in the extracellular matrix, and is environmentally sustainable; thus making
it a great candidate as a tissue engineering scaffold matrix. It is also facilitates growth
and movement of fibroblasts as well as controlling hydration [22]. Ideally, once
fabricated, the HA nanofibers would serve as a mesh capable of encapsulating cells.
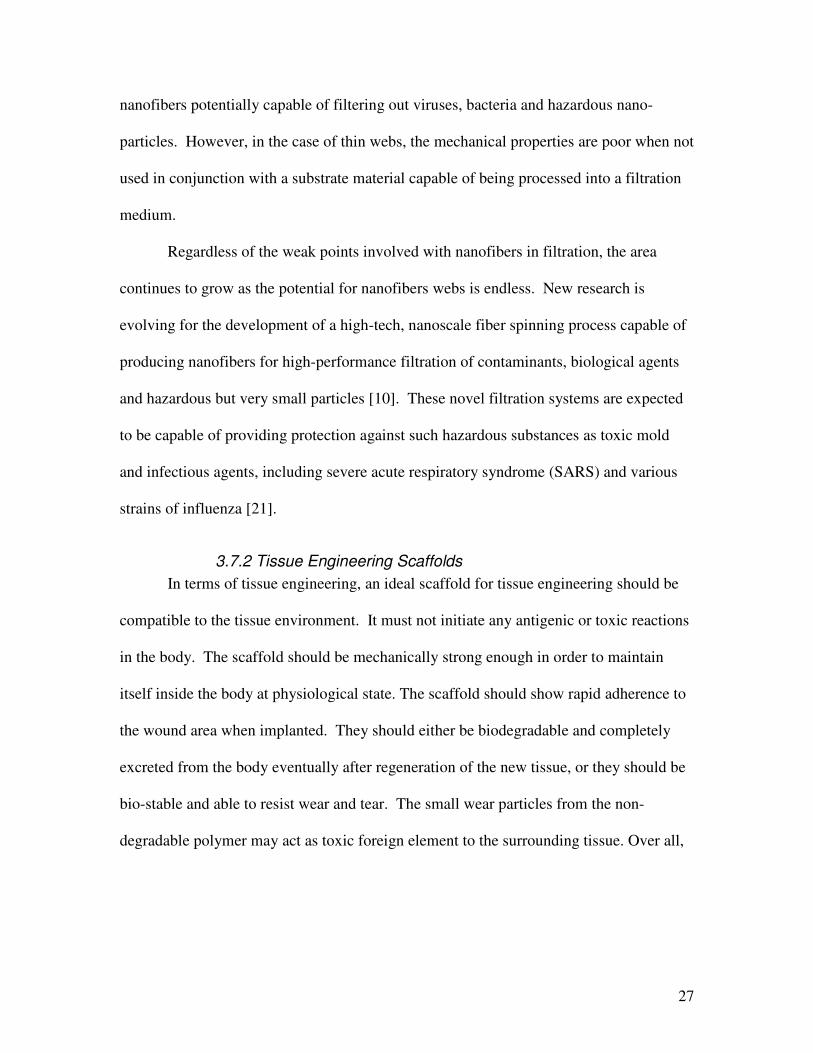
Figure 6 is a depiction of how nanofibers are utilized to grow cells on the
scaffold/mesh or deliver materials to various systems throughout the body. This
HYAFF® scaffold serves as a 3-dimensional matrix for growing the cells that comprise
human skin [23]. The HYAFF® scaffold is a recently developed hyaluronic-acid based
biodegradable polymer, which has been shown to provide successful cell scaffold for
tissue-engineered repair. This new scaffold has been patented by Johnson and Johnson as
the answer to a clinical need for biocompatible and biodegradable structural matrices that
29
facilitate tissue infiltration to repair/regenerate diseased or damaged tissue. Previous
attempts have only used a number of naturally occurring, as well as synthetic
biodegradable materials as scaffolds in the tissue repair process.
Figure 6: HYAFF® 3-dimensional Matrix [24]
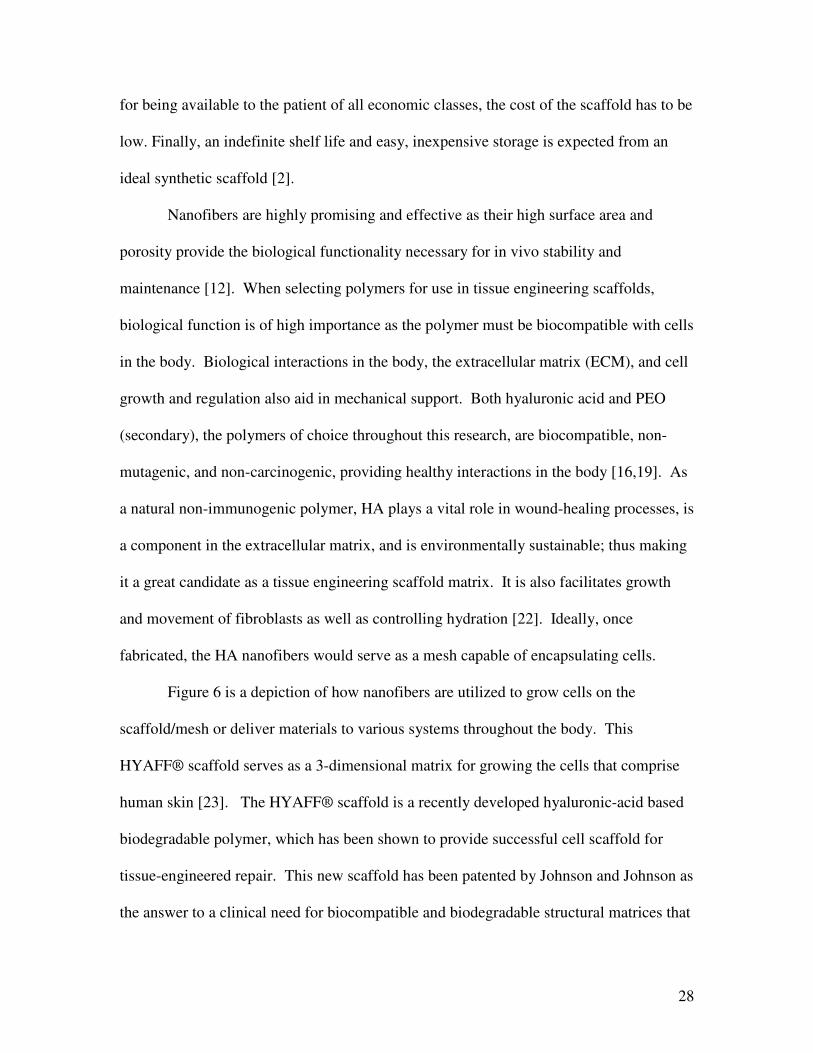
After the matrix, as seen in Figure 6 is formed, researchers have found even more
opportunities for both cell adhesion and cell growth to take place, as seen in Figure 7.
These cells may mimic many bodily functions, for example dermal tissue growth [24].
Figure 7: Illustration of Cell Growth on PEO Nanofibers [24]
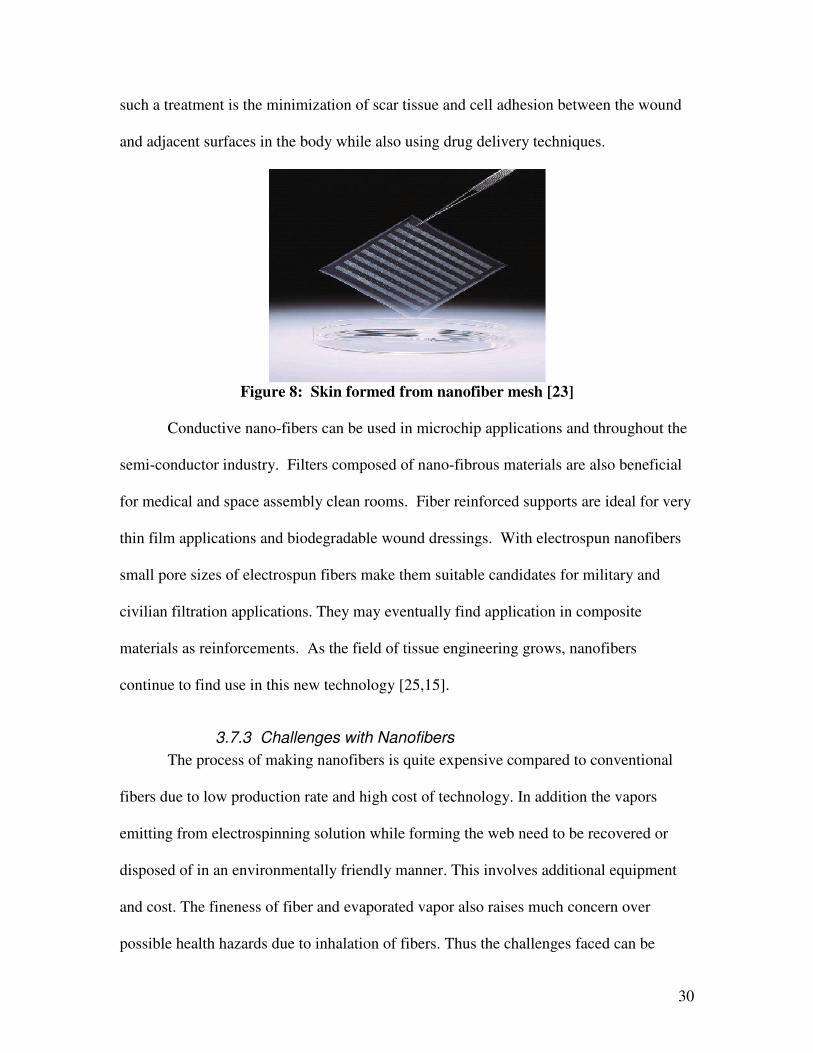
Upon cell growth, the matrix is fabricated into a film covering that operates as
actual skin. This film (as shown in Figure 8) may be utilized both in vivo and ex vivo
for wound treatment, skin lacerations, ulcers, and other bodily wounds. The advantage of
30
such a treatment is the minimization of scar tissue and cell adhesion between the wound
and adjacent surfaces in the body while also using drug delivery techniques.
Figure 8: Skin formed from nanofiber mesh [23]
Conductive nano-fibers can be used in microchip applications and throughout the
semi-conductor industry. Filters composed of nano-fibrous materials are also beneficial
for medical and space assembly clean rooms. Fiber reinforced supports are ideal for very
thin film applications and biodegradable wound dressings. With electrospun nanofibers
small pore sizes of electrospun fibers make them suitable candidates for military and
civilian filtration applications. They may eventually find application in composite
materials as reinforcements. As the field of tissue engineering grows, nanofibers
continue to find use in this new technology [25,15].
3.7.3 Challenges with Nanofibers The process of making nanofibers is quite expensive compared to conventional
fibers due to low production rate and high cost of technology. In addition the vapors
emitting from electrospinning solution while forming the web need to be recovered or
disposed of in an environmentally friendly manner. This involves additional equipment
and cost. The fineness of fiber and evaporated vapor also raises much concern over
possible health hazards due to inhalation of fibers. Thus the challenges faced can be
31
summarized as:
• Economics (processing and production costs) • Health hazards (processing) • Solvent vapor • Packaging/shipping handling
As nanofibers continue to provide exceptional qualities and a range of applications,
research continues in order to find a balance between cost and efficiency [15].
3.8 References 1.) http://www.espintechnologies.com/products.htm 2.) Baumgarten, P. K. Journal of Colloid Interface Science 1971, 36, 71. 3.) Buchko, C. J.; Chen, L. C.; Yu, S.; Martin, D. C. Polymer 1999, 40, 7397. 4.) Deitzel, J. M.; Kleinmeyer, J. D.; Hirvonen, J. K.; BeckTan, N. C Polymer 2001, 42, 8163. 5.) Formhals, A. US Patent 1975504, 1934. 6.) Doshi, J.; Reneker, D. H. Journal of Electrostatics 1995, 35, 151. 7.) Z.-M. Huang, Y.-Z. Zhang, M. Kotaki, S. Ramakrishna, Compos. Sci. Technol. 2003, 63, 2223. 8.) Deitzel, J. M.; Kleinmeyer, J.; Harris, D.; BeckTan, N. C Polymer 2001, 42, 261. 9.) Formhals, A. US Patent 2160962, 1939.568 10.) Formhals, A. US Patent 2187306, 1940. 11.) Jaeger, R.; Bergshoef, M. M.; Batlle, C. M. I.; Holger, S.; Vancso, G. J. Macromol Symp 1998, 127, 141. 12.) Zhang S.P. et al.: Biodegradation of hyaluronic acid derivatives by hyaluronidase. Biomaterials, 15: 359-65, 1994. 13.) Moses, M.; Hohman, M. M.; Shin, Y. M.; Rutledge, G. C.; Brenner, M. P. Phys Fluids 2001, 13, 2201. 14.) Moses, M.; Hohman, M. M.; Shin, Y. M.; Rutledge, G. C.; Brenner, M. P. Phys Fluids 2001, 13, 2221.
32
15.) Larrondo, L.; Mandley, R. St. J. J Polym Sci: Polymer Physics Edn 1981, 921. 16.) Um, Chu, D.F. Fang, B. Hsiao, A. Okamoto and B. Chu, Electro-spinning and electro-blowing of hyaluronic acid, Biomacromolecules 5 (2004), pp. 1428–1436. 17.) Shin, Y. M.; Hohman, M. M.; Brenner, M. P.; Rutledge, G. C. Polymer 2001, 42, 9955. 18.) Taylor, G. I. Proc Roy Soc London 1969, A313, 453. 19.)Wang XF, Um IC, Fang DF, et al. Formation of water-resistant hyaluronic acid nanofibers by blowing-assisted electro-spinning and non-toxic post treatments. Polymer 46 (13): 4853-4867. June 17 2005 20.) Warner, S. B.; Buer, A.; Grimler, M.; Ugbolue, S. C.; Rutledge, G. C.; Shin, M. Y. National Textile Center Annual Report November 1998, 83. 21.)Y. Liu, X. Z. Shu, S. D. Gray, G. D. Prestwich, J. Biomed. Mater. Res. 2004, 68A, 142. 22.) Z.-M. Huang, Y. Z. Zhang, S. Ramakrishna, C. T. Lim, Polymer 2004, 45, 5361.
23.) Zigang, G.; Cho, J; Goh, E.; Hin, L. Selection of cell source for ligament tissue engineering. Lee Cell Transplant. 2005 ;14:573-83
24.) http://europa.eu.int/comm/research/press/2000/pr2703en-an.html 25.) Larrondo, L.; Mandley, R. St. J. J Polym Sci: Polymer Physics Edn 1981, 909. 26.) Hayati, I.; Bailey, A. I.; Tadros, T. F. J Colloid Interface Sci 1987, 117, 205. 27.) MacDiarmid, A. G.; Jones, Jr., W. E.; Norris, I. D.; Gao, J.; Johnson, Jr, A. T.; Pinto, N. J.; Hone, J.; Han, B.; Ko, F. K.; Okuzaki, H.; Llaguno, M. Synthetic Metals 2001, 119, 27. 28.) Reneker, D. H.; Chun, I. Nanotechnology 1996, 7, 216. 29.) X. Z. Shu, Y. Liu, F. Paulo, G. D. Prestwich, Biomaterials 2003, 24, 3825 30.) Y. S. Choi, S. R. Hong, Y. M. Lee, K. W. Song, M. H. Park, Y. S. Nam, J. Biomed. Mater. Res., Part B: Appl. Biomater. 1999, 48, 631. 31.) http://www.donaldson.com/en/filtermedia/support/faq.html
33
4.0 EXPERIMENTAL
4.1 Materials Three types of hyaluronic acid were utilized in this study. In preliminary trials,
HA with a molecular weight of 1.5 million was obtained from HyluMed®, item number
4876-05. For the remainder of the investigation, two types of HA were used: high
molecular weight HA (MW=1 million from the distributor FMC Biopolymer ACS in
Norway) and low molecular weight HA (MW=680,000 from Hyaluronan Inc).
Polyethylene oxide, PEO (MW=900,000) and polyvinyl alcohol (MW = 126,000) were
obtained from Scientific Polymer Products. All of the HA samples were in the form of a
sodium salt (sodium hyaluronate) and all polymers were used as received. Deionized,
distilled water was exclusively used as a solvent and all other reagents (e.g. sodium
chloride) were analytical grade or better, obtained from Sigma-Aldrich and used as
received.
Samples were made by dissolving the HA powder with deionized water solutions
and NaCl solutions. The NaCl solutions were comprised of analytical grade NaCl
crystals of different concentrations (i.e. 1M and 0.5M) as a dilution technique to possibly
decrease the overall solution viscosity, thus solution concentration, of the HA solutions,
see Chapter 5. In addition, blended solutions of HA:PEO were made from HA powder
and PEO powder both dissolved in deionized water. The total weight of the polymers
was used to calculate the solution concentration as described in Chapter 5.
4.2 Rheological Measurements HA solutions were measured as a function of polymer concentration and salt. The
rheological behavior was measured using an ATS Rheosystems Stresstech HR rheometer
at 25ºC. The instrument was utilized with a parallel plate fixture at a gap distance of 0.4
34
mm for all samples. The zero shear rate viscosity (�o) was determined from the
Newtonian plateau for each sample.
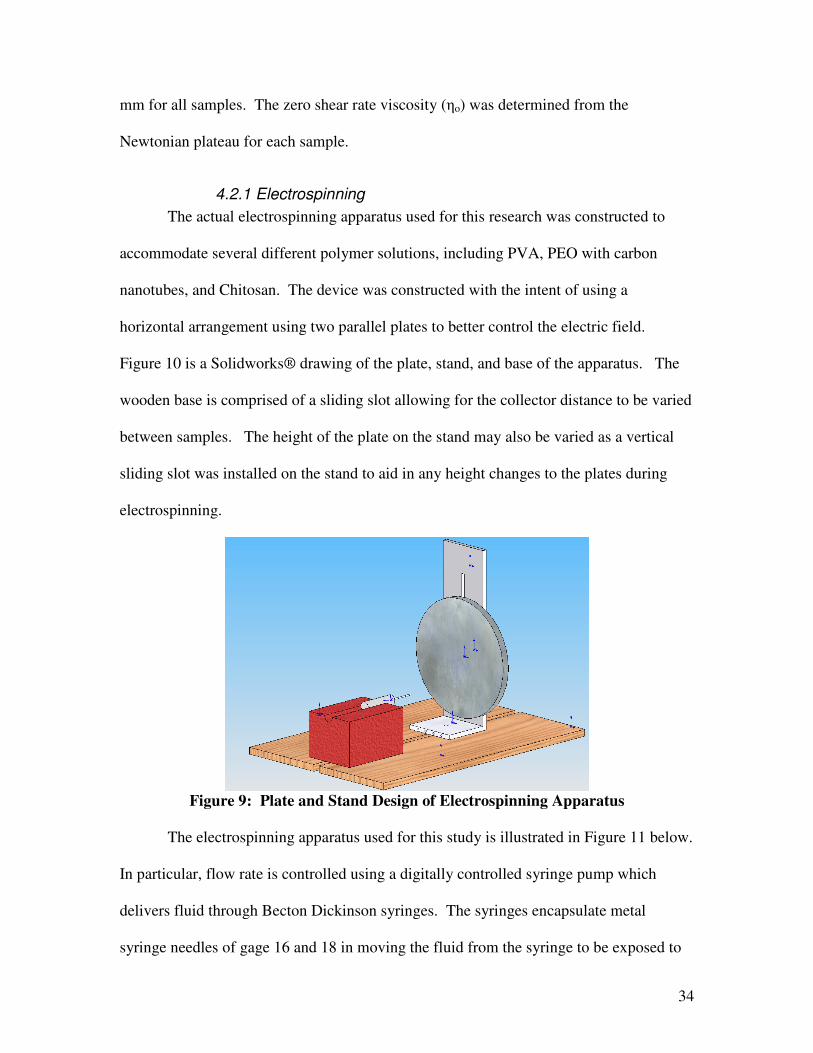
4.2.1 Electrospinning The actual electrospinning apparatus used for this research was constructed to
accommodate several different polymer solutions, including PVA, PEO with carbon
nanotubes, and Chitosan. The device was constructed with the intent of using a
horizontal arrangement using two parallel plates to better control the electric field.
Figure 10 is a Solidworks® drawing of the plate, stand, and base of the apparatus. The
wooden base is comprised of a sliding slot allowing for the collector distance to be varied
between samples. The height of the plate on the stand may also be varied as a vertical
sliding slot was installed on the stand to aid in any height changes to the plates during
electrospinning.
Figure 9: Plate and Stand Design of Electrospinning Apparatus
The electrospinning apparatus used for this study is illustrated in Figure 11 below.
In particular, flow rate is controlled using a digitally controlled syringe pump which
delivers fluid through Becton Dickinson syringes. The syringes encapsulate metal
syringe needles of gage 16 and 18 in moving the fluid from the syringe to be exposed to
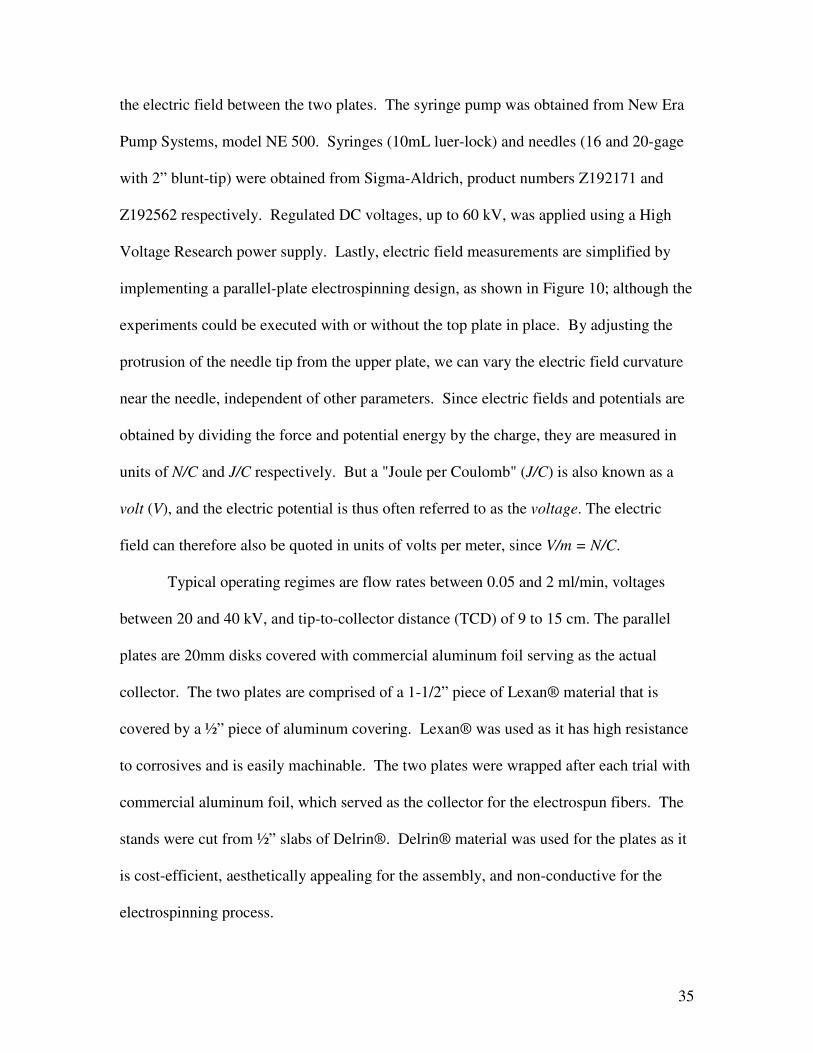
35
the electric field between the two plates. The syringe pump was obtained from New Era
Pump Systems, model NE 500. Syringes (10mL luer-lock) and needles (16 and 20-gage
with 2” blunt-tip) were obtained from Sigma-Aldrich, product numbers Z192171 and
Z192562 respectively. Regulated DC voltages, up to 60 kV, was applied using a High
Voltage Research power supply. Lastly, electric field measurements are simplified by
implementing a parallel-plate electrospinning design, as shown in Figure 10; although the
experiments could be executed with or without the top plate in place. By adjusting the
protrusion of the needle tip from the upper plate, we can vary the electric field curvature
near the needle, independent of other parameters. Since electric fields and potentials are
obtained by dividing the force and potential energy by the charge, they are measured in
units of N/C and J/C respectively. But a "Joule per Coulomb" (J/C) is also known as a
volt (V), and the electric potential is thus often referred to as the voltage. The electric
field can therefore also be quoted in units of volts per meter, since V/m = N/C.
Typical operating regimes are flow rates between 0.05 and 2 ml/min, voltages
between 20 and 40 kV, and tip-to-collector distance (TCD) of 9 to 15 cm. The parallel
plates are 20mm disks covered with commercial aluminum foil serving as the actual
collector. The two plates are comprised of a 1-1/2” piece of Lexan® material that is
covered by a ½” piece of aluminum covering. Lexan® was used as it has high resistance
to corrosives and is easily machinable. The two plates were wrapped after each trial with
commercial aluminum foil, which served as the collector for the electrospun fibers. The
stands were cut from ½” slabs of Delrin®. Delrin® material was used for the plates as it
is cost-efficient, aesthetically appealing for the assembly, and non-conductive for the
electrospinning process.
36
Figure 10: Digital Image of Electrospinning Apparatus
4.2 Characterization Techniques
Quantitative analysis of the electrospinning process falls into these categories:
solution properties, operating parameters, and fiber characterization.
4.3 Solution properties The relevant fluid properties are density, viscosity, surface tension, pH,
conductivity, permittivity, and visco-elasticity. Of these, viscosity, pH, and conductivity
appear to play the greatest role in the electrospinning of dilute solutions. For all the
modeling studies, the solutions used were confirmed to be shear-thinning for the range of
wall shear rates expected to occur at the needle tip. A StressTech HR rheometer from
Reologica Instruments and ATS Systems was used to investigate the rheological
37
properties, mainly viscosity vs. shear rate, of the polymer solutions. With the assistance
of Rheologica Rheo-Explorer 5.0 software, data looking at the viscosity, shear rate, and
variations in each amongst solutions was obtained. See Section 5.0 “Data & Analysis.”
4.3.1 Rheology Measurements Rheology can be defined as the science of flow and deformation of materials. To
determine the consistency of a material both its viscosity and elasticity parameters must
be studied; the viscosity of a material is related to its resistance to flow, while the
elasticity is related to its degree of structure. A rheometer measures the rheological
properties as a function of rate or frequency of deformation; for example, a rheometer
imposes a shear flow on a system and it measures the resulting stresses or, it could
impose a shearing stress and measure the resulting shearing rate. Different flow
geometries exist in order to impose a shearing flow: sliding plates, concentric cylinders,
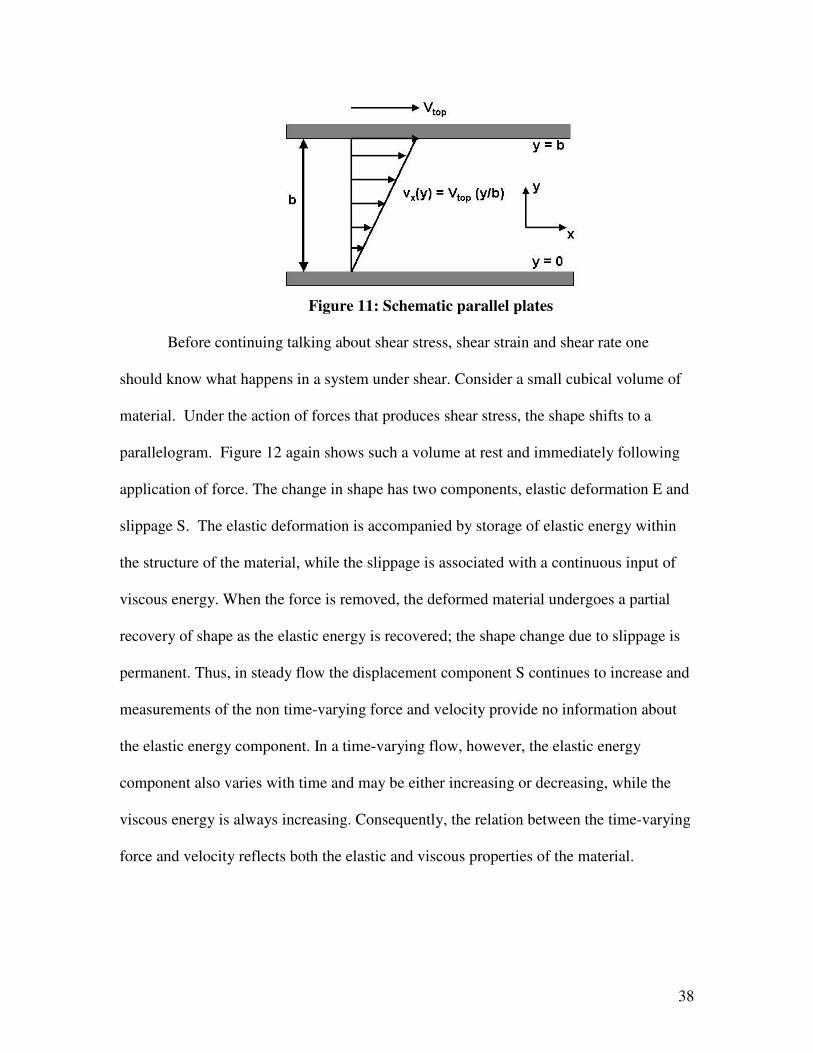
cone and plate, parallel disks, capillary, slit flow and axial annulus flow. The flow
geometry used for this research was that of parallel plates (see Figure 12) due to the
known high solution viscosities of the samples. In addition, the ability to “squeeze”
samples, like the ones being studied, into a conical shape is very difficult; while with
parallel plates, both viscous and non-viscous samples may be easily loaded, and data may
be obtained within minutes of preparing the sample. Parallel plates are also recommended
for time dependent studies, like stress relaxation.
38
Figure 11: Schematic parallel plates
Before continuing talking about shear stress, shear strain and shear rate one
should know what happens in a system under shear. Consider a small cubical volume of
material. Under the action of forces that produces shear stress, the shape shifts to a
parallelogram. Figure 12 again shows such a volume at rest and immediately following
application of force. The change in shape has two components, elastic deformation E and
slippage S. The elastic deformation is accompanied by storage of elastic energy within
the structure of the material, while the slippage is associated with a continuous input of
viscous energy. When the force is removed, the deformed material undergoes a partial
recovery of shape as the elastic energy is recovered; the shape change due to slippage is
permanent. Thus, in steady flow the displacement component S continues to increase and
measurements of the non time-varying force and velocity provide no information about
the elastic energy component. In a time-varying flow, however, the elastic energy
component also varies with time and may be either increasing or decreasing, while the
viscous energy is always increasing. Consequently, the relation between the time-varying
force and velocity reflects both the elastic and viscous properties of the material.
39
Shear stress, �, can be defined as the force that a flowing liquid exerts on a
surface, per unit area of that surface, in the direction parallel to the flow. Based on this,
shear viscosity can be defined as:
� = �/� (Equation 4)
where viscosity (�) is the ratio of shear stress to shear rate. Shear rate may be defined as
the rate of change of shear stress or the velocity gradient (as seen in Figure 12)
perpendicular to the direction of shear flow (dv/dx). Shear rate is measured in units of
1/s or s-1. The units of viscosity are typically measured in Pascal-Seconds (Pa.s) or
Poise (P).
4.3.2 Operating parameters
The relevant operating parameters are flow rate, electric field strength, and
electric current flow between the needle tip and collector. The volumetric flow rate is
closely controlled through the use of a syringe pump. Field strength may be varied by
changing either the applied voltage or the distance over which the voltage drop to ground
occurs. Both variables were studied. Thinning of the jet depends principally on the field
strength; however, the development of instabilities in the jet requires sufficient distance
of travel for the instabilities to grow in amplitude. The total electric current has the
ability to provide an indirect measure of the total surface charge density on the jet.
Surface charge density, in turn, is believed to play a major role in determining jet
stability. Jet current is measured by monitoring the voltage drop across a resistor
between the collector and ground, and correcting for any displacement current between
the parallel plates.
40
4.3.3 Fiber characterization Fiber diameter distributions are measured using scanning electron microscopy
(SEM). Samples of non-woven webs were coated with gold palladium using a Denton
Vacuum Desk II sputtering machine and observed using a JEOL, Inc. Field Emission
model J600F scanning electron microscope, operating at 5 kV. Fiber diameters were
sampled by measuring the width of those fibers intersected by a straight line drawn at
random across the image
4.3.3.1 Scanning Electron Microscopy (SEM)
All scanning electron microscopes consist of a column which generates a beam of
electrons, a specimen chamber where the electron interacts with the sample, detectors to
monitor the different signals that result from the electron beam/sample interaction and a
viewing system that builds an image from the detector signal. The electron column
consists of an electron gun and two or more electron lenses. The electron gun, which
could be either a thermionic or a field emission source, is responsible for the production
of electrons and the acceleration of these, to a range of 1 – 40 keV. These electrons,
coming out of the gun, produce a beam with large diameter. Before continuing, it is
important to know that the final beam diameter, also known as the spot size, plus the
amount of current in the final probe, limits the image resolution in the SEM; that is why
operators have to play with different parameters, until the “right combination” of
parameters is found, in order to obtain high quality images. Electron lenses are used to
reduce the diameter of the beam coming out of the gun, placing a small focused electron
beam on the specimen. This results in an interaction between the beam and the near
surface region of the specimen up to certain depth (1-2 �m) and generates signals used to
41
form an image. The deflection system is responsible for scanning the beam along a line
and then displacing the line position for the next scan so that a rectangular raster is
generated on both the specimen and the viewing screen. Two pairs of deflection coils are
responsible for the raster of the beam. Magnification is defined as the ratio between the
linear size of the viewing screen to the linear size of the raster on the sample. High
magnifications are obtained when a smaller raster width appears larger when displayed
on the viewing screen. The two signals most often used to produce images are secondary
electrons (SE) and backscattered electrons (BSE); these are collected by an Everhart –
Thornley (E – T) detector.
4.4 Preliminary Results To verify the functionality of the electrospinning apparatus (as described in
Section 4.1), PEO and PVA were electrospun into nanofiber, non woven mats, as
illustrated in Figures 13 and 15. First, the two polymer solutions were electrospun to find
the threshold for successful electrospinning. Second, the electrospun samples were
compared to reported PEO electrospun nanofibers to evaluate the fiber properties. Fiber
diameter ranged from 100 nm to 250 nm for both the PEO and PVA nanofiobers, which
is very similar to recent reports. In initial experiments, 2 wt% PEO and PVA solutions
were produced from 2 grams of 900,000 MW PEO and 146,000 MW PVA with 100 mL
of distilled water, respectively. Next, 5 wt% PEO or PVA solutions were electrospun (5
grams of PEO or PVA). All images reveal smooth, bead-free, and continuous fiber
strands of polymer PEO and PVA. These images were used to verify the critical
parameters needed for fabricating fibers of the various polymers, as summarized for PVA
in Table 5.
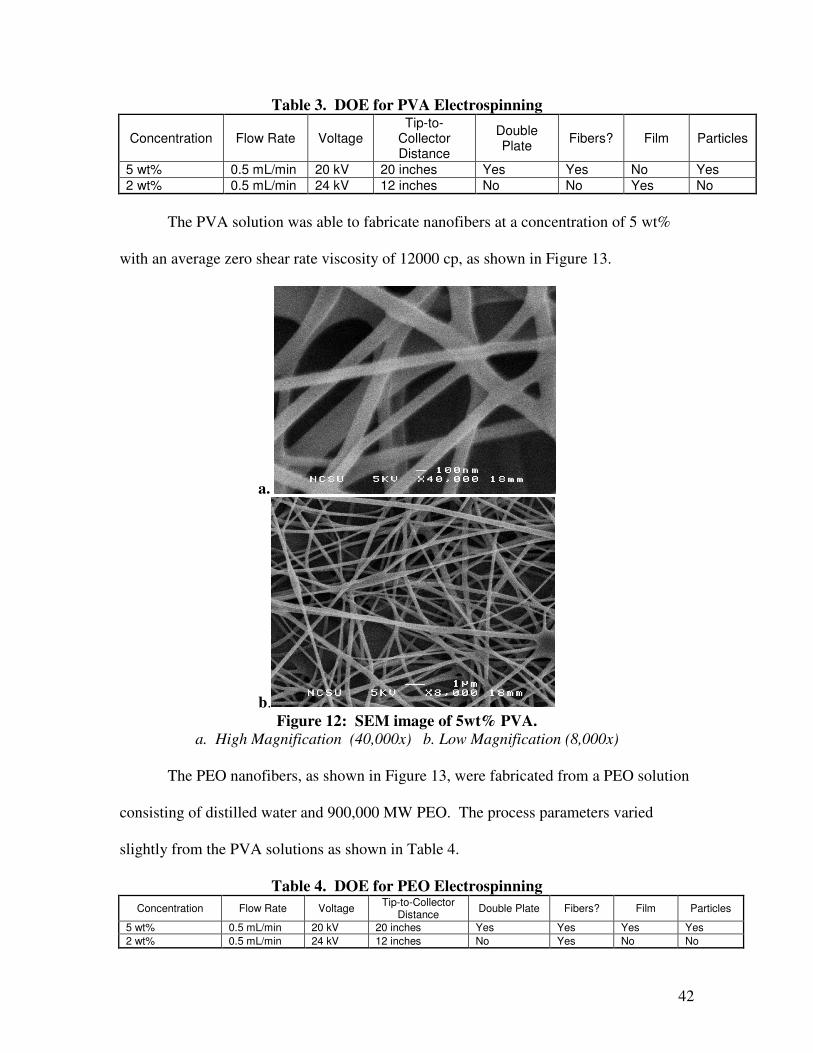
42
Table 3. DOE for PVA Electrospinning
Concentration Flow Rate Voltage Tip-to-
Collector Distance
Double Plate Fibers? Film Particles
5 wt% 0.5 mL/min 20 kV 20 inches Yes Yes No Yes 2 wt% 0.5 mL/min 24 kV 12 inches No No Yes No
The PVA solution was able to fabricate nanofibers at a concentration of 5 wt%
with an average zero shear rate viscosity of 12000 cp, as shown in Figure 13.
a.
b. Figure 12: SEM image of 5wt% PVA.
a. High Magnification (40,000x) b. Low Magnification (8,000x)
The PEO nanofibers, as shown in Figure 13, were fabricated from a PEO solution
consisting of distilled water and 900,000 MW PEO. The process parameters varied
slightly from the PVA solutions as shown in Table 4.
Table 4. DOE for PEO Electrospinning Concentration Flow Rate Voltage Tip-to-Collector
Distance Double Plate Fibers? Film Particles
5 wt% 0.5 mL/min 20 kV 20 inches Yes Yes Yes Yes 2 wt% 0.5 mL/min 24 kV 12 inches No Yes No No
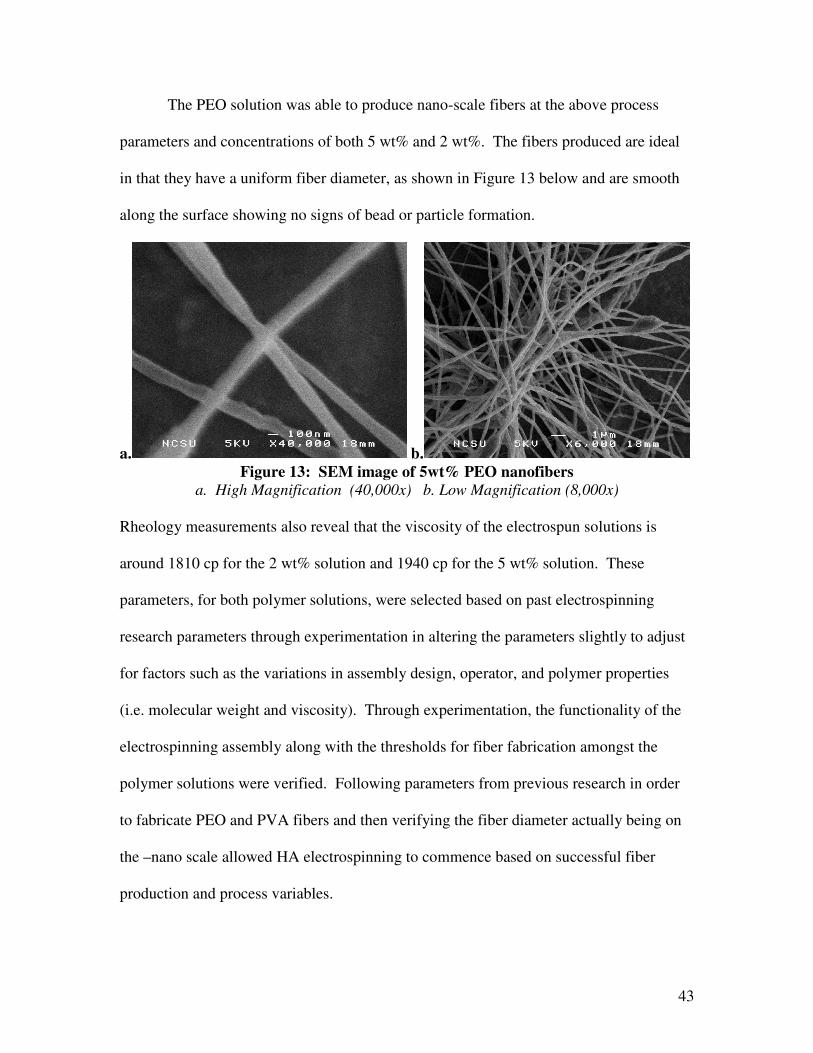
43
The PEO solution was able to produce nano-scale fibers at the above process
parameters and concentrations of both 5 wt% and 2 wt%. The fibers produced are ideal
in that they have a uniform fiber diameter, as shown in Figure 13 below and are smooth
along the surface showing no signs of bead or particle formation.
a. b. Figure 13: SEM image of 5wt% PEO nanofibers
a. High Magnification (40,000x) b. Low Magnification (8,000x)
Rheology measurements also reveal that the viscosity of the electrospun solutions is
around 1810 cp for the 2 wt% solution and 1940 cp for the 5 wt% solution. These
parameters, for both polymer solutions, were selected based on past electrospinning
research parameters through experimentation in altering the parameters slightly to adjust
for factors such as the variations in assembly design, operator, and polymer properties
(i.e. molecular weight and viscosity). Through experimentation, the functionality of the
electrospinning assembly along with the thresholds for fiber fabrication amongst the
polymer solutions were verified. Following parameters from previous research in order
to fabricate PEO and PVA fibers and then verifying the fiber diameter actually being on
the –nano scale allowed HA electrospinning to commence based on successful fiber
production and process variables.
44
5.0 DATA & ANALYSIS The goal of this research is to produce biopolymer nanofibers of hyaluronic acid
via electrospinning. The challenges associated with hyaluronic acid include its high
solution viscosity and surface tension which are both parameters within the
electrospinning process that contribute heavily to successful fiber formation. In order to
reduce the viscosity of the polymer, two different methods were used: addition of
sodium chloride (NaCl) and blending with biocompatible polymers that readily
electrospin, such as polyethylene oxide (PEO) and polyvinyl alcohol (PVA). Both
polymers, PEO and PVA, are highly capable of successful electrospinning for the
production of nanofibers. Indeed, after our electrospinning apparatus was developed and
assembled (refer to Section 4.2.1), PEO and PVA were electrospun to verify the
functionality of our device. Once the successful operation of the electrospinning
apparatus was established, the ability to form HA nanofibers from solutions of HA at
various concentrations and molecular weight, with and with out NaCl, and with and with
out PEO or PVA were investigated.
5.1 Design of Experiment A Design-of-Experiment, see Chapter 10 Appendix A, was designed to include all
process and solution parameters to verify the threshold for successful electrospinning.
However, at each of the four concentrations (2 wt%, 1.5 wt%, 1 wt%, 0.5 wt%), there
was no fiber production. Instead, electro-spraying of the polymer solution took place at
the end of the needle tip. This electro-spraying phenomenon results in a film-like glaze
over the collector surface, resulting in neither fiber nor particle production. At voltages
exceeding 20 kv, there was significant spraying of the polymer but no fiber production
based on all parameters throughout the process. The spraying is believed to have been a
45
combination of the viscous solution interacting with the high voltage field but the
polymer was unable to overcome such a high solution viscosity in order to pull fibrous
materials from the end of the Taylor cone.
With this, the addition of salt and blending was definitely seen as a necessity in
order to reduce the solution viscosity for fiber formation. After each of the HA solutions
were made and electrospun with no success the HA solutions with sodium chloride
(NaCl) and blended solutions of HA-PEO and HA-PVA were prepared to determine if a
reduction in solution viscosity would take place and thus aid in fiber production through
electrospinning. Blending mechanisms allowed for an overall decrease in solution
viscosity while still providing optimal fiber properties for application use.
5.2. Processing effects on the performance of electrospinning
5.2.1 Effect of HA concentration Polymer concentration has been known as one of the key parameters in
electrospinning because it determines the solution viscosity, the polymer chain
entanglements that are essential for successful operation and the amount of solvent that
must be removed in the electrospinning process. The solution concentration also plays an
important role in blowing-assisted electrospinning. SEM results of electro-spun HA
mats prepared over a narrow concentration range from 1.0 wt% to 2.0 wt%, appeared to
be an optimal concentration range for electro-spinning of HA at the chosen conditions.
At higher solution concentrations and a high molecular weight (MW=1 million), the
electric force could not overcome the high viscosity and the surface tension of the fluid,
resulting in the failure to produce a stable jet stream. The initial concentration used for
the HA samples, was at 2 wt%. This 2 wt% designation allowed for incremental
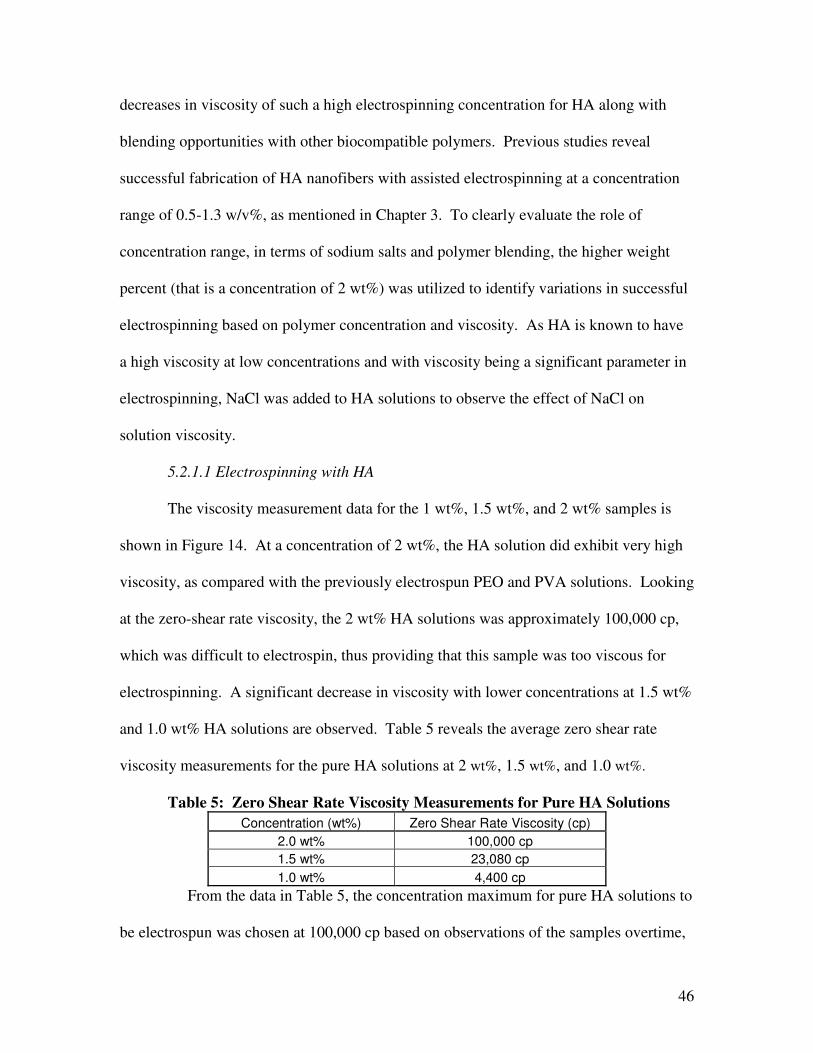
46
decreases in viscosity of such a high electrospinning concentration for HA along with
blending opportunities with other biocompatible polymers. Previous studies reveal
successful fabrication of HA nanofibers with assisted electrospinning at a concentration
range of 0.5-1.3 w/v%, as mentioned in Chapter 3. To clearly evaluate the role of
concentration range, in terms of sodium salts and polymer blending, the higher weight
percent (that is a concentration of 2 wt%) was utilized to identify variations in successful
electrospinning based on polymer concentration and viscosity. As HA is known to have
a high viscosity at low concentrations and with viscosity being a significant parameter in
electrospinning, NaCl was added to HA solutions to observe the effect of NaCl on
solution viscosity.
5.2.1.1 Electrospinning with HA
The viscosity measurement data for the 1 wt%, 1.5 wt%, and 2 wt% samples is
shown in Figure 14. At a concentration of 2 wt%, the HA solution did exhibit very high
viscosity, as compared with the previously electrospun PEO and PVA solutions. Looking
at the zero-shear rate viscosity, the 2 wt% HA solutions was approximately 100,000 cp,
which was difficult to electrospin, thus providing that this sample was too viscous for
electrospinning. A significant decrease in viscosity with lower concentrations at 1.5 wt%
and 1.0 wt% HA solutions are observed. Table 5 reveals the average zero shear rate
viscosity measurements for the pure HA solutions at 2 wt%, 1.5 wt%, and 1.0 wt%.
Table 5: Zero Shear Rate Viscosity Measurements for Pure HA Solutions Concentration (wt%) Zero Shear Rate Viscosity (cp)
2.0 wt% 100,000 cp 1.5 wt% 23,080 cp 1.0 wt% 4,400 cp
From the data in Table 5, the concentration maximum for pure HA solutions to
be electrospun was chosen at 100,000 cp based on observations of the samples overtime,
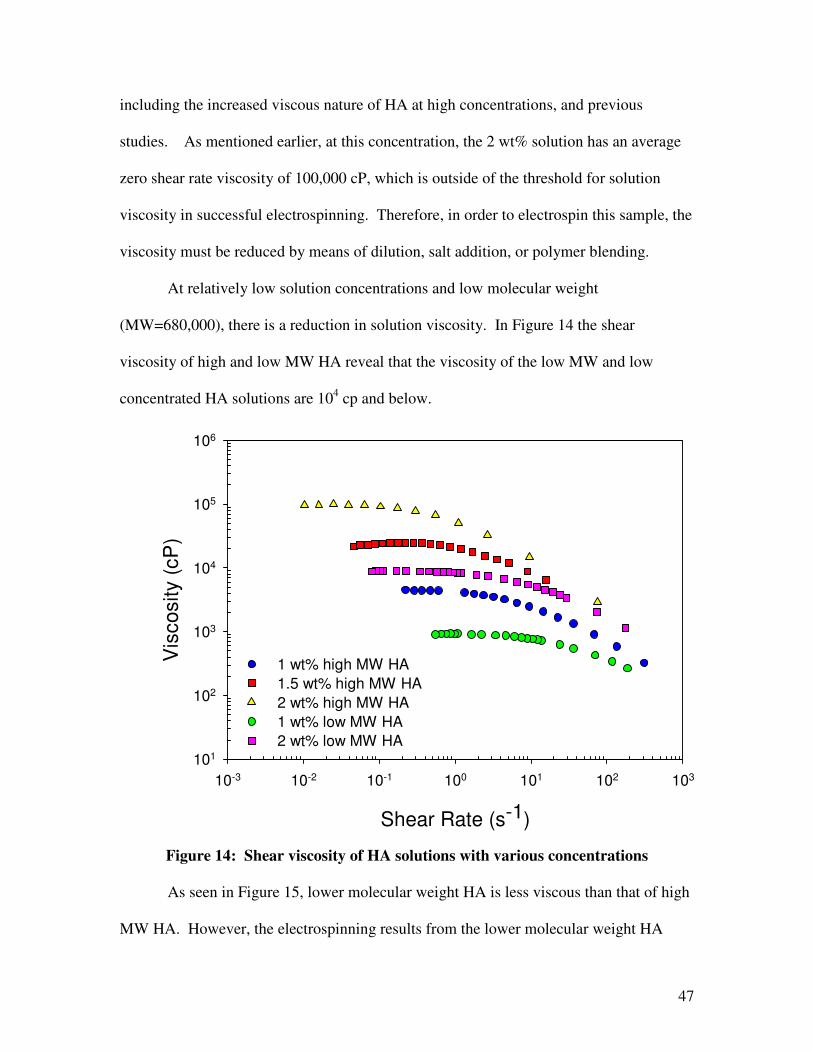
47
including the increased viscous nature of HA at high concentrations, and previous
studies. As mentioned earlier, at this concentration, the 2 wt% solution has an average
zero shear rate viscosity of 100,000 cP, which is outside of the threshold for solution
viscosity in successful electrospinning. Therefore, in order to electrospin this sample, the
viscosity must be reduced by means of dilution, salt addition, or polymer blending.
At relatively low solution concentrations and low molecular weight
(MW=680,000), there is a reduction in solution viscosity. In Figure 14 the shear
viscosity of high and low MW HA reveal that the viscosity of the low MW and low
concentrated HA solutions are 104 cp and below.
Shear Rate (s-1)
10-3 10-2 10-1 100 101 102 103
Vis
cosi
ty (c
P)
101
102
103
104
105
106
1 wt% high MW HA 1.5 wt% high MW HA2 wt% high MW HA 1 wt% low MW HA2 wt% low MW HA
Figure 14: Shear viscosity of HA solutions with various concentrations
As seen in Figure 15, lower molecular weight HA is less viscous than that of high
MW HA. However, the electrospinning results from the lower molecular weight HA
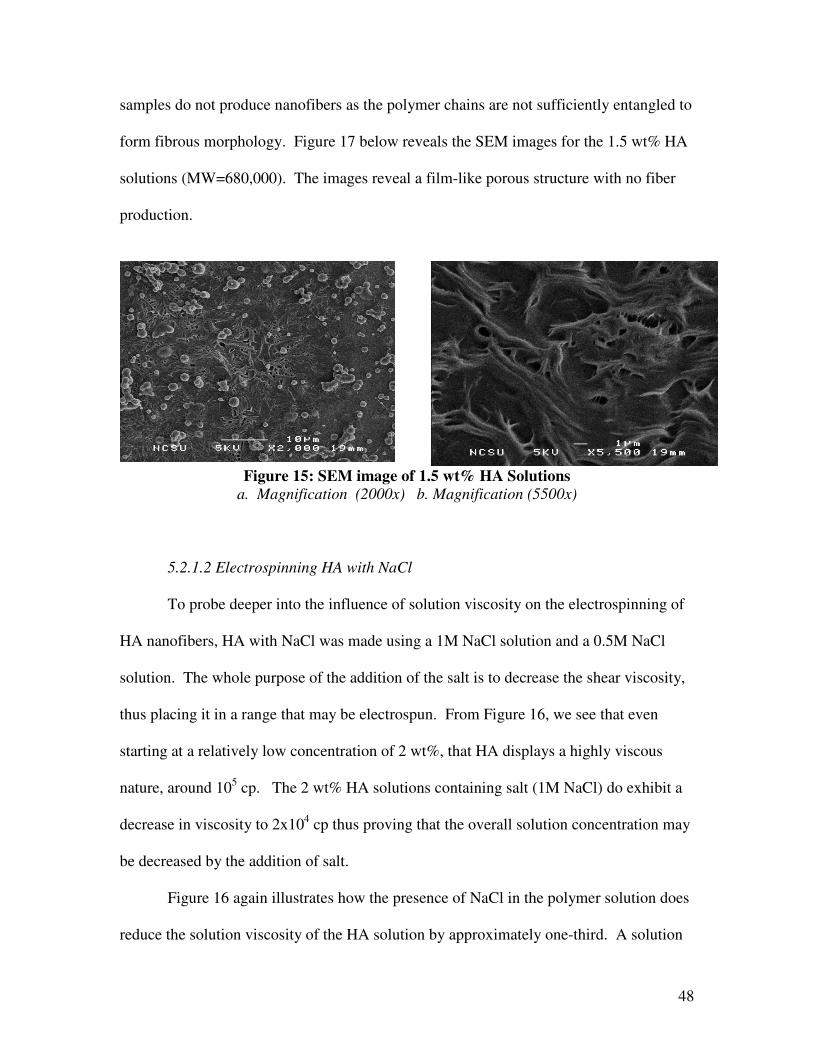
48
samples do not produce nanofibers as the polymer chains are not sufficiently entangled to
form fibrous morphology. Figure 17 below reveals the SEM images for the 1.5 wt% HA
solutions (MW=680,000). The images reveal a film-like porous structure with no fiber
production.
Figure 15: SEM image of 1.5 wt% HA Solutions
a. Magnification (2000x) b. Magnification (5500x)
5.2.1.2 Electrospinning HA with NaCl
To probe deeper into the influence of solution viscosity on the electrospinning of
HA nanofibers, HA with NaCl was made using a 1M NaCl solution and a 0.5M NaCl
solution. The whole purpose of the addition of the salt is to decrease the shear viscosity,
thus placing it in a range that may be electrospun. From Figure 16, we see that even
starting at a relatively low concentration of 2 wt%, that HA displays a highly viscous
nature, around 105 cp. The 2 wt% HA solutions containing salt (1M NaCl) do exhibit a
decrease in viscosity to 2x10⁴ cp thus proving that the overall solution concentration may
be decreased by the addition of salt.
Figure 16 again illustrates how the presence of NaCl in the polymer solution does
reduce the solution viscosity of the HA solution by approximately one-third. A solution
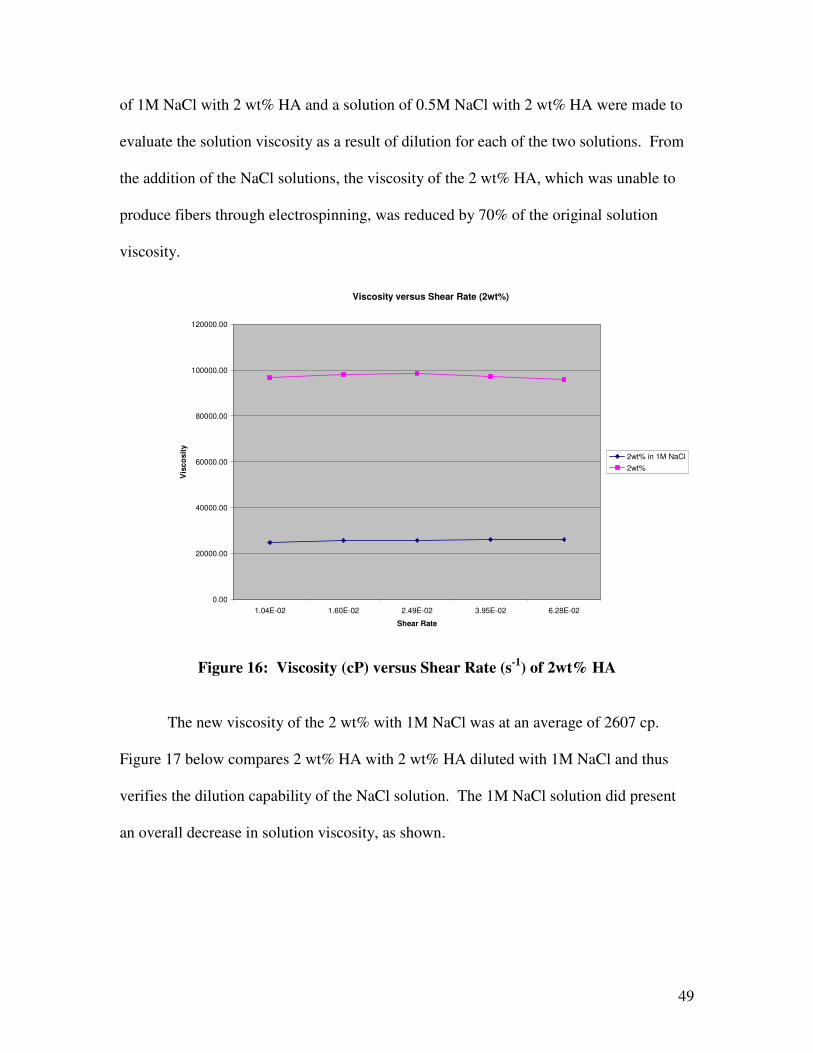
49
of 1M NaCl with 2 wt% HA and a solution of 0.5M NaCl with 2 wt% HA were made to
evaluate the solution viscosity as a result of dilution for each of the two solutions. From
the addition of the NaCl solutions, the viscosity of the 2 wt% HA, which was unable to
produce fibers through electrospinning, was reduced by 70% of the original solution
viscosity.
Viscosity versus Shear Rate (2wt%)
0.00
20000.00
40000.00
60000.00
80000.00
100000.00
120000.00
1.04E-02 1.60E-02 2.49E-02 3.95E-02 6.28E-02
Shear Rate
Vis
cosi
ty
2wt% in 1M NaCl2wt%
Figure 16: Viscosity (cP) versus Shear Rate (s-1) of 2wt% HA
The new viscosity of the 2 wt% with 1M NaCl was at an average of 2607 cp.
Figure 17 below compares 2 wt% HA with 2 wt% HA diluted with 1M NaCl and thus
verifies the dilution capability of the NaCl solution. The 1M NaCl solution did present
an overall decrease in solution viscosity, as shown.
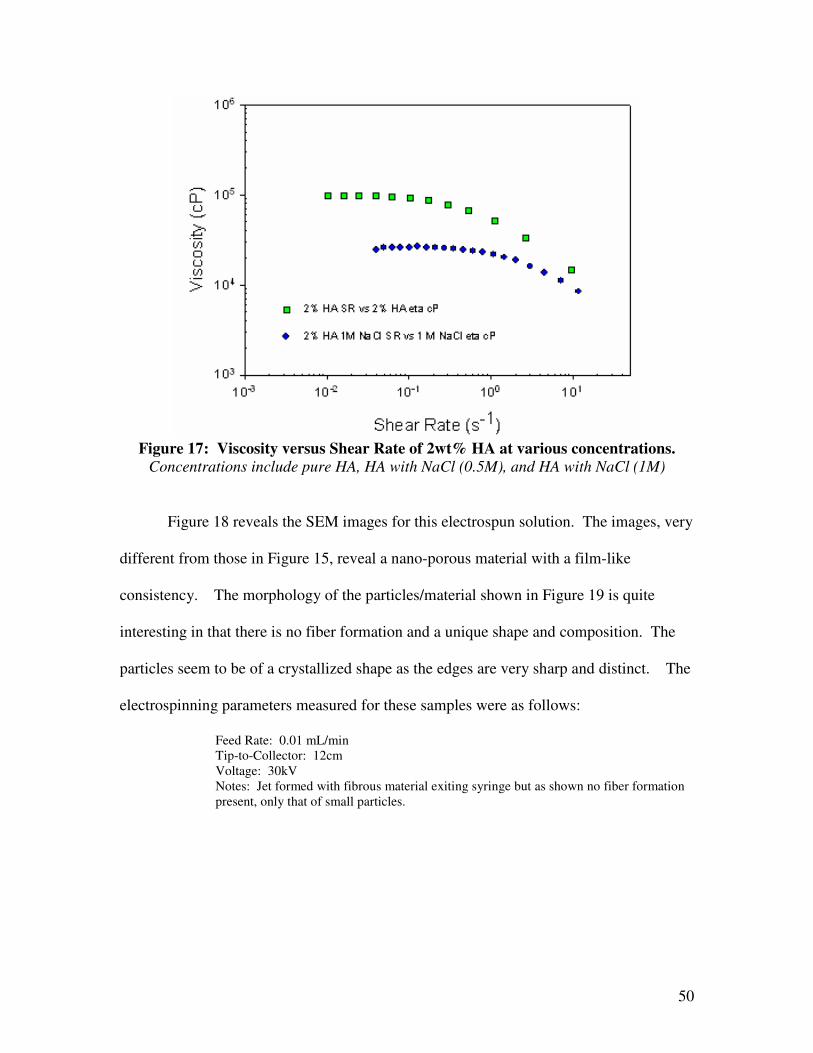
50
Figure 17: Viscosity versus Shear Rate of 2wt% HA at various concentrations.
Concentrations include pure HA, HA with NaCl (0.5M), and HA with NaCl (1M)
Figure 18 reveals the SEM images for this electrospun solution. The images, very
different from those in Figure 15, reveal a nano-porous material with a film-like
consistency. The morphology of the particles/material shown in Figure 19 is quite
interesting in that there is no fiber formation and a unique shape and composition. The
particles seem to be of a crystallized shape as the edges are very sharp and distinct. The
electrospinning parameters measured for these samples were as follows:
Feed Rate: 0.01 mL/min Tip-to-Collector: 12cm Voltage: 30kV Notes: Jet formed with fibrous material exiting syringe but as shown no fiber formation present, only that of small particles.
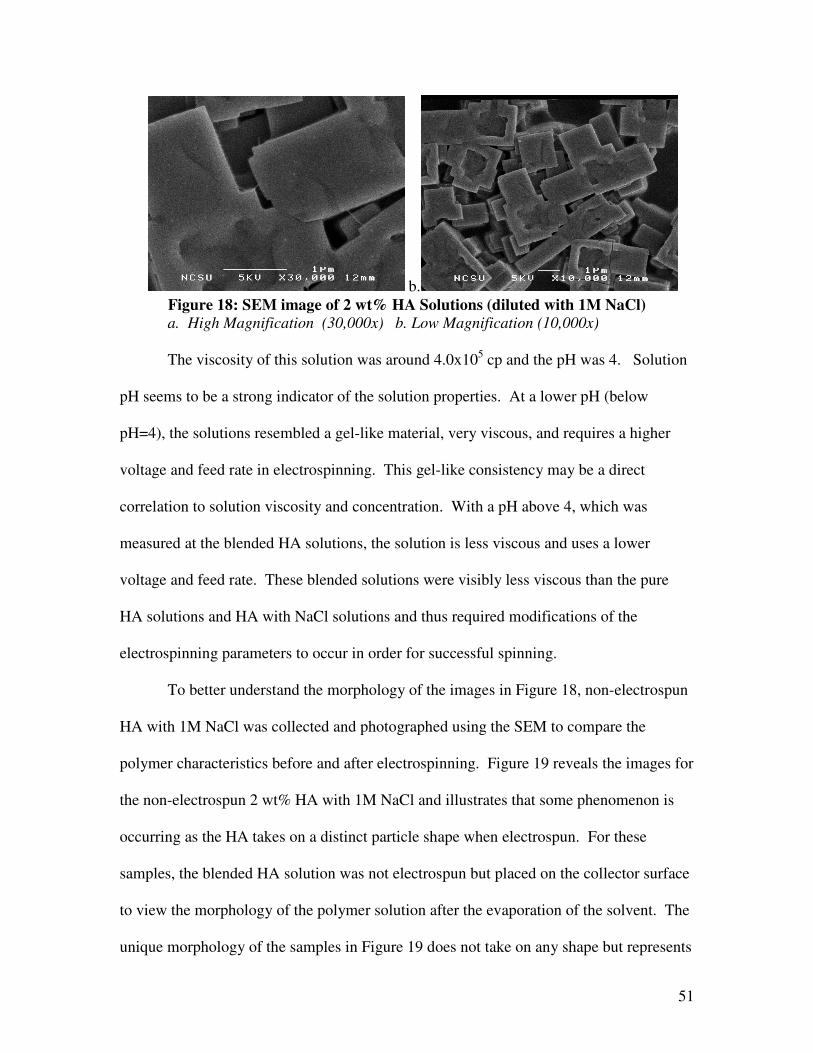
51
b. Figure 18: SEM image of 2 wt% HA Solutions (diluted with 1M NaCl) a. High Magnification (30,000x) b. Low Magnification (10,000x)
The viscosity of this solution was around 4.0x10⁵ cp and the pH was 4. Solution
pH seems to be a strong indicator of the solution properties. At a lower pH (below
pH=4), the solutions resembled a gel-like material, very viscous, and requires a higher
voltage and feed rate in electrospinning. This gel-like consistency may be a direct
correlation to solution viscosity and concentration. With a pH above 4, which was
measured at the blended HA solutions, the solution is less viscous and uses a lower
voltage and feed rate. These blended solutions were visibly less viscous than the pure
HA solutions and HA with NaCl solutions and thus required modifications of the
electrospinning parameters to occur in order for successful spinning.
To better understand the morphology of the images in Figure 18, non-electrospun
HA with 1M NaCl was collected and photographed using the SEM to compare the
polymer characteristics before and after electrospinning. Figure 19 reveals the images for
the non-electrospun 2 wt% HA with 1M NaCl and illustrates that some phenomenon is
occurring as the HA takes on a distinct particle shape when electrospun. For these
samples, the blended HA solution was not electrospun but placed on the collector surface
to view the morphology of the polymer solution after the evaporation of the solvent. The
unique morphology of the samples in Figure 19 does not take on any shape but represents
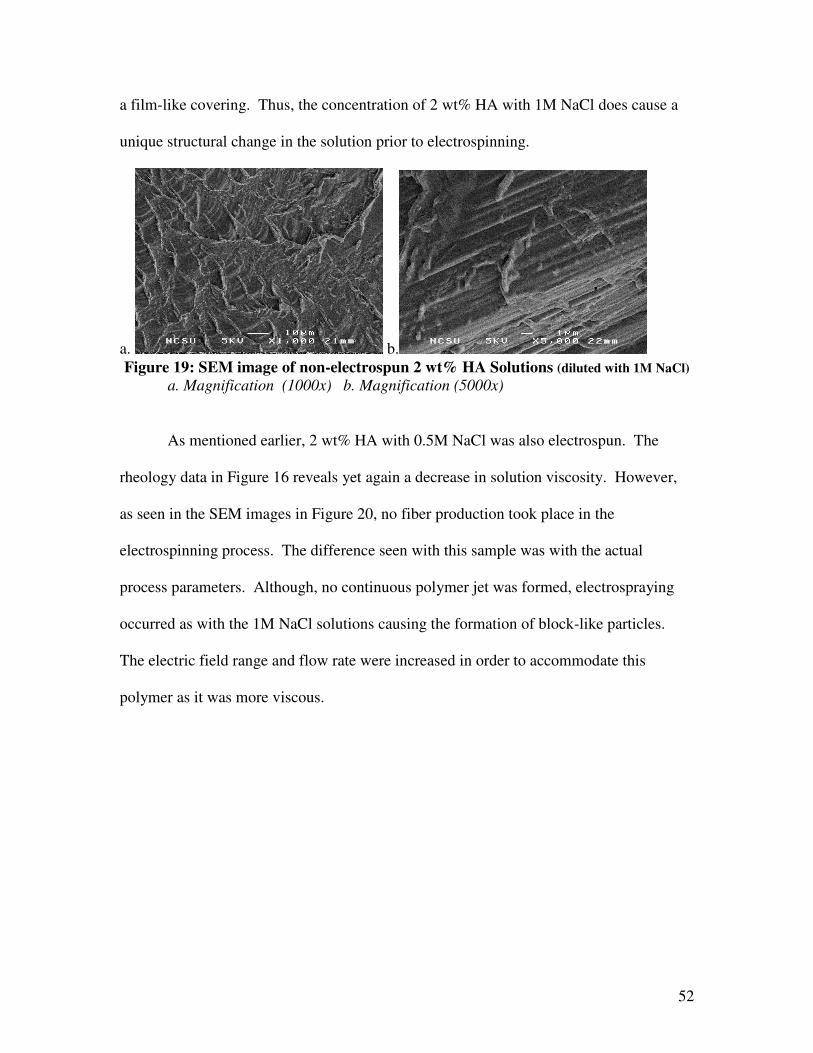
52
a film-like covering. Thus, the concentration of 2 wt% HA with 1M NaCl does cause a
unique structural change in the solution prior to electrospinning.
a. b. Figure 19: SEM image of non-electrospun 2 wt% HA Solutions (diluted with 1M NaCl)
a. Magnification (1000x) b. Magnification (5000x)
As mentioned earlier, 2 wt% HA with 0.5M NaCl was also electrospun. The
rheology data in Figure 16 reveals yet again a decrease in solution viscosity. However,
as seen in the SEM images in Figure 20, no fiber production took place in the
electrospinning process. The difference seen with this sample was with the actual
process parameters. Although, no continuous polymer jet was formed, electrospraying
occurred as with the 1M NaCl solutions causing the formation of block-like particles.
The electric field range and flow rate were increased in order to accommodate this
polymer as it was more viscous.
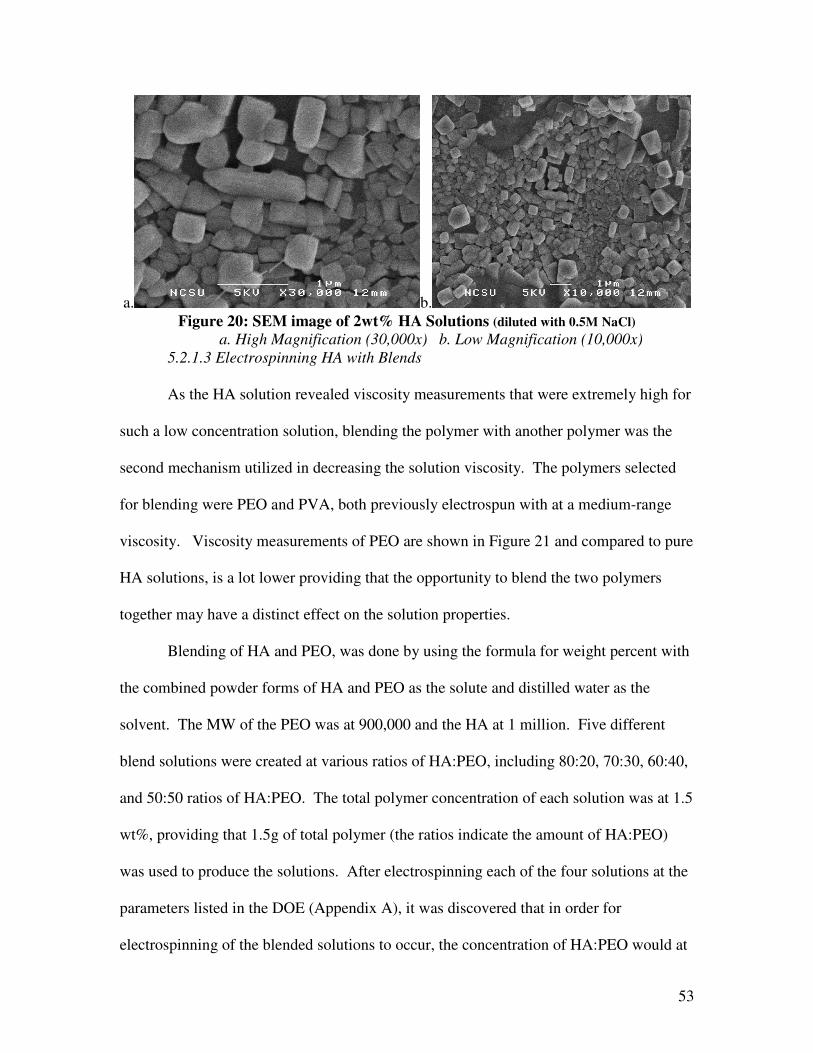
53
a. b. Figure 20: SEM image of 2wt% HA Solutions (diluted with 0.5M NaCl)
a. High Magnification (30,000x) b. Low Magnification (10,000x) 5.2.1.3 Electrospinning HA with Blends
As the HA solution revealed viscosity measurements that were extremely high for
such a low concentration solution, blending the polymer with another polymer was the
second mechanism utilized in decreasing the solution viscosity. The polymers selected
for blending were PEO and PVA, both previously electrospun with at a medium-range
viscosity. Viscosity measurements of PEO are shown in Figure 21 and compared to pure
HA solutions, is a lot lower providing that the opportunity to blend the two polymers
together may have a distinct effect on the solution properties.
Blending of HA and PEO, was done by using the formula for weight percent with
the combined powder forms of HA and PEO as the solute and distilled water as the
solvent. The MW of the PEO was at 900,000 and the HA at 1 million. Five different
blend solutions were created at various ratios of HA:PEO, including 80:20, 70:30, 60:40,
and 50:50 ratios of HA:PEO. The total polymer concentration of each solution was at 1.5
wt%, providing that 1.5g of total polymer (the ratios indicate the amount of HA:PEO)
was used to produce the solutions. After electrospinning each of the four solutions at the
parameters listed in the DOE (Appendix A), it was discovered that in order for
electrospinning of the blended solutions to occur, the concentration of HA:PEO would at
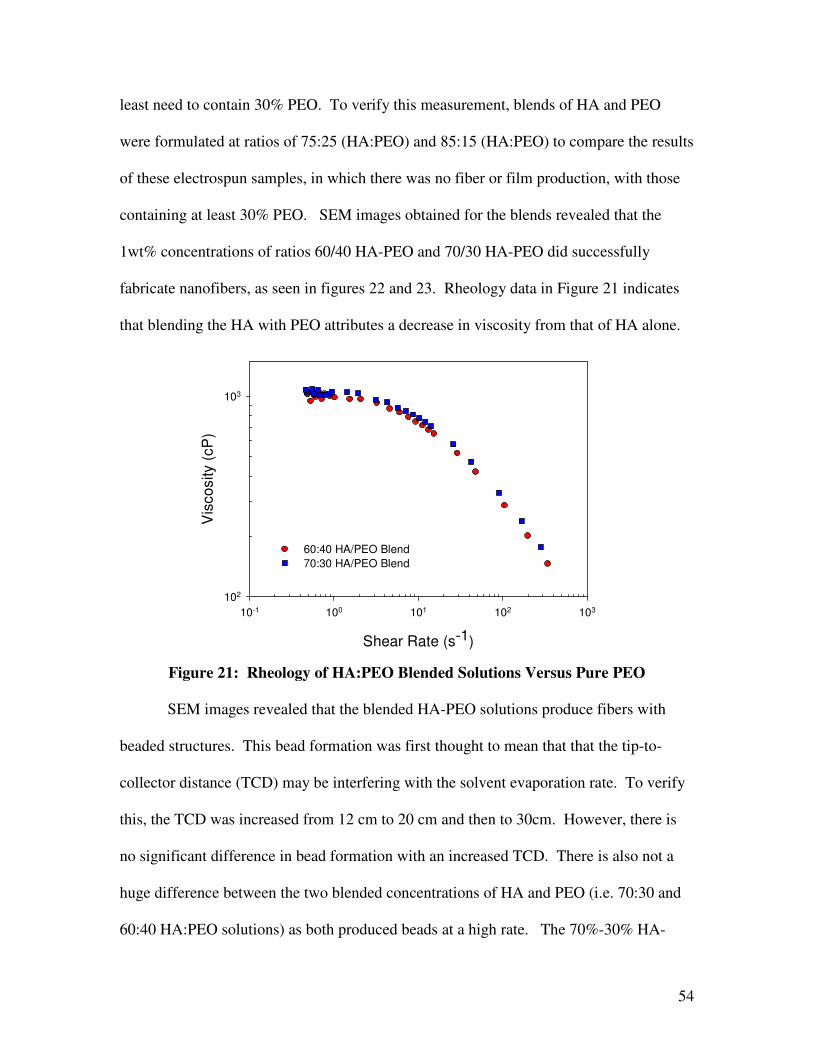
54
least need to contain 30% PEO. To verify this measurement, blends of HA and PEO
were formulated at ratios of 75:25 (HA:PEO) and 85:15 (HA:PEO) to compare the results
of these electrospun samples, in which there was no fiber or film production, with those
containing at least 30% PEO. SEM images obtained for the blends revealed that the
1wt% concentrations of ratios 60/40 HA-PEO and 70/30 HA-PEO did successfully
fabricate nanofibers, as seen in figures 22 and 23. Rheology data in Figure 21 indicates
that blending the HA with PEO attributes a decrease in viscosity from that of HA alone.
Shear Rate (s-1)
10-1 100 101 102 103
Vis
cosi
ty (c
P)
102
103
60:40 HA/PEO Blend 70:30 HA/PEO Blend
Figure 21: Rheology of HA:PEO Blended Solutions Versus Pure PEO
SEM images revealed that the blended HA-PEO solutions produce fibers with
beaded structures. This bead formation was first thought to mean that that the tip-to-
collector distance (TCD) may be interfering with the solvent evaporation rate. To verify
this, the TCD was increased from 12 cm to 20 cm and then to 30cm. However, there is
no significant difference in bead formation with an increased TCD. There is also not a
huge difference between the two blended concentrations of HA and PEO (i.e. 70:30 and
60:40 HA:PEO solutions) as both produced beads at a high rate. The 70%-30% HA-
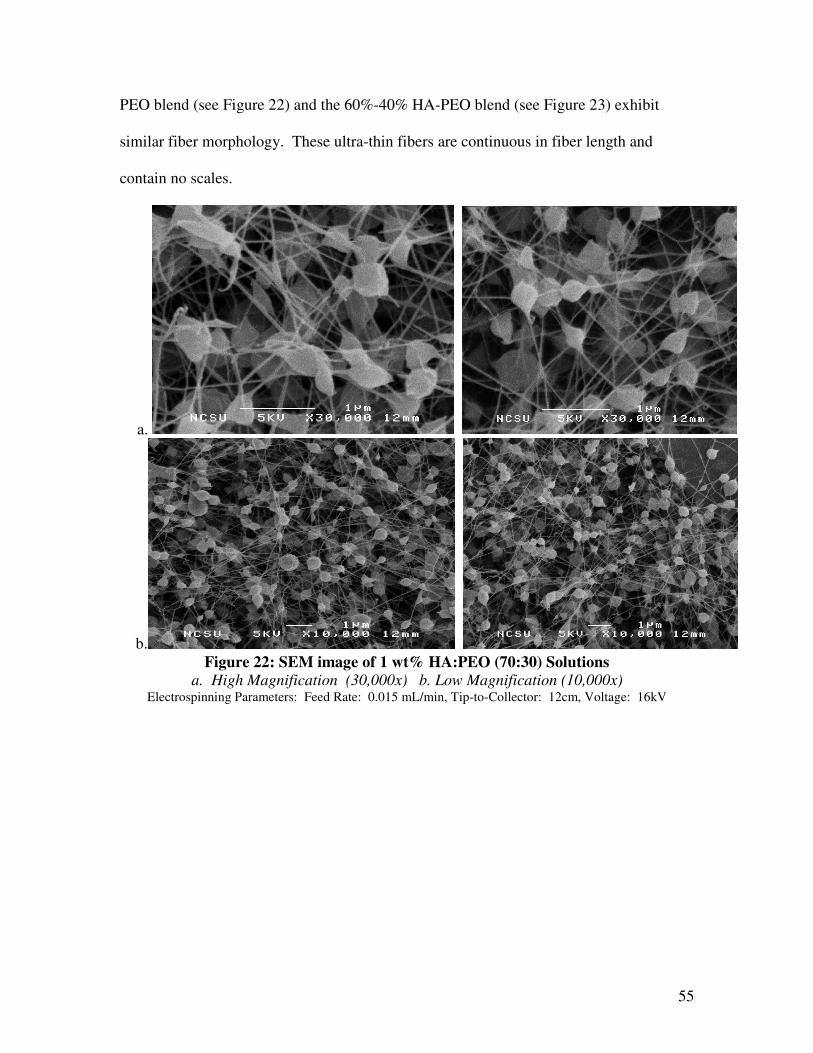
55
PEO blend (see Figure 22) and the 60%-40% HA-PEO blend (see Figure 23) exhibit
similar fiber morphology. These ultra-thin fibers are continuous in fiber length and
contain no scales.
a.
b. Figure 22: SEM image of 1 wt% HA:PEO (70:30) Solutions
a. High Magnification (30,000x) b. Low Magnification (10,000x) Electrospinning Parameters: Feed Rate: 0.015 mL/min, Tip-to-Collector: 12cm, Voltage: 16kV
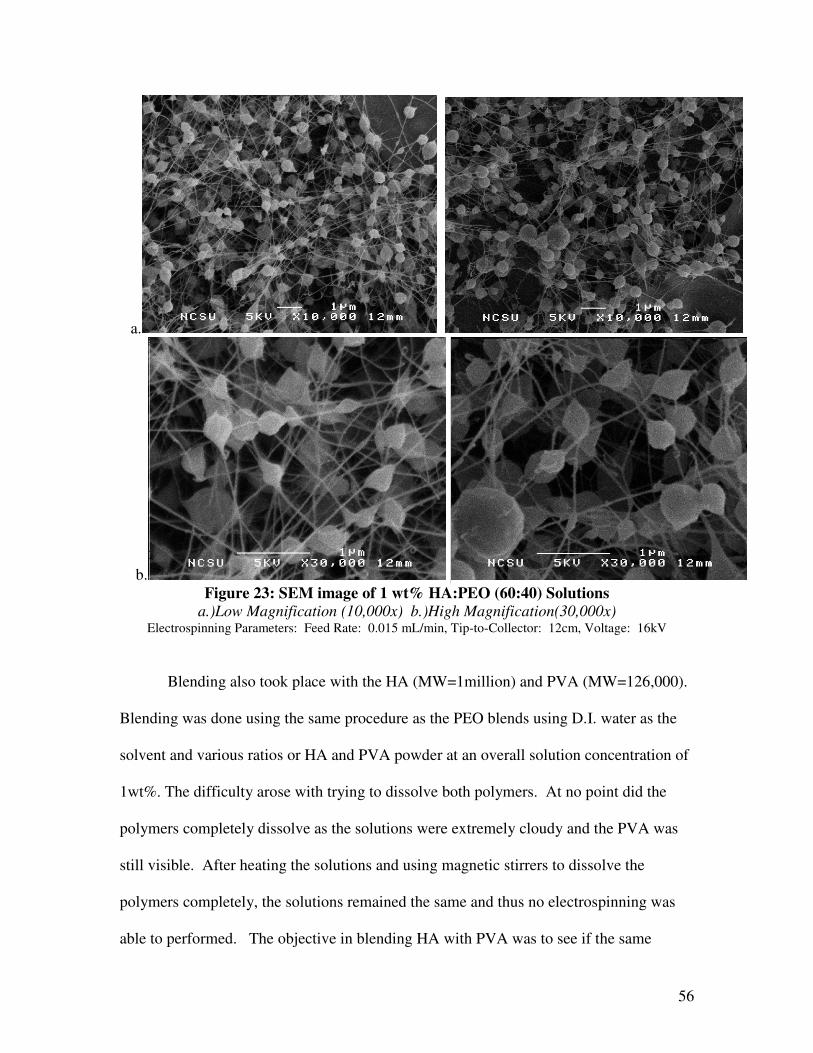
56
a.
b. Figure 23: SEM image of 1 wt% HA:PEO (60:40) Solutions
a.)Low Magnification (10,000x) b.)High Magnification(30,000x) Electrospinning Parameters: Feed Rate: 0.015 mL/min, Tip-to-Collector: 12cm, Voltage: 16kV
Blending also took place with the HA (MW=1million) and PVA (MW=126,000).
Blending was done using the same procedure as the PEO blends using D.I. water as the
solvent and various ratios or HA and PVA powder at an overall solution concentration of
1wt%. The difficulty arose with trying to dissolve both polymers. At no point did the
polymers completely dissolve as the solutions were extremely cloudy and the PVA was
still visible. After heating the solutions and using magnetic stirrers to dissolve the
polymers completely, the solutions remained the same and thus no electrospinning was
able to performed. The objective in blending HA with PVA was to see if the same
57
results could be produced as with the HA-PEO blends to fabricate beaded nanofibers.
5.2.2 Effect of solution feeding rate The feeding rate of solution during electrospinning is another factor affecting the
fabrication process including electro-spinnability. In this study, 1.0wt% HA-PEO at
various ratios of HA-PEO solution were electro-spun by using different fluid feeding
rates in order to elucidate their effects on the process. By using SEM to evaluate the
performance of the final sample, the optimal feeding rate was from 0.25 to 0.50 mL/min.
Above 0.50 mL/min, an unstable jet was developed abruptly. Thus, in our current study,
the optimum feeding rate was set to be 0.25 mL/min, in order to maintain the jet stability
and to increase the production efficiency. In a typical electro-spinning operation, there is
a narrow window of feeding rate for successful processing because the consumption of
solution being electro-spun has to be limited to within a certain range in order to maintain
the Taylor cone at the spinneret. When the solution-feeding rate is lower than this range,
the Taylor cone can be broken. When the solution-feeding rate is higher than this range,
the extra solution will drip out, which can interfere with the electrospinning process. For
our electrospinning trials, the variation of solution concentration, through dilution, was
the critical parameter contributing to successful nanofiber production, as solution
viscosity was the most difficult property to overcome in the process. As mentioned
earlier, the influence of concentration has two major effects on the spinning process: (1)
an increase in the evaporation rate and (2) an enhancement in the effective fiber pulling
force. We believe that in the chosen study to demonstrate the broadened capability of
electrospinning HA, the concentration of the polymer solution is one of the dominant
factors because an increase in the solution-feeding rate is needed in order to maintain the
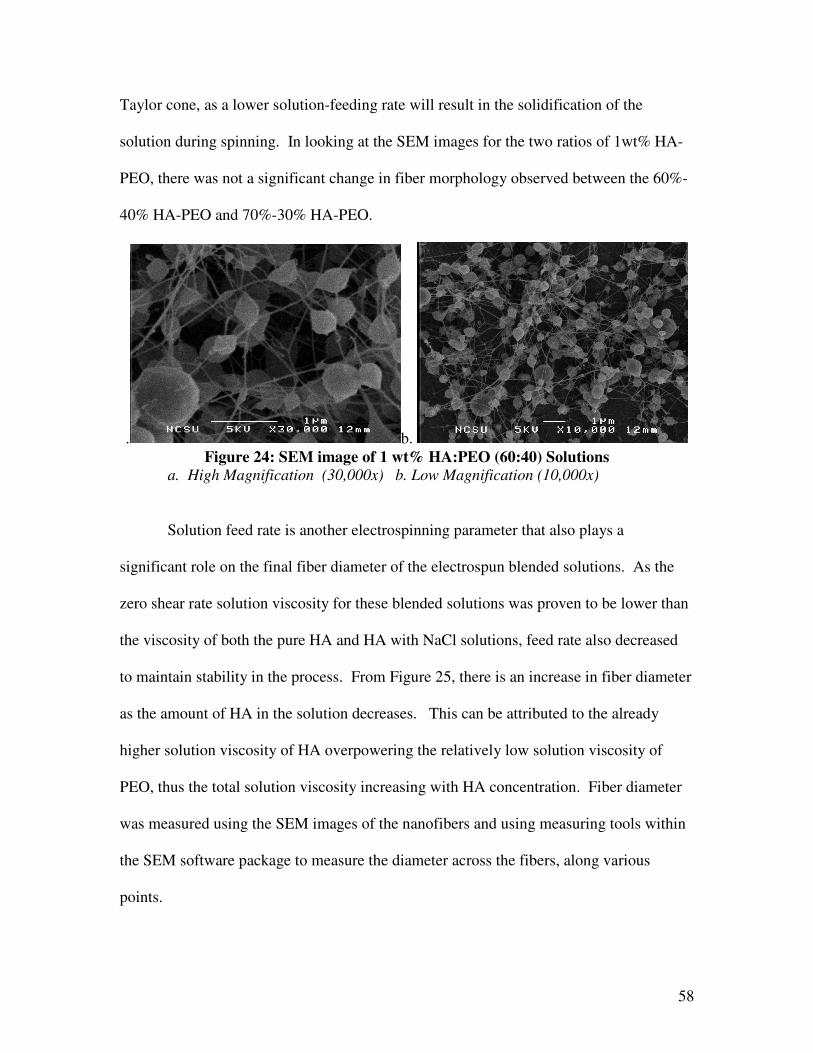
58
Taylor cone, as a lower solution-feeding rate will result in the solidification of the
solution during spinning. In looking at the SEM images for the two ratios of 1wt% HA-
PEO, there was not a significant change in fiber morphology observed between the 60%-
40% HA-PEO and 70%-30% HA-PEO.
. b. Figure 24: SEM image of 1 wt% HA:PEO (60:40) Solutions
a. High Magnification (30,000x) b. Low Magnification (10,000x)
Solution feed rate is another electrospinning parameter that also plays a
significant role on the final fiber diameter of the electrospun blended solutions. As the
zero shear rate solution viscosity for these blended solutions was proven to be lower than
the viscosity of both the pure HA and HA with NaCl solutions, feed rate also decreased
to maintain stability in the process. From Figure 25, there is an increase in fiber diameter
as the amount of HA in the solution decreases. This can be attributed to the already
higher solution viscosity of HA overpowering the relatively low solution viscosity of
PEO, thus the total solution viscosity increasing with HA concentration. Fiber diameter
was measured using the SEM images of the nanofibers and using measuring tools within
the SEM software package to measure the diameter across the fibers, along various
points.
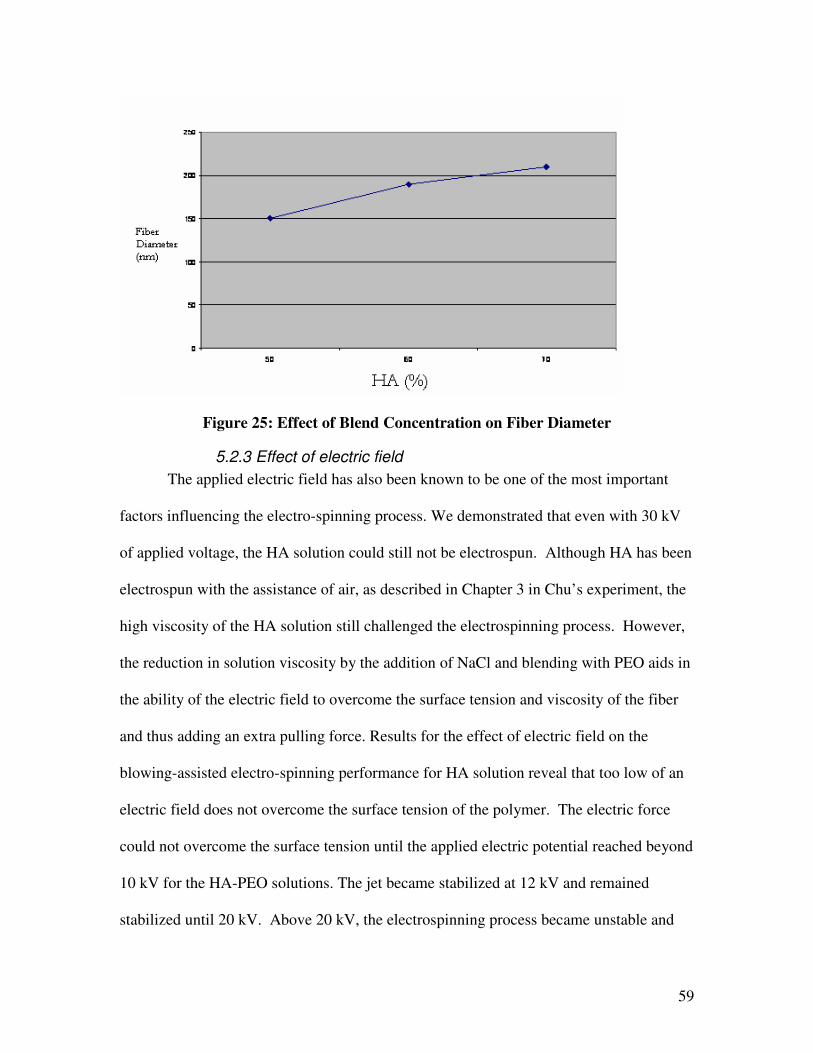
59
Figure 25: Effect of Blend Concentration on Fiber Diameter
5.2.3 Effect of electric field The applied electric field has also been known to be one of the most important
factors influencing the electro-spinning process. We demonstrated that even with 30 kV
of applied voltage, the HA solution could still not be electrospun. Although HA has been
electrospun with the assistance of air, as described in Chapter 3 in Chu’s experiment, the
high viscosity of the HA solution still challenged the electrospinning process. However,
the reduction in solution viscosity by the addition of NaCl and blending with PEO aids in
the ability of the electric field to overcome the surface tension and viscosity of the fiber
and thus adding an extra pulling force. Results for the effect of electric field on the
blowing-assisted electro-spinning performance for HA solution reveal that too low of an
electric field does not overcome the surface tension of the polymer. The electric force
could not overcome the surface tension until the applied electric potential reached beyond
10 kV for the HA-PEO solutions. The jet became stabilized at 12 kV and remained
stabilized until 20 kV. Above 20 kV, the electrospinning process became unstable and
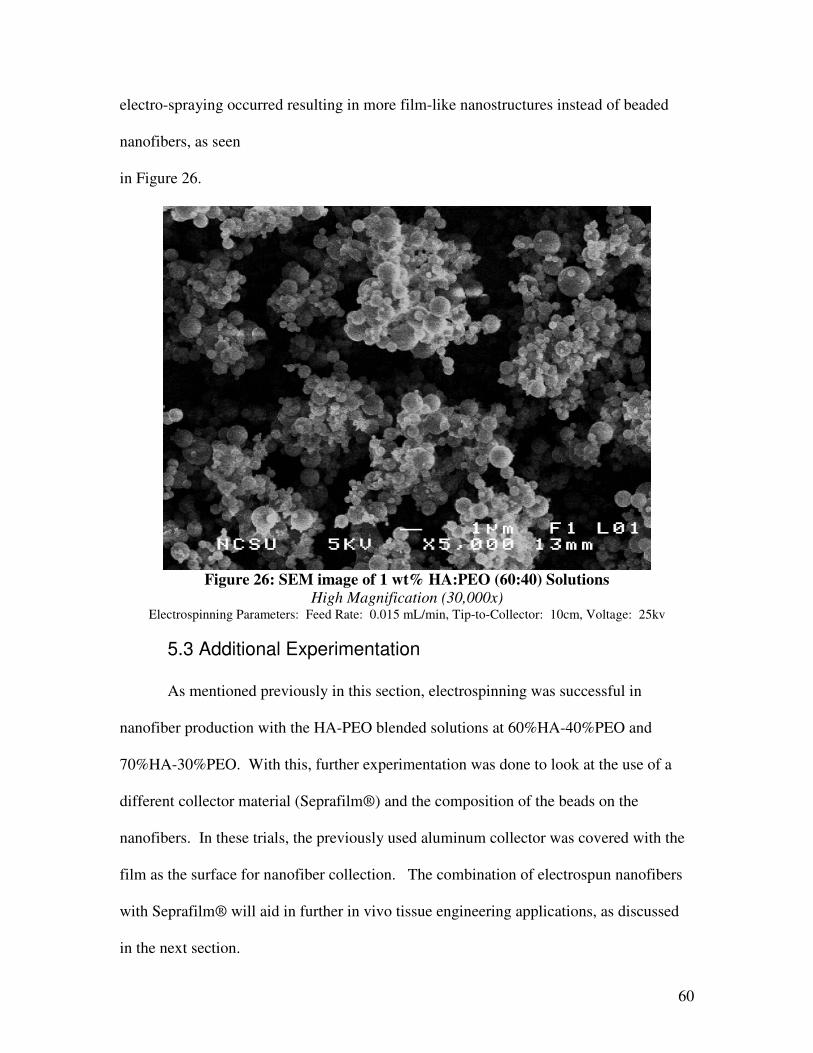
60
electro-spraying occurred resulting in more film-like nanostructures instead of beaded
nanofibers, as seen
in Figure 26.
Figure 26: SEM image of 1 wt% HA:PEO (60:40) Solutions
High Magnification (30,000x) Electrospinning Parameters: Feed Rate: 0.015 mL/min, Tip-to-Collector: 10cm, Voltage: 25kv
5.3 Additional Experimentation
As mentioned previously in this section, electrospinning was successful in
nanofiber production with the HA-PEO blended solutions at 60%HA-40%PEO and
70%HA-30%PEO. With this, further experimentation was done to look at the use of a
different collector material (Seprafilm®) and the composition of the beads on the
nanofibers. In these trials, the previously used aluminum collector was covered with the
film as the surface for nanofiber collection. The combination of electrospun nanofibers
with Seprafilm® will aid in further in vivo tissue engineering applications, as discussed
in the next section.
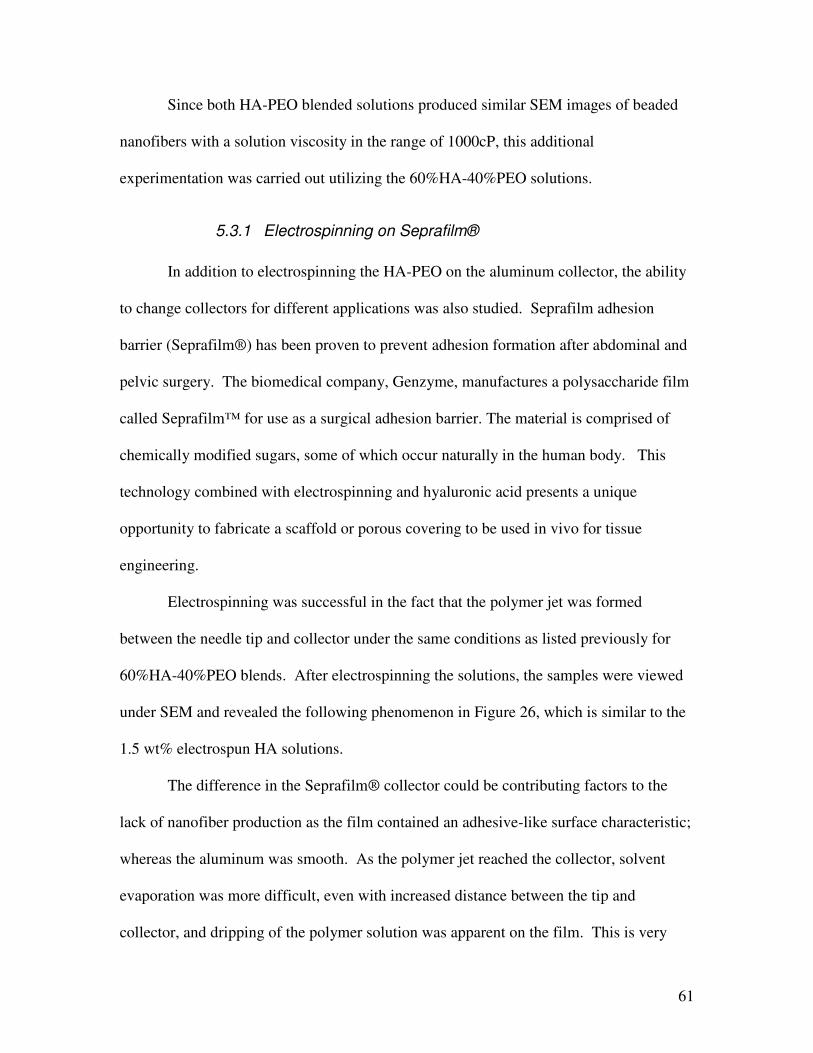
61
Since both HA-PEO blended solutions produced similar SEM images of beaded
nanofibers with a solution viscosity in the range of 1000cP, this additional
experimentation was carried out utilizing the 60%HA-40%PEO solutions.
5.3.1 Electrospinning on Seprafilm®
In addition to electrospinning the HA-PEO on the aluminum collector, the ability
to change collectors for different applications was also studied. Seprafilm adhesion
barrier (Seprafilm®) has been proven to prevent adhesion formation after abdominal and
pelvic surgery. The biomedical company, Genzyme, manufactures a polysaccharide film
called Seprafilm™ for use as a surgical adhesion barrier. The material is comprised of
chemically modified sugars, some of which occur naturally in the human body. This
technology combined with electrospinning and hyaluronic acid presents a unique
opportunity to fabricate a scaffold or porous covering to be used in vivo for tissue
engineering.
Electrospinning was successful in the fact that the polymer jet was formed
between the needle tip and collector under the same conditions as listed previously for
60%HA-40%PEO blends. After electrospinning the solutions, the samples were viewed
under SEM and revealed the following phenomenon in Figure 26, which is similar to the
1.5 wt% electrospun HA solutions.
The difference in the Seprafilm® collector could be contributing factors to the
lack of nanofiber production as the film contained an adhesive-like surface characteristic;
whereas the aluminum was smooth. As the polymer jet reached the collector, solvent
evaporation was more difficult, even with increased distance between the tip and
collector, and dripping of the polymer solution was apparent on the film. This is very
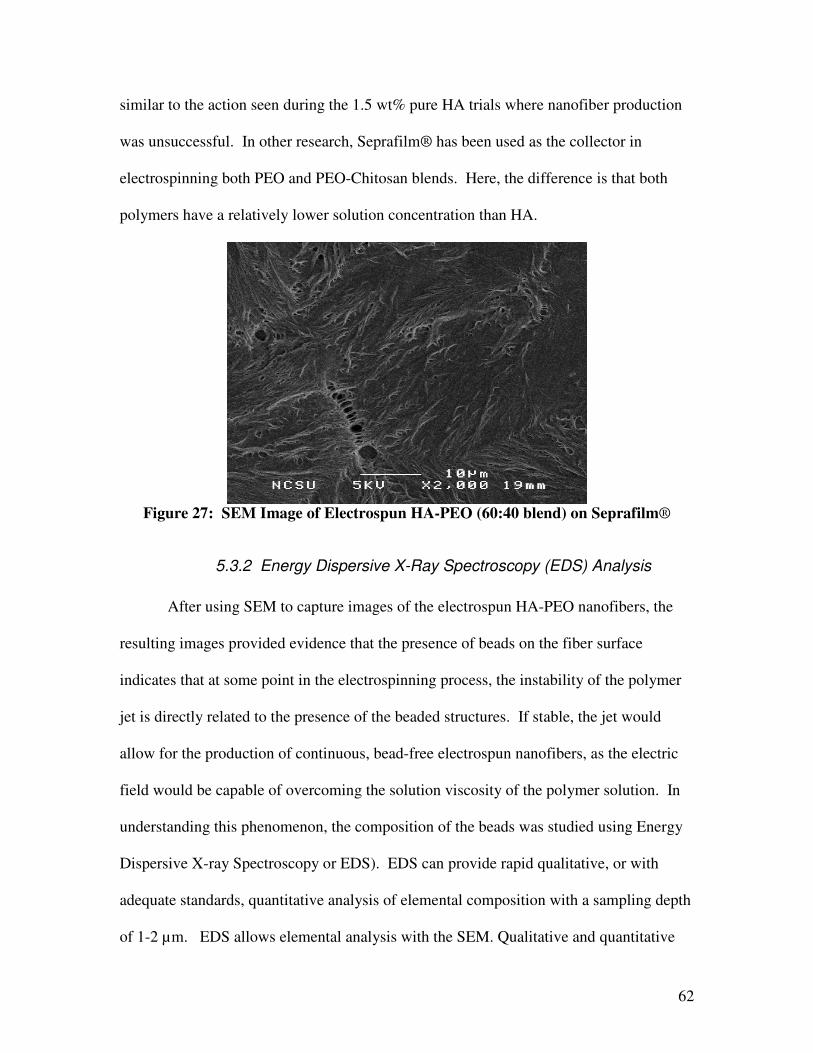
62
similar to the action seen during the 1.5 wt% pure HA trials where nanofiber production
was unsuccessful. In other research, Seprafilm® has been used as the collector in
electrospinning both PEO and PEO-Chitosan blends. Here, the difference is that both
polymers have a relatively lower solution concentration than HA.
Figure 27: SEM Image of Electrospun HA-PEO (60:40 blend) on Seprafilm®
5.3.2 Energy Dispersive X-Ray Spectroscopy (EDS) Analysis
After using SEM to capture images of the electrospun HA-PEO nanofibers, the
resulting images provided evidence that the presence of beads on the fiber surface
indicates that at some point in the electrospinning process, the instability of the polymer
jet is directly related to the presence of the beaded structures. If stable, the jet would
allow for the production of continuous, bead-free electrospun nanofibers, as the electric
field would be capable of overcoming the solution viscosity of the polymer solution. In
understanding this phenomenon, the composition of the beads was studied using Energy
Dispersive X-ray Spectroscopy or EDS). EDS can provide rapid qualitative, or with
adequate standards, quantitative analysis of elemental composition with a sampling depth
of 1-2 µm. EDS allows elemental analysis with the SEM. Qualitative and quantitative
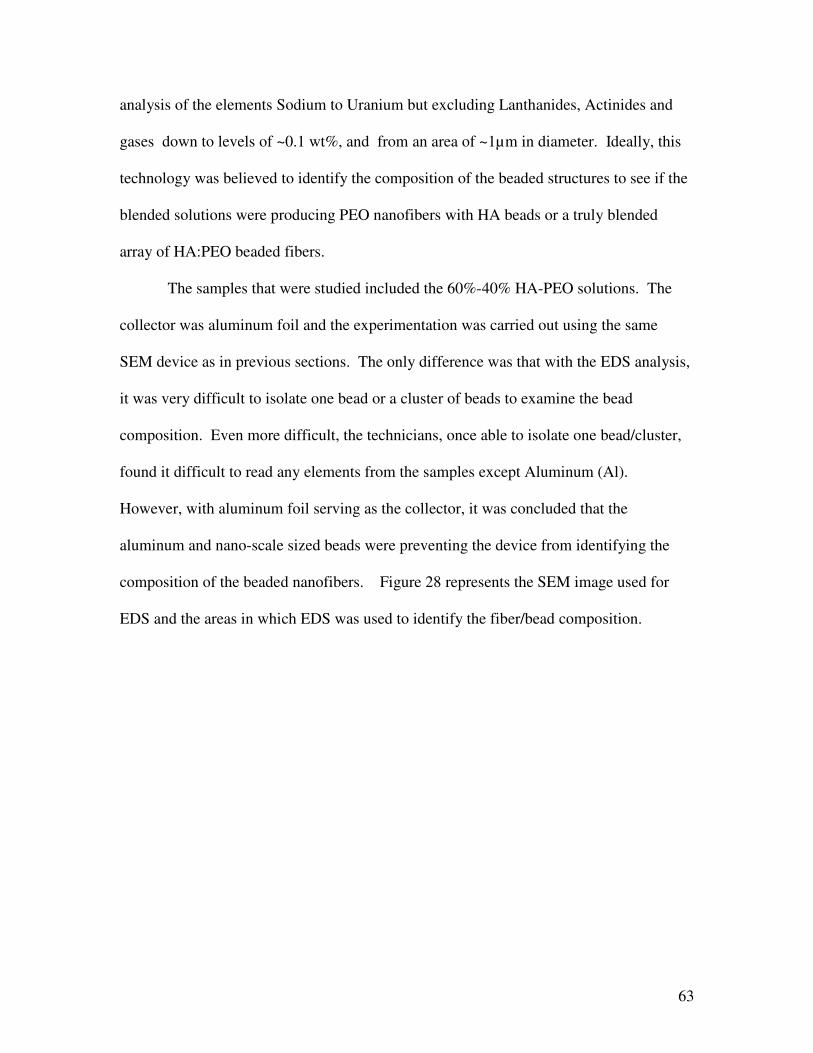
63
analysis of the elements Sodium to Uranium but excluding Lanthanides, Actinides and
gases down to levels of ~0.1 wt%, and from an area of ~1µm in diameter. Ideally, this
technology was believed to identify the composition of the beaded structures to see if the
blended solutions were producing PEO nanofibers with HA beads or a truly blended
array of HA:PEO beaded fibers.
The samples that were studied included the 60%-40% HA-PEO solutions. The
collector was aluminum foil and the experimentation was carried out using the same
SEM device as in previous sections. The only difference was that with the EDS analysis,
it was very difficult to isolate one bead or a cluster of beads to examine the bead
composition. Even more difficult, the technicians, once able to isolate one bead/cluster,
found it difficult to read any elements from the samples except Aluminum (Al).
However, with aluminum foil serving as the collector, it was concluded that the
aluminum and nano-scale sized beads were preventing the device from identifying the
composition of the beaded nanofibers. Figure 28 represents the SEM image used for
EDS and the areas in which EDS was used to identify the fiber/bead composition.
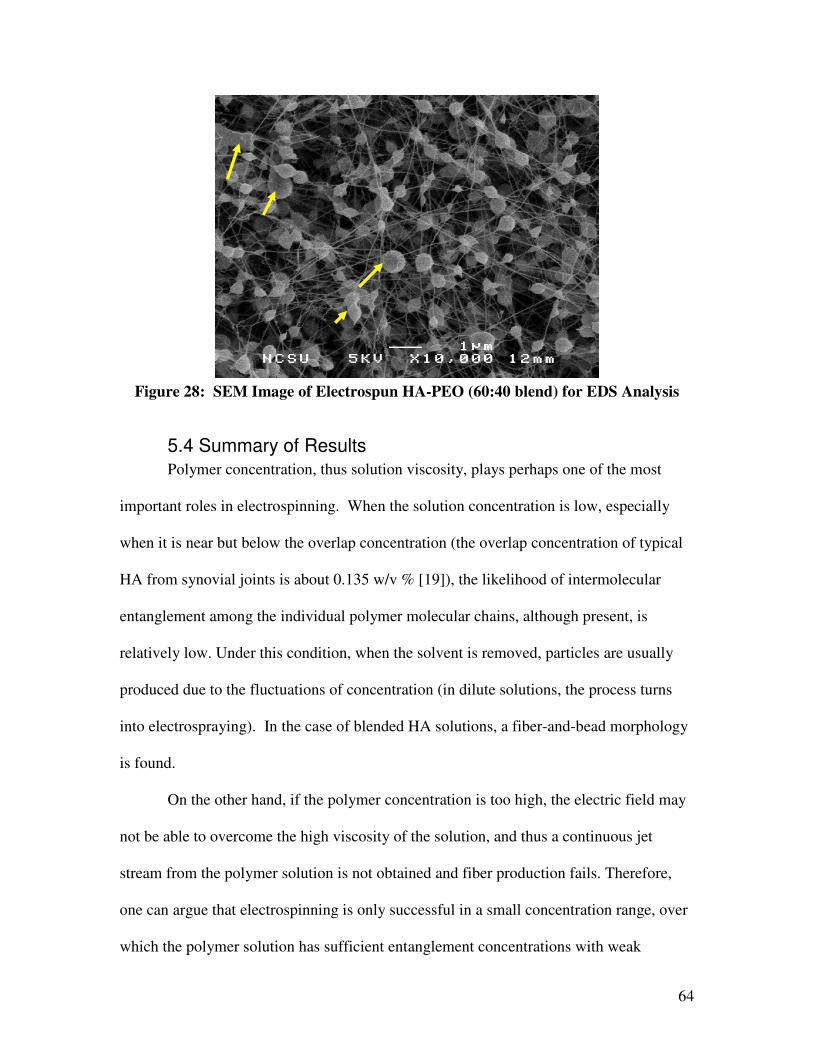
64
Figure 28: SEM Image of Electrospun HA-PEO (60:40 blend) for EDS Analysis
5.4 Summary of Results Polymer concentration, thus solution viscosity, plays perhaps one of the most
important roles in electrospinning. When the solution concentration is low, especially
when it is near but below the overlap concentration (the overlap concentration of typical
HA from synovial joints is about 0.135 w/v % [19]), the likelihood of intermolecular
entanglement among the individual polymer molecular chains, although present, is
relatively low. Under this condition, when the solvent is removed, particles are usually
produced due to the fluctuations of concentration (in dilute solutions, the process turns
into electrospraying). In the case of blended HA solutions, a fiber-and-bead morphology
is found.
On the other hand, if the polymer concentration is too high, the electric field may
not be able to overcome the high viscosity of the solution, and thus a continuous jet
stream from the polymer solution is not obtained and fiber production fails. Therefore,
one can argue that electrospinning is only successful in a small concentration range, over
which the polymer solution has sufficient entanglement concentrations with weak
65
resistance to form a polymer jet from the fluid droplet at the spinneret, i.e., the solution
with a relatively weak surface tension. These requirements represent, to a certain extent, a
contradiction, because a solution with a high degree of intermolecular entanglement is
normally associated with high viscosity and high surface tension. Thus, electro-spinning
is a process that can encompass only a limited range of solution viscosity and surface
tension, especially when the applied electrical field strength is limited.
In this study, the solutions prepared from the 1 million and 680,000 molecular
weight HA sample did not show a concentration range where the polymer jet stream
could consistently maintain its stability. This indicates that there is no suitable
concentration window for the HA solution to meet all of the requirements of producing
nanofibers by electro-spinning (we have tested the concentration range from 0.5 wt% to 2
wt%). Despite this finding, the variation of concentration could affect the fiber formation
capability. Although no nanofiber structure was formed at 2.0 wt%, electrospinning
started to produce nanofiber structures at concentrations of 1 wt% HA-PEO. Although
fibers were formed only at blended lower concentrations of HA-PEO due to perhaps an
increase in intermolecular entanglement, there was an upper concentration limit (at least
30% PEO) for the blends below which electro-spinning could not be carried out. This
has been explained earlier. In the chosen electro-spinning conditions, the applied electric
field was 20 kV, which was close to the practical limit for operation (higher electric
potentials usually produced sparks or shorted out the other equipment). At this potential
(20 kV), the electrical field could not overcome the high viscosity and the surface tension
of the HA blended solutions at concentrations higher than 1 wt% nor solutions containing
less than 30% PEO. Thus, the optimal concentration range for the production of
66
nanofibers by electrospinning of the chosen HA solution was at 1 wt% total polymer of
HA and PEO, a very specific window. As the stability of the jet formation was poor even
in the "optimal" concentration range (or the viscosity range), the electrospinning results
from this solution were unsuccessful.
For HA, the solution viscosity often exceeds the operating viscosity range of the
instrumentation for electrospinning. Thus, it was necessary to lower the solution
viscosity while still maintaining a high level of polymer concentration. This is because at
low polymer concentrations, an excess amount of solvent must be removed during the
relatively short time period between the jet fluid stream leaving the spinneret and the
fiber reaching the ground, as mentioned earlier in the discussion on solvent evaporation
rate. With a relatively high amount of solvent, the electrospinning process, even if it is
operational, favors particle formation. HA particles have a unique morphology.
Therefore, a highly concentrated solution with a proper viscosity is essential for the
successful fiber formation in the electro-spinning process. We find that the blending of
polymers with solutions of NaCl can reduce the solution viscosity and thus place the
solution in a viscosity range where successful electrospinning can take place.
67
6.0 CONCLUSIONS
In this study, the effects of various experimental parameters, including solution
concentration, feeding rate of solution, and electric field on the electrospinning
performance of hyaluronic acid (HA) were investigated. To improve the electrospinning
process, several new schemes were tested, including the control of HA concentration and
viscosity by making 1M NaCl with 2 wt% HA and 0.5M NaCl with 2 wt% HA. These
schemes, however, were not sufficiently effective to overcome the high viscosity of HA
solution at relatively low concentrations. Only with the blending of HA with PEO, were
we able to produce nanosized HA-PEO fibers with uniform diameters in the range of
190 nm - 500 nm.
Overall, electrospinning HA was difficult in producing bead-free, continuous
nanofibers, due to the physical properties of the polymer. The molecular weight of pure
HA was high at one million. The unusually high viscosity and surface tension of HA
were thought to be the key factors that hinder the electrospinning of HA solution.
Additionally, the strong water retention ability of HA may have lead to fusion of
nanofibers electrospun on the collector due to the insufficient evaporation of the solvents
in electrospinning. The fabrication of HA into nanofibrous non-woven membranes from
aqueous solution was successfully carried out only after the blending of the polymer with
polyethylene oxide (PEO).
Rheological measurements showed that the viscosity changed significantly after
the polyethylene oxide (PEO) and NaCl were added into the HA solution. The dilution
and blending of NaCl and PEO, respectively, did result in an overall decrease in solution
68
viscosity. However, even with the dilution, the HA-NaCl solution viscosity was still
relatively high to produce nanofibers, as was the case with the pure HA solutions.
Scanning electron microscopy (SEM) results revealed that the blended HA:PEO
solutions did fabricate nanofibers, with the presence of beaded structures and
nanoparticles of HA with NaCl. The blending of the two polymers provided an even
lower solution viscosity than the NaCl diluted solutions. A concentration of 1wt% HA-
PEO total polymer formed the optimum conditions for the fabrication of HA-PEO
nanofibers. The ratios of HA-PEO producing these nanofibers was at 70% HA/30% PEO
and 60% HA/40% PEO.
69
7.0 FUTURE WORK
The HA-PEO nanofibers obtained from electrospinning contained beaded
structures. The blended HA-PEO solutions had a significantly lower viscosity than both
the HA and HA-NaCl solutions. This kind of nanostructure could have many potential
clinical applications, especially in the field of artificial skin. Also, HA-PEO nanofibers at
different HA/PEO compositions obtained by electrospinning are expected to have
different cell proliferation properties and biodegradability, and have potential
applications in wound dressings, such as gauzes, tissue engineering scaffolds, and drug
delivery.
Specifically, tissue engineering requires the utilization of a porous biodegradable
scaffold to replicate the natural ECM, which serves to organize cells in space, to provide
them with environmental signals and to direct site-specific cellular regulation. HA-based
hydrogels are ideal materials for soft-tissue engineering because of their unique
rheological properties and complete biocompatibility. The successful fabrication of HA-
PEO nanofibers may be used for cell attachment, growth, and migration.
These nanofiber-based scaffolds may then be characterized by a wide range of
pore size distribution, high porosity, and high surface area-to-volume ratio, which are
favorable parameters for cell attachment, growth, and proliferation. The structures could
also provide effective mechanical properties suitable for soft tissue, such as skin or
cartilage.
This study provides a basis for future optimization of electrospun nanofibrous
scaffold for tissue-engineering applications. Applying this structure as a substitute for a
specific tissue, such as cartilage, will be a focus of our future investigations. In addition,
70
identifying the beaded structures on the beaded nanofibers will determine whether or not
the HA can be electrospun into bead-free fibers. The production of bead-free fibers is the
ultimate goal, possibly with the use of a different solvent, such as ethanol. Further
investigation of EDS and other characterization tools will determine if we are forming
blended fibers with beads.
Other areas of focus include, investigating different collector devices and methods
to extract the electrospun nanofibers from the collector, varying the process parameters to
obtain ultra-thin nanofibers, and utilizing other chemicals/solvents to dilute the solution
for a possible reduction in the HA solution viscosity.
71
8.0 FELLOWSHIP EFFORTS
8.1 Fellowship Overview Throughout my graduate career, I have had the pleasure of serving as a graduate
fellow for the Recognizing Accelerated Math Potential in Underrepresented People
(RAMP-UP) program. The RAMP-UP program is designed to promote rigorous
mathematics using inquiry techniques and curriculum integration with other subjects. It
aligns the teaching of math across all participating grade levels and will include
university students working alongside teachers. Two partner high schools will work with
NC State's College of Engineering and College of Education to offer an "introduction to
engineering course" that will transfer to NC State. According to NC State Chancellor,
Mary Anne Fox, "This program helps support the vital outreach missions of NC State's
colleges of Engineering and Education, and strengthens our important work with Wake
County schools to provide all students an exciting opportunity for life and work in this
new century."
With the help of a $500,000 grant from the GE Foundation, North Carolina State
University launched a joint effort with Wake County Public Schools to strengthen the
math skills of middle and high school students and increase their opportunities to pursue
careers like engineering. The grant was given the name Recognizing Accelerated Math
Potential in Under-Represented People (RAMP-UP). By increasing the number of under-
represented students in higher level math classes, the program seeks to raise interest and
performance in math by the targeted groups, giving them the educational foundation
necessary to study engineering or other math-based fields in college. The program is
designed to promote rigorous mathematics taught using inquiry techniques and
curriculum integration with other subjects. It will align the teaching of math across all
72
participating grade levels and will include university students working alongside
teachers. Two partner high schools will work with NC State's College of Engineering and
College of Education to offer an "introduction to engineering course" that will transfer to
NC State.
RAMP-UP Fellow Responsibilities
As a National Science Foundation GK-12 fellow from 2004-2006, I was given the
opportunity to perform outreach with two schools in Wake County, NC. The program of
which is funded by NSF is deemed RAMP-UP (Recognizing Accelerated Math Potential
in Underrepresented People) and is a partnership between North Carolina State
University, Shaw University, Wake County Schools, and the GE Foundation. With five
NSF graduate students, 28 undergraduate students from NCSU and Shaw in STEM
(Science, Technology, Engineering, or Mathematics) and education fields, and 3 program
directors, the program was designed with the intent to provide supplemental instruction in
math to reinforce math concepts and skills as a way to increase the number of students
taking Algebra 1 by the eighth grade, Calculus by the 12th grade, and entering a
university/college to pursue a STEM curriculum. Wake County has contributed efforts in
allowing students in the program from NC State University to teach and tutor in math,
science, and student electives at five elementary schools (Washington Elementary, A.B.
Combs Elementary, Bugg Elementary, Fuller Elementary, and Dillard Elementary), two
middle schools (Carnage Middle School and Centennial Middle School), and one high
school (Southeast Raleigh Magnet High School).
In my first year as a graduate fellow during 2005-2006, I worked with two
schools: Washington Elementary and Southeast Raleigh Magnet High School. At
73
Washington I had the opportunity to manage two undergraduate students (Mr. Clyde
Gholston, sophomore in Mathematics at Shaw University and Ms. Heidi Bunn, a
sophomore in Chemical Engineering at NC State University) providing tutoring and
mentoring to students in grades 3-5. The goal of working with this nationally renowned
elementary school was to find innovative ways to reinforce fundamental skills in math,
including multiplication tables, division rules, basic counting, etc. From student
developed activities to group and after-school tutoring sessions, our team was able to
provide the students with creative techniques to help them better understand daily class
lessons and past knowledge. For example, Mr. Gholston was able to start an after-school
tutoring program that targeted African-American students who seemed noticeably
confused with the math being taught in their classroom. With the addition of these after-
school sessions, we noticed a significant increase in the performance and behavior in
these students with one-on-one attention and a mentor who was able to cater his teaching
style to the learning styles of his pupils. Research proves that most humans are visual
learners and learn from hands-on activities. Surveying the teachers at all of our partner
schools has verified this observation for our local students. However, at all levels of
primary and secondary education, most teachers prepare and execute lessons through
auditory means. This makes it difficult to improve student performance in the classroom
when the classroom style of teaching is reverse from the majority of the student
populations’ learning style. The opportunity for improvement within RAMP-UP is to
allow teachers to teach to a mass group of students, usually between 23-28, while having
an outside representative reinforce taught topics through supplemental instruction, that is
group tutoring, hands-on lessons, and one-on-one tutoring.
74
8.2.1 Washington Elementary
At Washington Elementary, supplemental hands-on instruction has proven to be a
strong force in improving not only student performance but the actual behavior of the
students who became confused in class and thus chose not to do the assigned work. For
these students, utilizing the RAMP-UP fellows became a means to gain understanding by
asking questions in a smaller more relaxed setting while also providing a role model
figure. Role modeling and mentoring have proven to be two tools that have a direct
impact on performance and self-confidence in education, family life, and even the
workplace. For this program to provide this for students at an early age, approximately
7-12 years old, means that there is a strong chance for an upward trend in increased
performance and self-confidence for retention in students after the program ends, which
could potentially be at the end of the year or length of the grant (5 years).
8.2.2 Southeast Raleigh Magnet High School
Southeast Raleigh Magnet High School (SRMHS) is one of twelve high schools
in Wake County and the only magnet program offered to students in grades 9-12 in the
county. The school was designed as a leadership and technical enhancement tool in
allowing students to better their technical skills and leadership qualities. During 2005-
2006, my role at the school was to again manage three undergraduate students and also
co-teach the introductory engineering course offered to students in the Engineering
Career Focused Learning Community (CFLC). SRMHS currently has seven CFLC’s in
Engineering Technologies, Biotechnology/Medicine, Information Technologies, Digital
Arts, Global Connections, Education, and Law & Human Services.
75
With RAMP-UP, I have had the opportunity to work firsthand with students in the
Engineering Technologies CFLC in two courses: Introduction to Engineering (Fall 2004)
and Introduction to Engineering Design (Fall 2005 and Spring 2006). Career-focused
learning communities provide relevance to the rigorous coursework available to students.
Students may select a career focus and then benefit from elective courses, career
experiences, and extra-curricular activities which center on that interest. The mission of
Career Focused Learning Communities (CFLCs) is to create communities of learners
who work together academically and through clubs and activities as they prepare for the
ever-so-growing job market of our society. CFLC’s, as deemed by the school’s guidance
center:
• were created through a federal grant funding Smaller Learning Communities, ways for students to feel connected within large schools
• create communities of learners through their participation in CFLC courses, activities and affiliated clubs
• provide workforce, two-year college and four-year college pathways • provide challenging course sequences and relevant, sequenced career
experiences • prepare students for top colleges and job opportunities
The Engineering Career Focused Learning Community (CFLC) program is
designed for highly motivated students interested in post secondary studies in the field of
engineering. Through the program’s directed course of study students will be introduced
to the concepts of mathematics, science, and technology that are the foundations of an
engineering curriculum. The Engineering CFLC exposes students to the different
disciplines of engineering through a combination of courses, extracurricular experiences,
guest speakers, and internship opportunities.
The cornerstone of the Engineering CFLC is the sequence of courses developed
by a national program deemed Project Lead the Way (PLTW). PLTW partners in public
76
schools, colleges and universities and the private sector. The project has developed a four
year sequence of courses that when combined with college preparatory mathematics and
science, introduces students to the scope, rigor and discipline of engineering and
engineering technology. Students participating in PLTW courses are better prepared for
college engineering programs. PLTW was launched at SRMHS in the Fall of 2005 as a
recommendation from myself and the Project Director of RAMP-UP. We both sat on the
administrative committee to work with Wake County in providing over $100,000 in
computers, software, and other classroom resources to the successful implementation of
this program. In the summer of 2005, I also became a PLTW certified instructor for the
first of the 4 PLTW classes to be implemented at SRMHS, which is Introduction to
Engineering Design (IED). After attending a 2-week training course at the University of
South Florida in Tampa, FL, I was certified after receiving passing scores on written and
performance based modeling examinations and effective teaching presentations. As the
program continues to grow at SRMHS, which is a span of four years, I will continue to sit
on this committee to ensure proper organization and execution of the classes as outlined
by the national curriculum.
In addition to working with Engineering CFLC, I worked heavily with students in
the math course Algebra 1 Part A and Algebra 1 Part B (Spring 2005). At the beginning
and end of each semester working with the students at SRHMS, which is on a semester
block academic schedule, we were able to both survey and monitor student progress in
their coursework. In the subsequent sections, data obtained from student scores and
comparison schools was obtained to measure the impact of RAMP-UP and the interaction
of the fellows on the academic progress of the students.
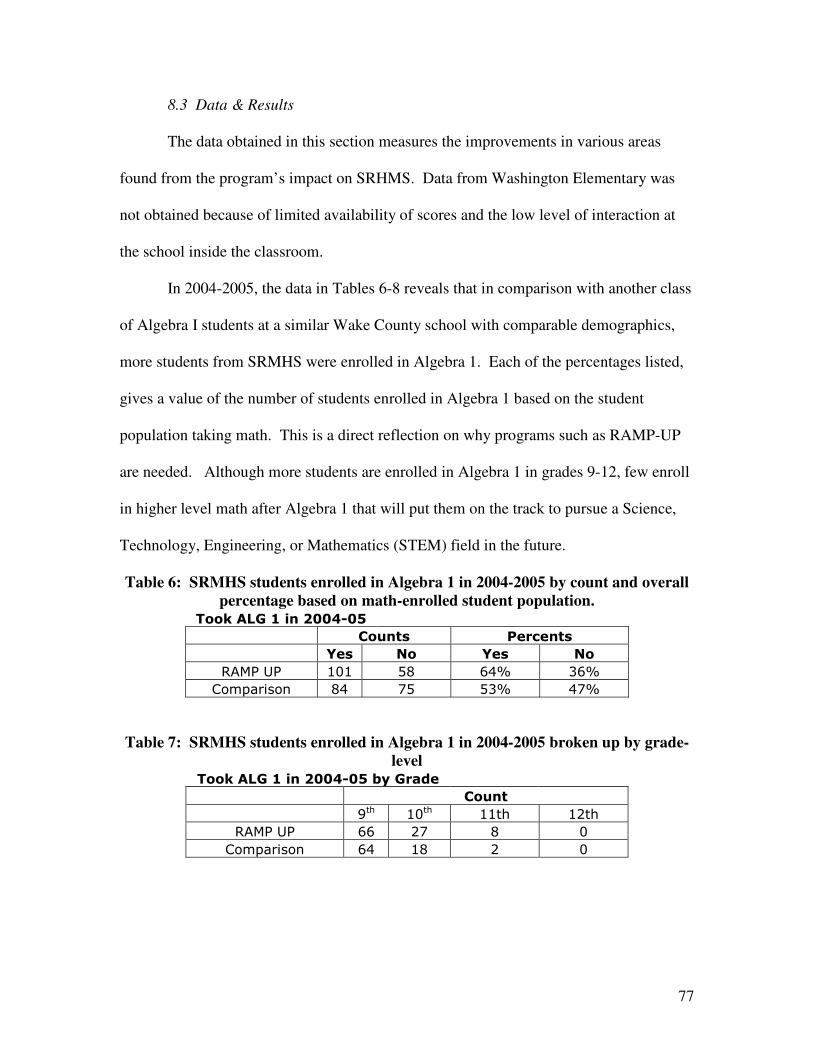
77
8.3 Data & Results
The data obtained in this section measures the improvements in various areas
found from the program’s impact on SRHMS. Data from Washington Elementary was
not obtained because of limited availability of scores and the low level of interaction at
the school inside the classroom.
In 2004-2005, the data in Tables 6-8 reveals that in comparison with another class
of Algebra I students at a similar Wake County school with comparable demographics,
more students from SRMHS were enrolled in Algebra 1. Each of the percentages listed,
gives a value of the number of students enrolled in Algebra 1 based on the student
population taking math. This is a direct reflection on why programs such as RAMP-UP
are needed. Although more students are enrolled in Algebra 1 in grades 9-12, few enroll
in higher level math after Algebra 1 that will put them on the track to pursue a Science,
Technology, Engineering, or Mathematics (STEM) field in the future.
Table 6: SRMHS students enrolled in Algebra 1 in 2004-2005 by count and overall percentage based on math-enrolled student population.
��������������� ���� � � �
� ������ ��������
� ���� ��� ���� ���
�������� ���� � �� � �� �
����������� �� �� � � �� �
� � � � �
Table 7: SRMHS students enrolled in Algebra 1 in 2004-2005 broken up by grade-
level ��������������� ������������� � �
� �����
� ���� ����� ����� �����
�������� ��� ��� � ��
����������� ��� �� �� ��
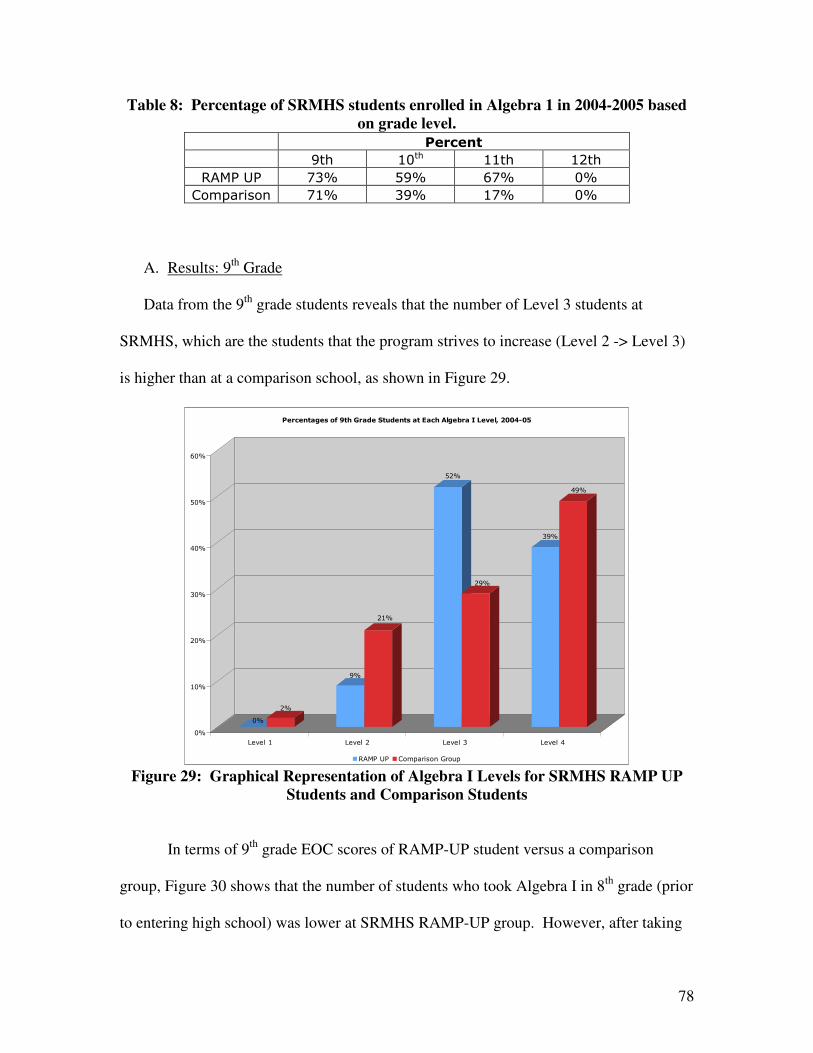
78
Table 8: Percentage of SRMHS students enrolled in Algebra 1 in 2004-2005 based on grade level.
� �������
� ���� ����� ����� �����
�������� �� � � � �� � � �
����������� �� � �� � �� � � �
A. Results: 9th Grade
Data from the 9th grade students reveals that the number of Level 3 students at
SRMHS, which are the students that the program strives to increase (Level 2 -> Level 3)
is higher than at a comparison school, as shown in Figure 29.
�
�
�
��
�
��
��
��
�
��
��
��
��
�
��
���� �� ���� �� ���� �� ���� ��
�������������� �!�������"����������#��!��$������%���&�$'���� ���
������� �����������!��"� Figure 29: Graphical Representation of Algebra I Levels for SRMHS RAMP UP
Students and Comparison Students In terms of 9th grade EOC scores of RAMP-UP student versus a comparison
group, Figure 30 shows that the number of students who took Algebra I in 8th grade (prior
to entering high school) was lower at SRMHS RAMP-UP group. However, after taking
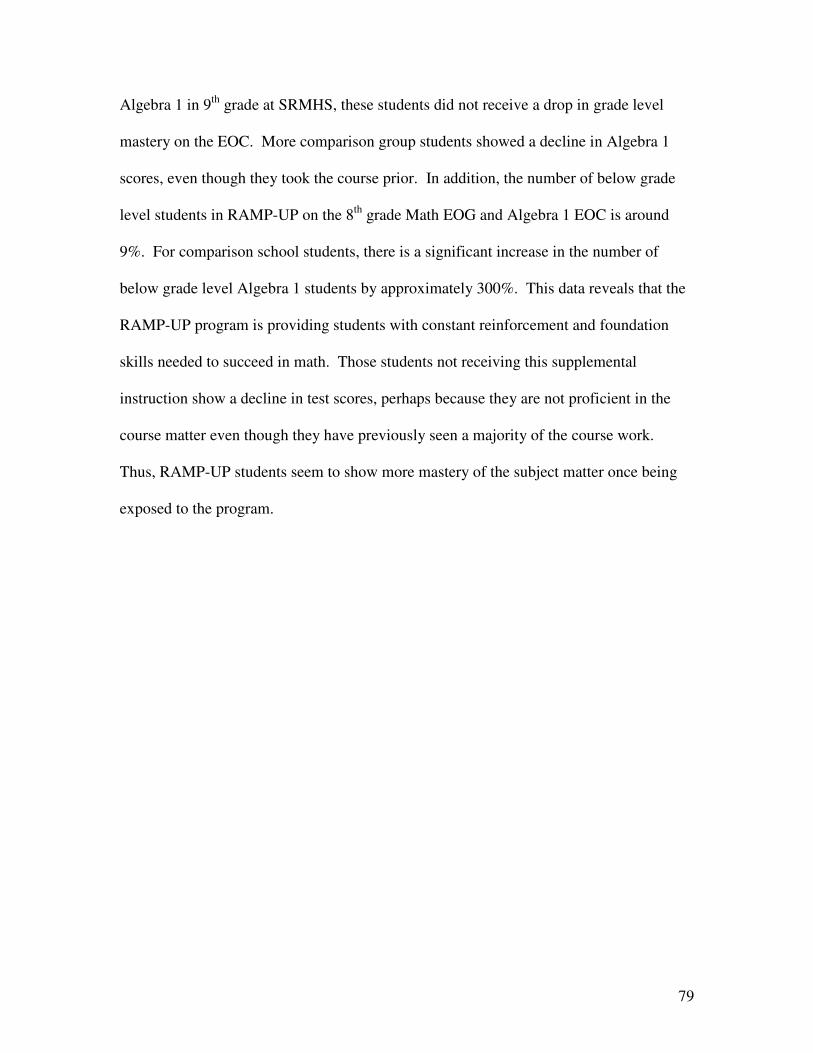
79
Algebra 1 in 9th grade at SRMHS, these students did not receive a drop in grade level
mastery on the EOC. More comparison group students showed a decline in Algebra 1
scores, even though they took the course prior. In addition, the number of below grade
level students in RAMP-UP on the 8th grade Math EOG and Algebra 1 EOC is around
9%. For comparison school students, there is a significant increase in the number of
below grade level Algebra 1 students by approximately 300%. This data reveals that the
RAMP-UP program is providing students with constant reinforcement and foundation
skills needed to succeed in math. Those students not receiving this supplemental
instruction show a decline in test scores, perhaps because they are not proficient in the
course matter even though they have previously seen a majority of the course work.
Thus, RAMP-UP students seem to show more mastery of the subject matter once being
exposed to the program.
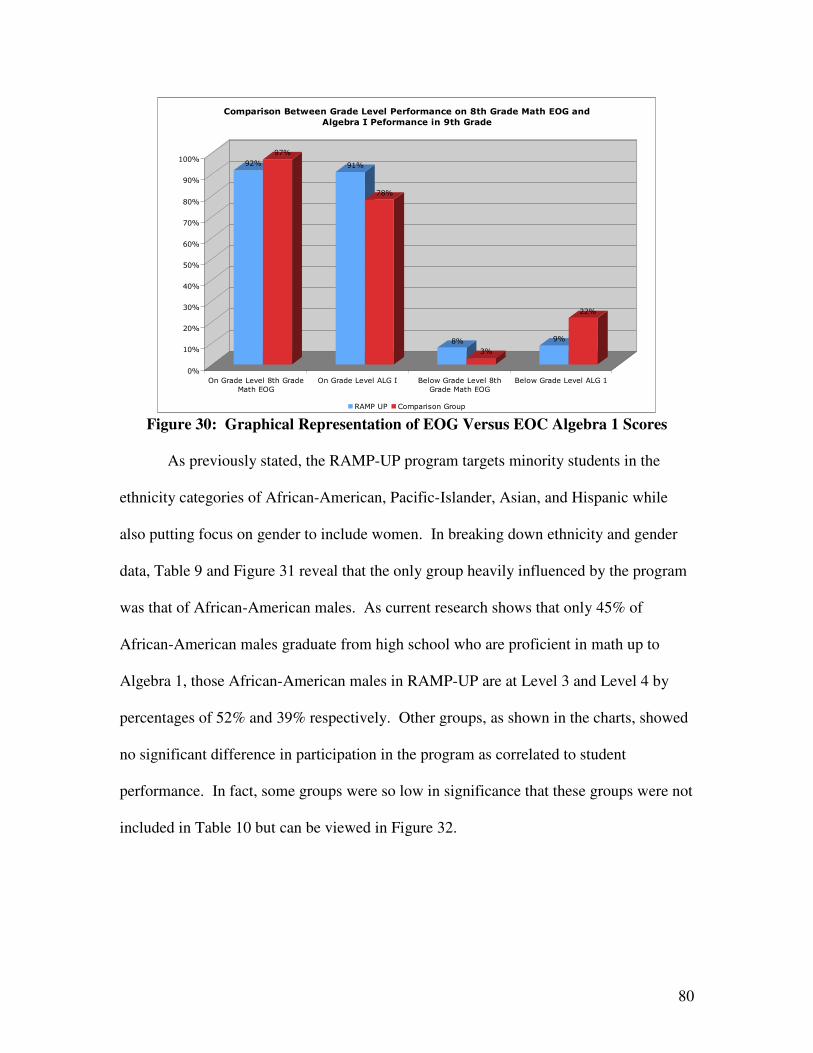
80
��
��
��
�
�
�
��
�
��
��
��
��
�
��
��
�
��
���
#��!��$������ ����!��$�
�����%#!
#��!��$������ ���!�& '� �(�!��$������ ���
!��$�������%#!
'� �(�!��$������ ���!��
��()�����*��+�����������&�$�������(������,�!�������-��!�#.�����
�$������%������(����� �!������
������� �����������!��"� Figure 30: Graphical Representation of EOG Versus EOC Algebra 1 Scores
As previously stated, the RAMP-UP program targets minority students in the
ethnicity categories of African-American, Pacific-Islander, Asian, and Hispanic while
also putting focus on gender to include women. In breaking down ethnicity and gender
data, Table 9 and Figure 31 reveal that the only group heavily influenced by the program
was that of African-American males. As current research shows that only 45% of
African-American males graduate from high school who are proficient in math up to
Algebra 1, those African-American males in RAMP-UP are at Level 3 and Level 4 by
percentages of 52% and 39% respectively. Other groups, as shown in the charts, showed
no significant difference in participation in the program as correlated to student
performance. In fact, some groups were so low in significance that these groups were not
included in Table 10 but can be viewed in Figure 32.
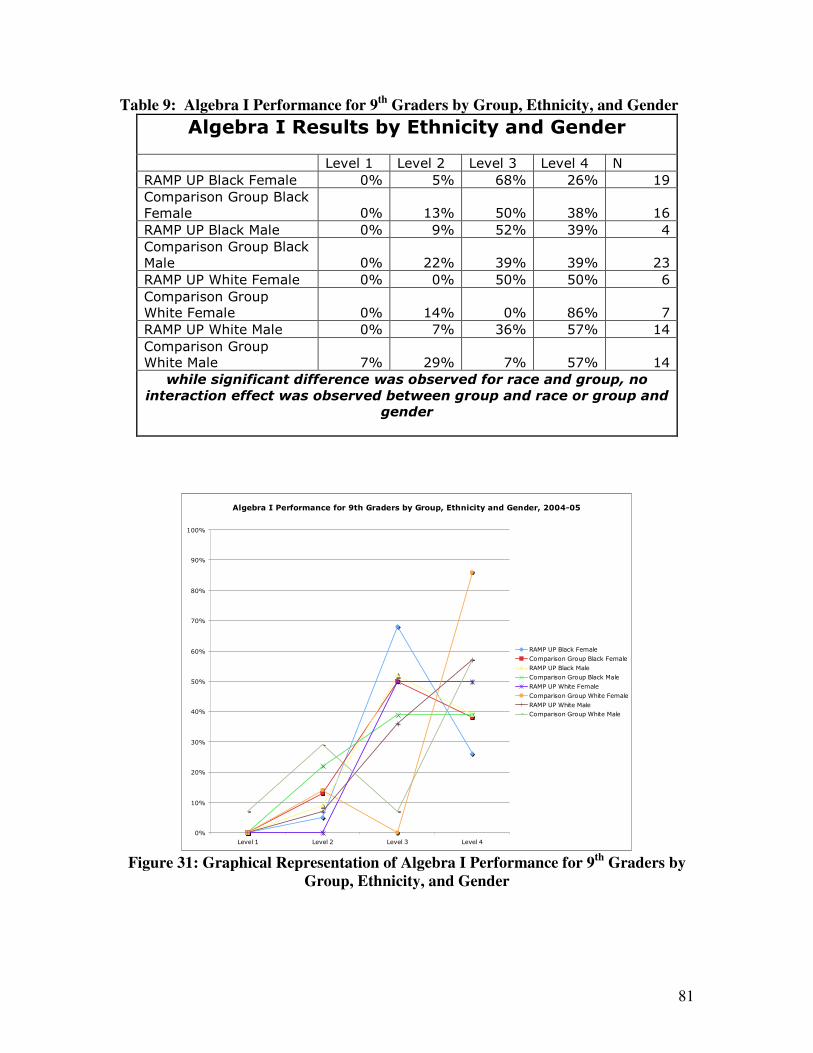
81
Table 9: Algebra I Performance for 9th Graders by Group, Ethnicity, and Gender �$������%�/���$������#�!�������������
��
�� ���� ��� ���� ��� ���� ��� ���� ��� )�
��������' �*+�,��� �� � � � � � �� � ���
�����������!��"��' �*+�
,��� �� � � �� � � � � � ���
��������' �*+��� �� � � � � � � �� � ��
�����������!��"��' �*+�
�� �� � � �� � �� � �� � ���
��������-�����,��� �� � � � � � � � � ��
�����������!��"��
-�����,��� �� � � �� � � � � � ��
��������-������� �� � � � � �� � � � ���
�����������!��"��
-������� �� � � �� � � � � � ���
������������� ������������������������������������������
� ���� ������ ���������������� ������������������������������
������
����
�$������%�������(�������� �!����������������)'�#�!������������'���� ���
�
��
��
��
��
�
��
��
�
��
���
���� �� ���� �� ���� �� ���� ��
��������' �*+�,��� �
�����������!��"��' �*+�,��� �
��������' �*+��� �
�����������!��"��' �*+��� �
��������-�����,��� �
�����������!��"��-�����,��� �
��������-������� �
�����������!��"��-������� �
Figure 31: Graphical Representation of Algebra I Performance for 9th Graders by
Group, Ethnicity, and Gender
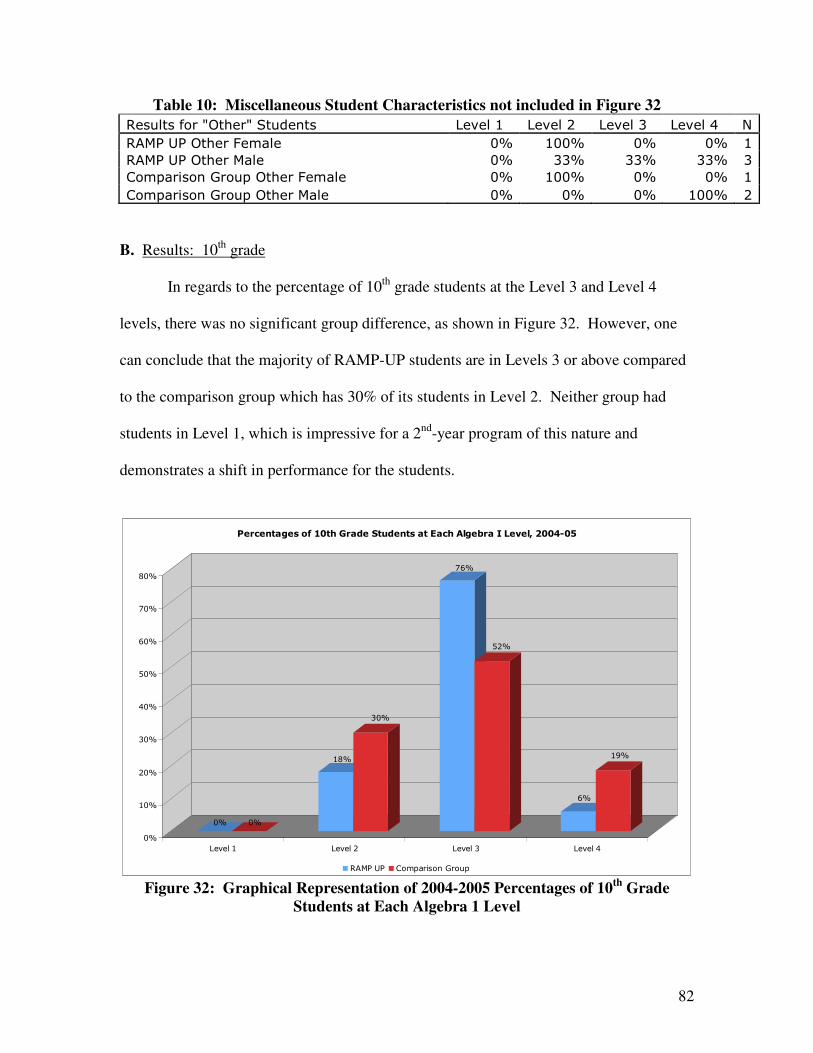
82
Table 10: Miscellaneous Student Characteristics not included in Figure 32 ���" ���.���/#����/�0�"$����� ���� ��� ���� ��� ���� ��� ���� ��� )�
��������#�����,��� �� � � ��� � � � � � ��
��������#������� �� � � �� � �� � �� � ��
�����������!��"��#�����,��� �� � � ��� � � � � � ��
�����������!��"��#������� �� � � � � � � ��� � ��
B. Results: 10th grade In regards to the percentage of 10th grade students at the Level 3 and Level 4
levels, there was no significant group difference, as shown in Figure 32. However, one
can conclude that the majority of RAMP-UP students are in Levels 3 or above compared
to the comparison group which has 30% of its students in Level 2. Neither group had
students in Level 1, which is impressive for a 2nd-year program of this nature and
demonstrates a shift in performance for the students.
� �
�
��
��
�
�
��
�
��
��
��
��
�
��
��
�
���� �� ���� �� ���� �� ���� ��
�����������������!�������"����������#��!��$������%���&�$'���� ���
������� �����������!��"� Figure 32: Graphical Representation of 2004-2005 Percentages of 10th Grade
Students at Each Algebra 1 Level
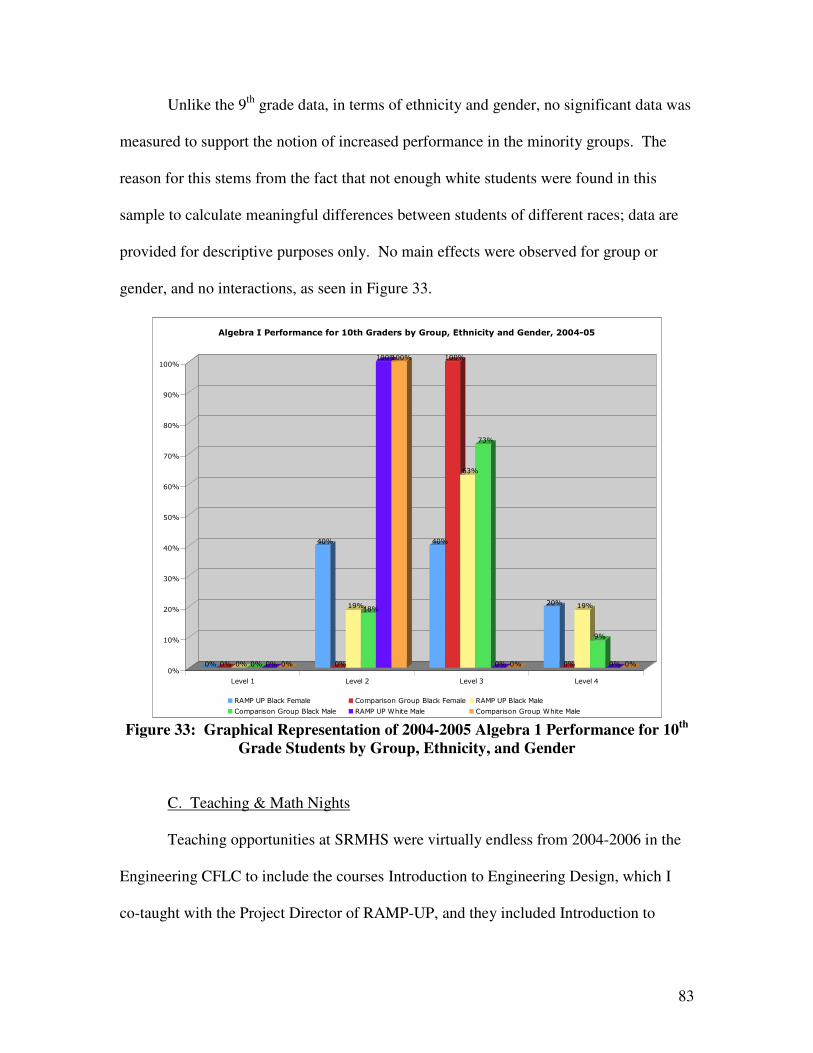
83
Unlike the 9th grade data, in terms of ethnicity and gender, no significant data was
measured to support the notion of increased performance in the minority groups. The
reason for this stems from the fact that not enough white students were found in this
sample to calculate meaningful differences between students of different races; data are
provided for descriptive purposes only. No main effects were observed for group or
gender, and no interactions, as seen in Figure 33.
� � � � � �
��
�
�� �
��� ���
��
���
��
��
� �
��
�
��
�
� � �
��
��
��
��
�
��
��
�
��
���
���� �� ���� �� ���� �� ���� ��
�$������%�������(�����������!����������������)'�#�!������������'���� ���
��������' �*+�,��� � �����������!��"��' �*+�,��� � ��������' �*+��� �
�����������!��"��' �*+��� � ��������-������� � �����������!��"��-������� � Figure 33: Graphical Representation of 2004-2005 Algebra 1 Performance for 10th
Grade Students by Group, Ethnicity, and Gender
C. Teaching & Math Nights
Teaching opportunities at SRMHS were virtually endless from 2004-2006 in the
Engineering CFLC to include the courses Introduction to Engineering Design, which I
co-taught with the Project Director of RAMP-UP, and they included Introduction to

84
Engineering Design, (IED). IED is the first course offered at SRMHS in the Project Lead
the Way (PLTW) course sequence. IED is a project based pre-engineering course which
challenges students to solve problems and communicate ideas just like an engineer
would. Students will use Inventor, which is Autodesk´s 3-D design package. Project
Lead The Way Inc. (PLTW) is a national program forming partnerships among Public
Schools, Higher Education Institutions and the Private Sector to increase the quantity and
quality of engineers and engineering technologists graduating from our education system.
PLTW has a course sequence of 6 courses with 2 more under development. Introduction
to Engineering Design, Principles of Engineering and Digital Electronics are the
introductory courses. Computer Integrated Manufacturing, Civil Engineering and
Architecture, Engineering Design and Development are the subsequent courses in the
PLTW curriculum.
Below are actual projects and designs that I assigned to the students for classwork
using the Inventor software and PLTW curriculum.
D. Innovation Designs (Organizer Projects)
In this assignment, students were tasked as designers in a company that produces
organizers for every purpose. Their specific task was to come up with a new design for a desktop
organizer. The constraints were as follows:
Constraints: The organizer:
Must be no bigger than 20” x 20” x 10” Must use 3/16” material Must have at least 4 different parts (fasteners do not count as a part). Must have at least 1 moving part. Must be easily manufactured.
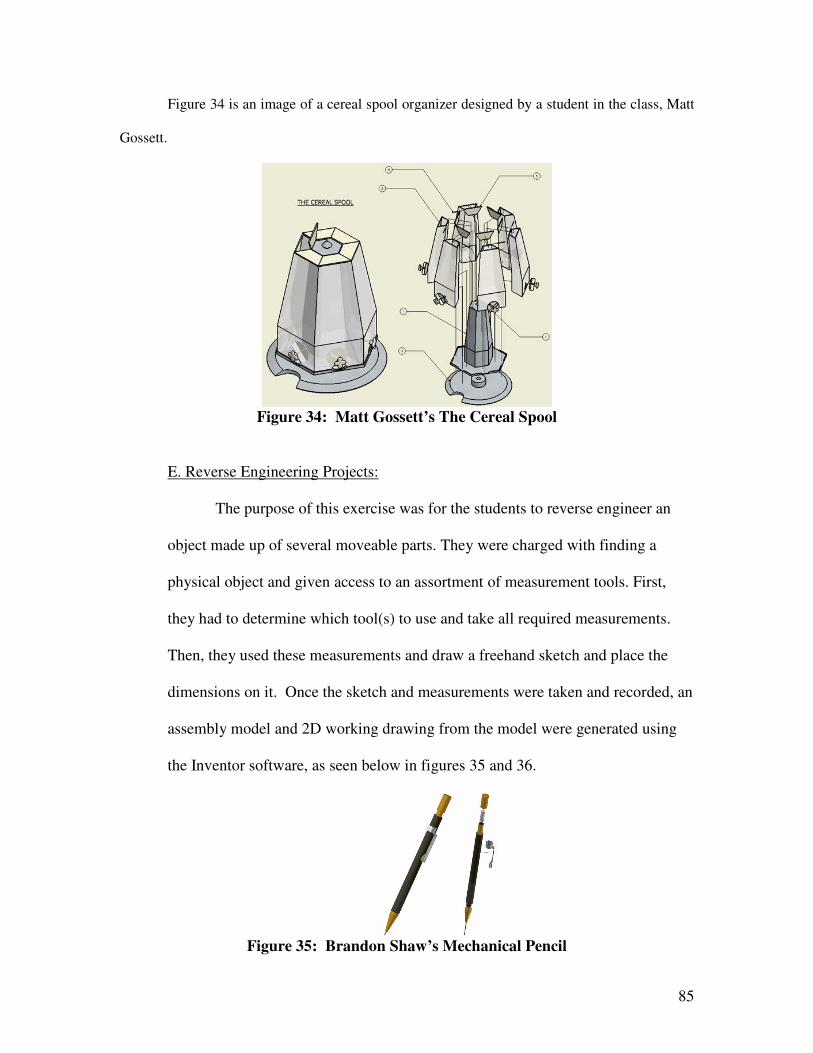
85
Figure 34 is an image of a cereal spool organizer designed by a student in the class, Matt
Gossett.
Figure 34: Matt Gossett’s The Cereal Spool
E. Reverse Engineering Projects:
The purpose of this exercise was for the students to reverse engineer an
object made up of several moveable parts. They were charged with finding a
physical object and given access to an assortment of measurement tools. First,
they had to determine which tool(s) to use and take all required measurements.
Then, they used these measurements and draw a freehand sketch and place the
dimensions on it. Once the sketch and measurements were taken and recorded, an
assembly model and 2D working drawing from the model were generated using
the Inventor software, as seen below in figures 35 and 36.
Figure 35: Brandon Shaw’s Mechanical Pencil
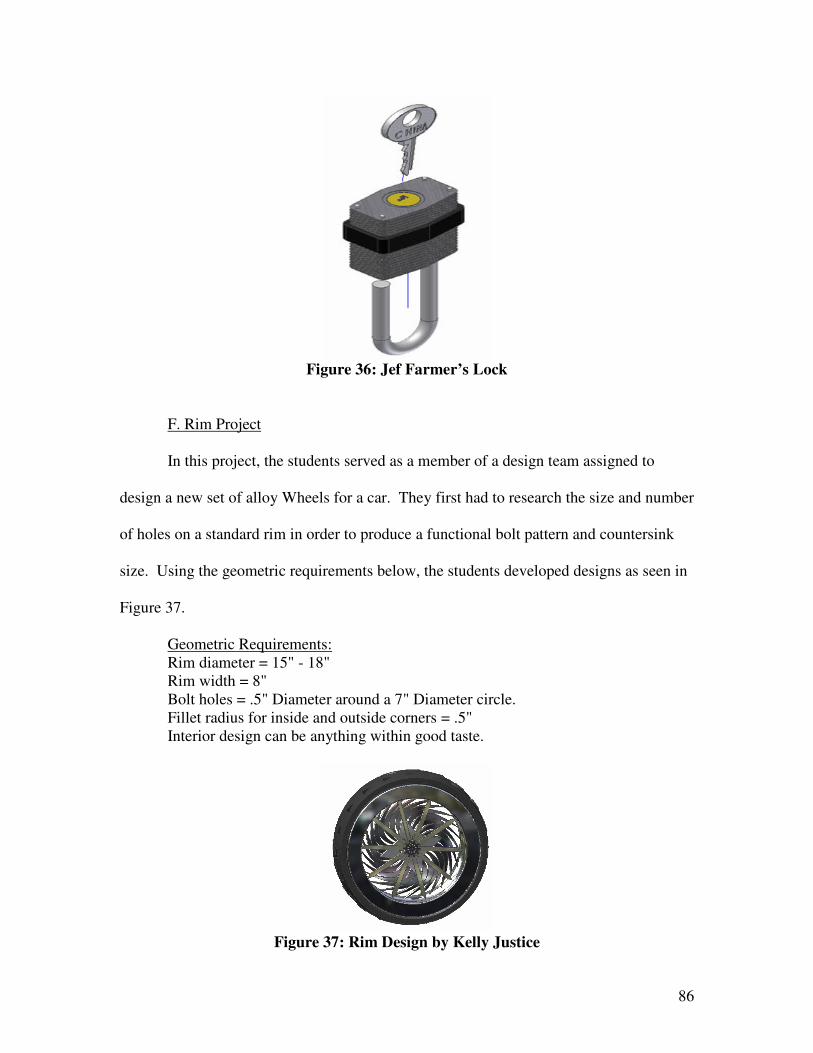
86
Figure 36: Jef Farmer’s Lock
F. Rim Project
In this project, the students served as a member of a design team assigned to
design a new set of alloy Wheels for a car. They first had to research the size and number
of holes on a standard rim in order to produce a functional bolt pattern and countersink
size. Using the geometric requirements below, the students developed designs as seen in
Figure 37.
Geometric Requirements: Rim diameter = 15" - 18" Rim width = 8" Bolt holes = .5" Diameter around a 7" Diameter circle. Fillet radius for inside and outside corners = .5" Interior design can be anything within good taste.
Figure 37: Rim Design by Kelly Justice
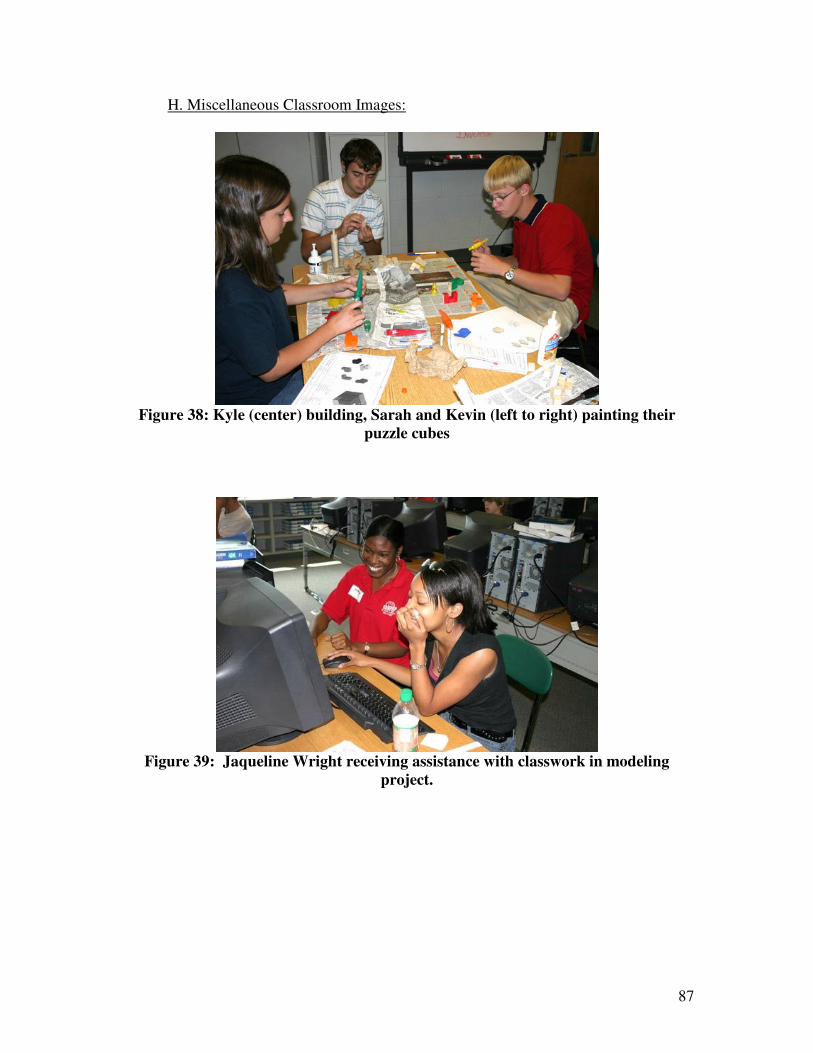
87
H. Miscellaneous Classroom Images:
Figure 38: Kyle (center) building, Sarah and Kevin (left to right) painting their
puzzle cubes
�
Figure 39: Jaqueline Wright receiving assistance with classwork in modeling project.
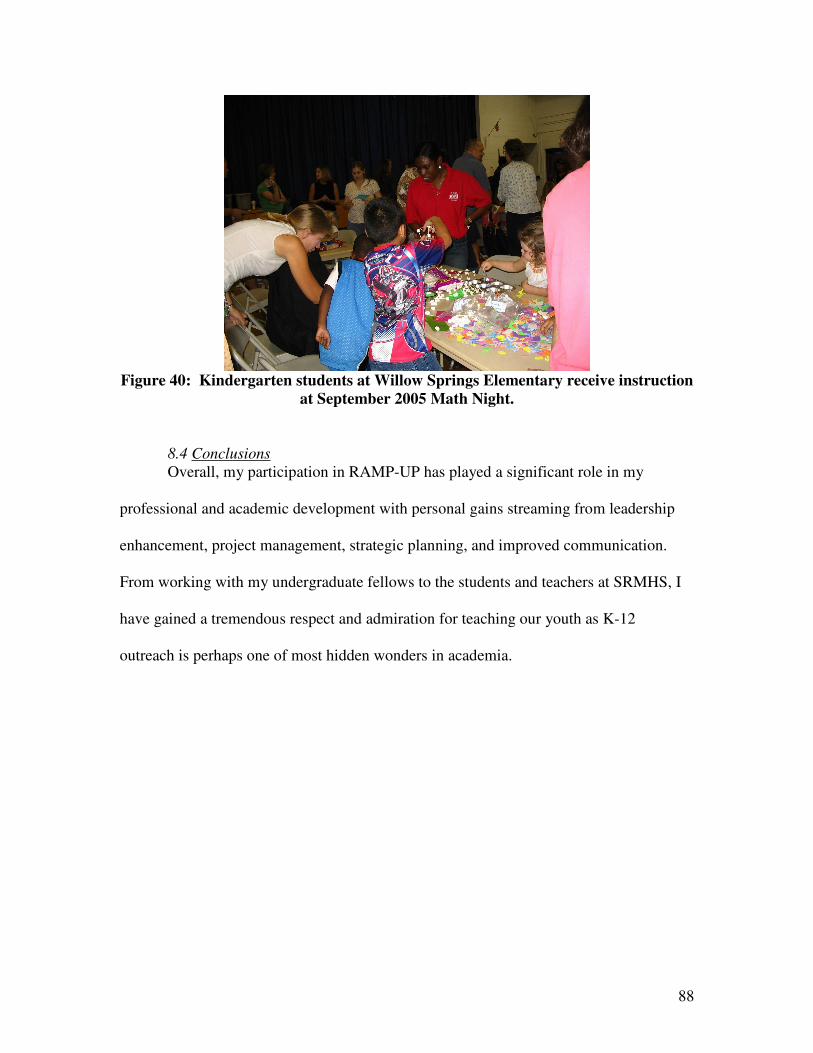
88
�
Figure 40: Kindergarten students at Willow Springs Elementary receive instruction at September 2005 Math Night.
8.4 Conclusions Overall, my participation in RAMP-UP has played a significant role in my
professional and academic development with personal gains streaming from leadership
enhancement, project management, strategic planning, and improved communication.
From working with my undergraduate fellows to the students and teachers at SRMHS, I
have gained a tremendous respect and admiration for teaching our youth as K-12
outreach is perhaps one of most hidden wonders in academia.
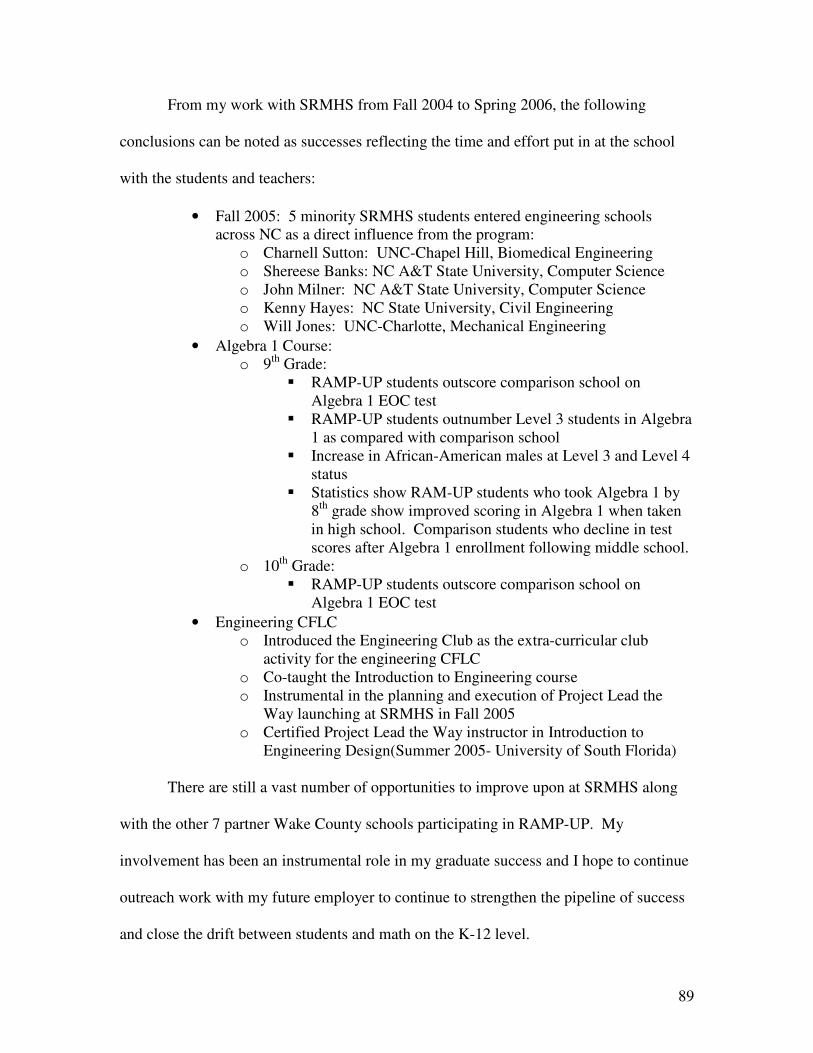
89
From my work with SRMHS from Fall 2004 to Spring 2006, the following
conclusions can be noted as successes reflecting the time and effort put in at the school
with the students and teachers:
• Fall 2005: 5 minority SRMHS students entered engineering schools across NC as a direct influence from the program:
o Charnell Sutton: UNC-Chapel Hill, Biomedical Engineering o Shereese Banks: NC A&T State University, Computer Science o John Milner: NC A&T State University, Computer Science o Kenny Hayes: NC State University, Civil Engineering o Will Jones: UNC-Charlotte, Mechanical Engineering
• Algebra 1 Course: o 9th Grade:
� RAMP-UP students outscore comparison school on Algebra 1 EOC test
� RAMP-UP students outnumber Level 3 students in Algebra 1 as compared with comparison school
� Increase in African-American males at Level 3 and Level 4 status
� Statistics show RAM-UP students who took Algebra 1 by 8th grade show improved scoring in Algebra 1 when taken in high school. Comparison students who decline in test scores after Algebra 1 enrollment following middle school.
o 10th Grade: � RAMP-UP students outscore comparison school on
Algebra 1 EOC test • Engineering CFLC
o Introduced the Engineering Club as the extra-curricular club activity for the engineering CFLC
o Co-taught the Introduction to Engineering course o Instrumental in the planning and execution of Project Lead the
Way launching at SRMHS in Fall 2005 o Certified Project Lead the Way instructor in Introduction to
Engineering Design(Summer 2005- University of South Florida)
There are still a vast number of opportunities to improve upon at SRMHS along
with the other 7 partner Wake County schools participating in RAMP-UP. My
involvement has been an instrumental role in my graduate success and I hope to continue
outreach work with my future employer to continue to strengthen the pipeline of success
and close the drift between students and math on the K-12 level.
90
9.0 REFERENCES
This list of references includes all cited and uncited sources from each chapter of this thesis. 1. Doshi, J.; Reneker, D. H. Journal of Electrostatics 1995, 35, 151. 2. MacDiarmid, A. G.; Jones, Jr., W. E.; Norris, I. D.; Gao, J.; Johnson, Jr, A. T.; Pinto, N. J.; Hone, J.; Han, B.; Ko, F. K.; Okuzaki, H.; Llaguno, M. Synthetic Metals 2001, 119, 27. 3. Reneker, D. H.; Chun, I. Nanotechnology 1996, 7, 216. 4. Formhals, A. US Patent 1975504, 1934. 5. Formhals, A. US Patent 2160962, 1939.568 SUBBIAH ET AL. 6. Formhals, A. US Patent 2187306, 1940. 7. Taylor, G. I. Proc Roy Soc London 1969, A313, 453. 8. Buchko, C. J.; Chen, L. C.; Yu, S.; Martin, D. C. Polymer 1999, 40, 7397. 9. Baumgarten, P. K. Journal of Colloid Interface Science 1971, 36, 71. 10. Larrondo, L.; Mandley, R. St. J. J Polym Sci: Polymer Physics Edn 1981, 909. 11. Larrondo, L.; Mandley, R. St. J. J Polym Sci: Polymer Physics Edn 1981, 921. 12. Hayati, I.; Bailey, A. I.; Tadros, T. F. J Colloid Interface Sci 1987, 117, 205. 13. Jaeger, R.; Bergshoef, M. M.; Batlle, C. M. I.; Holger, S.; Vancso, G. J. Macromol Symp 1998, 127, 141. 14. Deitzel, J. M.; Kleinmeyer, J.; Harris, D.; BeckTan, N. C Polymer 2001, 42, 261. 15. Deitzel, J. M.; Kleinmeyer, J. D.; Hirvonen, J. K.; BeckTan, N. C Polymer 2001, 42, 8163. 16. Warner, S. B.; Buer, A.; Grimler, M.; Ugbolue, S. C.; Rutledge, G. C.; Shin, M. Y. National Textile Center Annual Report November 1998, 83. 17. Moses, M.; Hohman, M. M.; Shin, Y. M.; Rutledge, G. C.; Brenner, M. P. Phys Fluids 2001, 13, 2201. 18. Moses, M.; Hohman, M. M.; Shin, Y. M.; Rutledge, G. C.; Brenner, M. P. Phys Fluids 2001, 13, 2221.
91
19. Shin, Y. M.; Hohman, M. M.; Brenner, M. P.; Rutledge, G. C. Polymer 2001, 42, 9955. 20. Spivek, A. F.; Dzenis, Y. A. Inst Penn Conf 1999, 163, 175. 21. Gibson, P. W.; Gibson, H. L.; Rivin, D. AIChe J 1999, 45, 190. 22. Deitzel, J. M.; BeckTan, N. C.; Kleinmeyer, J. D.; Rehrmann, J.; Tevault, D. Army Research Laboratory Technical Report 1999, ARL-TR-1989. 23. Yarin, A. L.; Koombhongse, S.; Reneker, D. H. J Appl Phys 2001, 89, 5. 24. Raleigh, X. L. Philosophical Magazine, 1884, 44, 184. 25. Zeleny, J. Phys Rev 1917, 10, 1. 26. Yarin, A. L.; Koombhongse, S.; Reneker, D. H. J Appl Phys 2001, 89, 3018. 27. Cloupeau, M.; Prunet-Foch, B. J of Electrostatics 1990, 25, 165. 28. Grace, J. M.; Marijnissen, J. C. M. J of Aerosol Science 1994, 25, 1005. 29. Shin, Y. M.; Hohman, M. M.; Brenner, M. P.; Rutledge, G. C. Appl Phys Lett 2001, 78, 1149. 30. Darby, R. Viscoelastic Fluids; Marcel Dekker: New York, 1976. 31. Yarin, A. L. Free Liquid Jets and Films: Hydrodynamics and Rheology; Longman: New York, 1993. 32. Spivak, A. F.; Dzenis, Y. A.; Reneker, D. H. Mechanics Research Communications 2001, 27, 37. 33. Reneker, D. H.; Yarin, A. L.; Fong, H.; Koombhongse, S. J Appl Phys 2000, 87, 4531. 34. Fridrikh, S. V.; Yu, J. H.; Brenner, M. P.; Rutledge, G. C. Physical Review Letters, 2003, 90, 144502. 35. Ramkumar, S. S.; Sastri, L. ATA J 2002, Aug/Sep, 49. 36. http://www.espintechnologies.com/ accessed 12/24/2003. 37. http://www.donaldson.com/en/filtermedia/nanofibers/index.html accessed 12/24/2003.
92
38. Koombhongse, S.; Liu, W.; Reneker, D. H. J Polym Sci: Part B: Polymer Physics 2001, 39, 2598. 40. http://www.che.vt.edu/Wilkes/electrospinning/electrspinning. html. 41. Bognitzki, M.; Czado, W.; Frese, T.; Schaper, A.; Hellwig, M.; Steinhart, M.; Greiner, A.; Wendorff, H. Adv Mater 2001, 13, 70. 42. Kim, Y.; Reneker, D. H. Polymer Engineering and Science 1999, 39, 849. 43. Fong, H.; Liu, W.; Wang, C.; Vaia, R. A. Polymer 2002, 43, 775. 44. Tsai, P. P.; Gibson, H.; Gibson, P. J of Electrostatics 2002, 54, 333. 45. Lee, K. H.; Kim, H. Y.; La, Y. M.; Lee, D. R.; Sung, N. H. J Polym Sci: Part B: Polymer Physics 2002, 40, 2259. 46. Demir, M. M.; Yilgor, I.; Yilgor, E.; Erman, B. Polymer 2002, 43, 3303. 47. Reneker, D. H.; Kataphinan, W.; Theron, A.; Zussman, E.; Yarin, A. L. Polymer 2002, 43, 6785. 48. Fong, H.; Reneker, D. H. J Polym Sci: Part B: Polymer Physics 1999, 37, 3488. 49. Jun, Z.; Hou, H.; Schaper, A.; Wendorff, J. H.; Greiner, A.e-polymers 2003, 9. 50. Deitzel, J. M.; Kosik, W. E.; McKnight, S. H.; BeckTan, N. C.; DeSimone, J. M.; Crette, S. ARL Technical Report 2001, ARLTR-2512. 51. Kenawy, E.-R.; Bowlin, G. L.; Mansfield, K.; Layman, J.; Simpson, D. G.; Sanders, E. H; Wnek, G. E. J of Controlled Release 2002, 81, 57. 52. Srinivasan, G.; Reneker, D. H. Polymer International 1995, 36, 195. 53. Kim, J.; Lee, D. S. Polymer Journal 2000, 32, 616. 54. Subbiah, T; Ramkumar, S. S. Proc International Conf, High Performance Textiles and Apparels, July 2004, 81. 55. Megelski, S.; Stephens, J. S.; Chase, D. B.; Rabolt, J. F. Macromolecules 2002, 35, 8456. 56. Srinivasarao, M.; Collings, D.; Philips, A.; Patel, S. Science 2001, 292, 79.
93
57. Zong, X. H.; Kim, K.; Fang, D. F.; Ran, S. F.; Hsiao, B. S.; Chu, B. Polymer 2002, 43, 4403. 58. Bognitzki, M.; Frese, T.; Steinhart, M.; Greiner, A.; Wendorff, J. H. Polymer Engineering and Science 2001, 41, 982. 59. Gibson, H.; Gibson, P.; Senecal, K.; Sennett, M.; Walker, J.; Yeomans, W.; Ziegler, D. J of Advanced Materials 2002, 34, 44. 60. Kim, J. S.; Reneker, D. H. Polymer Composites 1999, 20, 124. 61. http://www.electrovac.com/en/cnt division.htm accessed 08/15/2003. 62. http://www.rheofuture.de/papers2002/190902_us_01.pdf dated 01/18/2005. 63. Ma, H.; Zeng, J.; Realff, M. L.; Kumar, S.; Schiraldi, D. A. Composites Science and Technology 2003, 63, 1617. 64. Li, W.; Laurencin, C. T.; Caterson, E. J.; Tuan, R. S.; Ko, F. K. J of Biomedical Materials Research 2002, 60, 613. 65. http://www.acell.com dated 01/19/2005. 66. Boland, E. D.; Wnek, G. E.; Simpson, D. G.; Pawlowski, K. J.; Bowlin, G. L. J Macromol Sci-Pure Appl Chem 2001, A38, 1231. 67. Matthews, J. A.; Wnek, G. E.; Simpson, D. G.; Bowlin, G. L. Biomacromolecules 2002, 3, 232. 68. Huang, L.; Apkarian, R. P.; Chaikof, E. L. Scanning 2001, 23, 372. 69. Huang, L.; Nagapudi, K.; Apkarian, R. P.; Chaikof, E. L. J Biomaterials Science Polymer Edition 2001, 12, 979. 70. Jia, H.; Zhu, G.; Vugrinovich, B.; Kataphinan, W.; Reneker, D. H.; Wang, P. Biotechnol Prog 2002, 18, 1027. 71. Matalov-Meytal, Y.; Sheintuch, M. Applied Catalysis A: General 2002, 231, 1. 72. Rodriguez, N. M.; Kim, M.; Baker, R. T. K. J Phys Chem 1994, 98,13108. 73. http://www.donaldson.com/en/filtermedia dated 01/18/2005.
94
74. Gibson, H.; Gibson, P. http://www.asc2004.com dated 01/18/2005. 75. Doshi, J.; Mainz, M. H.; Bhat, G. S. Proceedings of the 10th TANDEC Conference 2000, Knoxville, TN. 76. Lee, Y.; Bhat, G. Processing and Fabrication of Advanced Materials for High Temperature Applications, Ed. T. S. Srivatsan and R. A. Varin; The Materials Society: Warrendale, PA, 2003. 77. http://techreports.larc.nasa.gov/ltrs/PDF/2003/aiaa/ NASA-aiaa-2003–1768.pdf accessed 18/16/2003. 78. Gibson, H. S.; Senecal, K.; Sennett, M.; Huang, Z.; Wen, J.; Li, W.; Wang, D.; Yang, S.; Tu, Y.; Ren, Z.; Sung, C. Proceedings of the 197th Meeting of Electrochemical Society 2000, Toronto, Canada. http://lib1.store.vip.sc5.yahoo.com/lib/nanolab2000/Composites.pdf

95
10.0 APPENDIX
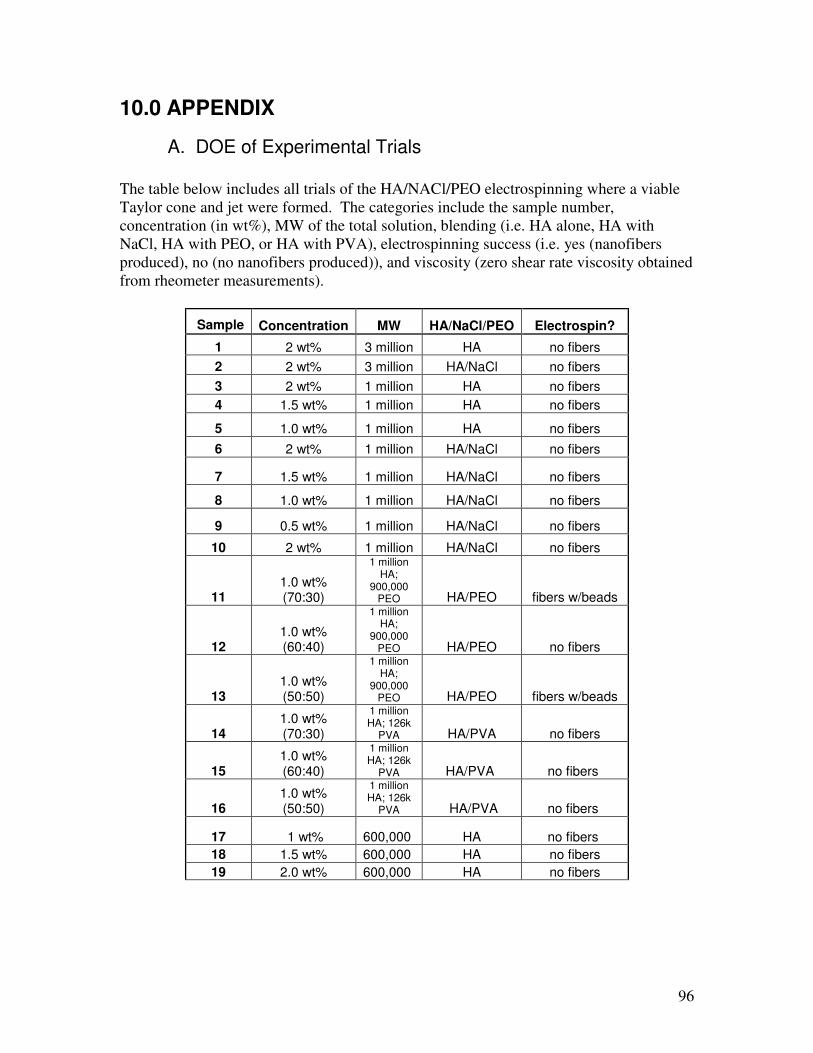
96
10.0 APPENDIX
A. DOE of Experimental Trials The table below includes all trials of the HA/NACl/PEO electrospinning where a viable Taylor cone and jet were formed. The categories include the sample number, concentration (in wt%), MW of the total solution, blending (i.e. HA alone, HA with NaCl, HA with PEO, or HA with PVA), electrospinning success (i.e. yes (nanofibers produced), no (no nanofibers produced)), and viscosity (zero shear rate viscosity obtained from rheometer measurements).
Sample Concentration MW HA/NaCl/PEO Electrospin?
1 2 wt% 3 million HA no fibers 2 2 wt% 3 million HA/NaCl no fibers 3 2 wt% 1 million HA no fibers 4 1.5 wt% 1 million HA no fibers
5 1.0 wt% 1 million HA no fibers 6 2 wt% 1 million HA/NaCl no fibers
7 1.5 wt% 1 million HA/NaCl no fibers
8 1.0 wt% 1 million HA/NaCl no fibers
9 0.5 wt% 1 million HA/NaCl no fibers
10 2 wt% 1 million HA/NaCl no fibers
11 1.0 wt% (70:30)
1 million HA;
900,000 PEO HA/PEO fibers w/beads
12 1.0 wt% (60:40)
1 million HA;
900,000 PEO HA/PEO no fibers
13 1.0 wt% (50:50)
1 million HA;
900,000 PEO HA/PEO fibers w/beads
14 1.0 wt% (70:30)
1 million HA; 126k
PVA HA/PVA no fibers
15 1.0 wt% (60:40)
1 million HA; 126k
PVA HA/PVA no fibers
16 1.0 wt% (50:50)
1 million HA; 126k
PVA HA/PVA no fibers
17 1 wt%
600,000 HA no fibers 18 1.5 wt% 600,000 HA no fibers 19 2.0 wt% 600,000 HA no fibers
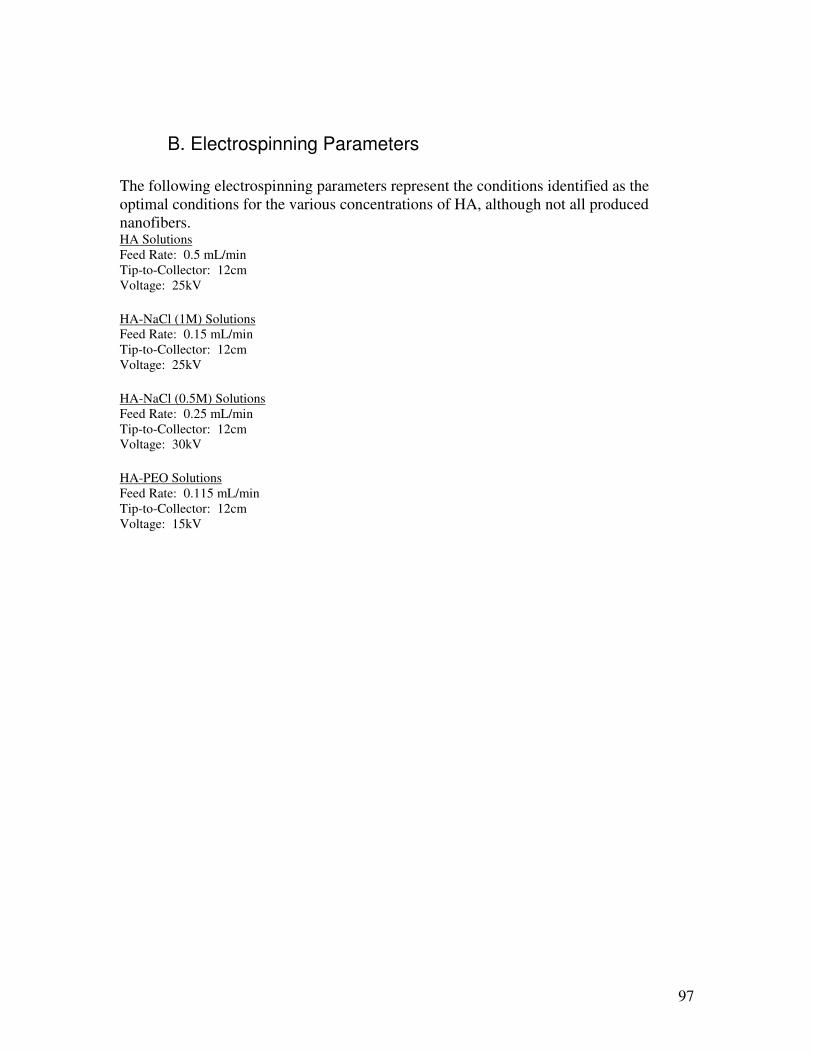
97
B. Electrospinning Parameters The following electrospinning parameters represent the conditions identified as the optimal conditions for the various concentrations of HA, although not all produced nanofibers. HA Solutions Feed Rate: 0.5 mL/min Tip-to-Collector: 12cm Voltage: 25kV HA-NaCl (1M) Solutions Feed Rate: 0.15 mL/min Tip-to-Collector: 12cm Voltage: 25kV HA-NaCl (0.5M) Solutions Feed Rate: 0.25 mL/min Tip-to-Collector: 12cm Voltage: 30kV HA-PEO Solutions Feed Rate: 0.115 mL/min Tip-to-Collector: 12cm Voltage: 15kV


![Hierarchical porous carbon nanofibers via electrospinningcarbonlett.org/Upload/files/CARBONLETT/[01-14]-01.pdf · Hierarchical porous carbon nanofibers via electrospinning ... major](https://img.pdfslide.us/doc/110x75/5b2cbfa67f8b9ae16e8b6d56/hierarchical-porous-carbon-nanofibers-via-elect-01-14-01pdf-hierarchical-porous.jpg)