Embed Size (px)
Citation preview

1
Mingle Monday Event
June 20th, 2016
Sales Activity, Metrics and Compensation

AGENDA
2
• Welcome and introductions
• Managing Sales Activities, Metrics, Compensation - Best Practices
• Exercise: Barriers & Drivers
• Recap

Our Focus is on Driving Your Business Growth
3
MARKETINGDefine, develop,
communicate and deliver offerings that have value for
your customers
SALESBoosting commercial
performance enabling you to find, win and retain
customers
TRANSFORMATIONBuilding organizational focus,
capabilities and the necessary change to win more in the market
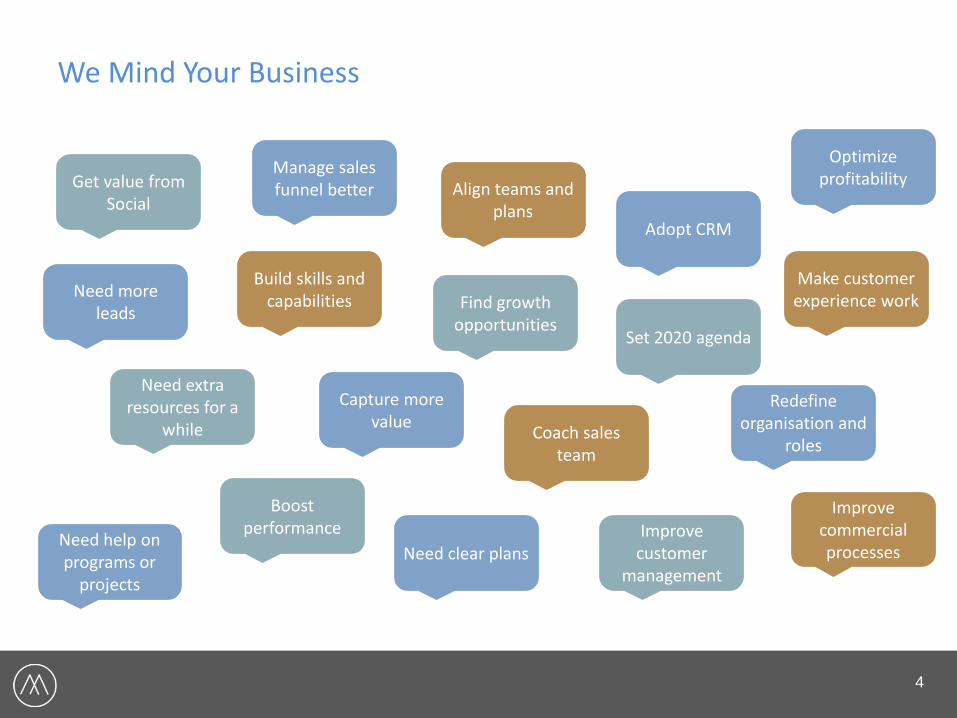
We Mind Your Business
4
Build skills and capabilities Find growth
opportunitiesSet 2020 agenda
Coach sales team
Capture more value
Need extra resources for a
while
Boost performance
Need clear plans
Improve commercial processes
Need more leads
Need help on programs or
projects
Align teams and plans
Manage sales funnel betterGet value from
Social
Optimize profitability
Redefine organisation and
roles
Improve customer
management
Make customer experience work
Adopt CRM

We Mind Your Business
5
INTERIM SERVICES
Specialist marketing and sales resources to fill organizational
gaps
CONSULTING SERVICES
Experts to define stragegy or manage projects/programs
TRAINING COACHING
Trainers or advisors to build capabilities of people and teams
EXPERT RESOURCING ACADEMYCONSULTING

Opportunistic
• Mission/Vision• Business Strategy• Commercial Planning• Sales & Marketing Alignment• Organisation Design• Change Leadership
• Sales Process• Account
Management• Sales
Management• Social Selling
Strategy & Transformation
Marketing (7P‘s) Performance
Sales Performance
EXPERT RESOURCING
Through our network of Seasoned ProfessionalsMarketing 7 P’s
Project ManagersBusiness Managers
Interim Management
Search & Recruitment
In Company Trajectories
Public Trainings
ACADEMY
Annual Marketing & Sales Performance
Summit
Periodic Events
Lectures & Webinars
Flexible Service Solutions To Help Drive Growth
6
• Product/Portfolio Mgmt, NPD, Innovation• Promotion, Marcom, Direct Mktg, GTM• Pricing, value based pricing & profitability• Place, Channel, Indirect, Segments• People, Team, Organisation• Process, Customer Focus & Xp, CRM• Physical Environment, Sales/Staff
CONSULTING

Nurture Long Term Client Relationships
Household Names… Industry Leaders… as well as SME’s & Entrepreneurs…
7

Minds&More Academy
8
ACADEMY

Minds&More Academy
9
ACADEMY

Minds&More Academy
10
ACADEMY

AGENDA
11
• Welcome and introductions
• Managing Sales Activities, Metrics, Compensation - Best Practices
• Exercise: Barriers & Drivers
• Recap

COMMON SALES PERFORMANCE CHALLENGES WE SEE
1. Sales visits, prospection, opportunity management activities not at target levels
i.e. Follow-up to lead activity is weak
Not executing the relevant sales activities
2. Lack of differentiation between high & low performers
3. Ineffective KPIs and Weak sales management
4. Sales reps too ‘comfortable’ with their income (incentives) and lack drive to get new business
5. Sales community or sales teamwork that is suffering
i.e. Sales people turnover
i.e. Not enough sharing, not leveraging power of the team
12
Misalignment or missed
opportunities to support the
business goals and the business
strategy

Revenue
Customer Satisfaction
Market Share
Ramp-Up Time
IT Investment
Training Type
Coaching
Account Plan Completion
Tool Usage
Segment of Customer
Call Volume
Call Type
Up/Cross-Selling
Number of AccountsTime Allocation
Quota Achievement
Share-of-Wallet
Process Usage
Training Investment
Skill LevelTerritory Coverage
New/Existing CustomersCall Outcomes
Customer Retention
Deal Size
Prospect Type
New/Existing Product
Pipeline Size
METRICS: 306 PIECES OF CHAOS
Can we manage this metric?
Source: Vantage Point – Cracking Sales Management Code13

THE FOG STARTS TO CLEAR
Revenue
Customer Satisfaction
Market Share
Ramp-Up Time
IT Investment
Training Type
Coaching
Account Plan Completion
Tool Usage
Segment of Customer
Call Volume
Call Type
Up/Cross-Selling
Number of AccountsTime Allocation
Quota Achievement
Share-of-Wallet
Process Usage
Training Investment
Skill LevelTerritory Coverage
New/Existing CustomersCall Outcomes
Customer Retention
Deal Size
Prospect Type
New/Existing Product
Pipeline Size
Source: Vantage Point – Cracking Sales Management Code14

THREE TYPES OF METRICS
Business Result: A measure of the health (or success) of an organization.
Sales Objective: A measure of sales force performance.
Sales Activities: A measure of seller action or behavior.
Cannot be “managed”
Can only be influenced
Can be directly managed
AL
IG
N
A
R
O
Source: Vantage Point – Cracking Sales Management Code15

PREVALENCE OF SALES METRICS BY CATEGORY
28%
55%
17%
0%
10%
20%
30%
40%
50%
60%
Business Results Sales Objectives Sales Activities
Directly Manageable
R O A
Source: Vantage Point – Cracking Sales Management Code16

AGENDA
17
• Welcome and introductions
• Managing Sales Activities, Metrics, Compensation - Best Practices
• Exercise: Barriers & Drivers
• Recap

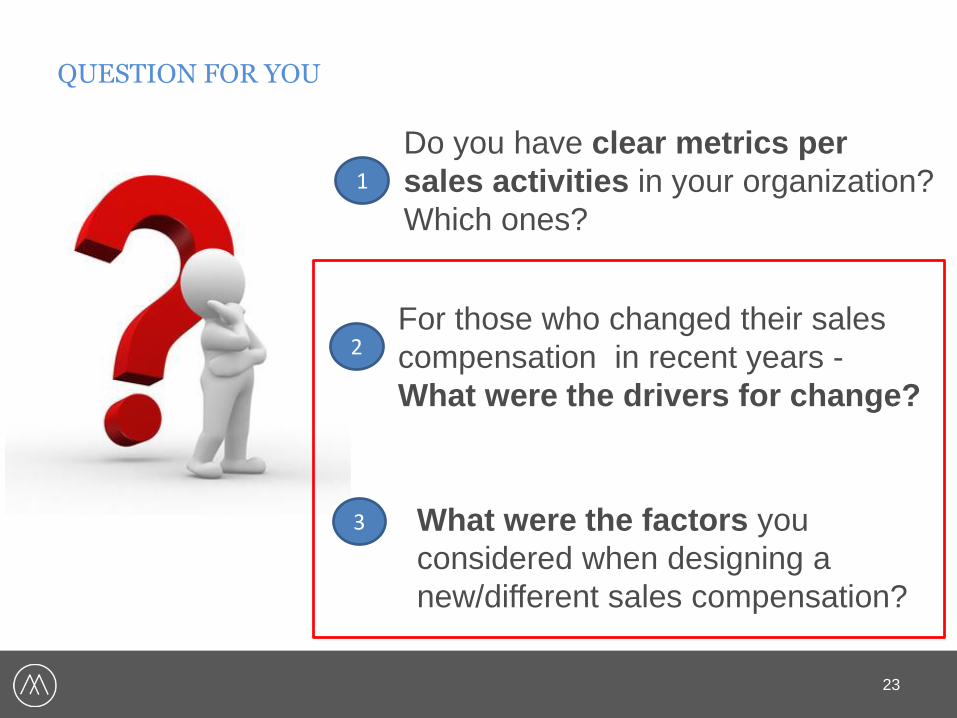
QUESTION FOR YOU
18
For those who changed their sales
compensation in recent years -
What were the drivers for change?
What were the factors you
considered when designing a
new/different sales compensation?
2
3
Do you have clear metrics per
sales activities in your organization?
Which ones?
1

QUESTION FOR YOU
19
Do you have clear metrics per
sales activities in your organization?
Which ones?
1

ENSURE LINK ACTIVITIES TO SUPPORT OBJECTIVES AND RESULTS
20
IT Investment
Training Type
Coaching
Account Plan Completion
Tool Usage Call Volume
Number of Accounts
Call TypeTime Allocation
Process Usage
Training Investment
Prospect Type
Ramp-Up Time
Segment of Customer
New/Existing Customers
Share-of-Wallet
Skill Level
Up/Cross-SellingCall Outcomes
Customer Retention
Deal Size
New/Existing Product
Revenue
Customer Satisfaction
Market Share Quota Achievement
Pipeline SizeVolume
Business Results: Multi-dimensional outcomes that cannot be managed
Territory Coverage
Sales Objectives: Require consent and can be influenced
Sales Activities: Individual decisions that are highly manageable
1

PREVALENCE – METRICS ACTIVITIES
21
8% 6%
13%
23%
51%
0%
10%
20%
30%
40%
50%
60%
Making Sales Calls
WinningDeals
Growing Accounts
Mining Territories
Enabling Sellers
1

COACHING MODEL
22
E X E C U T E
AL
IGN
Execute the Activities in a management Rhythm, with structured Conversations
E X E C U T E
A R C
AlignResults,
Objectives, and
Activities
AL
IG
N
A
R
O
Continually assess performance against the expected Results
1
QUESTION FOR YOU
23
For those who changed their sales
compensation in recent years -
What were the drivers for change?
What were the factors you
considered when designing a
new/different sales compensation?
2
3
Do you have clear metrics per
sales activities in your organization?
Which ones?
1

SALES COMPENSATION
24
2

25Source: 2015 CSO Insights

COMPENSATION
• Compensation needs to be designed to drive desired behaviors and aligned with the stage your business is in at the time
1. The customer acquisition plan
2. The customer success and retention plan
3. The sustainable growth plan.
26
2

RESULTS FROM CSO STUDY
27Source: 2015 CSO Insights
2

DRIVERS FOR COMPENSATION / INCENTIVE
28
Company
Sales Force
Customer
When selecting a new incentive compensation plan, review for the impact on each:
Source: MHI Group
3

EACH ARE IMPORTANT
29
• Reward• Recognition• Sales• Job Satisfaction
• Product satisfaction
• Satisfied with salesperson
• Future sales
• Sales Volume• Profits• Retention of top
salespeople
Purchasing PowerChooses ActivityEstablishes Incentive
Plan(s)
“We made our financial goals”
“This company met our needs”, we will buy again!
“We made a good income”
Company Sales Force Customer
Results
Source: MHI Group
3

IS THE PROBLEM ALWAYS THE COMPENSATION PLAN?
“NO!”
30
3

THE SALES MANAGEMENT SYSTEM
Environmental Competitors
• Take a close look at your sales force effectiveness drivers
before assuming the issue is a compensation issue
Sales force effectiveness
driversSalespeople
Sales force activities
Customer Results
Company Results
Source: MHI Group 31
3

DIAGNOSING SALES FORCE ISSUES
Sales force effectiveness drivers
Shapers• Recruiting / Training• Coaching• Culture• Compensation
Enlighteners• Customer Research• Target• Data & Tools / CRM System
Energizers• Leadership• Compensation• Motivation• Meaningful Work
Controllers• Performance Management• Communications – Vertical & Horizontal• Compensation
Definers:• Sales Strategy• Go-To-Market
Strategy• Sales Force Design
Sales Job Drivers
Salesperson Drivers
Source: MHI Group 32
3

THE “3 C’S”
33
Consistency
Carefully evaluate potential incentive plans for the following “before” selecting the best plan
Consequences
Compatibility
Source: MHI Group
3

AGENDA
34
• Welcome and introductions
• Managing Sales Activities, Metrics, Compensation - Best Practices
• Exercise: Barriers & Drivers
• Recap

RECAP
35

MINDS&MORE ACADEMY
36