Embed Size (px)
Citation preview

Finding our futurein Retail
Greg Maloney
President & CEO
JLL Americas Retail,
ICSC Board of Trustees
Today’s topics
Three Forces Shaping
Retail Today
Five Trends Impacting
Retail’s Future
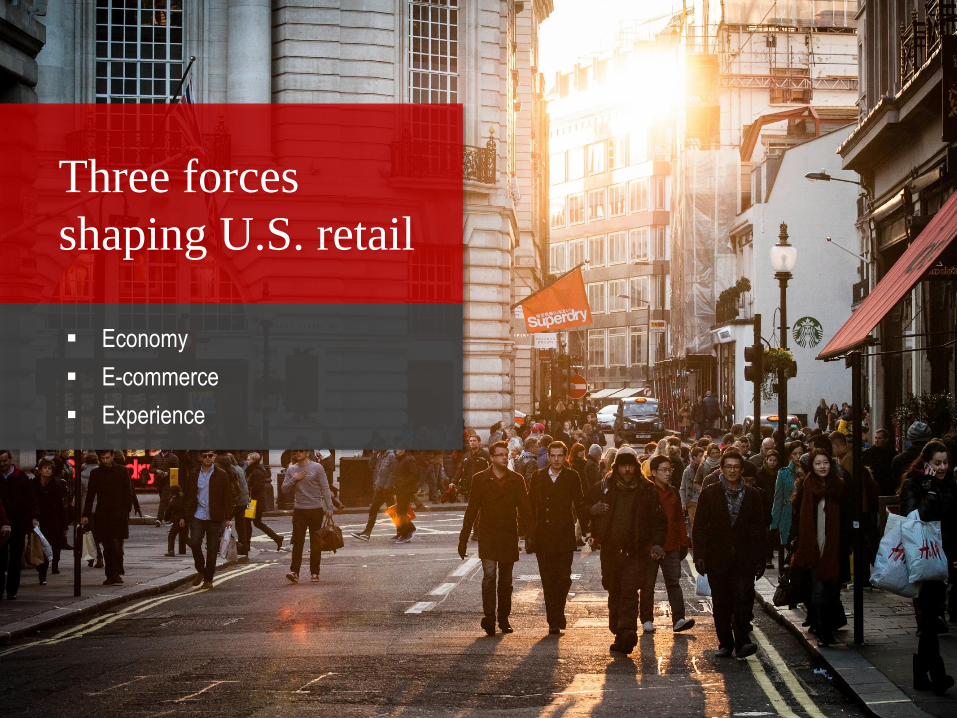
Three forces
shaping U.S. retail
Economy
E-commerce
Experience
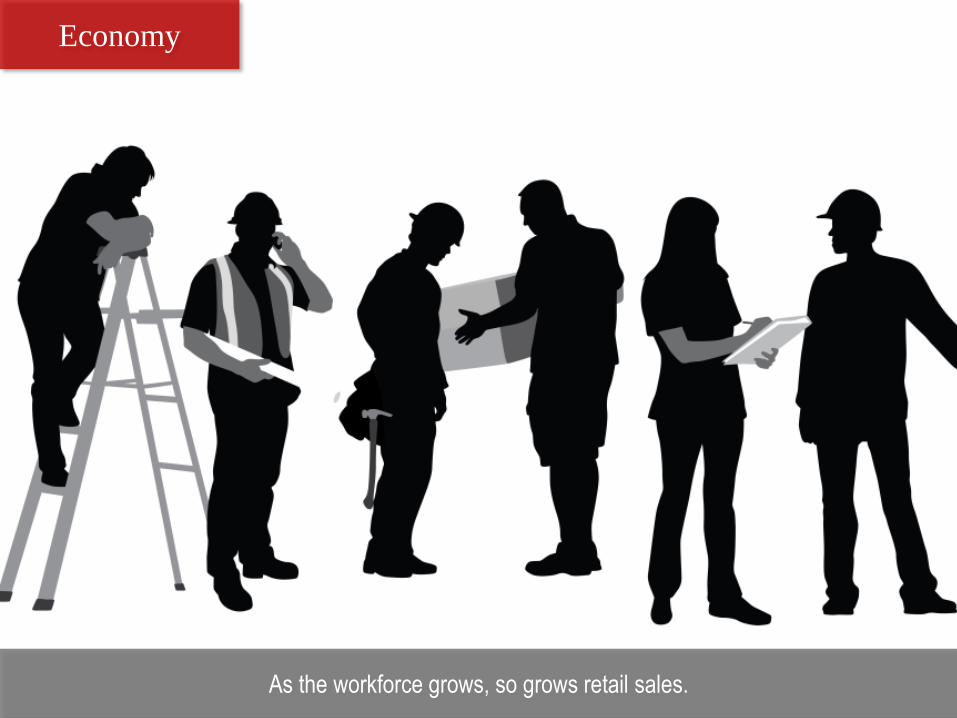
Economy
As the workforce grows, so grows retail sales.
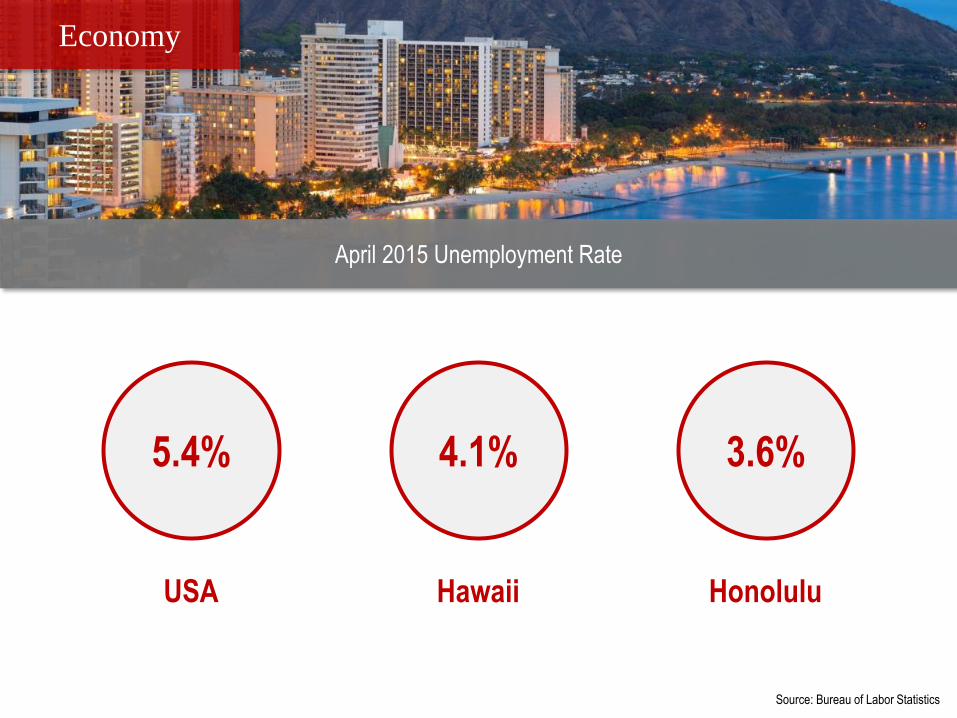
April 2015 Unemployment Rate
Economy
Source: Bureau of Labor Statistics
5.4%
USA
4.1%
Hawaii
3.6%
Honolulu
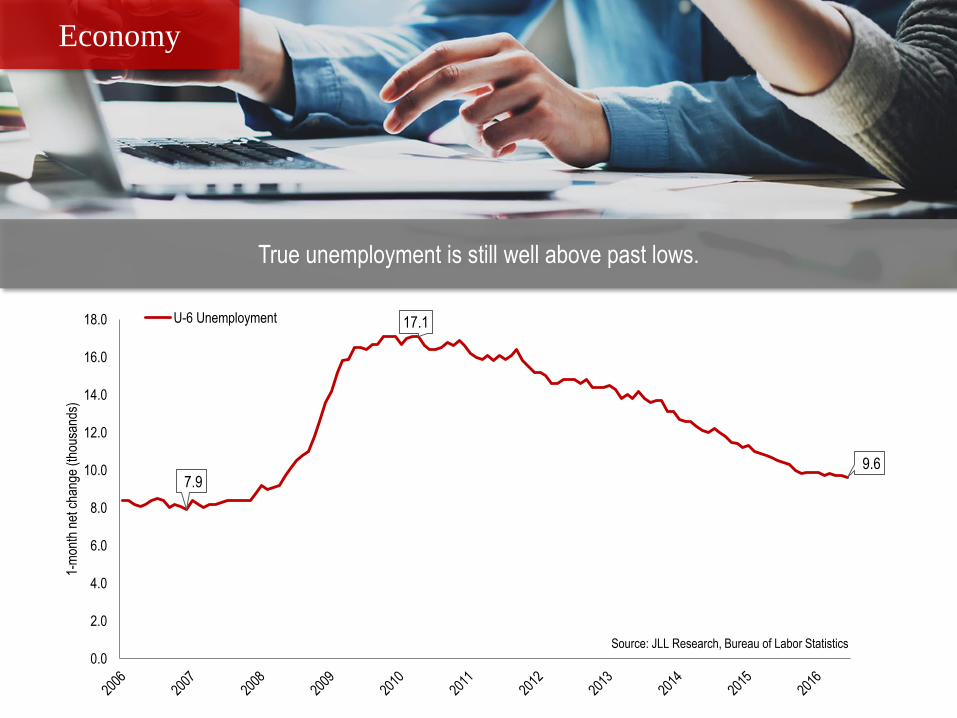
7.9
17.1
9.6
0.0
2.0
4.0
6.0
8.0
10.0
12.0
14.0
16.0
18.0
1-m
onth
net
cha
nge
(tho
usan
ds)
U-6 Unemployment
Source: JLL Research, Bureau of Labor Statistics
True unemployment is still well above past lows.
Economy
Economy
Only 46.1% of Americans are engaged in full time employment,
with 30+ hours per week and a regular paycheck. Source: 7/14/16, Gallup Good Jobs
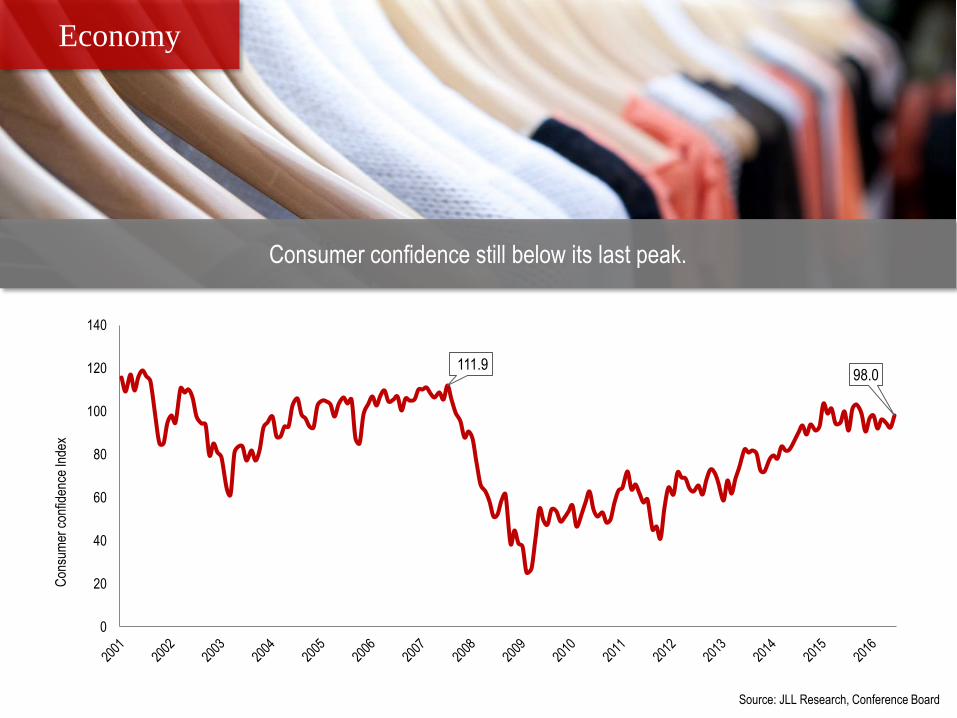
111.998.0
0
20
40
60
80
100
120
140
Con
sum
er c
onfid
ence
Inde
x
Source: JLL Research, Conference Board
Consumer confidence still below its last peak.
Economy
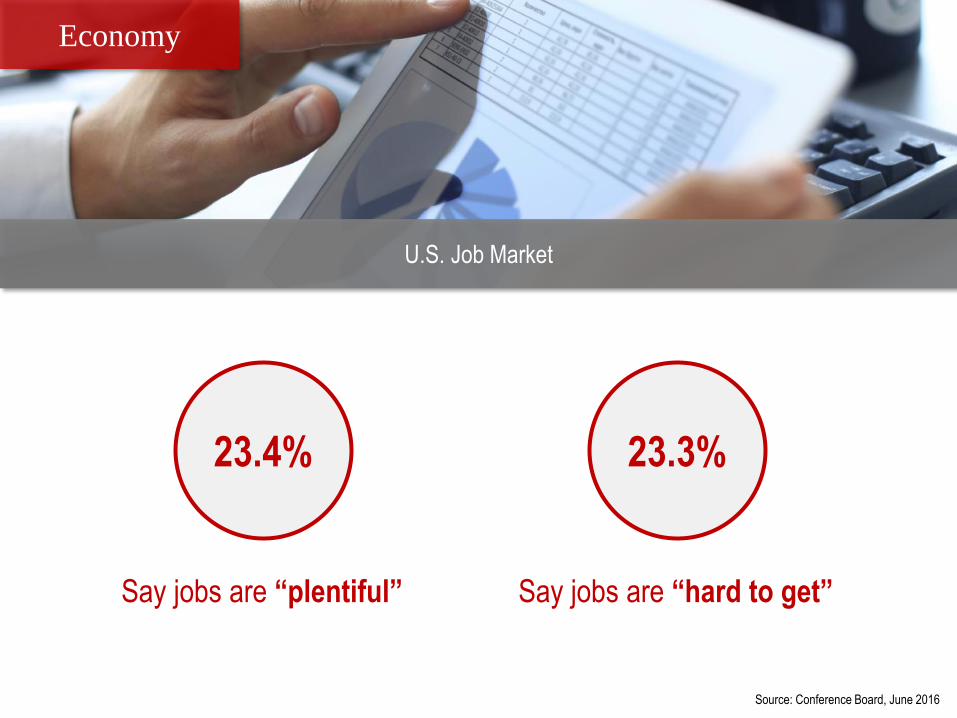
Source: Conference Board, June 2016
U.S. Job Market
Economy
23.4%
Say jobs are “plentiful”
23.3%
Say jobs are “hard to get”
Source: JLL Research, Conference Board
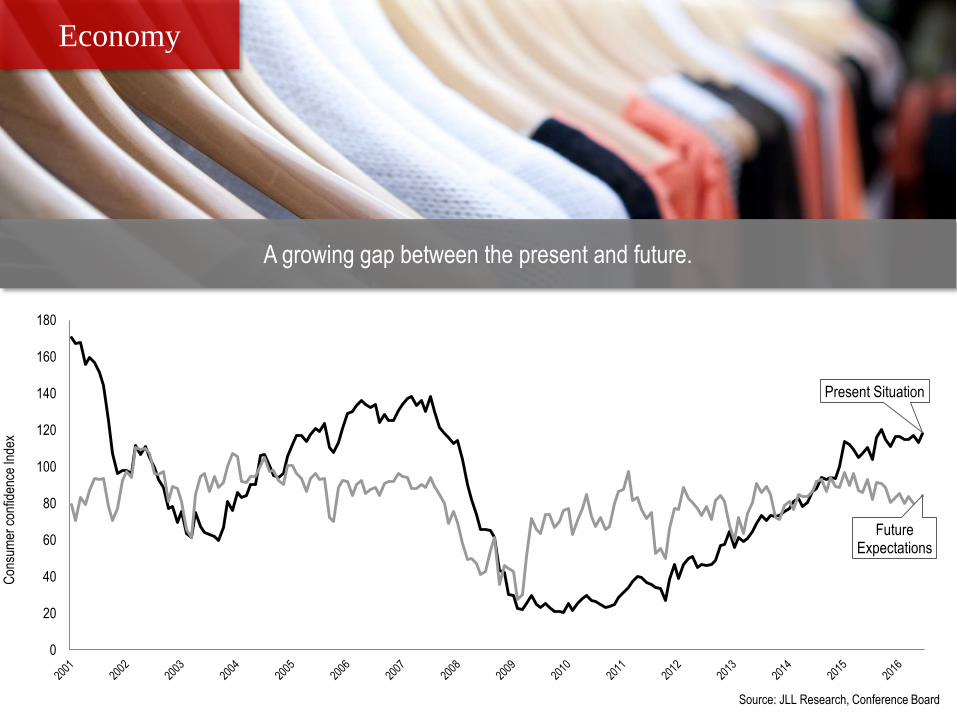
A growing gap between the present and future.
Economy
Present Situation
Future Expectations
0
20
40
60
80
100
120
140
160
180
Con
sum
er c
onfid
ence
Inde
x
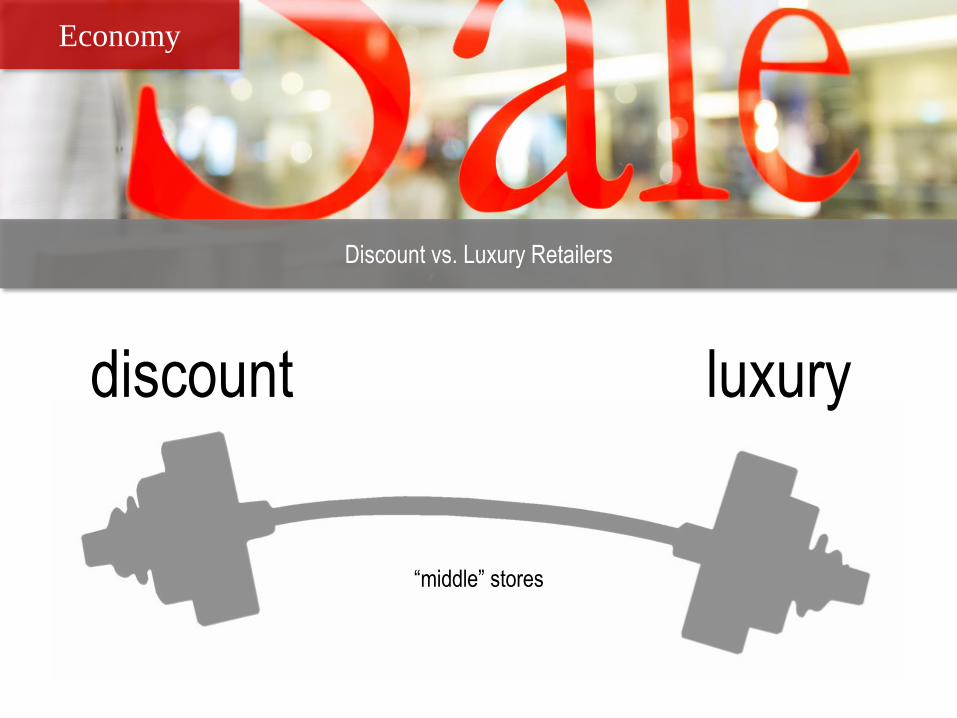
discount luxury
“middle” stores
Discount vs. Luxury Retailers
Economy
Economy
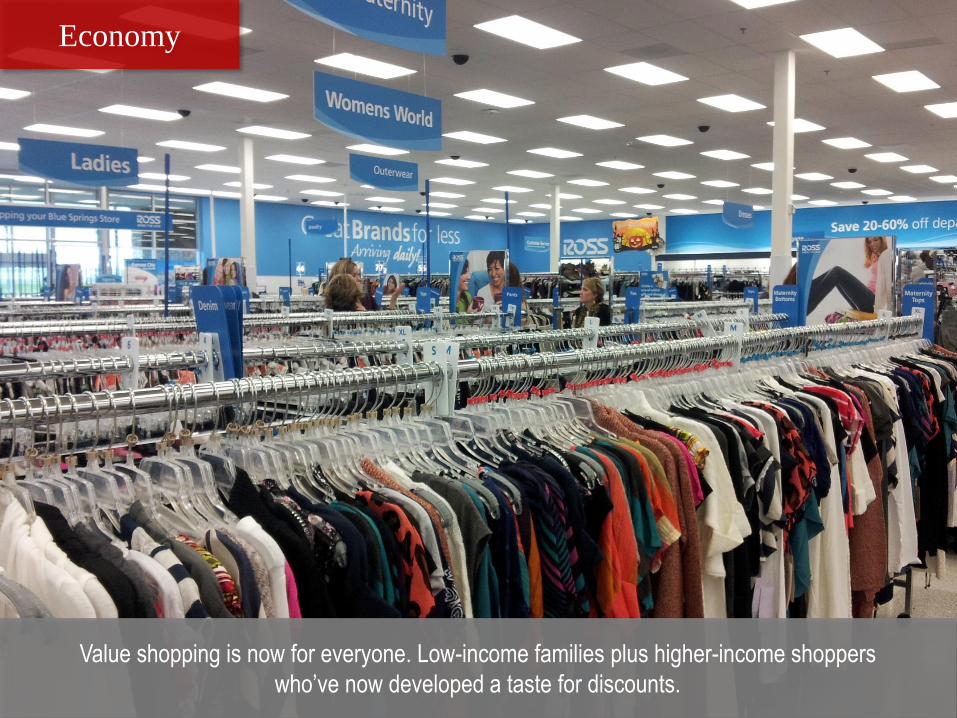
Value shopping is now for everyone. Low-income families plus higher-income shoppers
who’ve now developed a taste for discounts.
Economy
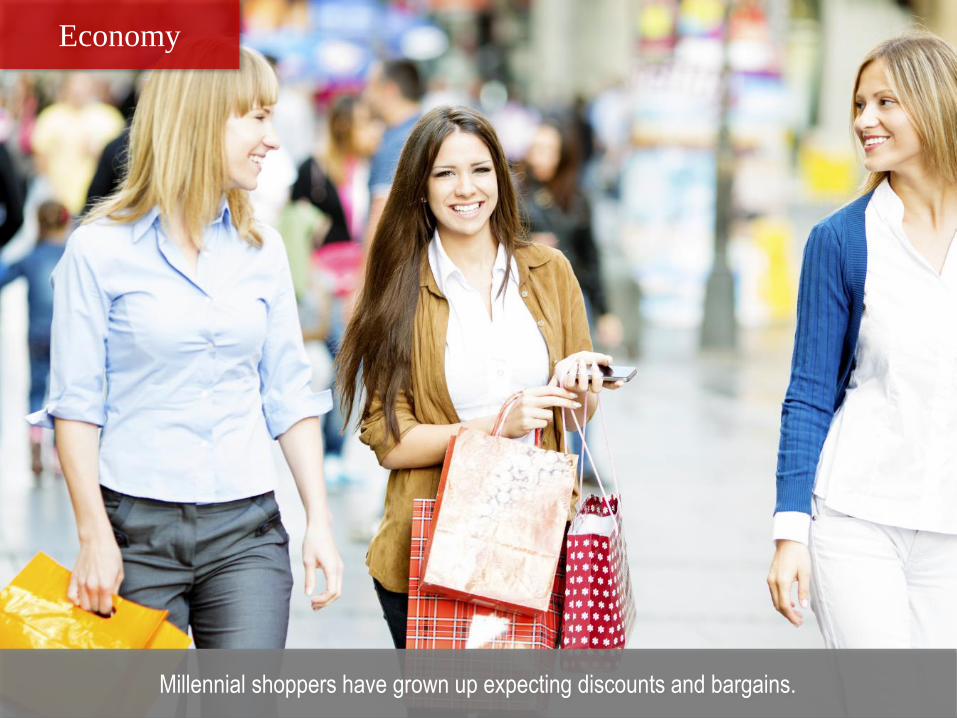
Millennial shoppers have grown up expecting discounts and bargains.
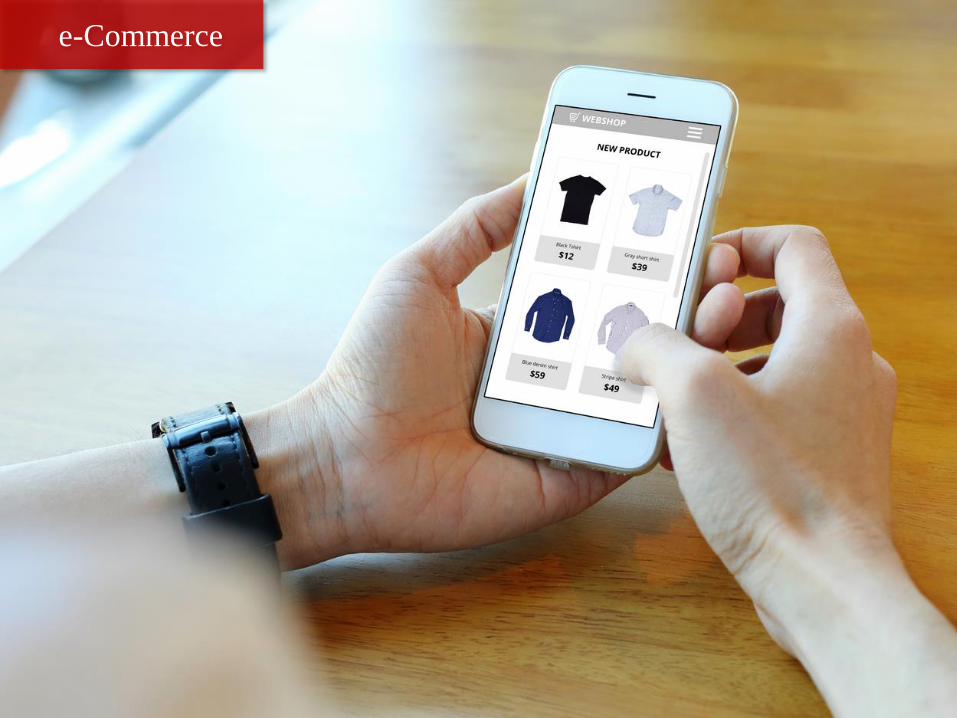
e-Commerce
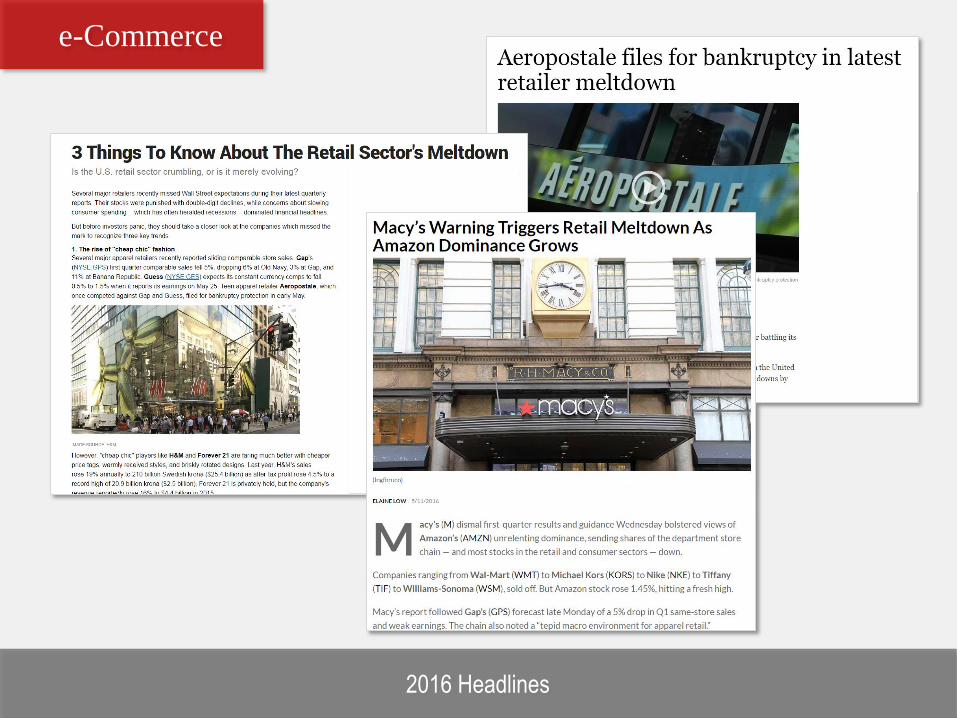
e-Commerce
2016 Headlines
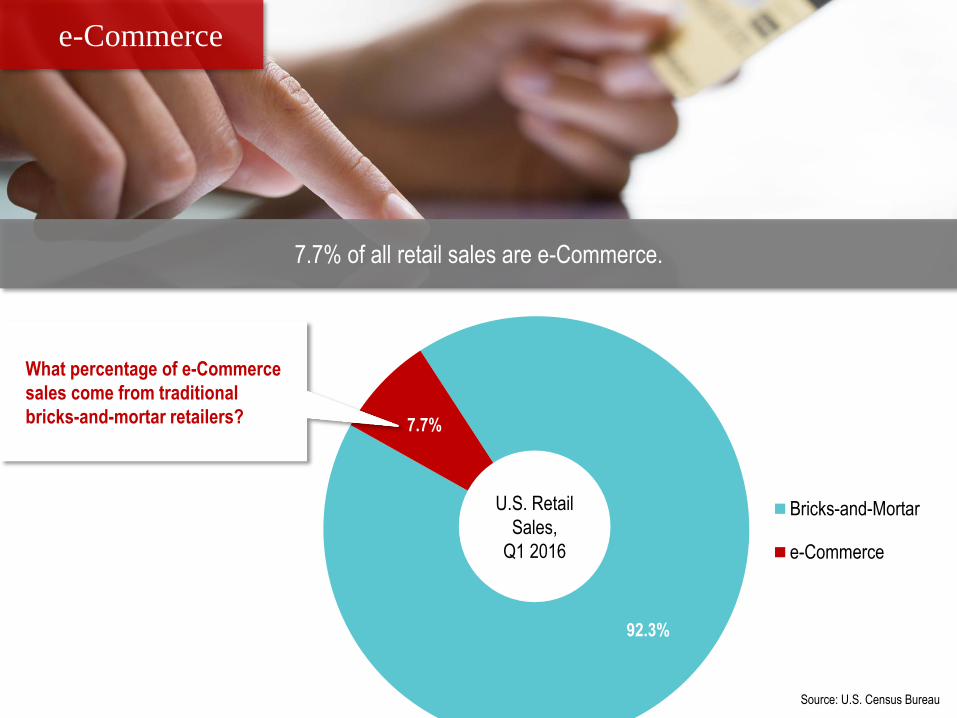
92.3%
7.7%
Bricks-and-Mortar
e-Commerce
7.7% of all retail sales are e-Commerce.
Source: U.S. Census Bureau
e-Commerce
U.S. Retail
Sales,
Q1 2016
What percentage of e-Commerce
sales come from traditional
bricks-and-mortar retailers?
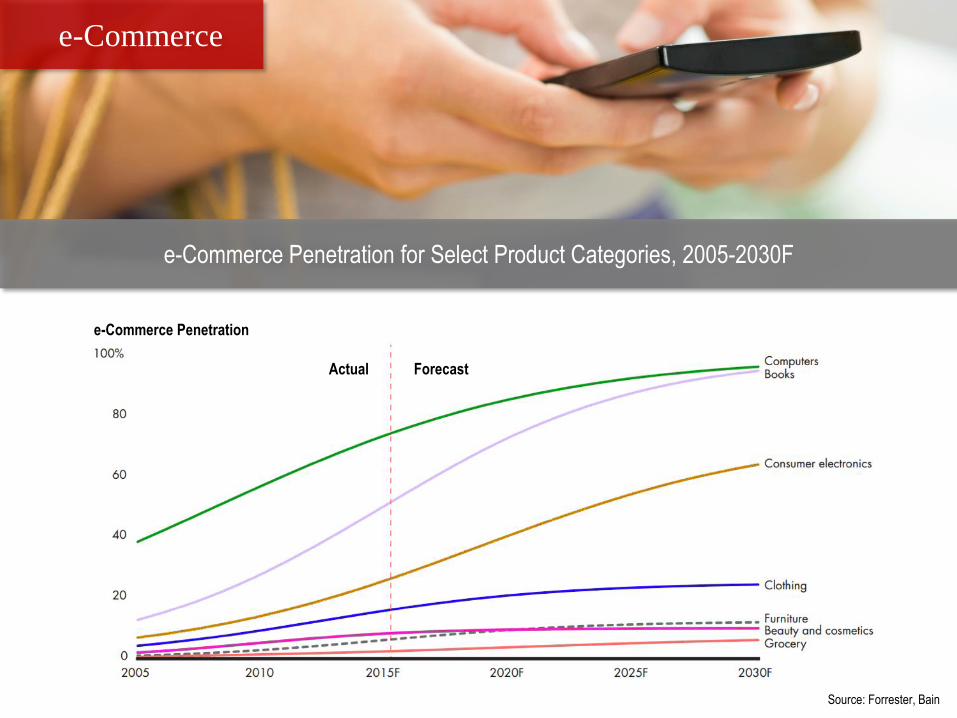
e-Commerce Penetration for Select Product Categories, 2005-2030F
Source: Forrester, Bain
e-Commerce
e-Commerce Penetration
Actual Forecast
Experience
What does experience really mean?
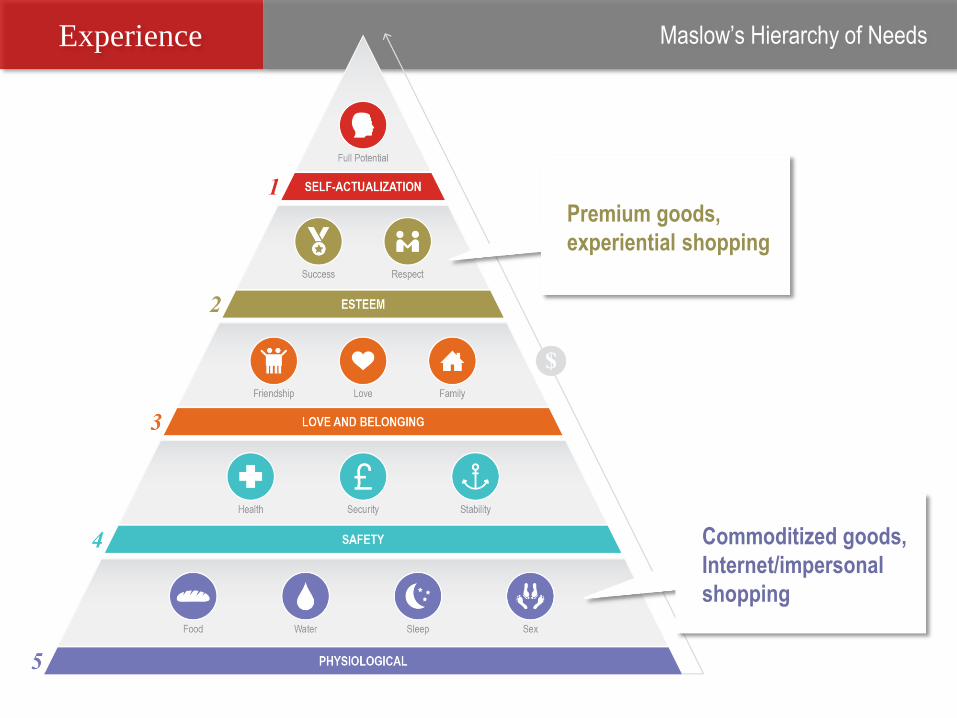
Experience Maslow’s Hierarchy of Needs
Commoditized goods,
Internet/impersonal
shopping
Premium goods,
experiential shopping
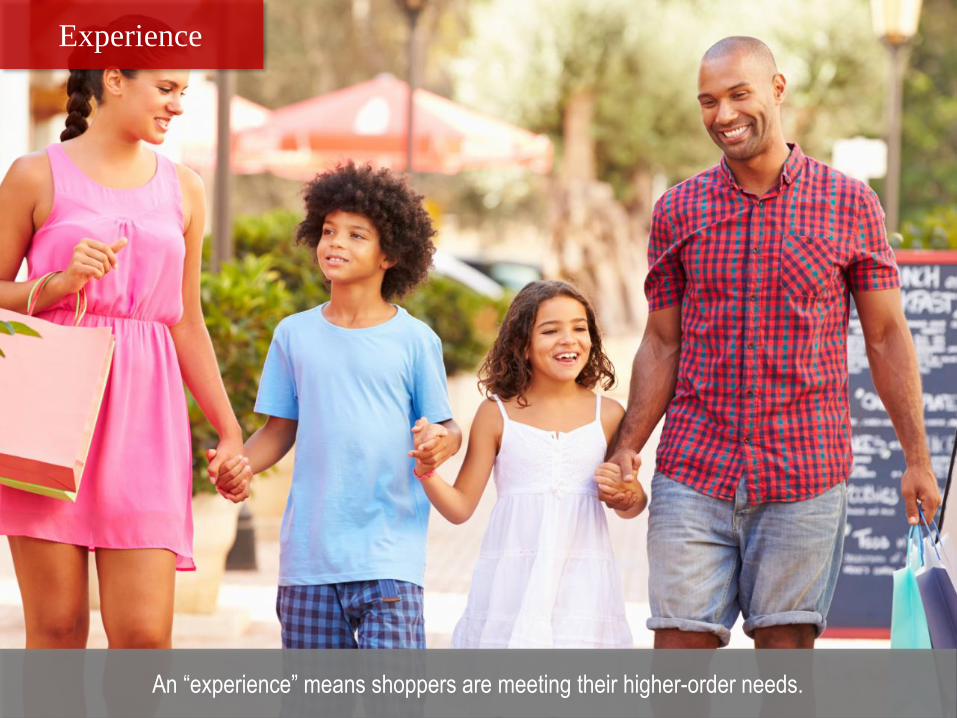
Experience
An “experience” means shoppers are meeting their higher-order needs.
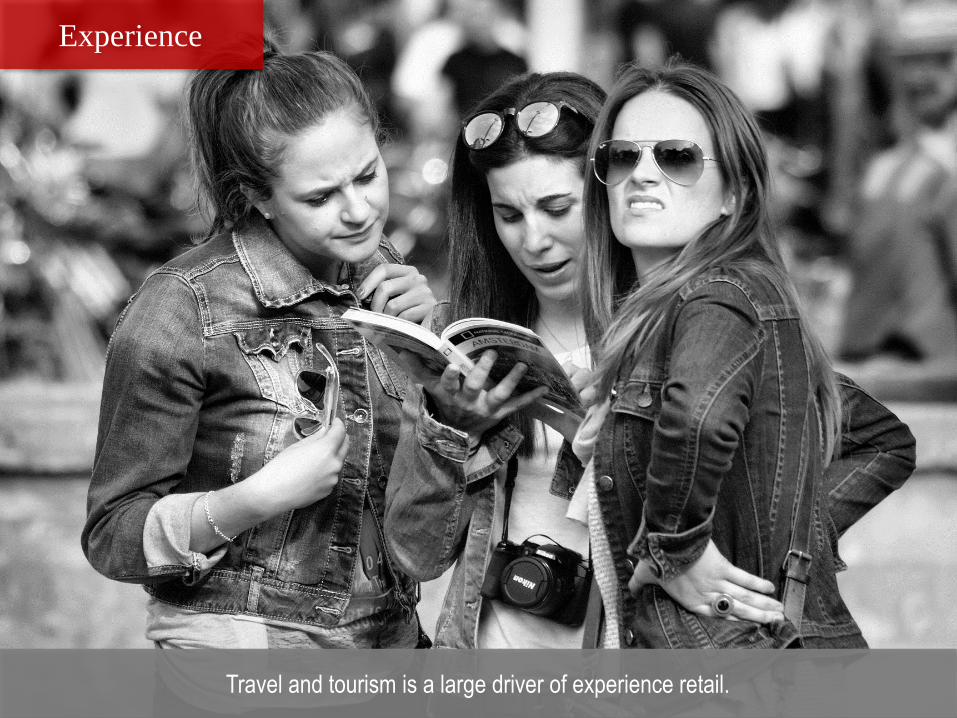
Experience
Travel and tourism is a large driver of experience retail.
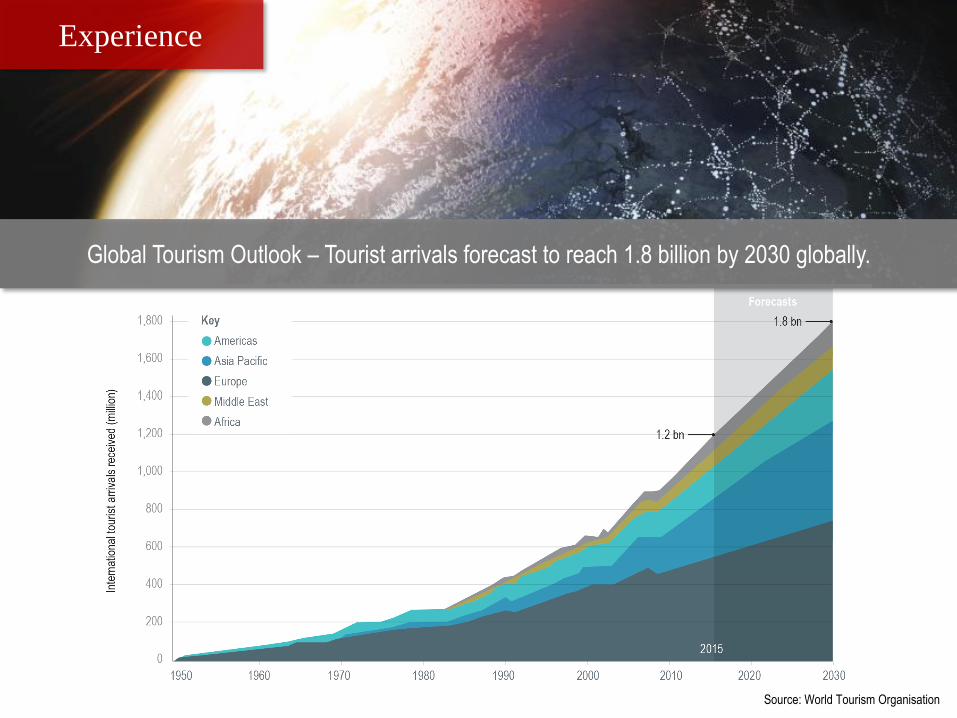
Experience
Source: World Tourism Organisation
Global Tourism Outlook – Tourist arrivals forecast to reach 1.8 billion by 2030 globally.
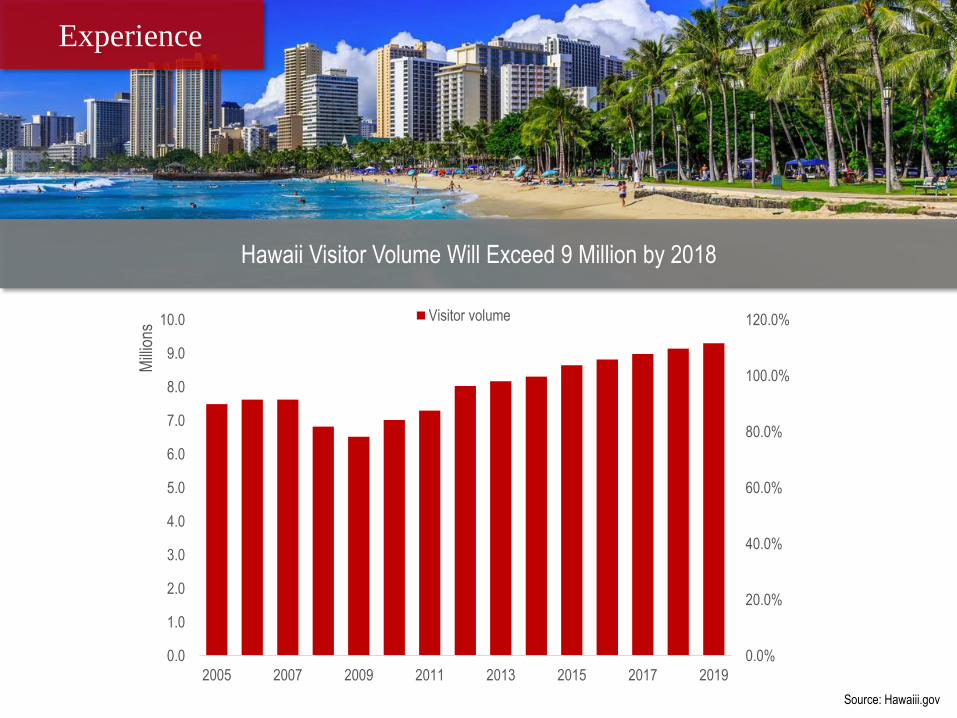
Experience
Source: Hawaiii.gov
Hawaii Visitor Volume Will Exceed 9 Million by 2018
0.0%
20.0%
40.0%
60.0%
80.0%
100.0%
120.0%
0.0
1.0
2.0
3.0
4.0
5.0
6.0
7.0
8.0
9.0
10.0
2005 2007 2009 2011 2013 2015 2017 2019
Mill
ions
Visitor volume
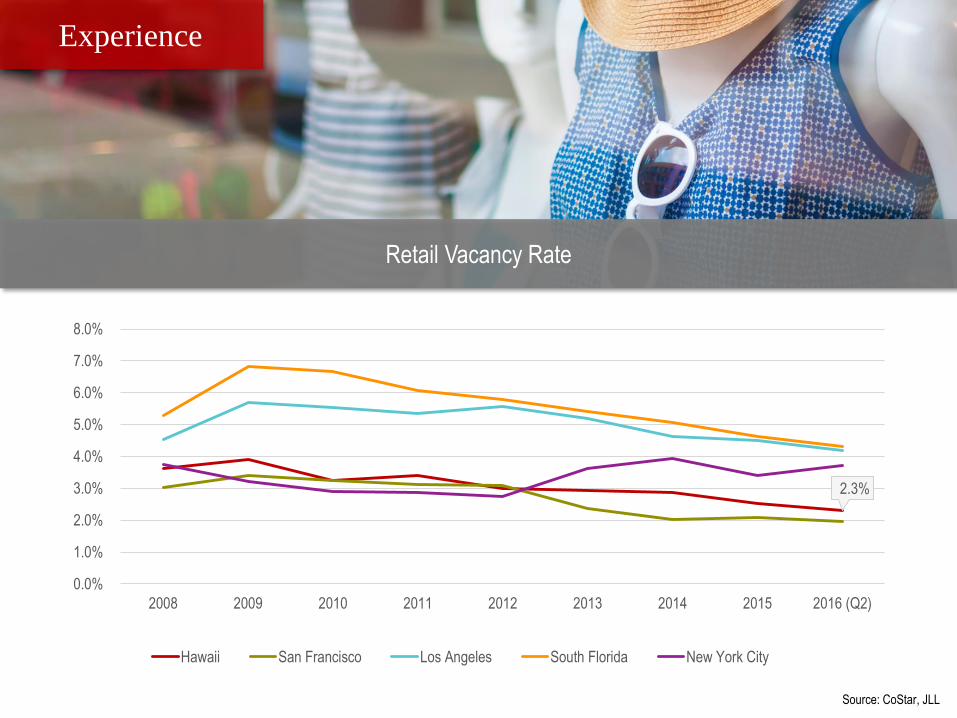
Experience
Source: CoStar, JLL
Retail Vacancy Rate
2.3%
0.0%
1.0%
2.0%
3.0%
4.0%
5.0%
6.0%
7.0%
8.0%
2008 2009 2010 2011 2012 2013 2014 2015 2016 (Q2)
Hawaii San Francisco Los Angeles South Florida New York City
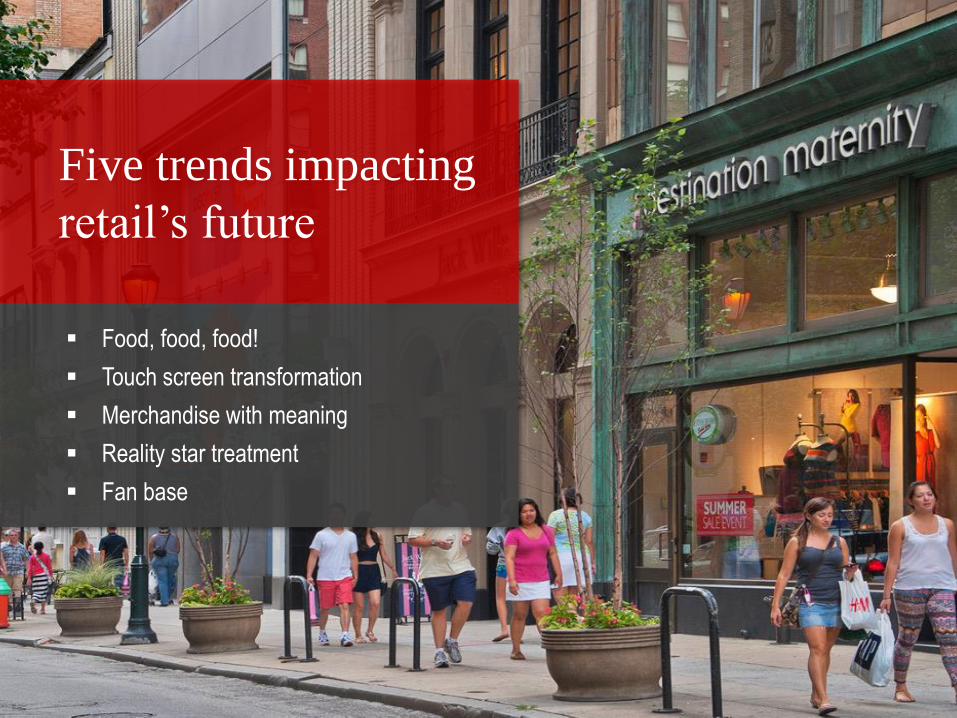
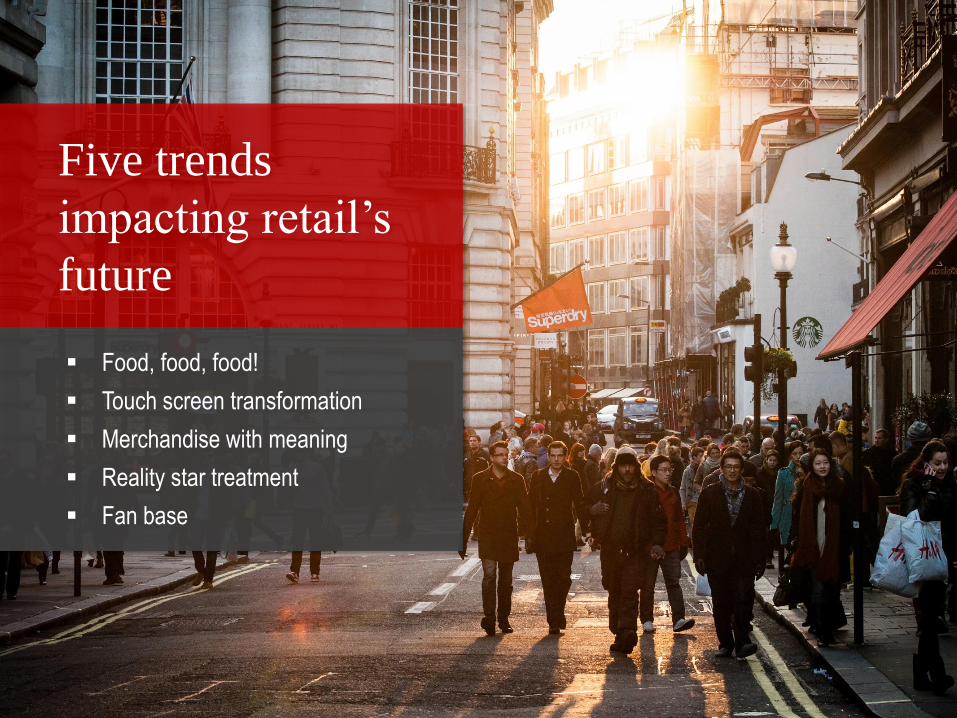
Five trends impacting
retail’s future
Food, food, food!
Touch screen transformation
Merchandise with meaning
Reality star treatment
Fan base
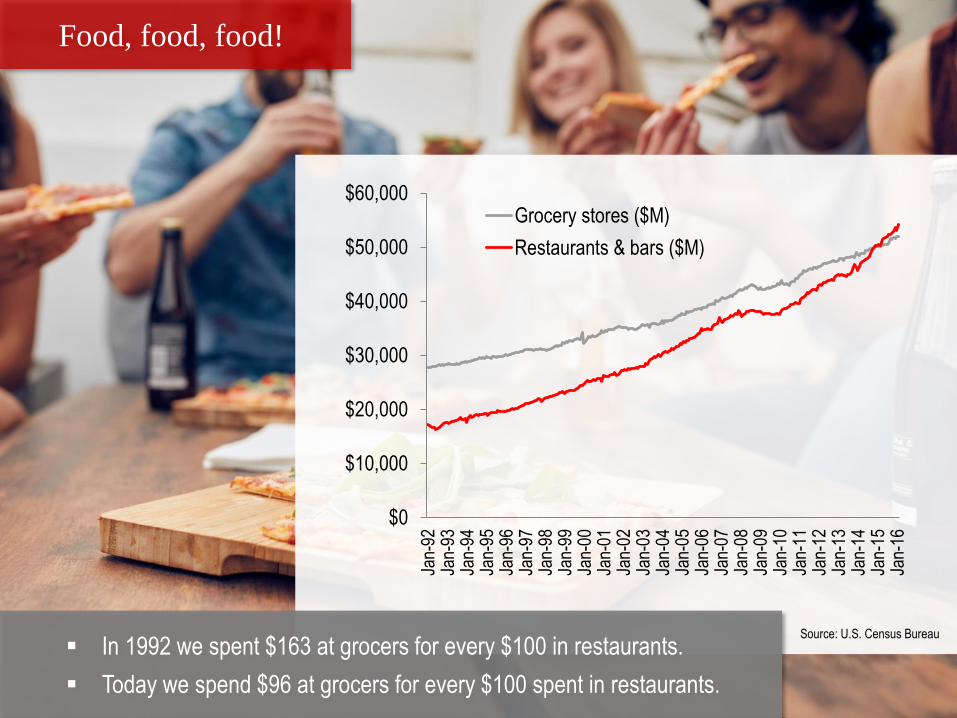
In 1992 we spent $163 at grocers for every $100 in restaurants.
Today we spend $96 at grocers for every $100 spent in restaurants.
$0
$10,000
$20,000
$30,000
$40,000
$50,000
$60,000
Jan-
92Ja
n-93
Jan-
94Ja
n-95
Jan-
96Ja
n-97
Jan-
98Ja
n-99
Jan-
00Ja
n-01
Jan-
02Ja
n-03
Jan-
04Ja
n-05
Jan-
06Ja
n-07
Jan-
08Ja
n-09
Jan-
10Ja
n-11
Jan-
12Ja
n-13
Jan-
14Ja
n-15
Jan-
16
Grocery stores ($M)
Restaurants & bars ($M)
Source: U.S. Census Bureau
Food, food, food!
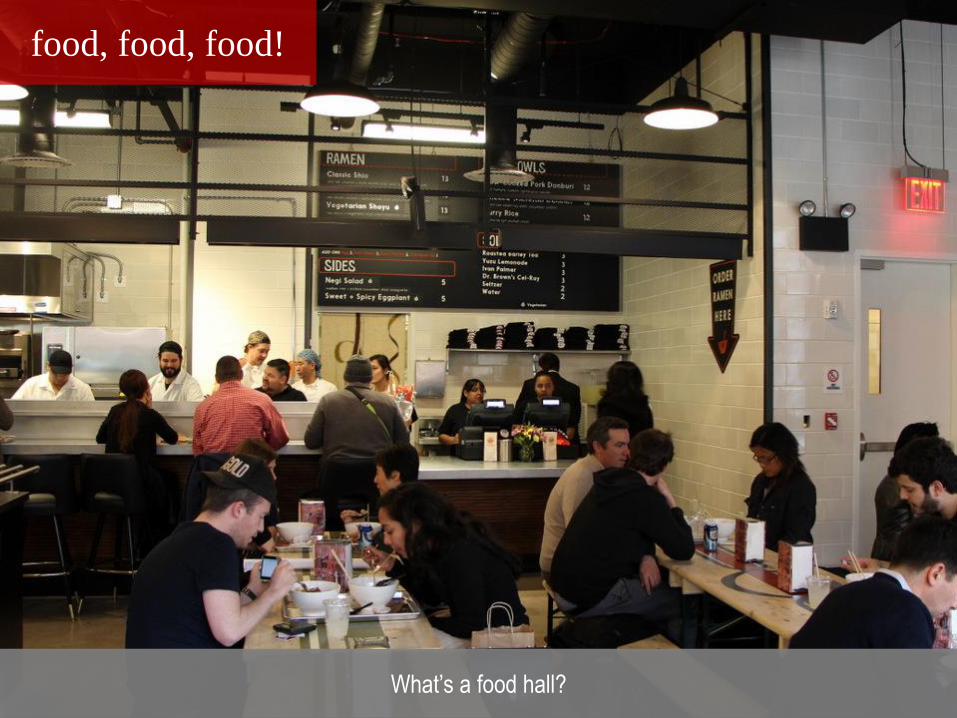
food, food, food!
What’s a food hall?
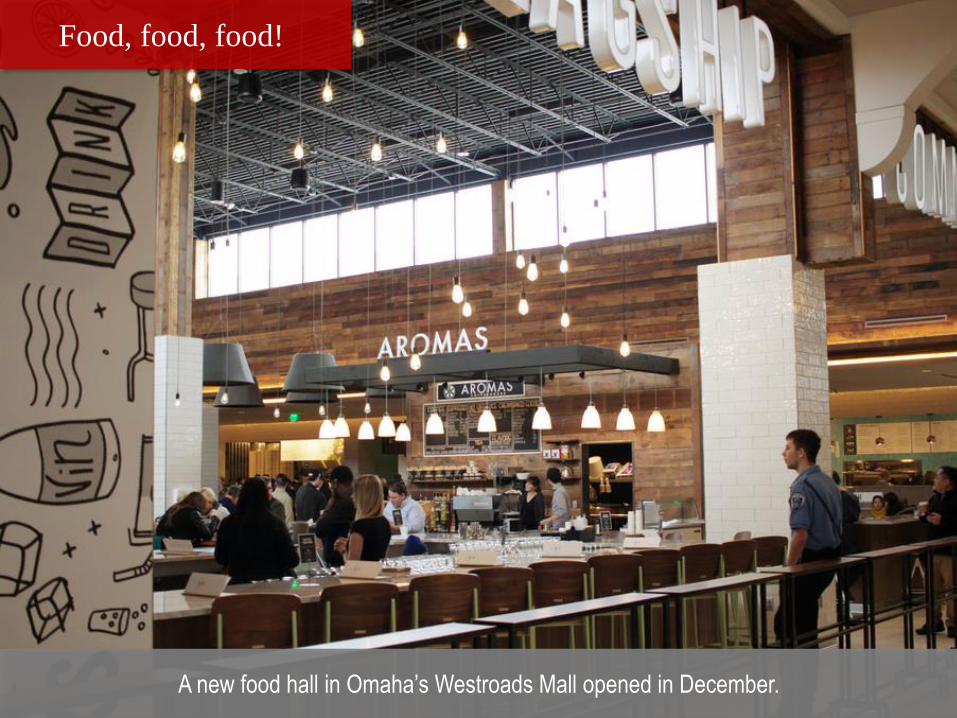
A new food hall in Omaha’s Westroads Mall opened in December.
Food, food, food!
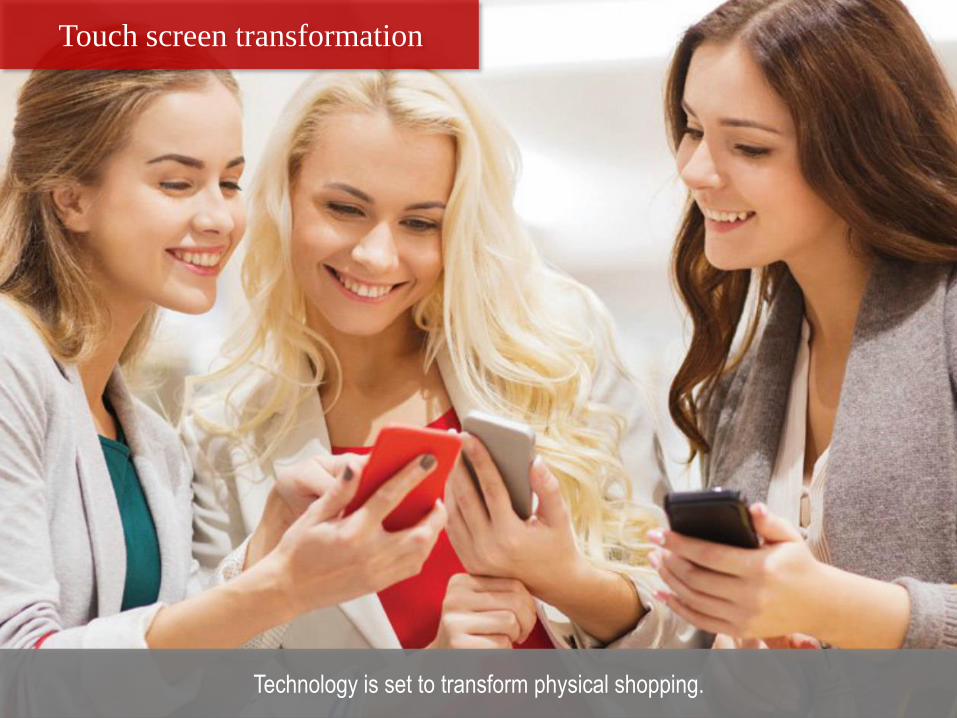
Technology is set to transform physical shopping.
Touch screen transformation
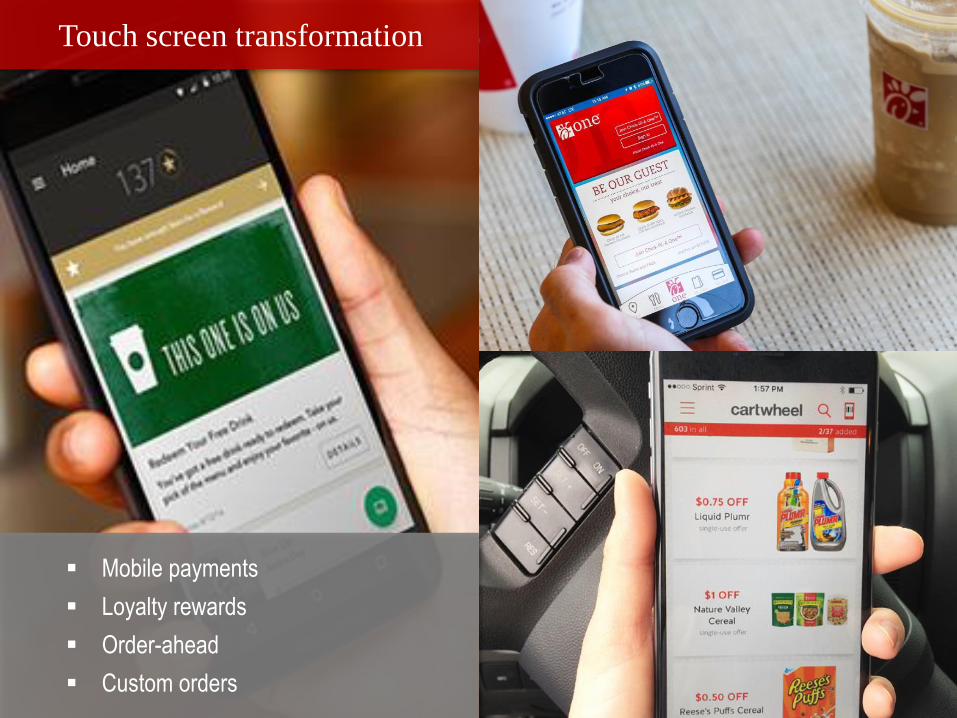
Mobile payments
Loyalty rewards
Order-ahead
Custom orders
Touch screen transformation
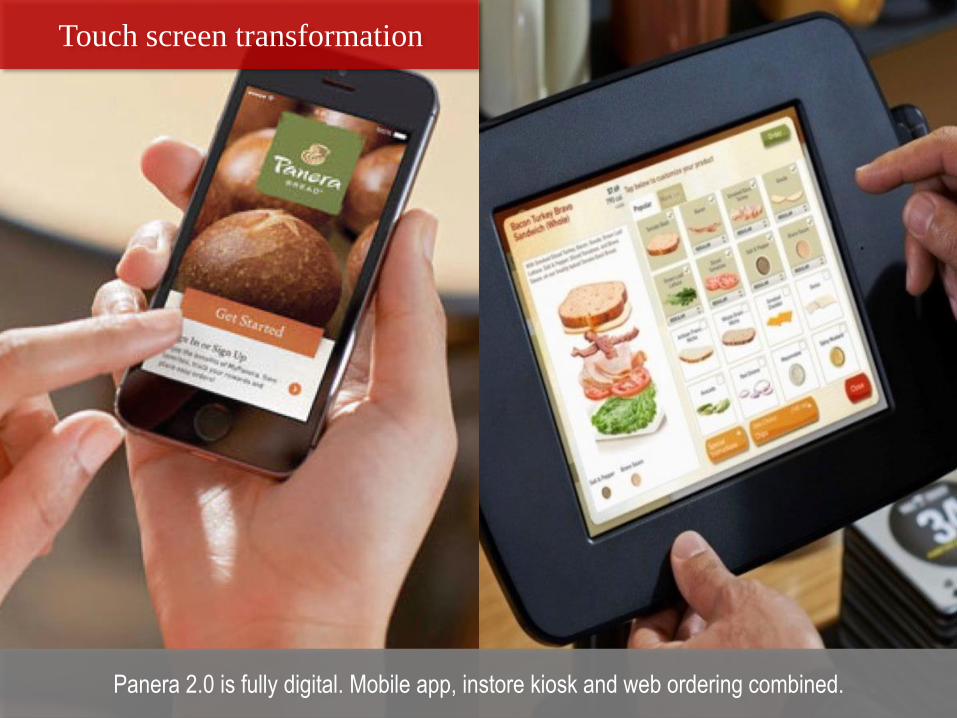
Panera 2.0 is fully digital. Mobile app, instore kiosk and web ordering combined.
Touch screen transformation
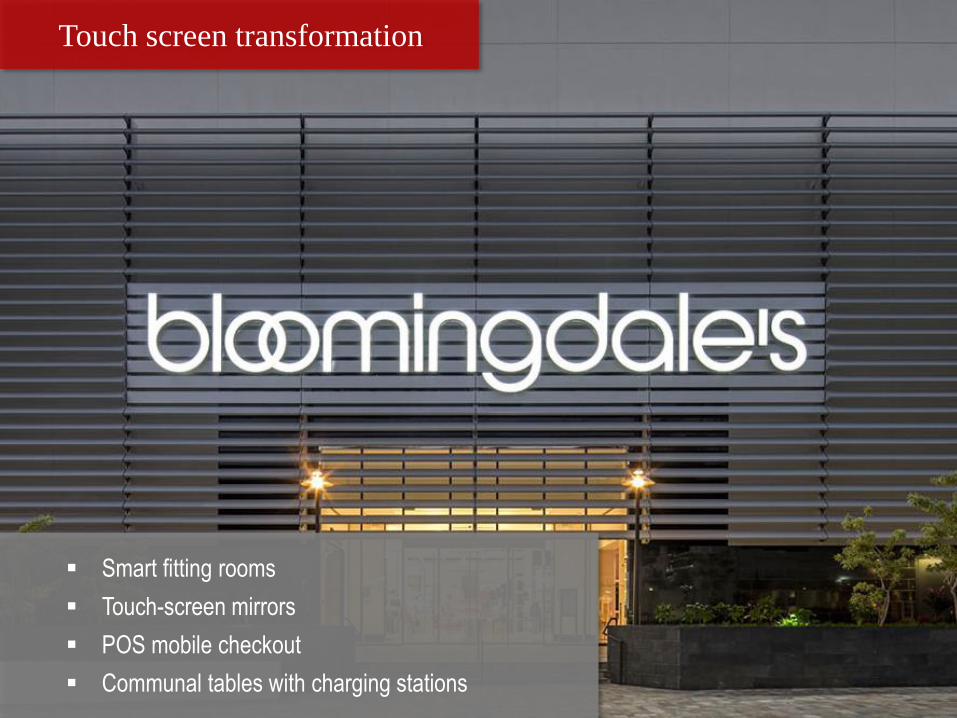
Smart fitting rooms
Touch-screen mirrors
POS mobile checkout
Communal tables with charging stations
Touch screen transformation
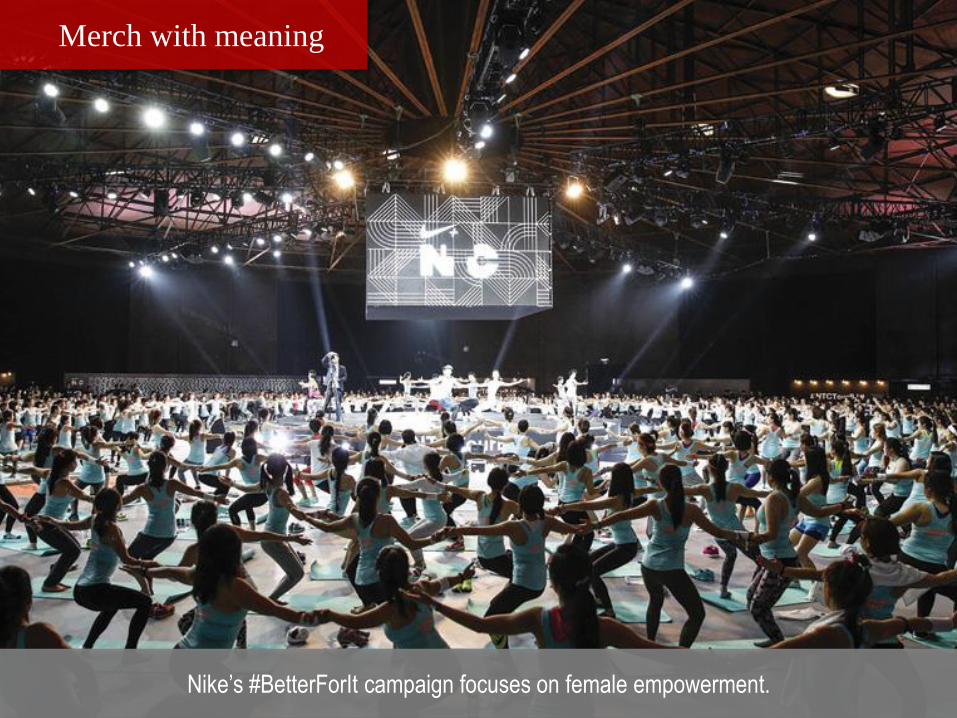
Nike’s #BetterForIt campaign focuses on female empowerment.
Merch with meaning
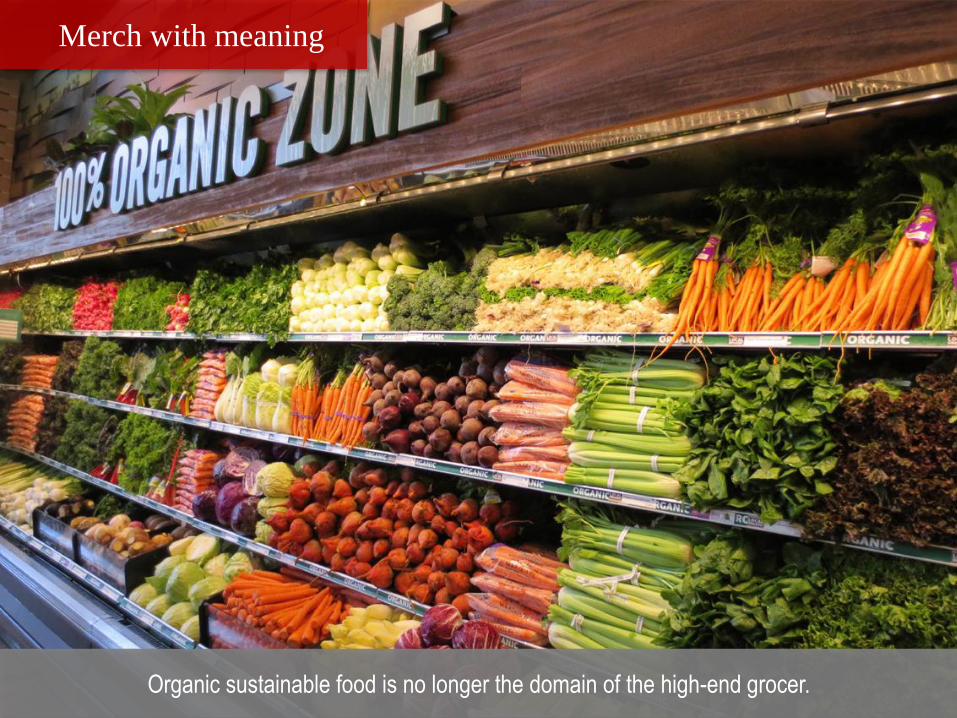
Organic sustainable food is no longer the domain of the high-end grocer.
Merch with meaning
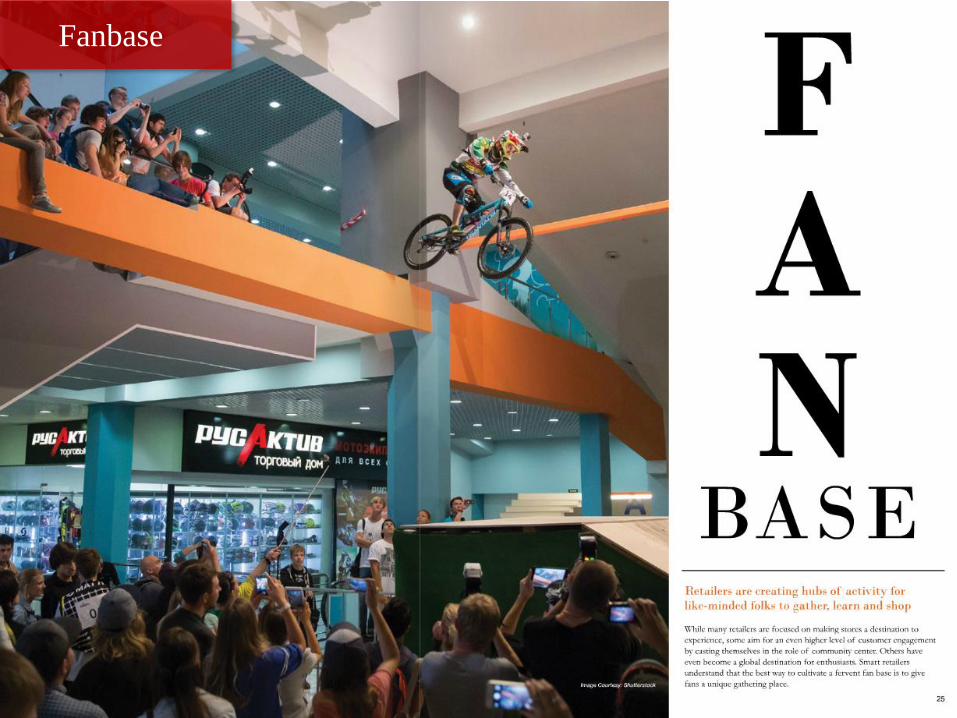
Fanbase
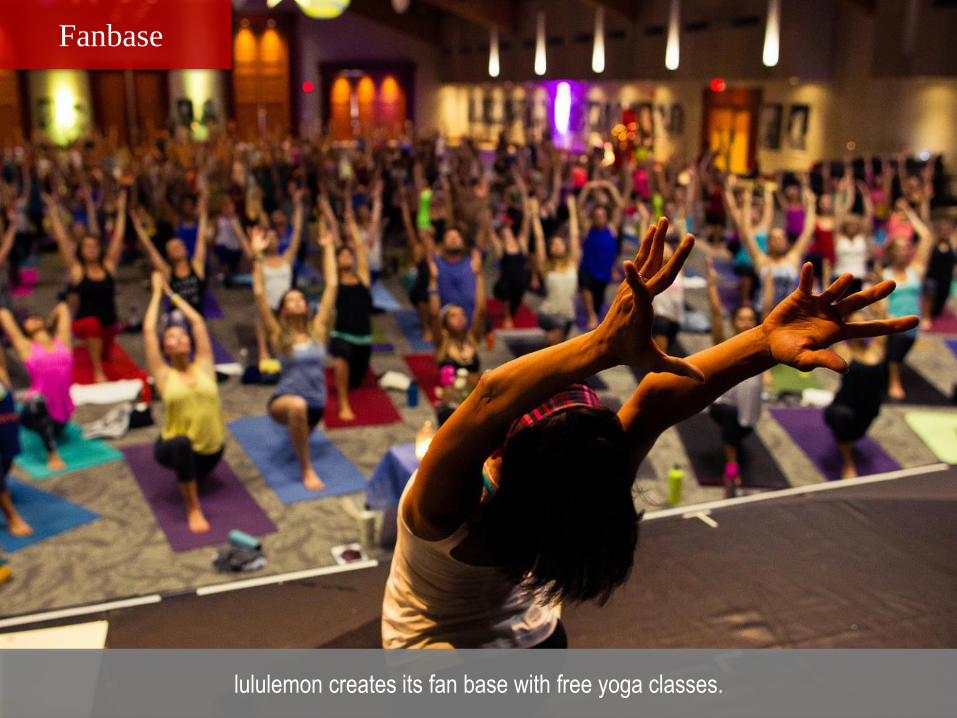
lululemon creates its fan base with free yoga classes.
Fanbase
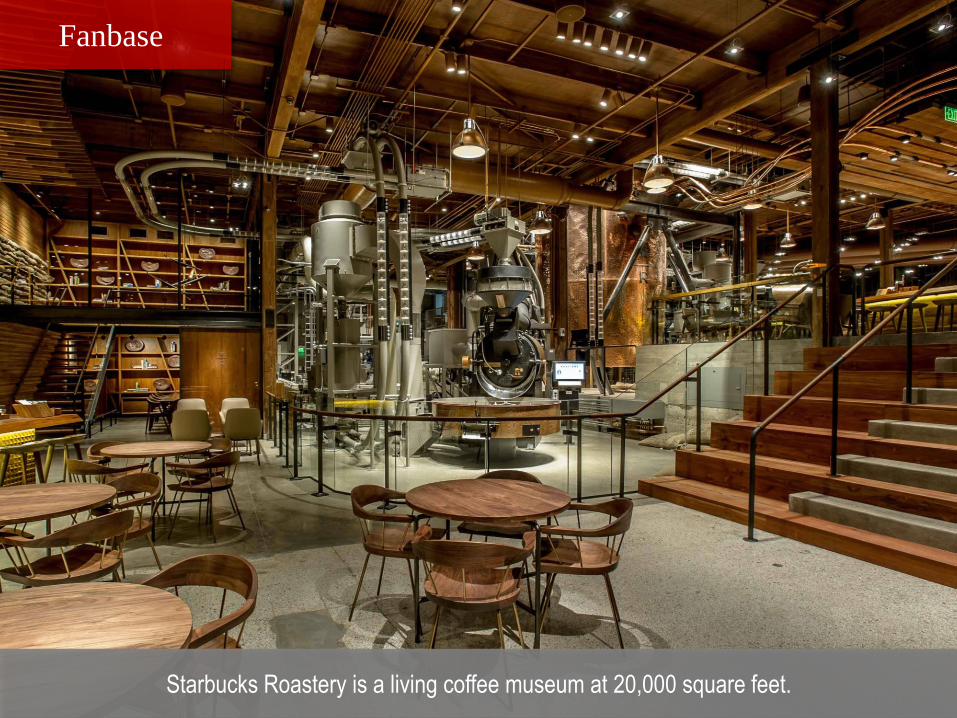
Starbucks Roastery is a living coffee museum at 20,000 square feet.
Fanbase
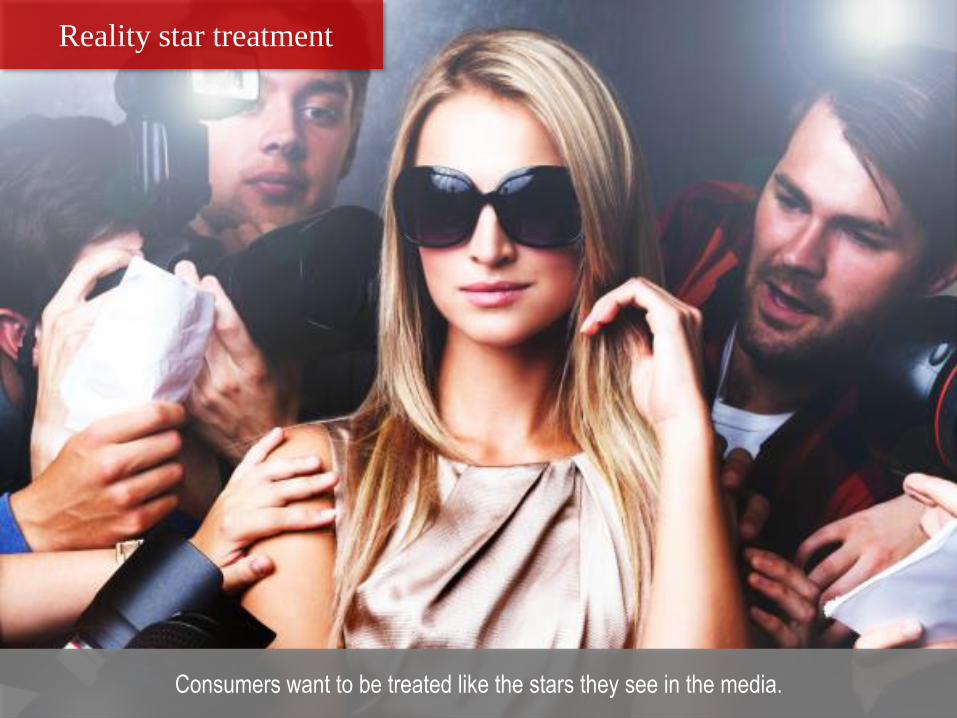
Consumers want to be treated like the stars they see in the media.
Reality star treatment
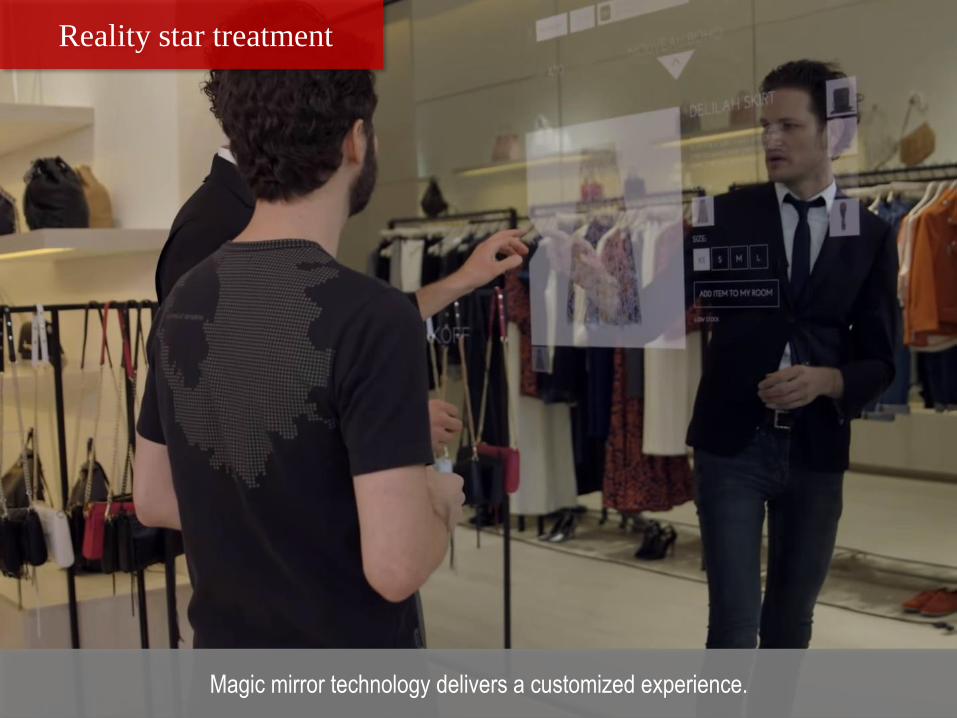
Magic mirror technology delivers a customized experience.
Reality star treatment
Three forces
shaping U.S. retail
Economy
E-commerce
Experience
Five trends
impacting retail’s
future
Food, food, food!
Touch screen transformation
Merchandise with meaning
Reality star treatment
Fan base
Finding our futurein Retail
Greg Maloney
President & CEO
JLL Americas Retail,
ICSC Board of Trustees


![[ iCSC] Supporter package](https://img.pdfslide.us/doc/110x75/568c503f1a28ab4916ae8d1b/-icsc-supporter-package.jpg)