Embed Size (px)
Citation preview
Presented by:
JIM BARNES
SR. MANAGING PARTNER
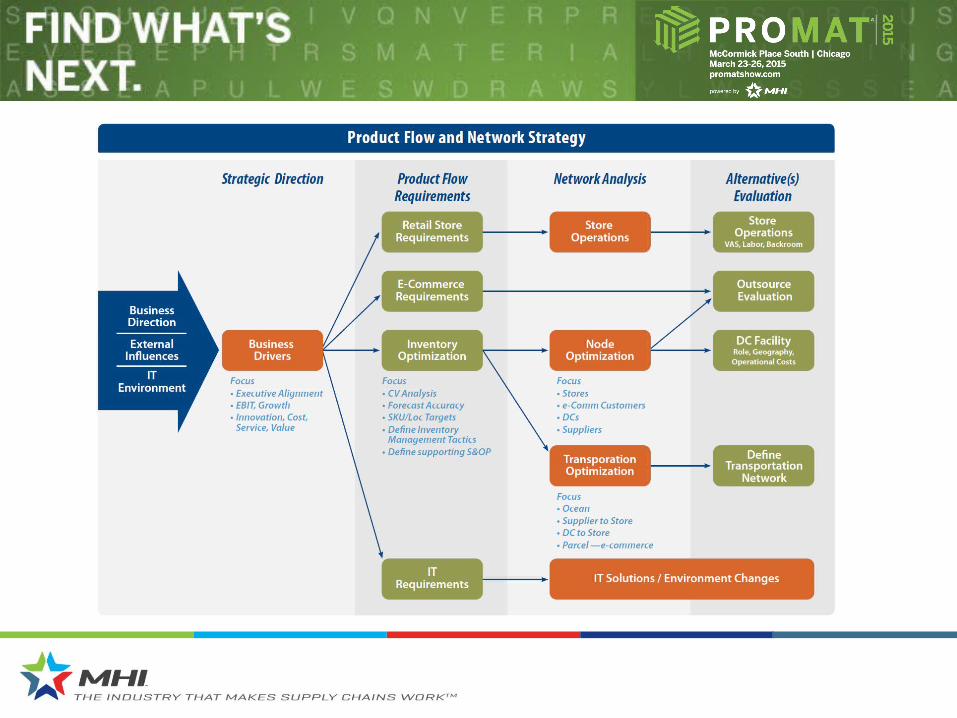
Inventory Flow: The Key to Network Strategy Design Success!
Sponsored by:
© 2015 MHI®Copyright claimed for audiovisual works and
sound recordings of seminar sessions. All rights reserved.
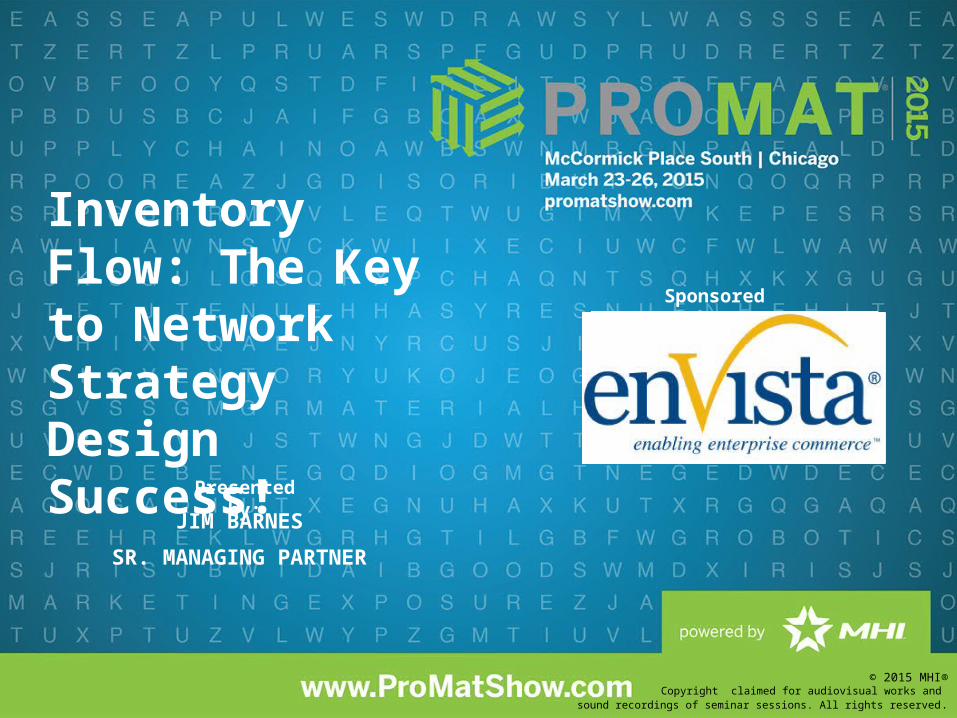
Key Takeaways:
• Is Network Strategy Design something your company should consider – who benefits and when
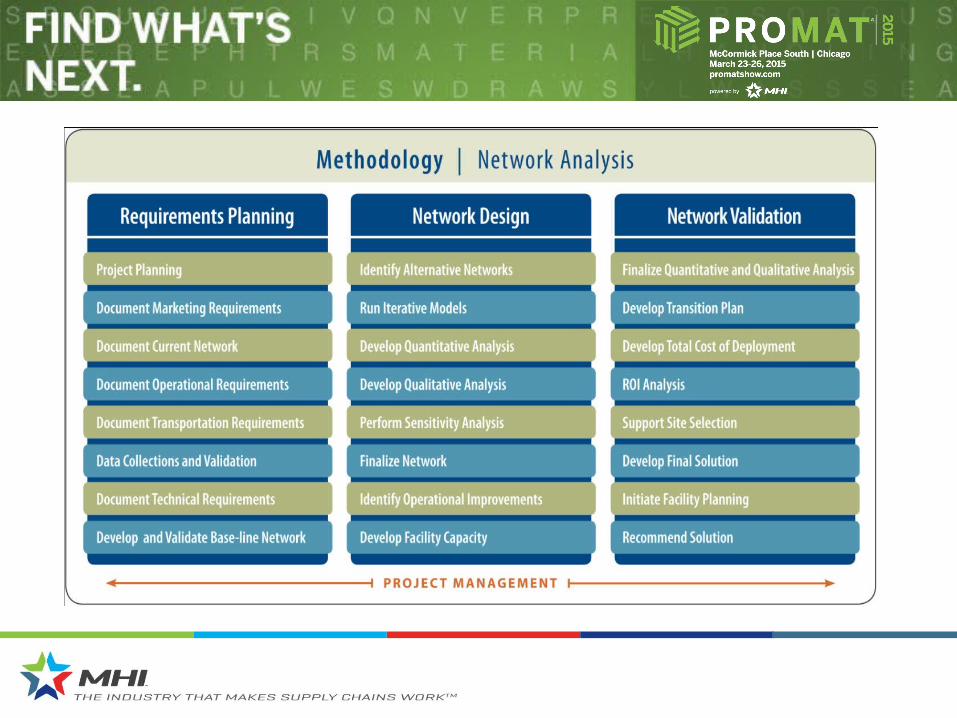
• The critical components and steps necessary for a successful Network Strategy Design project
• How to determine Inventory Flow – what are the key considerations and best practices
• Best practices and lessons learned from companies that have successfully redesigned their supply chain network
• Typical ROI, time to value and benefits attained
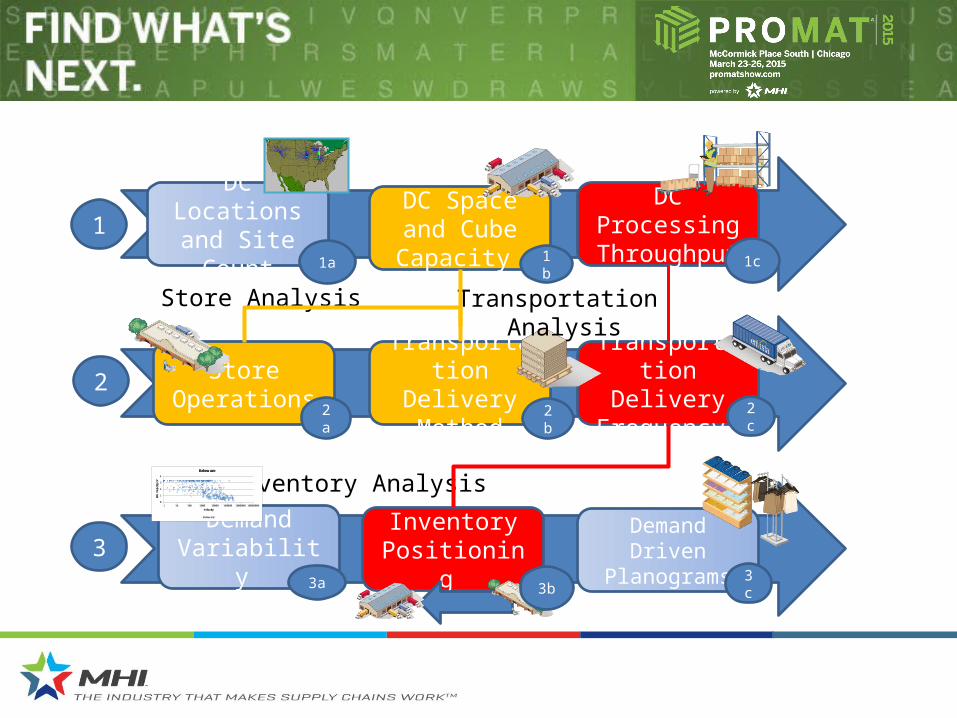
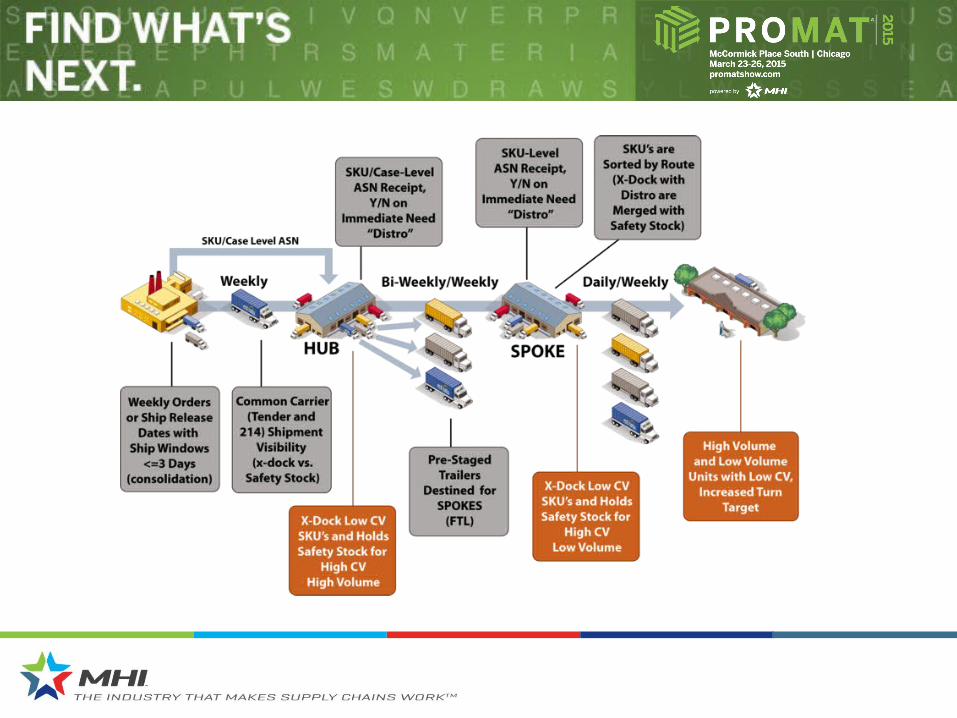
DC Locations and Site Count
DC Space and Cube Capacity
Transportation Delivery Method
Transportation Delivery
Frequency
DC Processing Throughput
Inventory Positioning
Demand Driven Planograms
Store Analysis
Inventory Analysis
Demand Variability
Store Operations
Transportation Analysis
1
2
3
0
1
2
3
4
1 10 100 1000 10000 100000 1000000 10000000
SKU
Vel
ocit
y CV
Velocity
Bakeware
Bakeware
1a 1b 1c
2a 2b 2c
3a 3b 3c
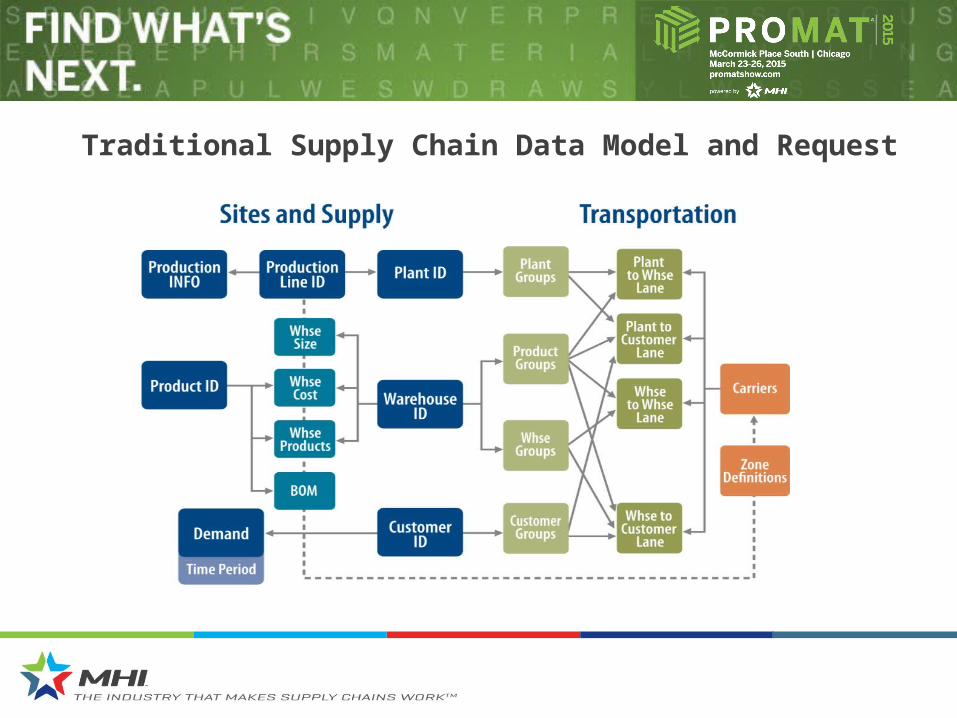
Traditional Supply Chain Data Model and Request
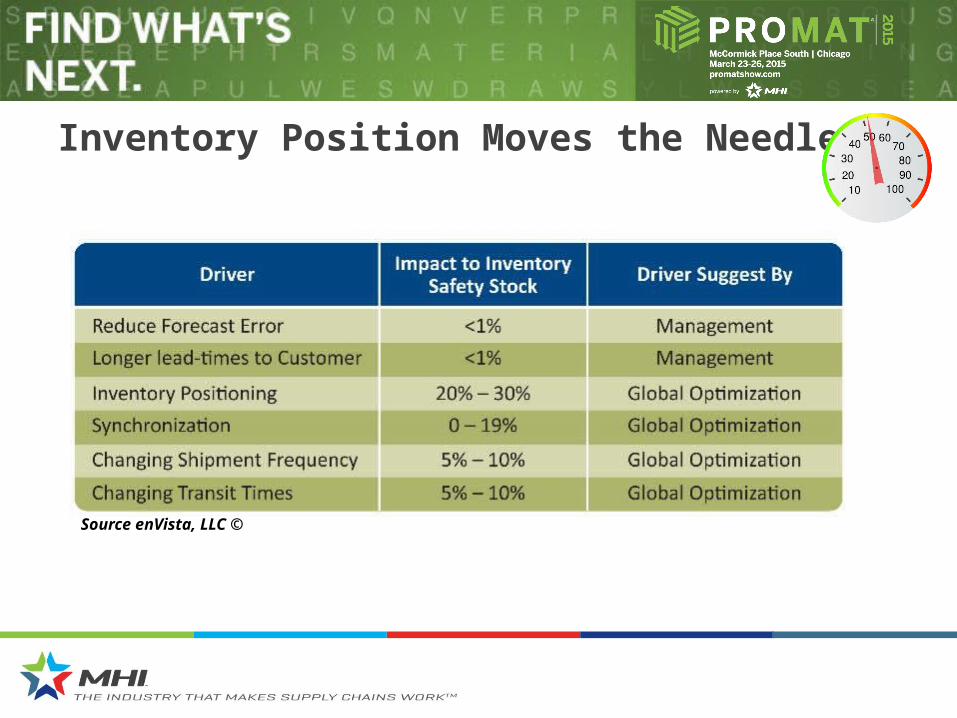
Inventory Position Moves the Needle
Source enVista, LLC ©
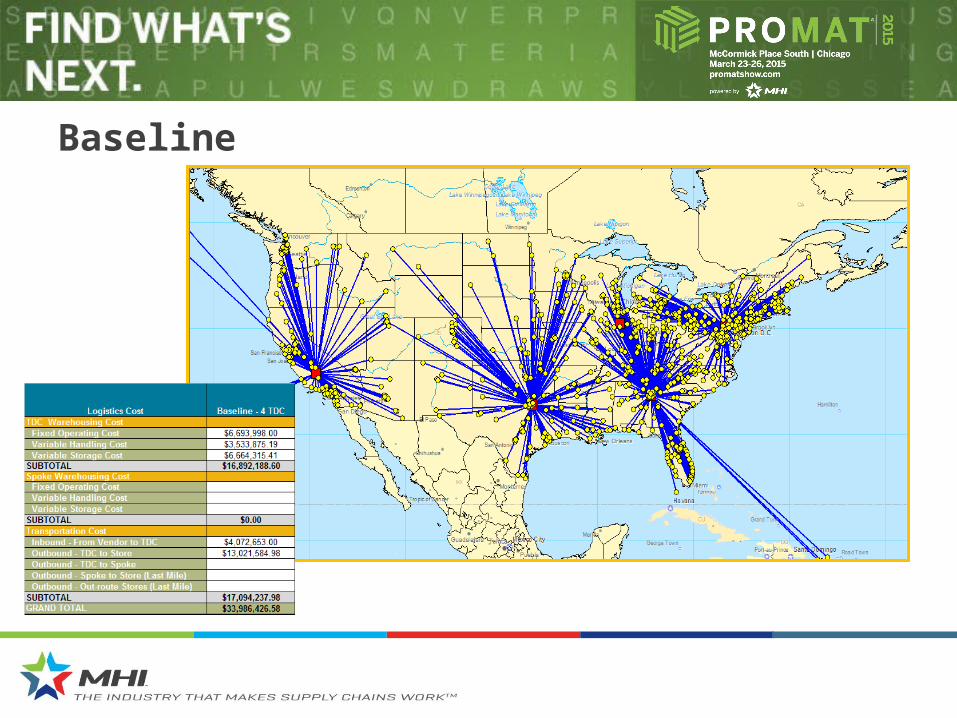
Baseline
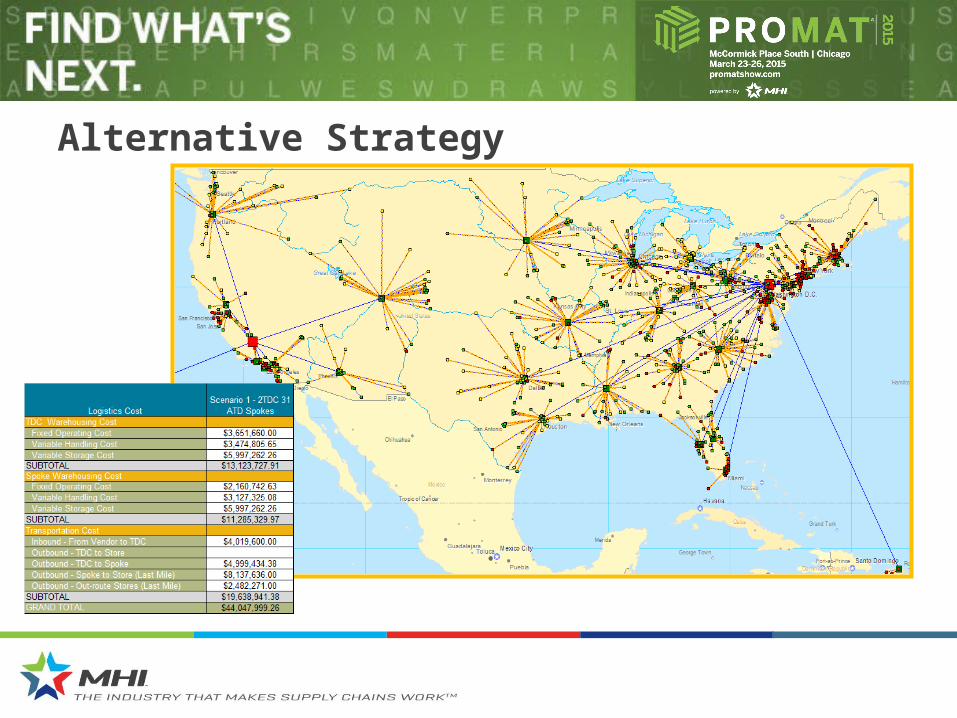
Alternative Strategy

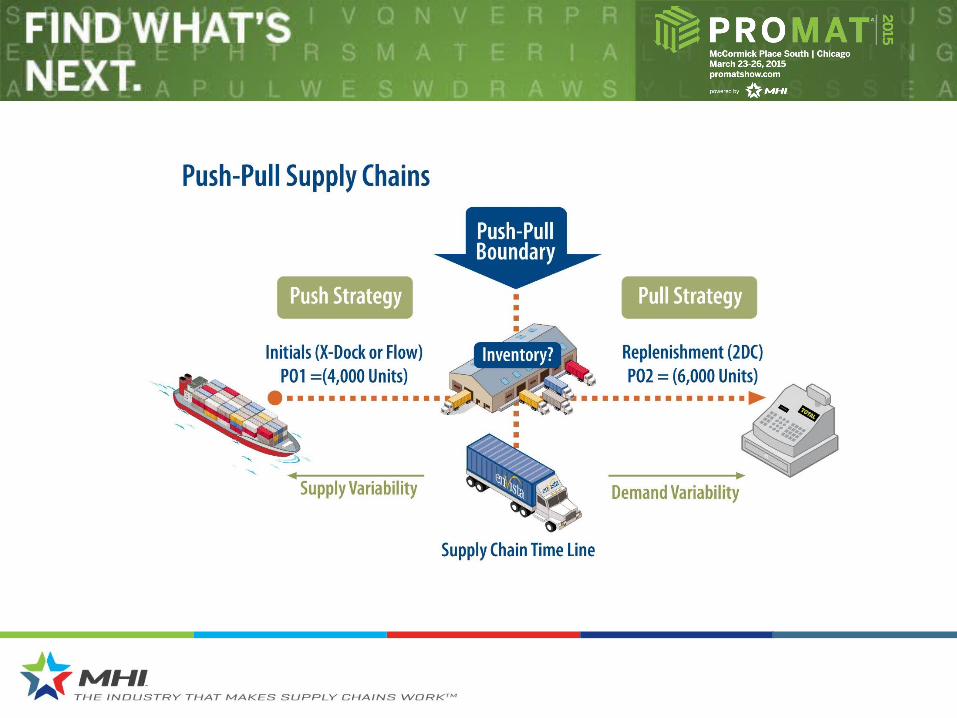
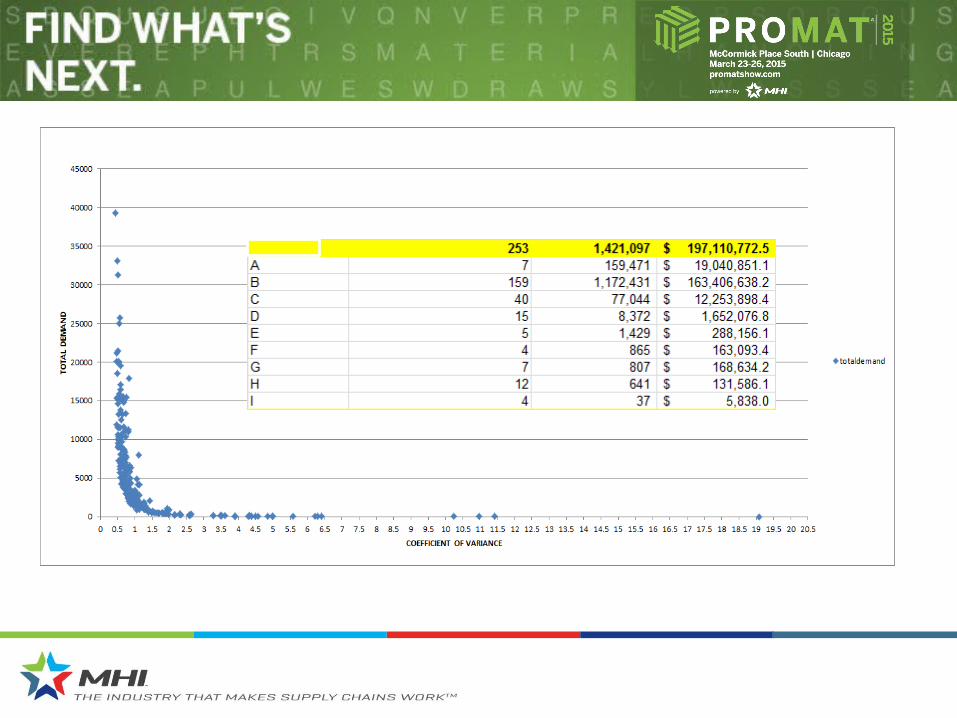
CV is a measure of “predictability”• Average Daily Demand/STD DEV of the Demand in
terms of units sold• A lower CV value is easier to forecast and therefore can
be pushed/continuous flow of inventory. Due to higher predictability and in theory less inventory is required in the supply chain. Inventory can be positioned farther down-stream (stores)
• A higher CV values is harder to forecast and therefore should be pulled. Due lower predictability inventory should be positioned further up-stream (TDC or Spoke). In theory you pull the inventory, however inventory positioning (TDC or Spoke) is based upon customer tolerance time as well
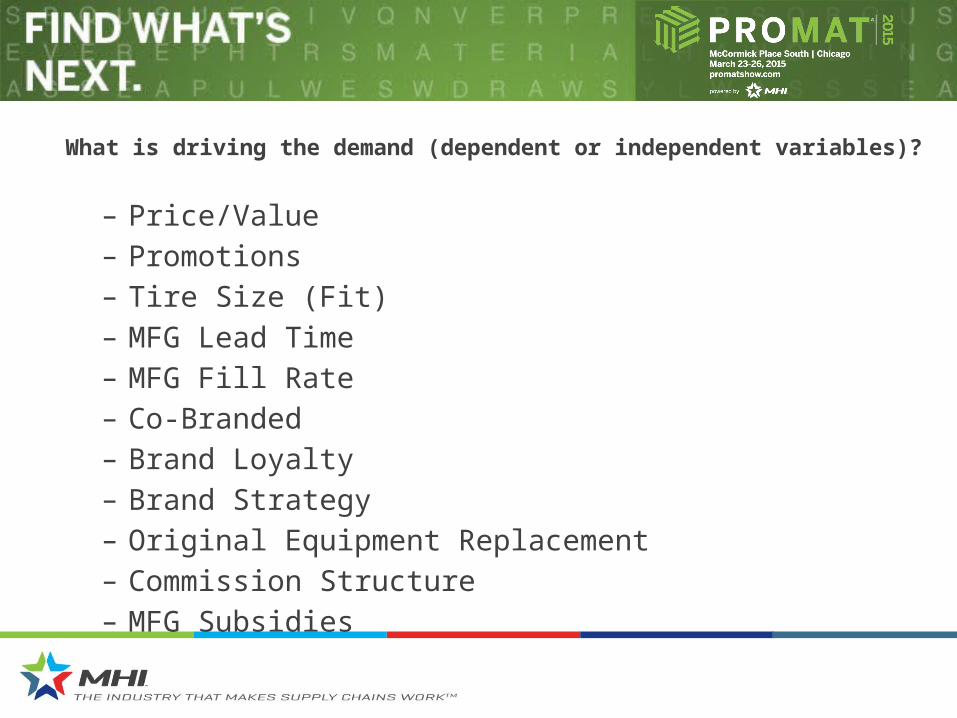
What is driving the demand (dependent or independent variables)?
– Price/Value– Promotions– Tire Size (Fit)– MFG Lead Time – MFG Fill Rate– Co-Branded – Brand Loyalty– Brand Strategy– Original Equipment Replacement– Commission Structure– MFG Subsidies
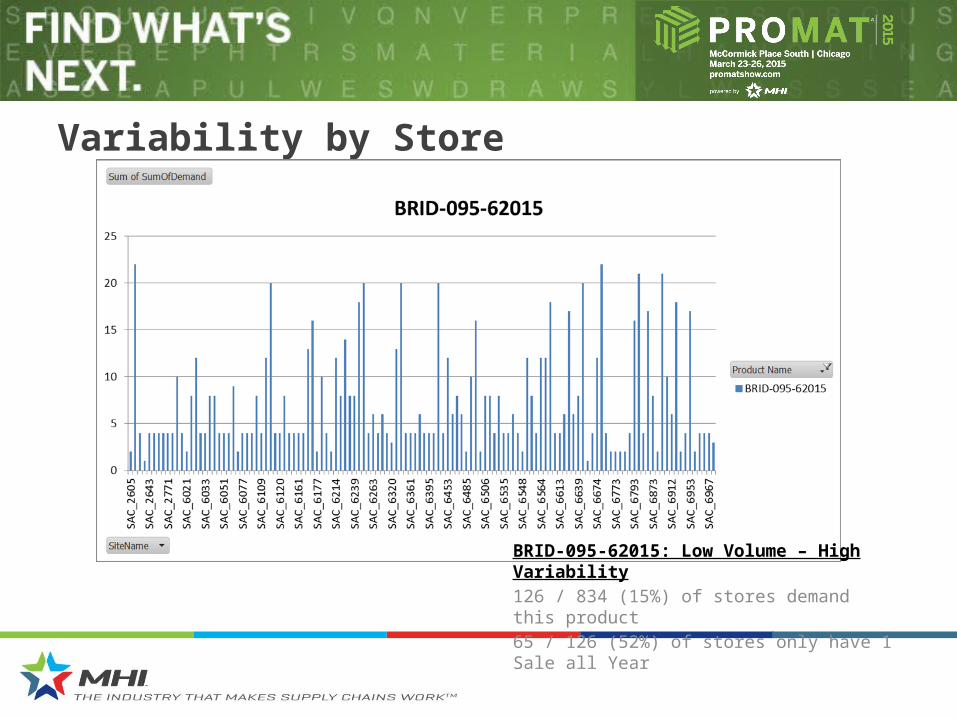
Variability by Store
BRID-095-62015: Low Volume – High Variability126 / 834 (15%) of stores demand this product65 / 126 (52%) of stores only have 1 Sale all Year
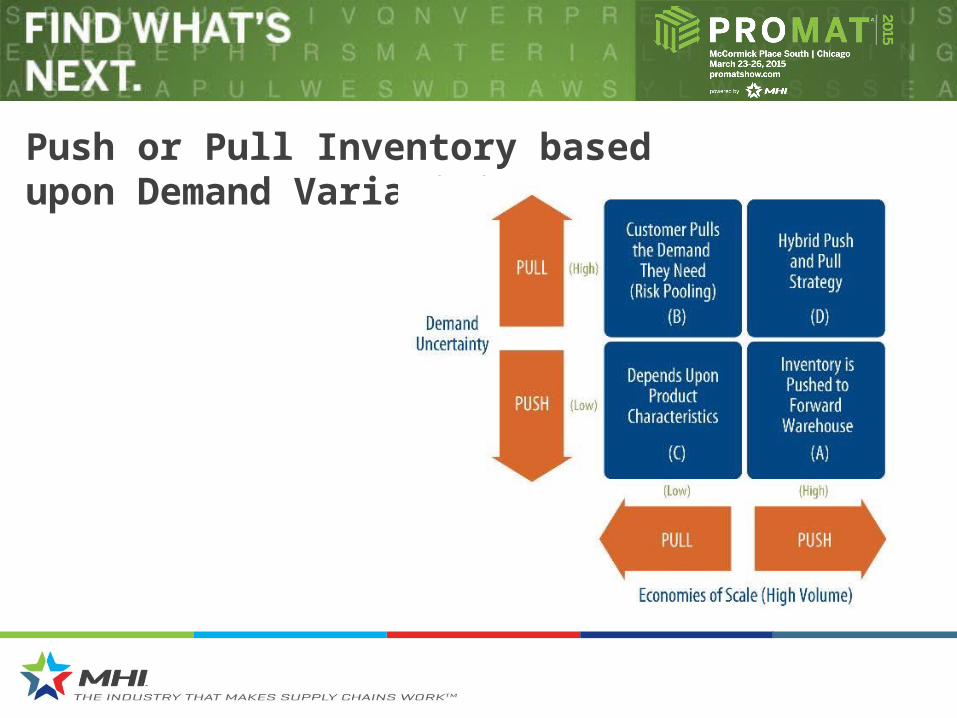
Push or Pull Inventory based upon Demand Variability
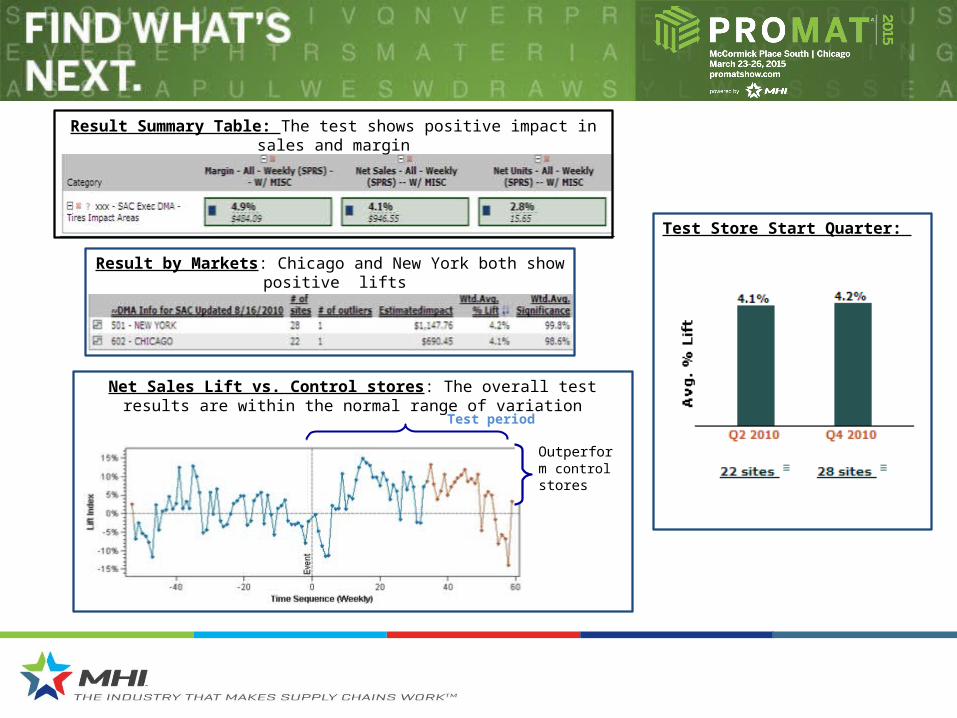
Result Summary Table: The test shows positive impact in sales and margin
Net Sales Lift vs. Control stores: The overall test results are within the normal range of variation
Test Store Start Quarter:
Outperform control stores
Result by Markets: Chicago and New York both show positive lifts
Test period
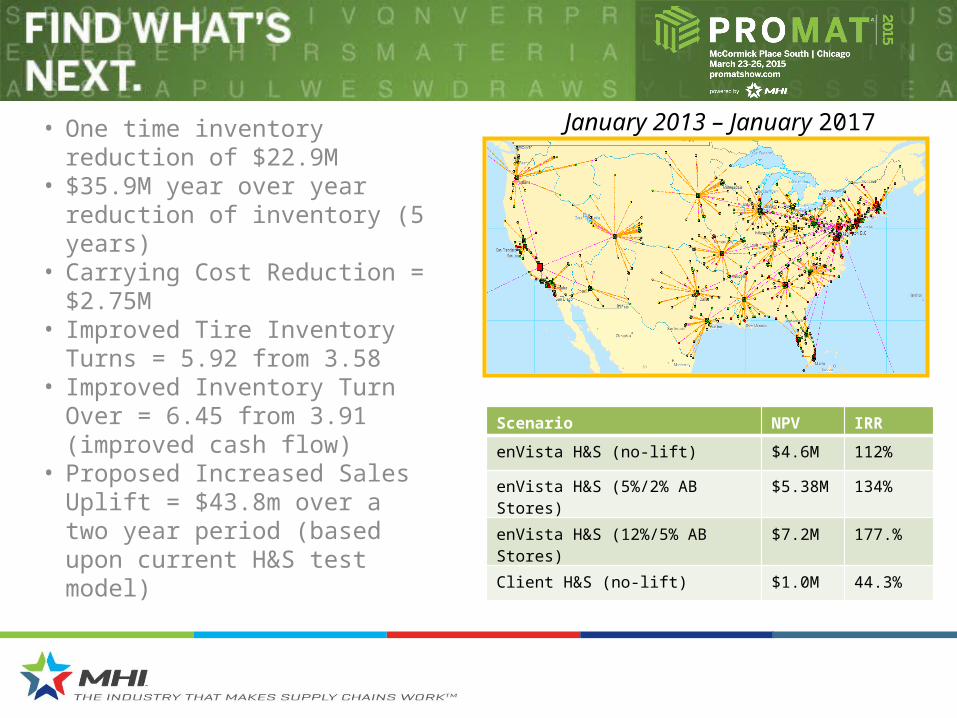
• One time inventory reduction of $22.9M
• $35.9M year over year reduction of inventory (5 years)
• Carrying Cost Reduction = $2.75M
• Improved Tire Inventory Turns = 5.92 from 3.58
• Improved Inventory Turn Over = 6.45 from 3.91 (improved cash flow)
• Proposed Increased Sales Uplift = $43.8m over a two year period (based upon current H&S test model)
January 2013 – January 2017
Scenario NPV IRR
enVista H&S (no-lift) $4.6M 112%
enVista H&S (5%/2% AB Stores) $5.38M 134%
enVista H&S (12%/5% AB Stores) $7.2M 177.%
Client H&S (no-lift) $1.0M 44.3%
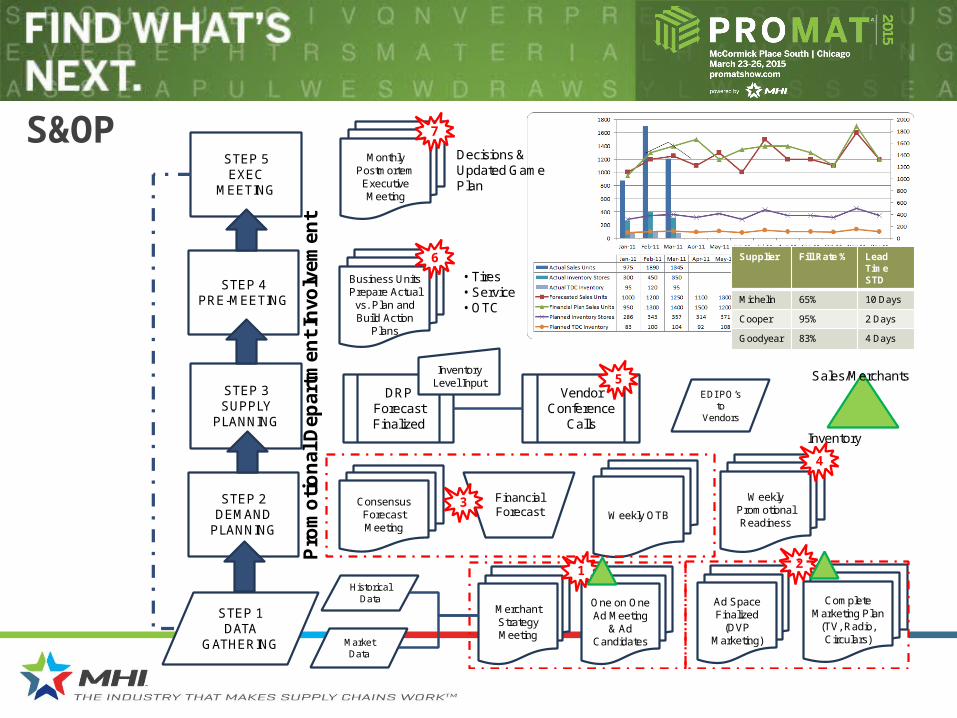
S&OP
Historical Data
Market Data
Merchant Strategy Meeting
One on One Ad Meeting
& Ad Candidates
Ad Space Finalized
(DVP Marketing)
Complete Marketing Plan
(TV, Radio, Circulars)
1 2
Consensus Forecast Meeting
Weekly Promotional Readiness
Weekly OTB
Financial Forecast
Monthly Postmortem
Executive Meeting
DRP Forecast Finalized
Vendor Conference
Calls
Inventory Level Input
EDI PO’s to
Vendors
STEP 1DATA
GATHERING
STEP 2DEMAND
PLANNING
STEP 3SUPPLY
PLANNING
STEP 4PRE-MEETING
STEP 5EXEC
MEETING
Business Units Prepare Actual vs. Plan and Build Action
Plans
• Tires• Service• OTC
4
5
3
7
Sales/Merchants
Inventory
6
Fin
ance
Dep
artm
ent
Invo
lvem
ent
Pro
mo
tio
nal
Dep
artm
ent
Invo
lve
men
t
Decisions & Updated Game Plan
Supplier Fill Rate % Lead TimeSTD
Michelin 65% 10 Days
Cooper 95% 2 Days
Goodyear 83% 4 Days