Embed Size (px)
Citation preview
CORPORATE STAFFING SERVICES LIMITED
March 2014 Prepared by: ADREC Limited Ngong Road Professional Centre, 3rd Floor Ngong Road P.O BOX 21889 00100 NAIROBI, Kenya tel: 254-20-3876455-6 cellphone: 254-724438083 www.adrecltd.kbo.co.ke
Employment Survey 2014
Understanding Jobseekers’ Priorities
2
TABLE OF CONTENTS
LIST OF TABLES AND FIGURES ................................................................................ 3
ACKNOWLEDGEMENTS ............................................................................................ 4
LIST OF ACRONYMS ................................................................................................. 5
EXECUTIVE SUMMARY .............................................................................................. 6
1. INTRODUCTION ................................................................................................. 12
2. METHODOLOGY ................................................................................................ 13
3. SURVEY FINDINGS ............................................................................................ 14
4. CONCLUSIONS AND RECOMMENDATIONS ..................................................... 31
ANNEXES ................................................................................................................. 36
Annex 1: Job Seekers’ Quantitative Questionnaire ................................................... 36
Annex 2: Employers’ key Informant Interview Tool ................................................... 49
Annex 3: Key Informants .............................................................................................. 51
3
LIST OF TABLES AND FIGURES
Tables:
Table 1: Demographic Characteristics ............................................................................ 15
Table 2: Designation of Respondents ............................................................................. 16
Table 3: Perceptions on Availability of Work and Unavailability of Work .......................... 26
Table 4: Reasons that Make it Hard to Secure a Job – Jobseekers’ Perceptions ............ 28
Table 5: Attributes that Make it Difficult to Secure a Job .................................................. 29
Figures:
Figure 1: Characteristics .................................................................................................. 17
Figure 2: Satisfaction Levels ........................................................................................................ 19
Figure 3: Opportunities for Training ................................................................... .........................19
Figure 4: Salary Increment ........................................................................................................... 19
Figure 5: Likelihood to Search for Job in 2014 .......................................................................... 20
Figure 6: Reasons for Unemployment ........................................................................................ 21
Figure 7: Ideal Potential Employer .............................................................................................. 22
Figure 8: Pull Factors to Employer .............................................................................................. 22
Figure 9: Perceptions on Salary....................................................................................... 23
Figure 10: Confidence in Securing Employment in 2014 ................................................. 23
Figure 11: Likelihood to Get a Call Back from Employer .................................................. 24
Figure 12: Willingness to Relocate for Job Opportunity ................................................... 24
Figure 13: Availability of Work/Employment ..................................................................... 25
Figure 14: Work Opportunities in Comparison to Past Year ............................................. 25
Figure 15: Satisfaction with Job Search ........................................................................... 27
Figure 16: Perception on Employer Understanding the Job Seeker ................................. 27
Figure 17: What Job Seekers Look for in Work/Employment ........................................... 28
Figure 18: Responses from Interviewers/ Employers on Last Interview Attended ............ 29
4
ACKNOWLEDGEMENTS
ADREC team wishes to extend its gratitude to Corporate Staffing Services Limited (CSS) Managing Director, Mr. Perminus Wainaina, for facilitating this survey and offering valuable guidance and information. His contributions immeasurably helped us in planning and collection of data and shaped the recommendations in this study. We gratefully acknowledge the special contribution of the employers who participated by holding discussions through key informant interviews. Also, ADREC would like to thank its staff members who undertook the quantitative and qualitative fieldwork and who also managed the data processing and reporting within tight timelines. Last but not least, we acknowledge the cooperation of data coders and the data entry clerks, enumerators and survey supervisors who traversed the Nairobi County collecting data.
ADREC Limited Nairobi

5
LIST OF ACRONYMS
CSS Corporate Staffing Services Limited HR Human Resource NGO Non-Governmental Organisation SPSS Statistical Package for Social Sciences ToR Terms of Reference
6
EXECUTIVE SUMMARY
Background Corporate Staffing Services Limited commissioned ADREC Limited to carry out the Job Seekers’ Survey in Nairobi County. The survey was conducted between December 2013 and January 2014 in the eight sub-counties.
Methodology The consultant used both qualitative and quantitative methodologies. Desk review involved reviewing existing secondary documents and other similar studies previously carried out. A total of 386 respondents were interviewed face-to-face. A total of six employers were interviewed to triangulate the data obtained from the quantitative findings. An additional 21 key informants were contacted through email. Findings Overall, 66% of the survey respondents are employed, while 34% are unemployed. A relatively large proportion of Kenya’s working age population is employed. This is in line with the overall unemployment rate in Kenya which stands at 40%. According to the findings, 35.7% of the employed survey respondents are in contract jobs, 28.6% are in self-employment, 18% employed on permanent basis and 16.5% are engaged in casual employment. The private sector is the major employer in Kenya, employing 51.8% of the survey’s respondents; 29.5% are running their own personal businesses, 11.2% work in public institutions and parastatals and only 7.6% are employed in the NGO sector. Overall, the parastatal/government employees (89.3%) are most satisfied with their employment, followed by the NGO employees (79.2%), the self-employed (65.8%) and, lastly, private sector employees (54.8%). In addition, 36.1% of the survey respondents based in Nairobi County described the desire for higher compensation as the reason they would want to change their current employment in 2014. Other factors that were mentioned include job security, a better match to their skills and aspirations and a good working environment. The survey respondents within Nairobi County are actively searching for jobs. 60% of those currently employed will search for a new job in the year 2014 while 81.2% of those currently unemployed will be searching for a job in the year 2014. 56.5%, slightly more than half of the unemployed, have never been employed. Notably, 16.8% of the unemployed respondents who will be searching for a job in 2014 were fired from their last jobs, while the rest (26.7% of the unemployed) quit employment due to personal reasons, illnesses and some had their contracts expire. The unemployment problem in Kenya is cumulative in nature with new jobs attracting jobseekers in the entire spectrum of the labour force. The survey shows 33.8% of unemployed jobseekers are of the opinion that NGOs are their ideal employers, while 27.9% of the employed believe the Government is the ideal employer.
7
The bulk of the jobs are in the informal sector, which has generally low appeal amongst the youth. The informal sector is characterised by labour market insecurity such as low job tenure, absence or weak enforcement of core labour and employment regulations, weak framework for social protection and high levels of employment flexibility. Slightly more than half, or 51.2% of the employed feel that the salaries paid today are better than those paid a year ago, 14.2% are neutral about the issue, while 34.6% of the employed feel salaries paid a year ago are better than the salaries paid today. Majority, or 60.2%, of the unemployed are neutral about the amount of salaries paid today compared to what was paid a year ago. Only 25.7% feel that current salaries are better than those paid a year ago. Whether currently employed or seeking employment, 52.4% of jobseekers remain confident about getting a new job in 2014, 42.5% are not confident of securing a new job in the year 2014, while 5.2% are neutral, i.e. not certain or uncertain of securing a job in 2014. However, 59% of those employed are confident about securing a job in 2014 compared to 47.2% of the unemployed who are confident about securing a job in 2014. 48% of the jobseekers (both the employed and the unemployed) are of the opinion that they are likely to get a call back from a potential employer after applying for jobs. 53.1% of the employed are more confident that they would receive a call back compared to 46.6% of the unemployed. 74%, almost three quarters of jobseekers, are willing to relocate to a different country and/or county in search of employment opportunities. Majority, 84.6%, of the unemployed job seekers, said that they would relocate to another country and/county for job opportunities. Comparatively, 72.1% of the employed reported that they are willing to relocate to another county or country to get job opportunities. Also, 61.9% of both the employed and the unemployed are of the opinion that jobs are currently available in Kenya. Majority, or 66.7% of those currently employed are of the opinion that there are more jobs/employment opportunities and job openings now than a year ago, while 37.8% of the unemployed, disagree with this notion. The employed are more satisfied with their job search endeavours than the unemployed. A whopping 71.2% of the employed respondents indicated that they are satisfied with their job search activities. Only 28.8% of the employed mentioned that they are dissatisfied with their job search. Majority, 41.9%, of the unemployed, said that they are dissatisfied with their job search, 4.7% are very dissatisfied, 38.8% are fairly satisfied and 14.8% are satisfied with their job search activities. Majority, or 54.6% of the employed respondents, are of the perception that they are well understood by the employers. Only 19.3% of the employed are not certain whether or not the employerd understand them. 36.4% of the unemployed are not certain whether or not the employers understand them, 34.8% of the unemployed feel that the employers understand them while 28.8% of the unemployed feel that the employers do not understand them. The two most influential job values that job seekers are seeking from potential employers include better salaries (35.8%), followed by job security (22.1%).
8
The four highly mentioned reasons that jobseekers feel that has made it difficult for them to secure jobs are corruption and nepotism (33.7%), few job opportunities (17.4%), level of qualifications (13.9%), lack of skills, experience and aspirations (7.8%). The most common responses unemployed jobseekers mentioned they receive from employers after an interview are: will call back (43.6%), their levels of experiences were inadequate (23.1%) and they are not qualified (12.8%), among others. 23.5% of the unemployed job seekers reported that they are not able to find a job that matches their salary requirements and locations. Also, the employers do not contact them (19.1%), job seekers are not able to find opportunities for which they are qualified (13.9%), the jobseekers are not able to find a job that captures their interests (11.6%) and the employers do not understand the job seekers (10.7%). Conclusions
Search for Jobs The employed and unemployed job seekers will be actively searching or looking for jobs in the year 2014 with majority of the job seekers looking for higher pay and job security. Difficulties on securing jobs Attributes mentioned by unemployed jobseekers on why it is difficult to secure a job include not being able to find jobs that match their salary requirements and locations; not being able to find opportunities for which they are qualified; potential employers do not contact them: the jobseekers are not able to find a job that captures their interests and the employers do not understand job seekers. Employment job values The most influential job values that jobseekers are looking for in potential employers include better salaries and job security. It’s been noted that the informal sector jobs are precarious in nature. They are characterised by job insecurity, poor wages and terms and conditions of employment, absence of institutionalised social protection mechanisms, weak safety and health standards, and low job tenure. Job outlook Those employed are of the opinion that there are more jobs/employment opportunities and job openings now than there were a year ago. The employed are more confident about securing a job in 2014 than the unemployed. Devolution has helped change preference of urban/rural migration in Kenya. The county government structure has made it possible for jobseekers to find employment opportunities in the rural areas unlike in the past where employment opportunities were mainly available in the major cities/towns. Also, the employed are more confident that they would receive a call back from potential employers after applying for a job than the unemployed. As expected, the unemployed disagree that there are more job opportunities now than there were a year ago. This shows that the employed are more positive with the job market outlook in Kenya than the
9
unemployed. The unemployed are sceptic of the job market. This may be affecting their job search. Satisfaction levels for those employed Results of the survey show that employed Nairobi residents are actively searching for jobs. This is because they are not only looking for more pay; but also job security. Satisfaction levels for those employed Overall, parastatal/Government employees (89.3%) are most satisfied with their jobs, followed by the NGO employees (79.2%), the self-employed (65.8%) and, lastly, the private employees (54.8%). The relatively low and declining proportion of wage and salaried workers in Kenya signifies low levels of economic development. The high proportion of the self-employed indicates a deficit of decent employment opportunities in the country. The self-employed and the unpaid family workers have a lower likelihood of having formal work arrangements, and are more likely to lack elements associated with decent employment such as adequate social security and social protection and a voice at work. Generally, informal sector employment in Kenya is known to be precarious in nature with manifestations of low pay, job insecurity, poor safety and health standards and absence of worker rights and representation, among others. The growing proportion of the self-employed combined with the low but important size of the unpaid family workers means that Kenya is generating more vulnerable employment. Satisfaction levels for job search The employed are more satisfied with their job search endeavours than the unemployed persons. Remaining out of employment for long is especially worrying for the jobseeker. This situation may trap the jobseeker in a lifetime of weak attachment to the labour market, alternating between low paid insecure work and open unemployment with considerable socio-economic and political implications to the country. Perception on understanding by employers The employed have a perception that they are well understood by employers. The unemployed, however, are not certain whether or not the employer understands them. More job seekers, both new labour market entrants and those out of employment through the various labour separation mechanisms, ordinarily remained out of employment for a longer period, hence swelling the ranks of the disillusioned jobseekers. Employment outlook To gain employment, almost three quarters of jobseekers are willing to relocate to a different country and/or county for a job opportunity. The unemployed are even more willing to relocate to another country and/county for a job opportunity than the employed. The majority of Nairobi residents are in contract jobs. They are also mostly employed in the private sector. Most employers in Kenya, including the public sector are increasingly using casual, temporary, part-time, contract, sub-contracted and outsourced workforces to reduce labour costs, achieve more flexibility in management and exert greater levels of control over labour.
10
The results of the survey show that the employed perceive the Government as the ideal employer. Overall, the casual relationships between employers and workers have impaired labour relations, eroded worker protection and transferred additional responsibilities, such as social and trade union protection, job security and wage negotiations to the worker. More than half of the employed feel that current salaries are better than a year ago and in addition to seeking greener pastures, they will be looking for better job security. The majority of the unemployed see NGOs as the ideal employers because they are looking for higher salaries/compensation than they are qualified for. The results of the survey show that the unemployed respondents are not able to find jobs that match their salary requirements and locations. They are also not able to find opportunities for which they are qualified. The most common responses unemployed job seekers receive from employers after an interview are that they will call back, their experiences are not adequate and that they are not qualified. The unemployed need to improve their skills and qualifications if they are to attract the levels of compensation they seek. A significant proportion (43.6%) of the jobseekers mentioned that they did not receive a call back from the employer after their last job interview. Employment frustrations resulting from weak absorptive capacity of the labour market has been accumulating over time. Kenya’s employment problem is one of late absorption in formal jobs and the adoption of informal activities at early ages. This does not lead to work career improvements, which also complicates absorption of the jobseekers into formal jobs. The most disheartening responses unemployed job seekers mentioned they have received from potential employers after a job interview is that their experience was not adequate or that that they were not qualified. Youths face barriers to entry into the labour market arising from lack of, or inadequate, work experience, and path dependence, which dictates that early unemployment increases the likelihood of subsequent unemployment. Recommendations Majority of the job seekers lack appropriate skills. This limits their participation in the labour market. To address this problem, the business community needs to be closely engaged with educational and training institutions. They need to set up career advisory services and make them accessible to all job seekers looking for information and guidance. This should be both online and phone in. School-industry link programmes that aid students in appreciating the relevance of learned theories in the world of work should be established. Also, internship placements in businesses/industries during school holidays to facilitate sensitisation on the relevant skills in the labour market should be encouraged. Skills mismatch is a key antecedent to youth employment in Kenya. Promoting the exchange of information, knowledge and human resources between the employing institutions and job seekers could help curb this problem. Also creating linkages between training institutions and the private sector through research, internship opportunities and finance and encouraging the private sector to get involved in technical education and training can go a
11
long way in bridging the gap. Care should, however, be taken not to turn internship and industrial attachments into sources of cheap labour. The employers should consider providing better incentives and more job security to their employees to retain them. The majority of the unemployed see NGOs as the ideal employers because they desire higher salaries/compensation than they are qualified for. Most of the unemployed need to improve their skills and qualifications to attract higher levels of compensation. As noted, a good number of job applicants were fired from their jobs. Therefore, it would be very necessary for employers to carry out background checks on potential employees to find out reasons for leaving the previous jobs. The unemployed are more doubtful of their job seeking abilities, activities and their qualifications unlike the employed jobseekers who are more confident with their job searches. There is need for the unemployed to be more positive about their job searching. The negativity could be limiting their possibilities. There are opportunities for carrying out training to unemployed job applicants.
12
1. INTRODUCTION
1.1. Project background This project was commissioned by Corporate Staffing Services Limited and it was executed by ADREC Limited, a research firm based in Nairobi, Kenya. Through this survey, Corporate Staffing aims to provide information to help employers understand the current dynamics of the labour market (i.e skills, knowledge and attitudes) of the Kenyan employees and enhance access to labour market information, which is focused on career guidance and counselling, enhanced job search skills and placements. The findings will enable the formulation and implementation of active labour market policies and informed interventions that are relevant to the Kenyan situation. The variables that were investigated include but not limited to: education and training experience; perceptions and aspirations in terms of employment; job search process; barriers to and supports for entry into the labour market; employer preference; attitudes of employers towards young workers; and nature of informal sector employment and the level of acceptance of the youth to this type of employment. 1.2. Objectives The objectives of the survey were identifying: • Challenges currently faced by the jobseeker; • Barriers to employment; • Factors that motivate joseekers towards a career change; • Level of confidence in finding a job; • Establishing employers’ rating on how job seekers view the current job market and what
will motivate their career decisions in the months and years ahead; • Perceptionx of jobseekers.
The survey offers insights on employees and their preferences to help employers make better decisions in understanding the jobseekers perception and priorities, job market analysis, hiring and retaining talent. 1.3. Project scope Both qualitative and quantitative methodologies were used to conduct this survey. Face-to-face interviews were conducted in Nairobi County. The survey targeted both employed and unemployed people residing in the eight sub-counties of Nairobi County; namely Dagoretti, Westlands, Kamukunji, Makadara, Embakasi, Kasarani, Kibera and Starehe. In-depth discussions with employers were also conducted. 1.4. Survey Period The survey was carried out between 10th December 2013 and 12th January 2014.
13
2. METHODOLOGY
2.0 Overview This section outlines the research methodology used for this study. The overall approach of the survey was based on literature review, face-to-face interviews, key informant interviews, data analysis and report writing. This section includes the research design, sampling, target population, data collection, data analysis and preparation of draft report. 2.1 Phase 1 – Planning and Preparation Phase one included the planning and preparation of the survey whereby ADREC Ltd team held discussions with CSS management to agree on the scope the research, which informed the Terms of Reference. At this stage, the consultants reviewed the objectives and outputs of the survey. This was to prepare an integrated project plan for the successful completion of the assignment within the stipulated 50 days indicated in the work plan. 2.2 Phase 2 – Desk Research The second phase involved document/literature review and collection of quantitative data from secondary sources. The documents reviewed included: Economic Survey 2013, Kenya National Bureau of Statistics (KNBS) Key Facts and Figures 2012, Kenya Economic Update 2012 - Edition No.7 and The Dynamics and Trends of Employment in Kenya 2010 by the Institute of Economic Affairs - Kenya. The desk study involved identifying and analysing available secondary data as well as other existing studies on job seekers. 2.3 Phase 3 – Sampling and Tools Development This phase involved sampling, tools development, piloting of tools and training of researcher’s assistants and supervisors. 2.3.1 Sampling The sample design was selected to ensure that all categories of jobseekers had an equal probability of selection. The job seekers survey was designed to provide estimates in Nairobi County. Nairobi was used as the basic stratum in the design, further stratified into all the eight divisions within the county. A sample of 386 jobseekers was estimated to obtain reliable results with design effect of 2 at a confidence level of 95%, with margin error of +/-5%. The jobseekers were selected randomly. 2.3.2 Phase 2 – Survey Instrument The survey team prepared two major categories of data collection tools (i.e. face-to-face interview tool and key informant in-depth interview guidelines). The face-to-face interview was a semi-structured questionnaire (with closed/open questions and tables). All the tools made were shared with CSS management who gave valuable comments and suggestions for improvement, which were taken into consideration during the finalisation and adoption of the tools. 2.4 Phase 4 – Training and Pre-test A one-day training of the 12 data enumerators and three supervisors was carried out at
14
Nairobi. A pre-test of the tools was carried out after the training to determine the strengths and weaknesses of the survey questionnaire. A debrief was there after conducted and the noted concerns addressed and the final tool/questionnaire was printed for the research survey. 2.5 Phase 5 – Fieldwork This stage involved both quantitative and qualitative data gathering/in-depth interviews with individuals, discussions with employers and other key stakeholders to capture the general overview of the expectations of the study. The survey utilised both qualitative and quantitative methodologies to ensure that comprehensive information was gathered from the subjects of the study. 2.5.1 Quantitative Data Gathering This was the most substantive phase involving a rigorous field survey, using descriptive and primary data gathering techniques. A total of 386 respondents from the eight divisions of Nairobi County were interviewed face-to-face and an additional 30 were interviewed through telephone. Six employers were interviewed in order to triangulate the data obtained from the quantitative findings. An additional 21 key informants were contacted through email. 2.5.2 Qualitative Phase The qualitative phase involved use of key In-depth Interviews (KII’s). This entailed a one-on-one discussion with organisations directors/employers and human resource managers using a focused discussion guide that addressed the objectives of the survey by discussing pertinent issues regarding job acquisition and retention. 2.6 Phase 6 – Data Analysis This stage involved manual and computer-based analysis of the data collected. Data received from the survey was processed in three stages: �� Checking data �� Entering data: Data was captured and analysed using SPSS, �� Refining data: Refining data consisted of correcting errors and inconsistencies, detected during checking. All the data was tabulated and analysed. Frequency counts and multi-response tables were made for every question to confirm data accuracy. 2.7 Phase 7 – Report Writing The report writing phase was undertaken in two stages: Draft report and final report. 2.7.1 Draft Report The consultants critically analysed and interpreted results of the study and appropriately developed a draft report. The draft report was submitted to the client for comments and suggestions for refinement. 2.7.2 Final Report A final report was prepared which incorporated comments and suggestions from the client.
3. SURVEY FINDINGS
15
3.1 CHARACTERISTICS OF RESPONDENTS 3.1.1 Characteristics of Respondents
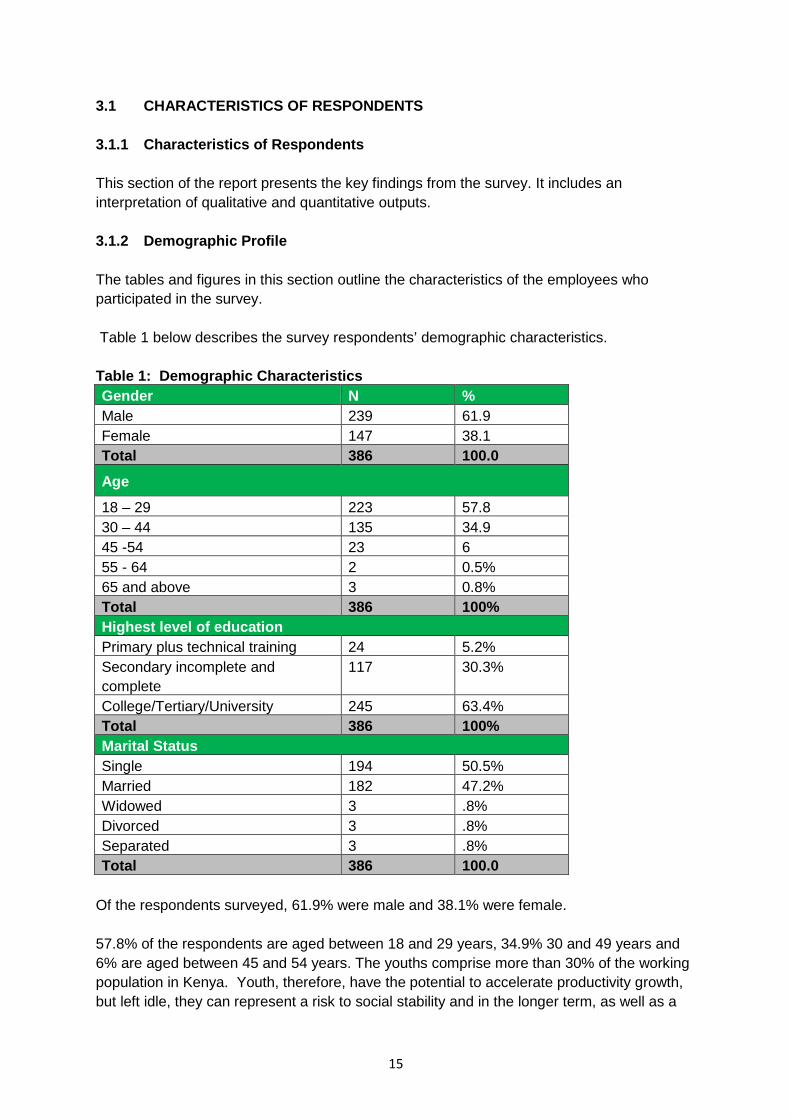
This section of the report presents the key findings from the survey. It includes an interpretation of qualitative and quantitative outputs. 3.1.2 Demographic Profile The tables and figures in this section outline the characteristics of the employees who participated in the survey. Table 1 below describes the survey respondents’ demographic characteristics. Table 1: Demographic Characteristics Gender N % Male 239 61.9 Female 147 38.1 Total 386 100.0
Age
18 – 29 223 57.8 30 – 44 135 34.9 45 -54 23 6 55 - 64 2 0.5% 65 and above 3 0.8% Total 386 100% Highest level of education Primary plus technical training 24 5.2% Secondary incomplete and complete
117 30.3%
College/Tertiary/University 245 63.4% Total 386 100% Marital Status Single 194 50.5% Married 182 47.2% Widowed 3 .8% Divorced 3 .8% Separated 3 .8% Total 386 100.0
Of the respondents surveyed, 61.9% were male and 38.1% were female. 57.8% of the respondents are aged between 18 and 29 years, 34.9% 30 and 49 years and 6% are aged between 45 and 54 years. The youths comprise more than 30% of the working population in Kenya. Youth, therefore, have the potential to accelerate productivity growth, but left idle, they can represent a risk to social stability and in the longer term, as well as a
16
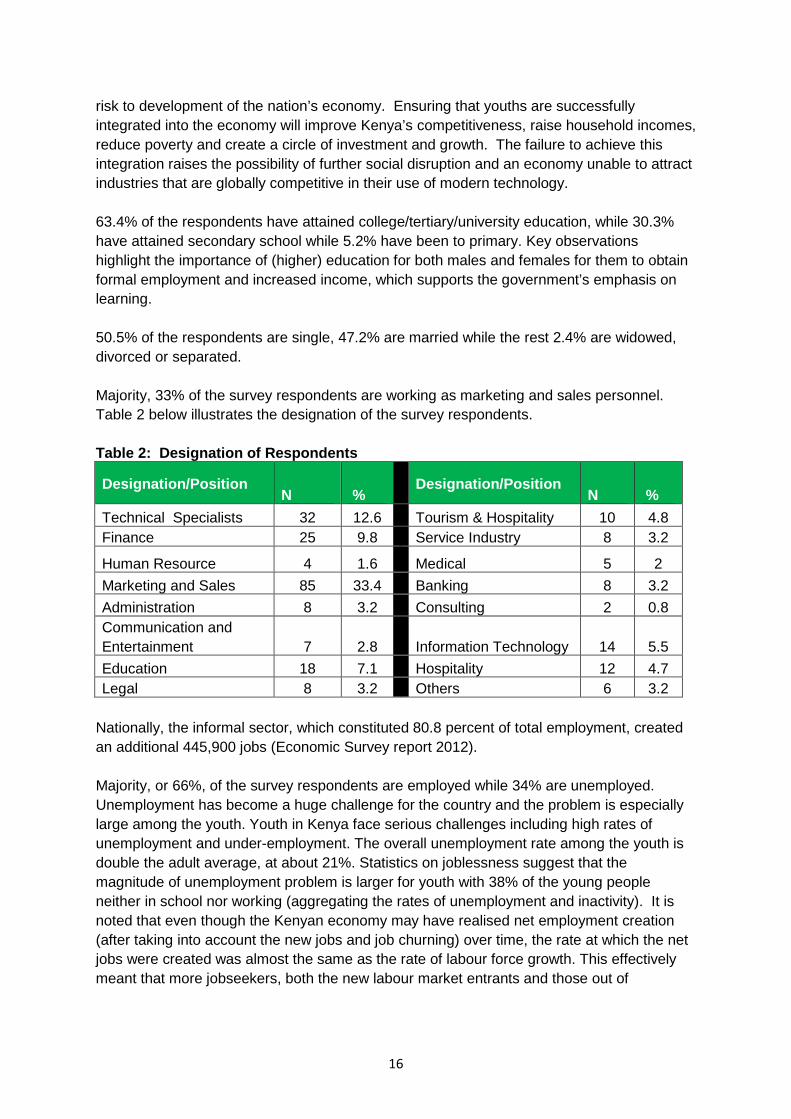
risk to development of the nation’s economy. Ensuring that youths are successfully integrated into the economy will improve Kenya’s competitiveness, raise household incomes, reduce poverty and create a circle of investment and growth. The failure to achieve this integration raises the possibility of further social disruption and an economy unable to attract industries that are globally competitive in their use of modern technology. 63.4% of the respondents have attained college/tertiary/university education, while 30.3% have attained secondary school while 5.2% have been to primary. Key observations highlight the importance of (higher) education for both males and females for them to obtain formal employment and increased income, which supports the government’s emphasis on learning. 50.5% of the respondents are single, 47.2% are married while the rest 2.4% are widowed, divorced or separated. Majority, 33% of the survey respondents are working as marketing and sales personnel. Table 2 below illustrates the designation of the survey respondents. Table 2: Designation of Respondents
Designation/Position N %
Designation/Position
N %
Technical Specialists 32 12.6 Tourism & Hospitality 10 4.8 Finance 25 9.8 Service Industry 8 3.2
Human Resource 4 1.6 Medical 5 2
Marketing and Sales 85 33.4 Banking 8 3.2
Administration 8 3.2 Consulting 2 0.8 Communication and Entertainment 7 2.8
Information Technology 14 5.5
Education 18 7.1 Hospitality 12 4.7 Legal 8 3.2 Others 6 3.2
Nationally, the informal sector, which constituted 80.8 percent of total employment, created an additional 445,900 jobs (Economic Survey report 2012). Majority, or 66%, of the survey respondents are employed while 34% are unemployed. Unemployment has become a huge challenge for the country and the problem is especially large among the youth. Youth in Kenya face serious challenges including high rates of unemployment and under-employment. The overall unemployment rate among the youth is double the adult average, at about 21%. Statistics on joblessness suggest that the magnitude of unemployment problem is larger for youth with 38% of the young people neither in school nor working (aggregating the rates of unemployment and inactivity). It is noted that even though the Kenyan economy may have realised net employment creation (after taking into account the new jobs and job churning) over time, the rate at which the net jobs were created was almost the same as the rate of labour force growth. This effectively meant that more jobseekers, both the new labour market entrants and those out of
17
employment through the various labour separation mechanisms, ordinarily remained out of employment for a longer period hence swelling the ranks of the discouraged job seekers. 51.8% of the respondents are employed in the private sector, 29.5% are running their own personal businesses, 11.2% are working in the public institutions and parastatals and only 7.6% are employed in the NGO sectors. Nationally, 69.5% were employed by the private sector in 2012. Notably; there is a steady growth of new jobs in the private sector compared to the public sector. In 2012, the new jobs created in the private sector were 52,000 compared to 12,000 in the public sector (Economic Survey, 2013). 35.7% of the employed are in contract jobs, 28.6% are in self-employment, 18% are employed on permanent terms and 16.5% are in casual employment. It is noted that most employers in Kenya, including the public sector have resorted to casual, temporary, part-time, contract, sub-contracted and outsourced workforces to reduce labour costs, achieve more flexibility in management and exert greater levels of control over labour. This trend allows the de-politicisation of hiring and firing that makes it easier for employers to avoid labour legislation and the rights won by trade unions. Figure 1 below describes the job seekers’ characteristics categories on nature of employment, category of employer and years worked. Figure 1: Characteristics Almost half, 49.4%, of the respondents who mentioned that they are currently working have been engaged in their current job for a period of 1-5 years, 22.7% have been working in their current job for seven months to a year, 12.2% have been working for the same employer for six to 10 years and only 1.2% of the working respondents have been working for their current over 10 years.
18 .0 % 16 .5 % 3 5.7% 2 8.6 % .4 %.8 %
Natu re o f emp lo yme nt
Pe rm an en t Ca su al Co n tr act S e lf E mp lo yme n t V olun tee r O th ers
1 1.2 % 7.6 % 5 1.8% 29 .5%
C a teg ory o f C urre nt Em ployer
Pa ra sta tal s & p ub li c i nstitu tio ns NG O /CS O /FB O P ri va te Own pe rson al bu sin ess
1 1.0 % 2 2.7% 49 .4% 1 2.2 % 3.5 %1.2 %
Year s W or ked
1 to 6 m onth s 7 m onths to 1 y ea r 1 - 5 years 6 - 10 years 11 - 15 years More than 15 y ear s
18
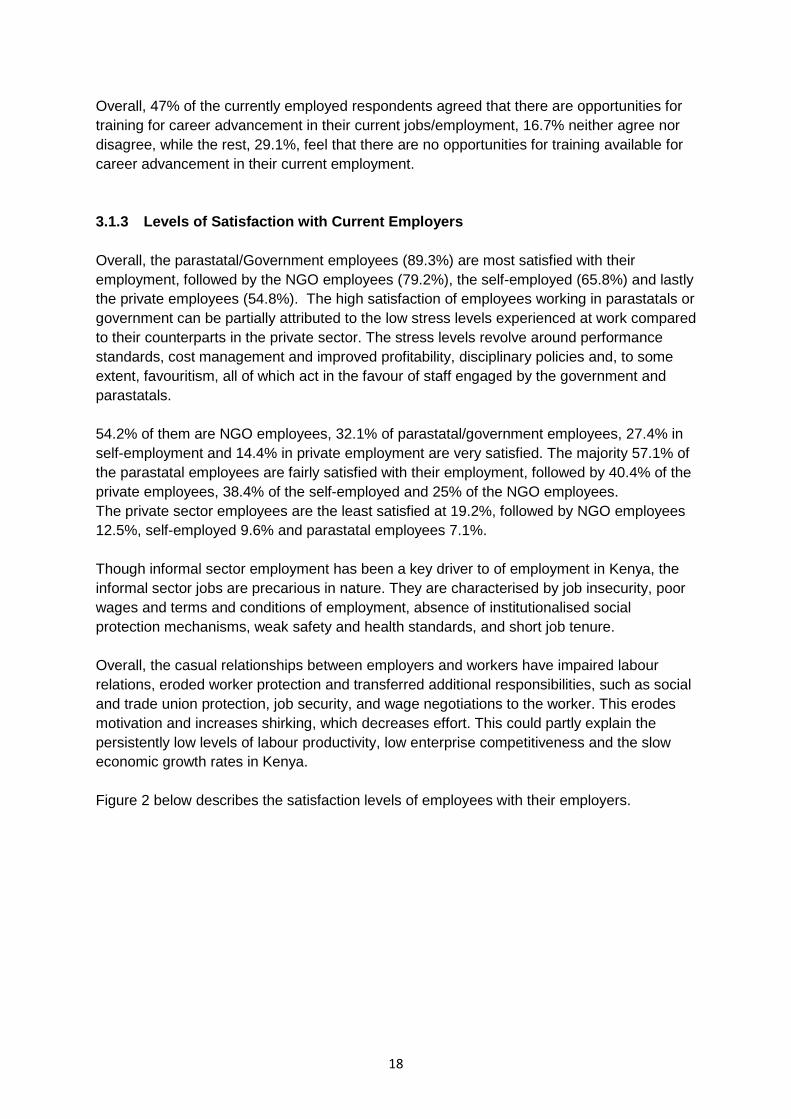
Overall, 47% of the currently employed respondents agreed that there are opportunities for training for career advancement in their current jobs/employment, 16.7% neither agree nor disagree, while the rest, 29.1%, feel that there are no opportunities for training available for career advancement in their current employment. 3.1.3 Levels of Satisfaction with Current Employers Overall, the parastatal/Government employees (89.3%) are most satisfied with their employment, followed by the NGO employees (79.2%), the self-employed (65.8%) and lastly the private employees (54.8%). The high satisfaction of employees working in parastatals or government can be partially attributed to the low stress levels experienced at work compared to their counterparts in the private sector. The stress levels revolve around performance standards, cost management and improved profitability, disciplinary policies and, to some extent, favouritism, all of which act in the favour of staff engaged by the government and parastatals. 54.2% of them are NGO employees, 32.1% of parastatal/government employees, 27.4% in self-employment and 14.4% in private employment are very satisfied. The majority 57.1% of the parastatal employees are fairly satisfied with their employment, followed by 40.4% of the private employees, 38.4% of the self-employed and 25% of the NGO employees. The private sector employees are the least satisfied at 19.2%, followed by NGO employees 12.5%, self-employed 9.6% and parastatal employees 7.1%. Though informal sector employment has been a key driver to of employment in Kenya, the informal sector jobs are precarious in nature. They are characterised by job insecurity, poor wages and terms and conditions of employment, absence of institutionalised social protection mechanisms, weak safety and health standards, and short job tenure. Overall, the casual relationships between employers and workers have impaired labour relations, eroded worker protection and transferred additional responsibilities, such as social and trade union protection, job security, and wage negotiations to the worker. This erodes motivation and increases shirking, which decreases effort. This could partly explain the persistently low levels of labour productivity, low enterprise competitiveness and the slow economic growth rates in Kenya. Figure 2 below describes the satisfaction levels of employees with their employers.
19
Figure 2: Satisfaction Levels
7.1% 4.2%11.0% 4.1%
0.0%
8.3%8.2% 5.5%3.6% 8.3%
26.0% 24.7%
57.1%
25.0%40.4% 38.4%32.1%
54.2%
14.4%27.4%
Parastatal NGO Private Own personal business
Satisfaction Levels
Very unsatisfied Fairly unsatisfied Average Fairly satisfied Very satisfied
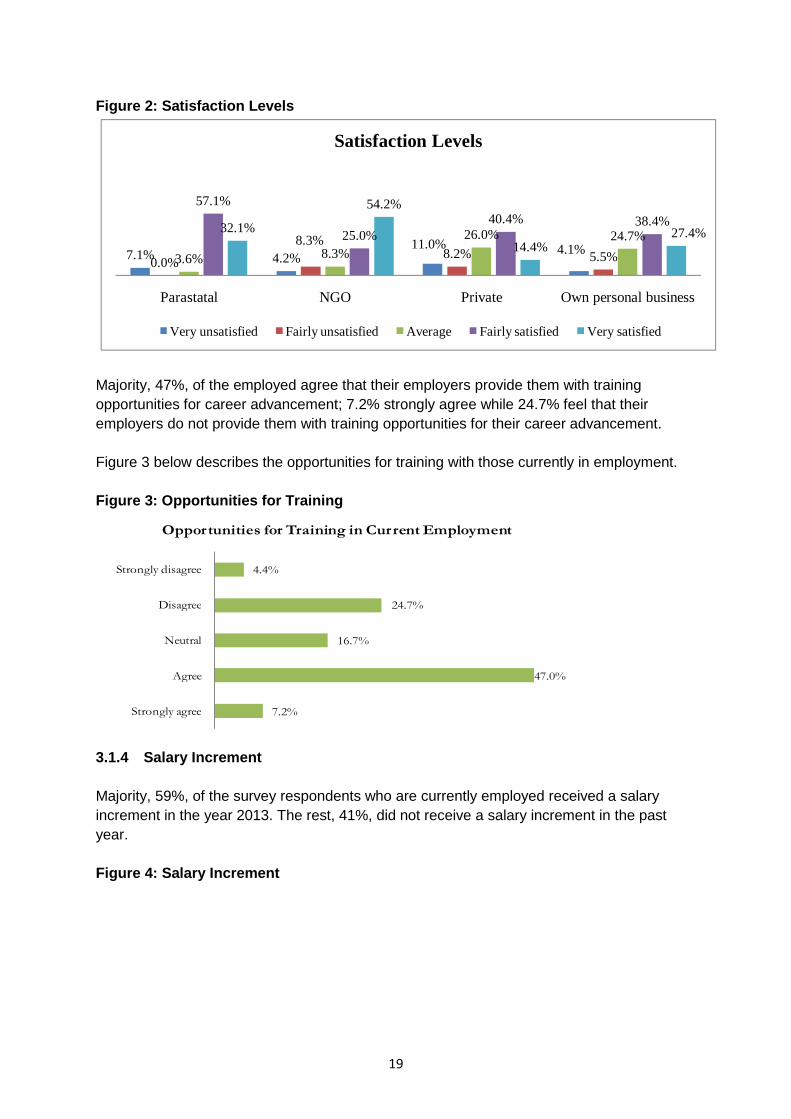
Majority, 47%, of the employed agree that their employers provide them with training opportunities for career advancement; 7.2% strongly agree while 24.7% feel that their employers do not provide them with training opportunities for their career advancement. Figure 3 below describes the opportunities for training with those currently in employment. Figure 3: Opportunities for Training
7.2%
47.0%
16.7%
24.7%
4.4%
Strongly agree
Agree
Neutral
Disagree
Strongly disagree
Opportunities for Training in Current Employment
3.1.4 Salary Increment Majority, 59%, of the survey respondents who are currently employed received a salary increment in the year 2013. The rest, 41%, did not receive a salary increment in the past year. Figure 4: Salary Increment
20
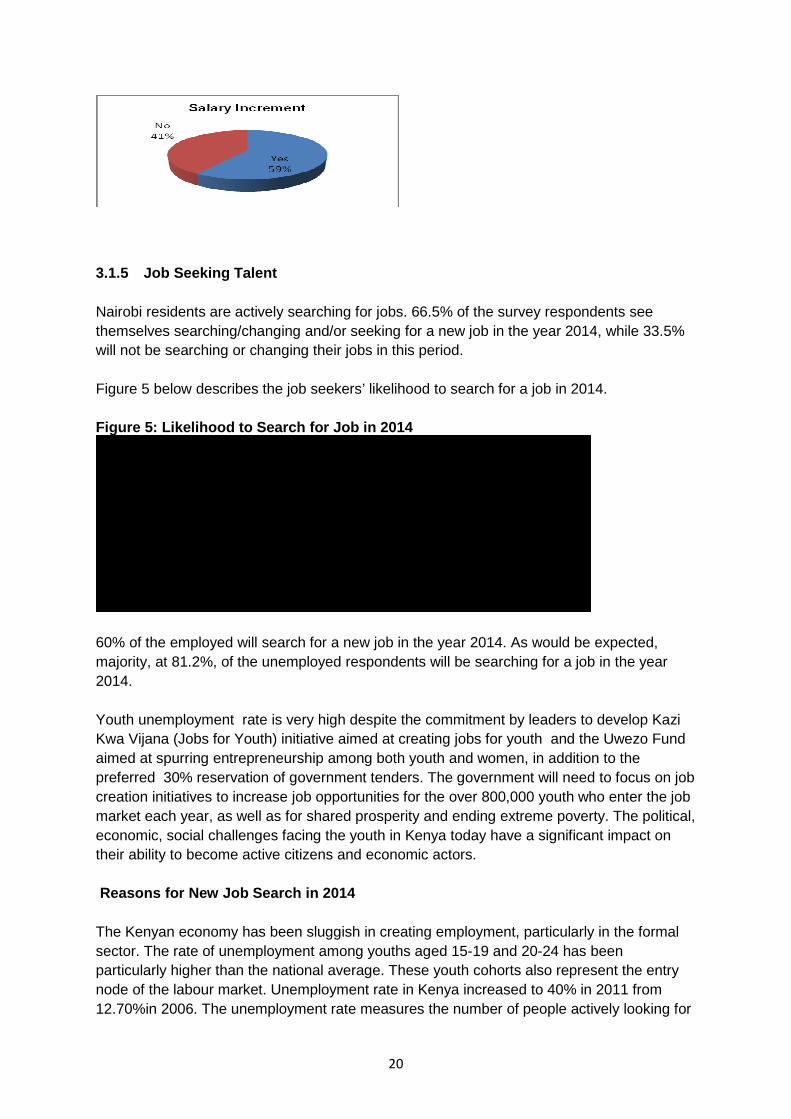
3.1.5 Job Seeking Talent Nairobi residents are actively searching for jobs. 66.5% of the survey respondents see themselves searching/changing and/or seeking for a new job in the year 2014, while 33.5% will not be searching or changing their jobs in this period. Figure 5 below describes the job seekers’ likelihood to search for a job in 2014. Figure 5: Likelihood to Search for Job in 2014
66.5%
81.2%
60%
33.5%
18.8%
40%
All respondents
Unemployed
Employed
Job Seekers Likely to Search for a New Job in 2014
Yes No
60% of the employed will search for a new job in the year 2014. As would be expected, majority, at 81.2%, of the unemployed respondents will be searching for a job in the year 2014. Youth unemployment rate is very high despite the commitment by leaders to develop Kazi Kwa Vijana (Jobs for Youth) initiative aimed at creating jobs for youth and the Uwezo Fund aimed at spurring entrepreneurship among both youth and women, in addition to the preferred 30% reservation of government tenders. The government will need to focus on job creation initiatives to increase job opportunities for the over 800,000 youth who enter the job market each year, as well as for shared prosperity and ending extreme poverty. The political, economic, social challenges facing the youth in Kenya today have a significant impact on their ability to become active citizens and economic actors. Reasons for New Job Search in 2014 The Kenyan economy has been sluggish in creating employment, particularly in the formal sector. The rate of unemployment among youths aged 15-19 and 20-24 has been particularly higher than the national average. These youth cohorts also represent the entry node of the labour market. Unemployment rate in Kenya increased to 40% in 2011 from 12.70%in 2006. The unemployment rate measures the number of people actively looking for
21
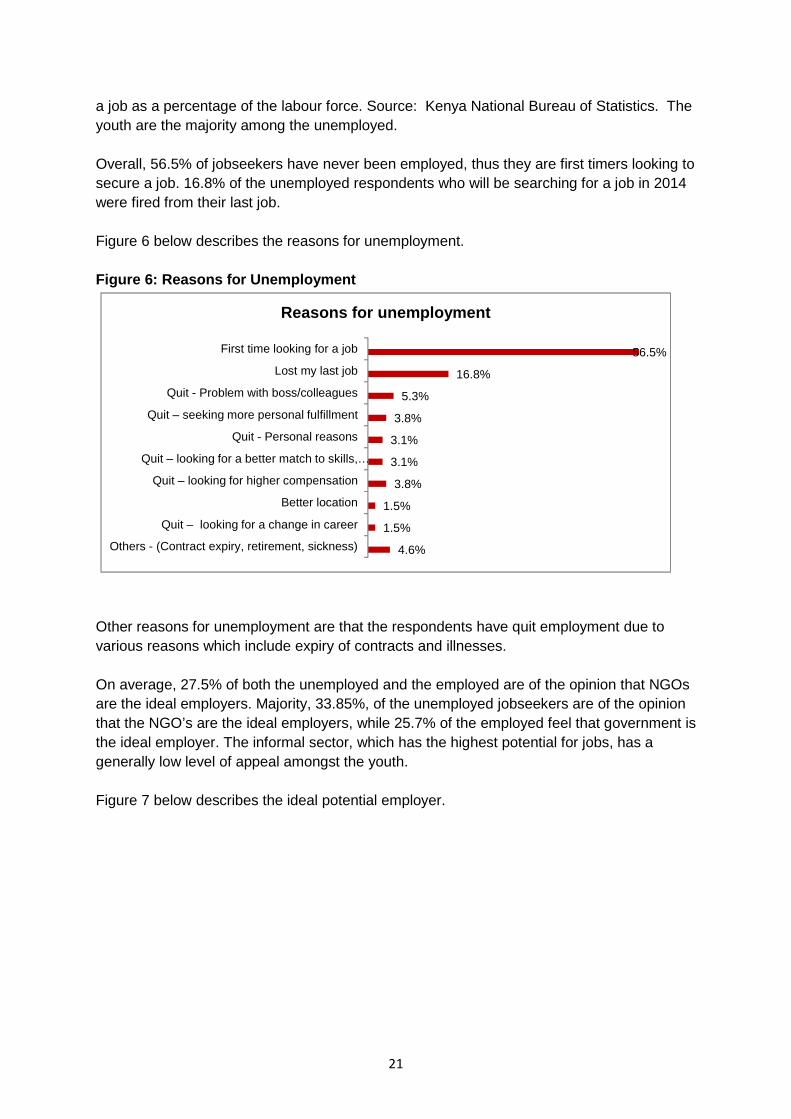
a job as a percentage of the labour force. Source: Kenya National Bureau of Statistics. The youth are the majority among the unemployed. Overall, 56.5% of jobseekers have never been employed, thus they are first timers looking to secure a job. 16.8% of the unemployed respondents who will be searching for a job in 2014 were fired from their last job. Figure 6 below describes the reasons for unemployment. Figure 6: Reasons for Unemployment
4.6%
1.5%
1.5%
3.8%
3.1%
3.1%
3.8%
5.3%
16.8%
56.5%
Others - (Contract expiry, retirement, sickness)
Quit – looking for a change in career
Better location
Quit – looking for higher compensation
Quit – looking for a better match to skills, …
Quit - Personal reasons
Quit – seeking more personal fulfillment
Quit - Problem with boss/colleagues
Lost my last job
First time looking for a job
Reasons for unemployment
Other reasons for unemployment are that the respondents have quit employment due to various reasons which include expiry of contracts and illnesses. On average, 27.5% of both the unemployed and the employed are of the opinion that NGOs are the ideal employers. Majority, 33.85%, of the unemployed jobseekers are of the opinion that the NGO’s are the ideal employers, while 25.7% of the employed feel that government is the ideal employer. The informal sector, which has the highest potential for jobs, has a generally low level of appeal amongst the youth. Figure 7 below describes the ideal potential employer.
22
Figure 7: Ideal Potential Employer
27.9%
23.3%
25.9%
5.6%
5.3%
4.9%
25.7%
33.8%
27.5%
17.1%
12.8%
14.2%
23.4%
24.1%
24.4%
.4%
.8%
3.1%
Employed
Unemployed
Al l
Ideal Potential Employer
Governments Parastatal NGO Private Own personal Business Any
3.1% of jobseekers do not have preference or an ideal potential employer. To them, any employer is an ideal employer. 3.1.4.1. Pull Factors for Job Search The respondents were asked to give some reasons and/or factors that pull them to their ideal employers. 36.1% of the respondents mentioned higher compensation. Other factors include job security (15.9%), a better match to their skills (10.5%), aspirations and more enjoyment of work (6.1%), and career advancement (5.9%). The increased cost of living in Kenya as measured by the rising consumer price index and the associated inflation may be the reason jobseekers are demanding changes in their current jobs in order to earn more. Figure 8 below describes the pull factors to search or change employment. Figure 8: Pull Factors to Employer
.2% 1.0% 1.0% 1.0% 1.5% 1.9% 3.6% 3.8% 4.4% 4.8% 5.9% 6.1%10.5%
15.9%
36.1%
Job Satisfaction
Better Leadership /
supervisor …
Vacation/paid time
off
Involvement in
decision making
Retirement plan
options
Job location
Flexible work
schedule/work …
Better Working
Env/safety
Training
More Respect &
Appreciation
Career
Advancement
Enjoyment of work
Better match of
skills
Job security
Higher Salary +
Bonuses
Pull Factors to search or change employment in 2014
The thirst for higher pay can be attributed to an improvement in the Kenya economy, which has seen the wage levels maintain an average increase of 8%. The general increase in wage levels is also attributable to the 13% increase in the statutory minimum wage rate by the government in 2012. The effect of this is that, either through agitation by staff or from the response from institutions that would want to be seen to be paying competitive rates, the demand for high pay would be highly elastic. It is also notable that the increase in the
23
consumer price index might be a major cause for most employees to look for jobs with higher pay. Between 2008 and 2012, for example, the consumer price index went up from 92.36 to 132.53. (Economic Survey, 2013). More than half of the employed, or 51.2%, feel that the salaries paid today are better than the salaries paid a year ago, 14.2% are neutral about the issue, while 34.6% of the employed are of the opinion that the salaries paid a year ago are better than the salaries paid today. Figure 9 below describes the perceptions on salary paid. Figure 9: Perceptions on Salary
4.7%
1.8%
46.5%
23.9%
14.2%
60.2%
29.1%
13.3%
5.5%
.9%
Employed
unemployed
Perception if Salary paid today is Better than That of an Year Ago
Strongly agree Agree Neutral Disagree Strongly disagree
60.2% of the unemployed are neutral about whether the amount of salaries paid today are better than what was paid a year ago. Only 25.7% feel that the salaries paid today are better than those paid a year ago. 3.1.6 Barriers to Employment 3.1.5.1. Confidence in Finding a New Job Whether currently employed or seeking employment, a solid percentage of 52.4% of jobseekers remain confident about securing a new job in 2014, 42.5% are not confident, while 5.2% are neutral. Figure 10 below describes the jobseekers confidence in securing employment in 2014. Figure 10: Confidence in Securing Employment in 201 4
8.3%
20.7%
12.7%
30.5%
31.1%
29.8%
2.3%
.7%
5.2%
51.9%
38.3%
45.1%
7.1%
8.9%
7.3%
Employed
Not employed
All respondents
Confidence in Securing a Job in 2014
Not confident Somewhat not confident Neutral Somewhat confident Extremely confident
24
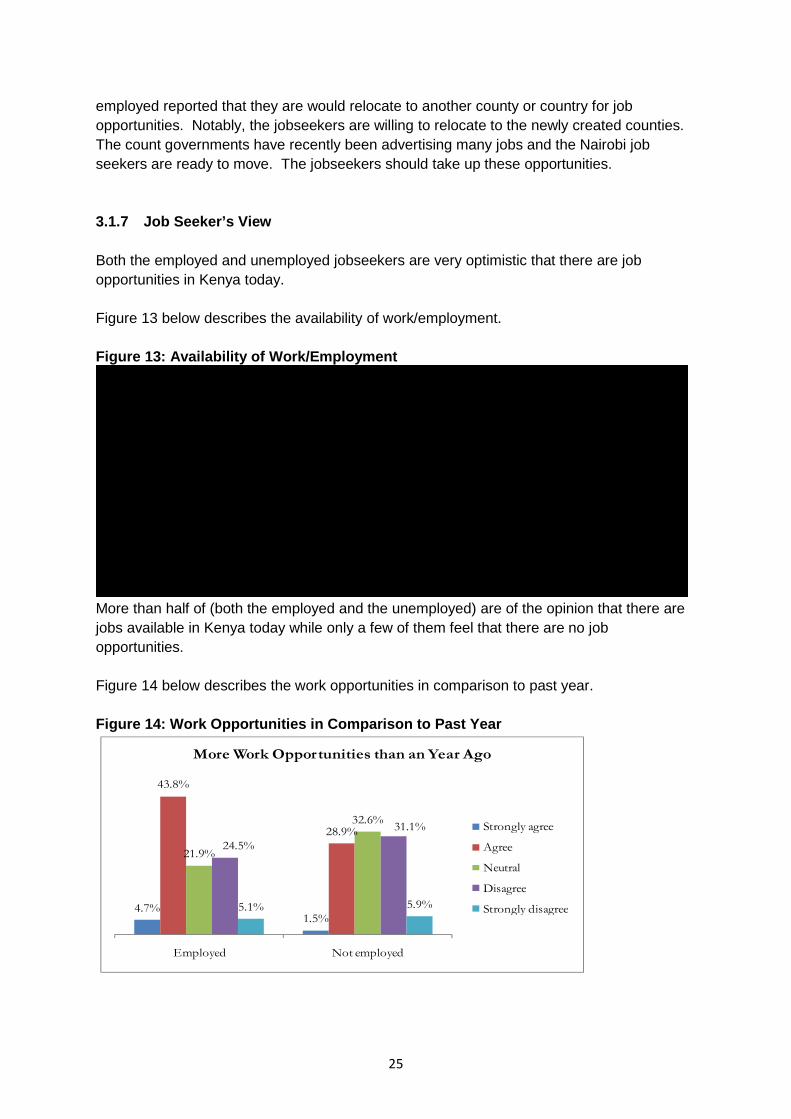
The employed are more confident about securing a job in 2014 than the unemployed. 59% of the employed are confident, while only 47.2% of the unemployed are confident about securing a job in 2014. The employed are more confident that they would receive a call back from a potential employer after applying for a job than the unemployed. Figure 11 below describes the likelihood of a job applicant to get a call back from employer. Figure 11: Likelihood to Get a Call Back from Emplo yer
14.5%
17.0%
14.5%
27.1%
23.0%
25.1%
5.3%
13.3%
12.4%
46.2%
42.2%
42.0%
6.9%
4.4%
6.0%
Employed
unemployed
All
Likelihood to get a Call Back from potential Employ er
Very unlikely Somewhat unlikley Neutral Somewhat likely Very likely
48% of the of the jobseekers are of the opinion that they are likely to get a call back from a potential employer after applying, 39.6% mentioned that they are not likely to get a call back from potential employers and 12.4% do not know if or not a potential employer would give them a call back after they have applied for a job. On average, the jobseekers feel that the employers provide feedback through calling back. The employers will need to increase their feedback mechanisms to the jobseekers. Almost three-quarters of jobseekers, 74%, are willing to relocate to a different country and/or county for job opportunities. Figure 12 below describes the jobseekers willingness to relocate for job opportunity. Figure 12: Willingness to Relocate for Job Opportun ity
72.1%
84.6%
74.1%
27.9%
15.4%
25.9%
employed
Unemployed
Al l
Willingness to Relocate
Yes No
84.6% of the unemployed respondents indicated that they would be willing to relocate to another country and/county in search of job opportunities. Comparatively, 72.1% of the
25
employed reported that they are would relocate to another county or country for job opportunities. Notably, the jobseekers are willing to relocate to the newly created counties. The count governments have recently been advertising many jobs and the Nairobi job seekers are ready to move. The jobseekers should take up these opportunities. 3.1.7 Job Seeker’s View Both the employed and unemployed jobseekers are very optimistic that there are job opportunities in Kenya today. Figure 13 below describes the availability of work/employment. Figure 13: Availability of Work/Employment
3.3%
6.7%
4.1%
27.5%
31.1%
29.8%
2.6%
5.2%
4.1%
64.5%
54.8%
60.1%
2.2%
2.2%
1.8%
Employed
unemployed
All
Perception on Availability of work/Employment
Not available at all Somewhat unavailable Neutral Somewhat available Extremely available
More than half of (both the employed and the unemployed) are of the opinion that there are jobs available in Kenya today while only a few of them feel that there are no job opportunities. Figure 14 below describes the work opportunities in comparison to past year. Figure 14: Work Opportunities in Comparison to Past Year
4.7%1.5%
43.8%
28.9%
21.9%
32.6%
24.5%
31.1%
5.1% 5.9%
Employed Not employed
More Work Opportunities than an Year Ago
Strongly agree
Agree
Neutral
Disagree
Strongly disagree
26
43.8% of the currently employed believe that there are more employment opportunities and job openings now than there were a year ago while majority, 32.6%, of the unemployed are neutral about this issue. 31.1% of the unemployed compared to 24.5% of the employed disagree that there are more job opportunities now than a year ago. This may be attributed to the implementation of devolution government in Kenya. Some of the reasons mentioned for the perceptions on availability of more work opportunities now than an year ago include: job opportunities being advertised daily (21.8%), there are now more employment opportunities due to introduction of the counties (22.3%), corruption has gone down (20.7%). Some of the responses mentioned for the perceptions on unavailability of work now than a year ago include higher qualifications and skills requirements as well as stiffer competition, lack of capital to set up businesses etc. Table 3 below presents the reasons given for perceptions on availability of work/employment. Table 3: Perceptions on Availability of Work and Un availability of Work
Reasons for Availability % Reasons for Unavailability % Job opportunities are advertised on a daily basis
21.8 High qualification and skills requirements
9.6
More employment opportunities due to counties
22.3 Depends on type of profession 3.5
Corruption levels have declined 20.7 Youth lack capital for self-employment
2.3
More self-employment in farming and agribusiness by youth
12.4 Limiting job search skills 2.8
Already acquired working skills 2.3 Stiff competition 1.0
Early retrenchment 0.8 Few retirements 0.5
The employed are more satisfied with their job search efforts than the unemployed. Majority, 71.2%, of the employed respondents mentioned that they are satisfied with job searching. Only 28.8% of the employed mentioned that they are dissatisfied with their job search. More jobseekers, both the new labour market entrants and those out of employment through the various labour separation mechanisms, may have ordinarily remained out of employment for a longer period, hence swelling the ranks of the discouraged job seekers. 41.9% of the unemployed jobseekers mentioned that they are dissatisfied with their job search, 4.7% are very dissatisfied, 38.8% are fairly satisfied and 14.8% are satisfied. Figure 15 below describes the satisfaction levels with job search.
27
Figure 15: Satisfaction with Job Search
3.6%
4.7%
25.2%
41.9%
42.3%
38.8%
25.7%
14.0%
3.2%
.8%
Employed
Unemployed
Satisfaction with Job Search
Very unsatisfied Not satisfied Fairly satisfied Satisfied Very satisfied
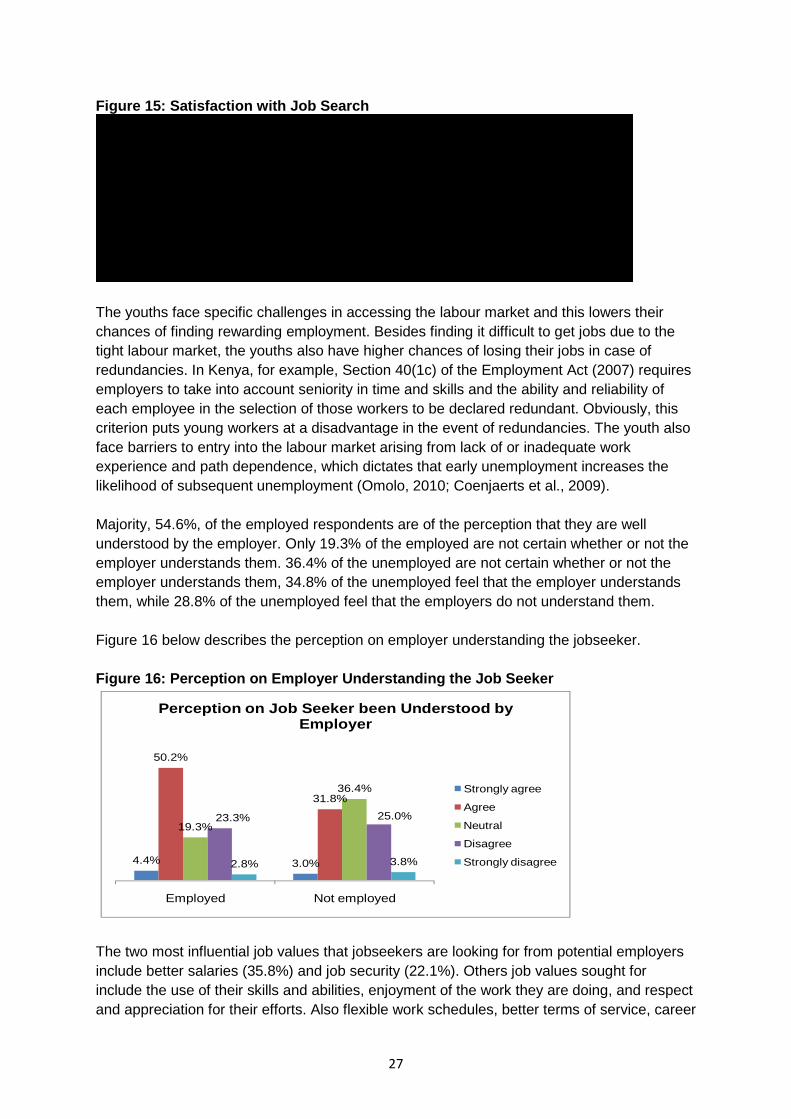
The youths face specific challenges in accessing the labour market and this lowers their chances of finding rewarding employment. Besides finding it difficult to get jobs due to the tight labour market, the youths also have higher chances of losing their jobs in case of redundancies. In Kenya, for example, Section 40(1c) of the Employment Act (2007) requires employers to take into account seniority in time and skills and the ability and reliability of each employee in the selection of those workers to be declared redundant. Obviously, this criterion puts young workers at a disadvantage in the event of redundancies. The youth also face barriers to entry into the labour market arising from lack of or inadequate work experience and path dependence, which dictates that early unemployment increases the likelihood of subsequent unemployment (Omolo, 2010; Coenjaerts et al., 2009). Majority, 54.6%, of the employed respondents are of the perception that they are well understood by the employer. Only 19.3% of the employed are not certain whether or not the employer understands them. 36.4% of the unemployed are not certain whether or not the employer understands them, 34.8% of the unemployed feel that the employer understands them, while 28.8% of the unemployed feel that the employers do not understand them. Figure 16 below describes the perception on employer understanding the jobseeker. Figure 16: Perception on Employer Understanding the Job Seeker
4.4% 3.0%
50.2%
31.8%
19.3%
36.4%
23.3% 25.0%
2.8% 3.8%
Employed Not employed
Perception on Job Seeker been Understood by Employer
Strongly agree
Agree
Neutral
Disagree
Strongly disagree
The two most influential job values that jobseekers are looking for from potential employers include better salaries (35.8%) and job security (22.1%). Others job values sought for include the use of their skills and abilities, enjoyment of the work they are doing, and respect and appreciation for their efforts. Also flexible work schedules, better terms of service, career
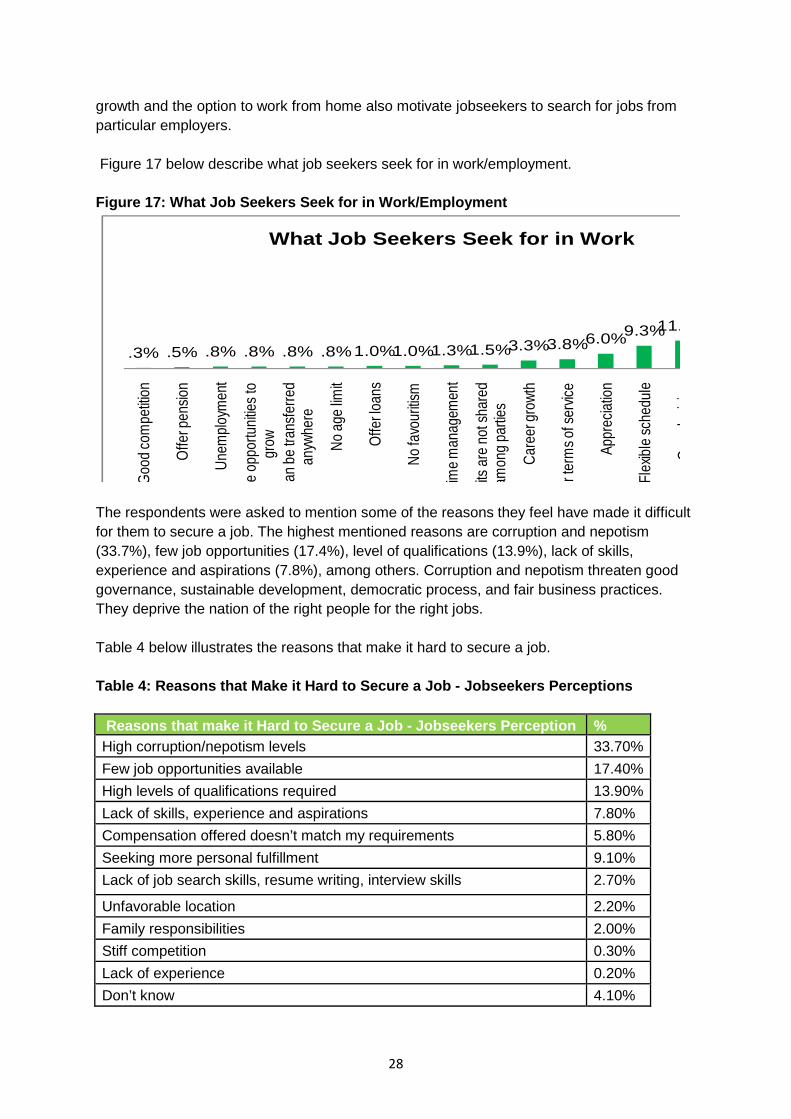
28
growth and the option to work from home also motivate jobseekers to search for jobs from particular employers. Figure 17 below describe what job seekers seek for in work/employment. Figure 17: What Job Seekers Seek for in Work/Employ ment
.3% .5% .8% .8% .8% .8%1.0%1.0%1.3%1.5%3.3%3.8%6.0%9.3%11.
Goo
d co
mpe
titio
n
Offe
r pen
sion
Une
mpl
oym
ent
Hav
e op
portu
nitie
s to
gr
owC
an b
e tra
nsfe
rred
anyw
here
No
age
limit
Offe
r loa
ns
No
favo
uritis
m
Tim
e m
anag
emen
t
Prof
its a
re n
ot s
hare
d am
ong
parti
es
Car
eer g
row
th
Bette
r ter
ms
of s
ervic
e
Appr
ecia
tion
Flex
ible
sch
edul
e
Ow
n de
cisio
n
What Job Seekers Seek for in Work
The respondents were asked to mention some of the reasons they feel have made it difficult for them to secure a job. The highest mentioned reasons are corruption and nepotism (33.7%), few job opportunities (17.4%), level of qualifications (13.9%), lack of skills, experience and aspirations (7.8%), among others. Corruption and nepotism threaten good governance, sustainable development, democratic process, and fair business practices. They deprive the nation of the right people for the right jobs. Table 4 below illustrates the reasons that make it hard to secure a job. Table 4: Reasons that Make it Hard to Secure a Job - Jobseekers Perceptions Reasons that make it Hard to Secure a Job - Jobsee kers Perception % High corruption/nepotism levels 33.70%
Few job opportunities available 17.40%
High levels of qualifications required 13.90%
Lack of skills, experience and aspirations 7.80%
Compensation offered doesn’t match my requirements 5.80%
Seeking more personal fulfillment 9.10%
Lack of job search skills, resume writing, interview skills 2.70%
Unfavorable location 2.20%
Family responsibilities 2.00%
Stiff competition 0.30%
Lack of experience 0.20%
Don’t know 4.10%
29
Reasons that make it Hard to Secure a Job - Jobsee kers Perception % Other 0.80%
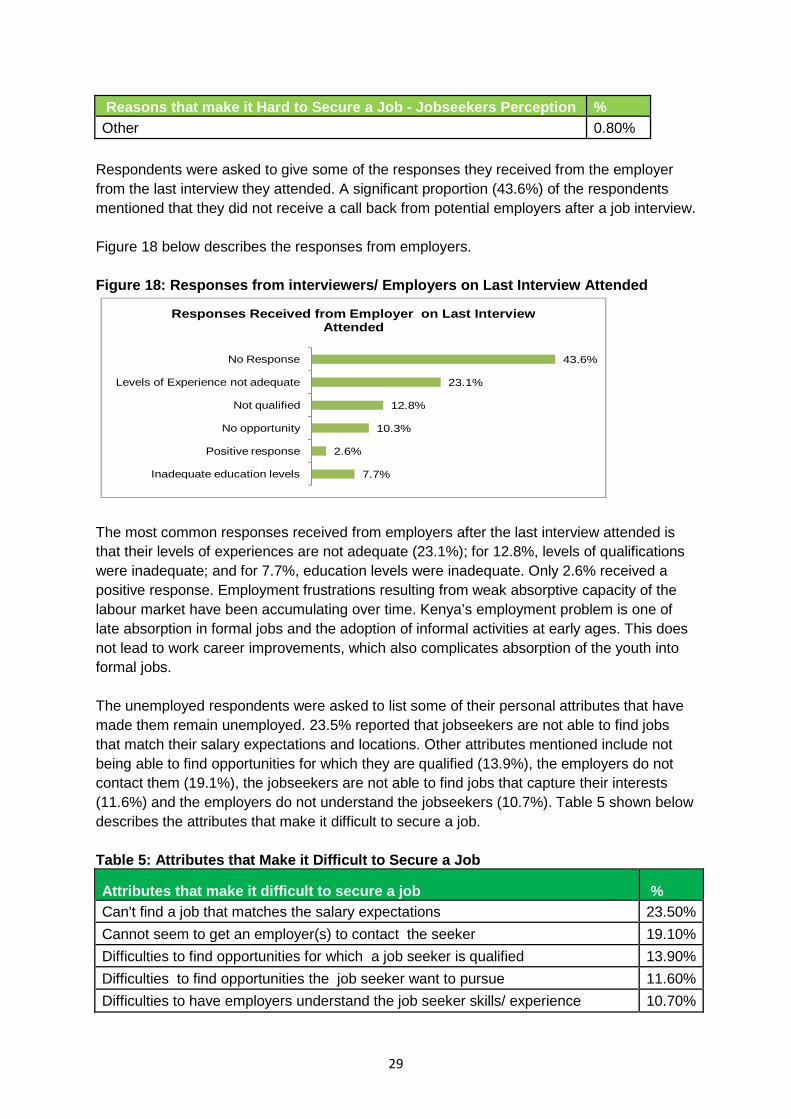
Respondents were asked to give some of the responses they received from the employer from the last interview they attended. A significant proportion (43.6%) of the respondents mentioned that they did not receive a call back from potential employers after a job interview. Figure 18 below describes the responses from employers. Figure 18: Responses from interviewers/ Employers o n Last Interview Attended
7.7%
2.6%
10.3%
12.8%
23.1%
43.6%
Inadequate education levels
Positive response
No opportunity
Not qualified
Levels of Experience not adequate
No Response
Responses Received from Employer on Last Interview Attended
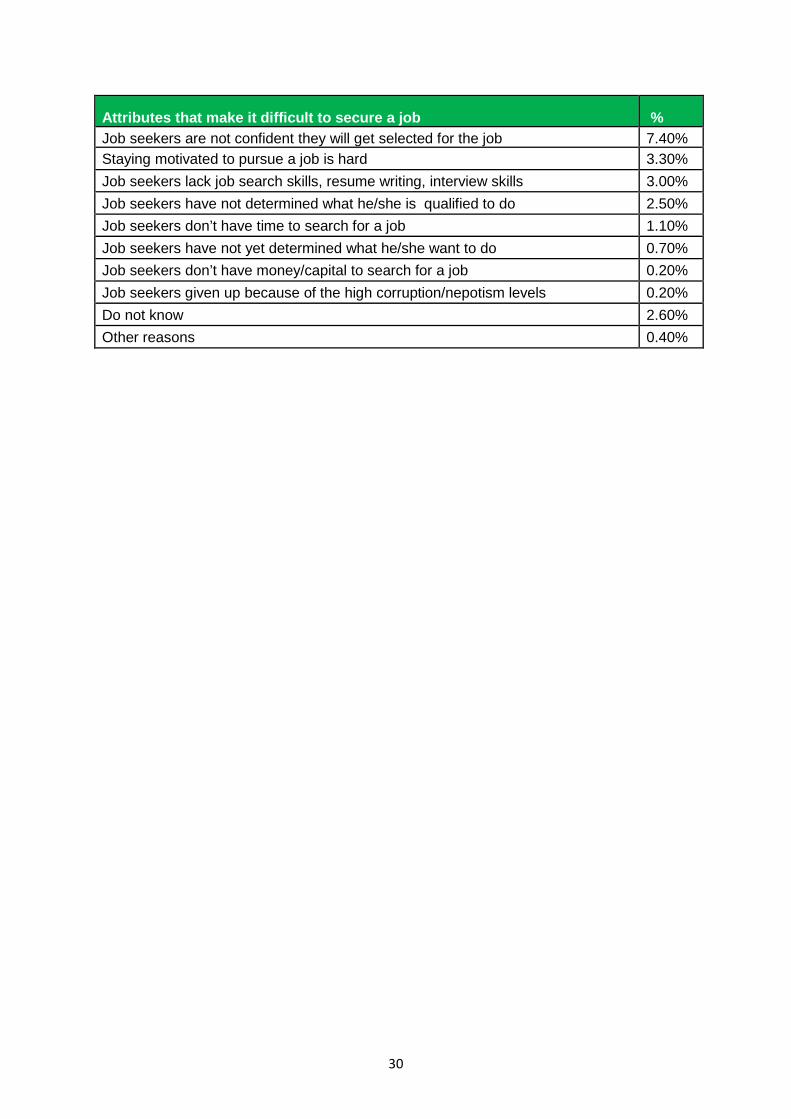
The most common responses received from employers after the last interview attended is that their levels of experiences are not adequate (23.1%); for 12.8%, levels of qualifications were inadequate; and for 7.7%, education levels were inadequate. Only 2.6% received a positive response. Employment frustrations resulting from weak absorptive capacity of the labour market have been accumulating over time. Kenya’s employment problem is one of late absorption in formal jobs and the adoption of informal activities at early ages. This does not lead to work career improvements, which also complicates absorption of the youth into formal jobs. The unemployed respondents were asked to list some of their personal attributes that have made them remain unemployed. 23.5% reported that jobseekers are not able to find jobs that match their salary expectations and locations. Other attributes mentioned include not being able to find opportunities for which they are qualified (13.9%), the employers do not contact them (19.1%), the jobseekers are not able to find jobs that capture their interests (11.6%) and the employers do not understand the jobseekers (10.7%). Table 5 shown below describes the attributes that make it difficult to secure a job. Table 5: Attributes that Make it Difficult to Secur e a Job
Attributes that make it difficult to secure a job % Can't find a job that matches the salary expectations 23.50%
Cannot seem to get an employer(s) to contact the seeker 19.10%
Difficulties to find opportunities for which a job seeker is qualified 13.90%
Difficulties to find opportunities the job seeker want to pursue 11.60%
Difficulties to have employers understand the job seeker skills/ experience 10.70%
30
Attributes that make it difficult to secure a job % Job seekers are not confident they will get selected for the job 7.40% Staying motivated to pursue a job is hard 3.30%
Job seekers lack job search skills, resume writing, interview skills 3.00%
Job seekers have not determined what he/she is qualified to do 2.50%
Job seekers don’t have time to search for a job 1.10%
Job seekers have not yet determined what he/she want to do 0.70%
Job seekers don’t have money/capital to search for a job 0.20%
Job seekers given up because of the high corruption/nepotism levels 0.20%
Do not know 2.60%
Other reasons 0.40%
31
4. CONCLUSIONS AND RECOMMENDATIONS
4.1 Conclusions The following are conclusions from the jobseekers’ survey: • Search for Jobs The employed and unemployed jobseekers will be actively searching for jobs in the year 2014, a majority of them looking for higher pay and job security. • Difficulties on securing jobs Attributes mentioned by unemployed jobseekers on why it is difficult to secure a job include: they are not able to find a job that matches their salary expectation and location; they are not able to find opportunities for which they are qualified for; the employers do not contact them; jobseekers are not able to find a job that captures their interests and the employers do not understand the jobseekers. Corruption and nepotism are the highest ranked barriers to getting a job. • Employment job values The most influential job values that jobseekers are looking for from potential employers include better salaries and job security. It’s been noted that the informal sector jobs are precarious in nature. They are characterised by job insecurity, poor wages and terms and conditions of employment, absence of institutionalised social protection mechanisms, weak safety and health standards and low job tenure. • Job outlook The currently employed are of the opinion that there are more jobs/employment opportunities and job openings now than there were a year ago. The employed are more confident about securing new jobs in 2014 than the unemployed. Devolution has helped change preference of urban/rural migration in Kenya. The county government has created employment opportunities in the rural areas unlike in the past where jobs were mostly available in the major cities/towns. • Feedback from employers Also the employed are more confident that they would receive a call back from a potential employer after applying for a job than the unemployed. As expected, the unemployed disagree that there are more job opportunities now than there were a year ago. This shows that the employed are more positive with the job market in Kenya than the unemployed. The currently unemployed lack confidence in the job market and this may be affecting their job search. • Satisfaction levels for those employed Results of the survey show that the employed Nairobi residents are actively searching for jobs with more pay and job security. More than half of the employed feel that salaries paid today are better than the salaries paid a year ago.
32
The majority of the unemployed see NGOs as the ideal employers. The results of the survey show that the unemployed respondents are not able to find jobs that match their salary requirements and locations. They are also not able to find opportunities which they are qualified for. The unemployed have a perception that the NGOs offer better pay and incentives for work. • Satisfaction levels for those employed Overall, the parastatal/Government employees (89.3%) are most satisfied with their employment, followed by the NGO employees (79.2%), self-employed (65.8%) and, lastly, the private employees (54.8%). The relatively low and declining proportion of wage and salaried workers in Kenya signifies low levels of economic development. The high proportion of the self-employed signifies existence of work deficit in the country. The self-employed and the unpaid family workers have a lower likelihood of having formal work arrangements, and are more likely to lack elements associated with decent employment such as adequate social security and social protection and a voice at work. Generally, informal sector employment in Kenya is known to be precarious in nature with manifestations of low pay, job insecurity, poor safety and health standards and absence of worker rights and representation, among others. The growing proportion of the self-employed combined with the low but important size of the unpaid family workers means that Kenya is generating an increasing amount of vulnerable employment. • Satisfaction levels for job search The employed are more satisfied with their job search endeavours than the unemployed persons. Staying out of employment for long is especially worrying for the jobseeker. This situation may make the jobseeker get trapped into a lifetime of weak attachment to the labour market, alternating between low paid insecure work and open unemployment with considerable socio-economic and political implications to the country. • Perception on understanding by employers The employed feel they are well understood by the employers. The unemployed, however, are not certain whether or not the employers understand them. More jobseekers, both the new labour market entrants and those out of employment through the various labour separation mechanisms, ordinarily remained out of employment for a longer period hence swelling the ranks of the discouraged job seekers. • Occupation outlook - Relocation To gain employment, almost three quarters of jobseekers are willing to relocate to a different country and/or county for a job opportunity. The unemployed are even more willing to relocate to another country and/county for a job opportunity than the employed. -Type of employment The majority Nairobi residents are in contract jobs. They are also mostly employed in the private sector. Most employers in Kenya, including the public sector have resorted to the increased use of casual, temporary, part-time, contract, sub-contracted and outsourced
33
workforces to ostensibly reduce labour costs, achieve more flexibility in management and exert greater levels of control over labour. The results of the survey show that the employed perceive the government as the ideal employer. Overall, the casual relationships between employers and workers have impaired labour relations, eroded worker protection and transferred additional responsibilities, such as social and trade union protection, job security, and wage negotiations to the worker. • Lack of feedback from employers A significant proportion (43.6%) of the jobseekers mentioned that they did not receive a call back from the employer after their last job interview. Employment frustrations resulting from weak absorptive capacity of the labour market have been accumulating over time. Kenya’s employment problem is one of late absorption in formal jobs and the adoption of informal activities at early ages. This does not lead to work career improvements, which also complicates absorption of the job seekers into formal jobs. • Inadequate experience The most disheartening responses unemployed job seekers mentioned they have received from potential employers after a job interview are that their experiences were not adequate and that they were not qualified. The youth face barriers to entry into the labour market arising from lack of or inadequate work experience, and path dependence, which dictates that early unemployment increases the likelihood of subsequent unemployment. The most common responses unemployed job seekers receive from employers after an interview is that they will call back, their experiences are not adequate and that they are not qualified. The unemployed need to improve their skills and qualifications if they are to attract the levels of compensation they seek. Recommendations The following are the recommendations towards the unemployment reduction in Kenya: • Nature of employment There is need for the government to develop a job creation strategy to move more Kenyans into better wage jobs. The policy makers, especially at local levels, should embrace informal household enterprises as legitimate parts of the Kenyan economy to enable they contribute to increased productivity. • Establish care guidance centers Majority of the job seekers lack appropriate skills. This limits their participation in the labour market. To address the problem of lack appropriate skills within the labour market, the business community needs to be closely engaged with educational and training institutions. Setting up career advisory services and making them accessible to jobseekers looking for information and guidance could help. This should be both online and phone in. School-Industry linkage programmes that aid students in appreciating the relevance of learned theories in the world of work should be established. Also, internship placements in businesses/industries during colleges and school holidays to facilitate sensitisation on the skills needed in the labour market should be encouraged.
34
The majority of the unemployed see the NGOs as ideal employers because they desire higher salaries/compensation than they are qualified for. The unemployed need to improve their skills and qualifications if they are to attract the levels of compensation. Education institutions should provide more practical training to enable their graduates acquire better skills as they prepare them to enter the job market. • Career advancement Employers should provide more opportunities for career advancement to their employees. The employers should organise awareness creation on the job market situation, opportunities available, challenges the jobseekers face and job matching with the potential employees. • Internships and volunteerism Skills mismatch is a key antecedent to youth employment in Kenya. Promoting the exchange of information, knowledge and human resources between the employing institutions and the jobseekers could help bridge skills deficits. This can be addressed through creating linkages between training institutions and the private sector through research, internship and volunteership opportunities and encouraging the private sector to get involved in technical education and training. Care should, however, be taken not to make internships and volunteerships avenues of cheap labour. • Better incentives and job security The employers should consider providing better incentives and more job security to their employees to retain them. The majority of the unemployed see the NGOs as the ideal employers because they desire higher salaries/compensation than they are qualified for. Most of in the unemployed group need to improve their skills and qualifications if they are to attract the levels of compensation they desire. The employed are searching for more pay rather than job security. Job security is the probability that an individual will keep his or her job. A job with a high level of job security is such that a person with the job would have a slim chance of being rendered jobless. The employers should consider providing better salary incentives to retain the best staff. There is need for employers to consider the level of adequate remuneration as a step towards retaining the employees who are looking for jobs with better pay. • Back ground checks As noted, a good number of job applicants were fired from their jobs. Therefore, it would be prudent for employers to carry out background checks on potential employees to find out reasons for leaving the previous jobs. • Improve unemployed thinking The unemployed are more doubtful of their job seeking abilities, activities and their qualifications unlike the employed jobseekers who are more confident with their job search endeavours. There is need for the unemployed to be more positive about their job search. The negativity could be limiting their job search. There are opportunities for carrying out training for unemployed job applicants. • Job seekers improve skills
35
The employed are more satisfied with their job search endeavours than the unemployed. There is need for the unemployed to be positive about their job search, as the negativity could be limiting their job search. Both the employed and the unemployed should seek ways of improving their skills to increase their possibilities of landing jobs. The jobseekers should have more commitment on job searching endeavours. Employed persons are more positive with the job market in Kenya than the unemployed. The currently unemployed, somewhat lack confidence in the job market today. This may be affecting their job search. There is an opportunity for providing career training to the job seekers and imparting in them knowledge and skills leading to job motivation. The employers should provide feedback to jobseekers as a channel of communication on the job application and interview outcomes. The jobseekers who are unemployed should be patient in their job searches. In attempts to create more job openings for the youth, there is need to reduce corruption; the public and private sector to create more job opportunities through the creation of job creation policies and employers should encourage early retirement. Upgrading skills, making schools work for all Kenyans and tackling corruption are some of the ways to speed up job creation. • More employment opportunities through the devolved government To gain employment, almost three-quarters of job seekers are willing to relocate to a different country and/or county. The unemployed are even more willing to relocate than the employed. The jobseekers perceive that currently, there are more employment opportunities due to the devolved government and creation of 47 counties in Kenya. Employers working in different counties other than in Nairobi have a pool of jobseekers they can draw from Nairobi County.
36
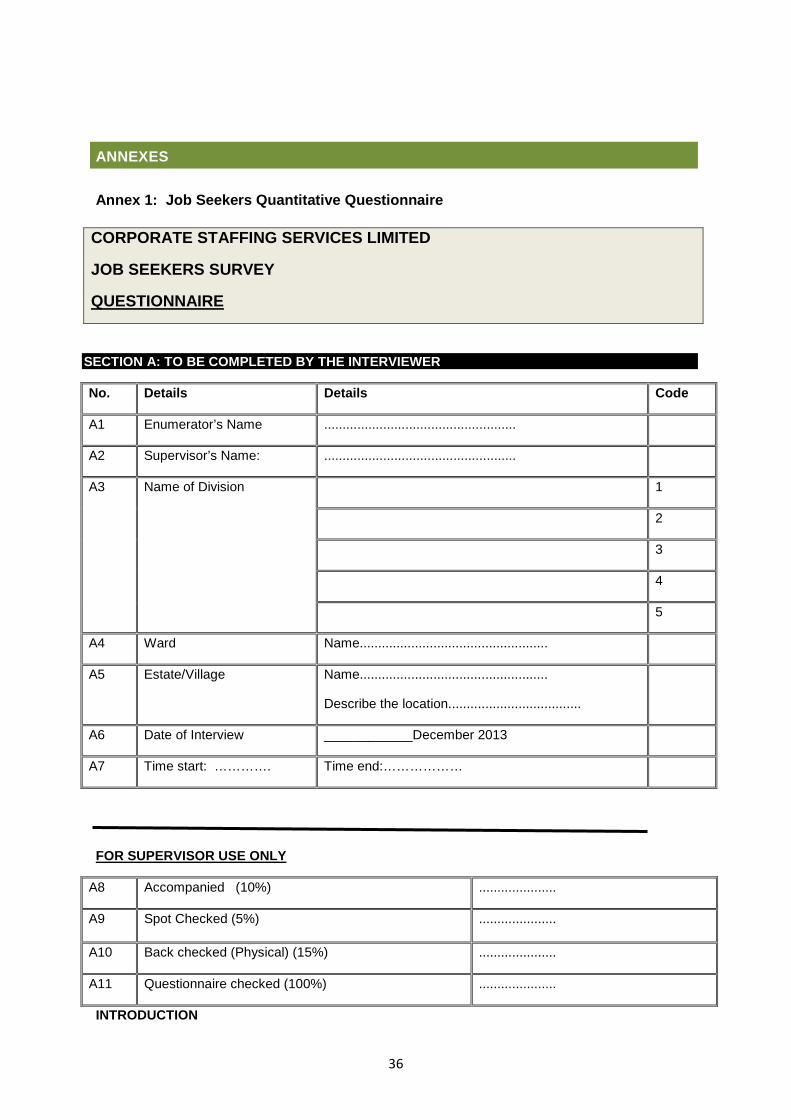
ANNEXES
Annex 1: Job Seekers Quantitative Questionnaire
CORPORATE STAFFING SERVICES LIMITED
JOB SEEKERS SURVEY
QUESTIONNAIRE
SECTION A: TO BE COMPLETED BY THE INTERVIEWER
No. Details Details Code
A1 Enumerator’s Name ....................................................
A2 Supervisor’s Name: ....................................................
A3 Name of Division 1
2
3
4
5
A4 Ward Name...................................................
A5 Estate/Village Name...................................................
Describe the location....................................
A6 Date of Interview ____________December 2013
A7 Time start: …………. Time end:………………
FOR SUPERVISOR USE ONLY
A8 Accompanied (10%) .....................
A9 Spot Checked (5%) .....................
A10 Back checked (Physical) (15%) .....................
A11 Questionnaire checked (100%) .....................
INTRODUCTION
37
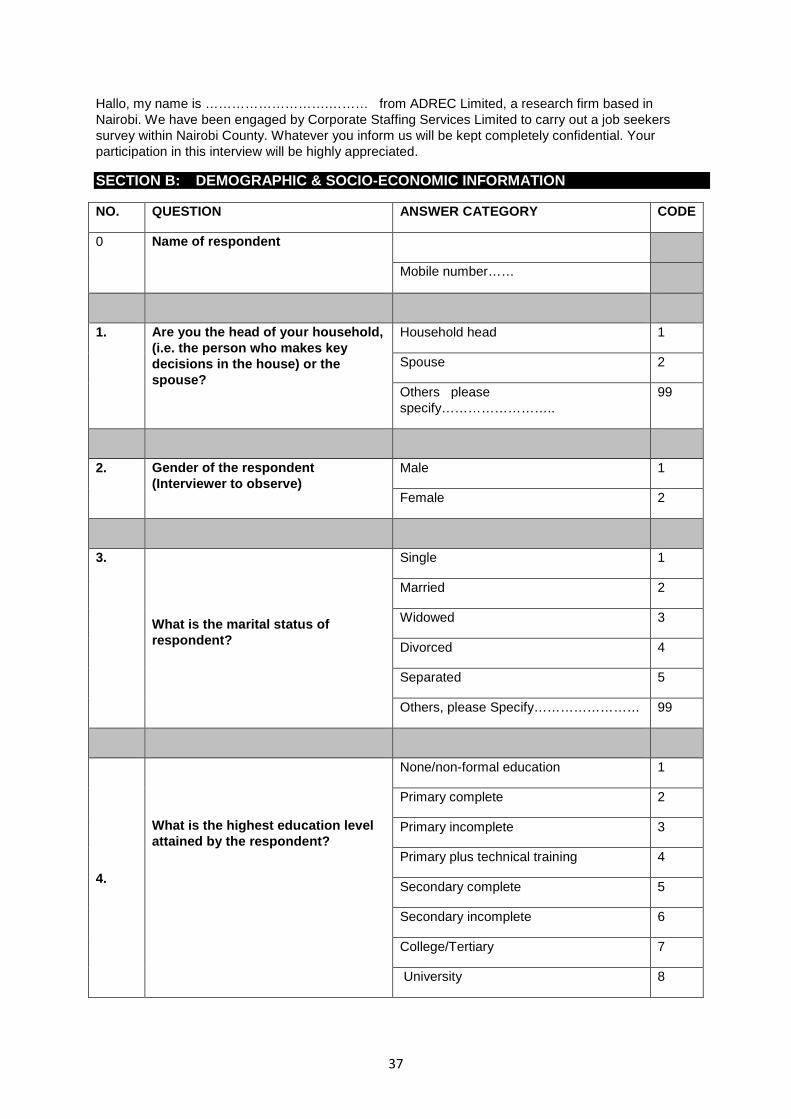
Hallo, my name is ……………………….……… from ADREC Limited, a research firm based in Nairobi. We have been engaged by Corporate Staffing Services Limited to carry out a job seekers survey within Nairobi County. Whatever you inform us will be kept completely confidential. Your participation in this interview will be highly appreciated.
SECTION B: DEMOGRAPHIC & SOCIO-ECONOMIC INFORMATIO N
NO. QUESTION ANSWER CATEGORY CODE
0 Name of respondent
Mobile number……
1. Are you the head of your household, (i.e. the person who makes key decisions in the house) or the spouse?
Household head 1
Spouse 2
Others please specify……………………..
99
2. Gender of the respondent (Interviewer to observe)
Male 1
Female 2
3.
What is the marital status of respondent?
Single 1
Married 2
Widowed 3
Divorced 4
Separated 5
Others, please Specify…………………… 99
4.
What is the highest education level attained by the respondent?
None/non-formal education 1
Primary complete 2
Primary incomplete 3
Primary plus technical training 4
Secondary complete 5
Secondary incomplete 6
College/Tertiary 7
University 8
38
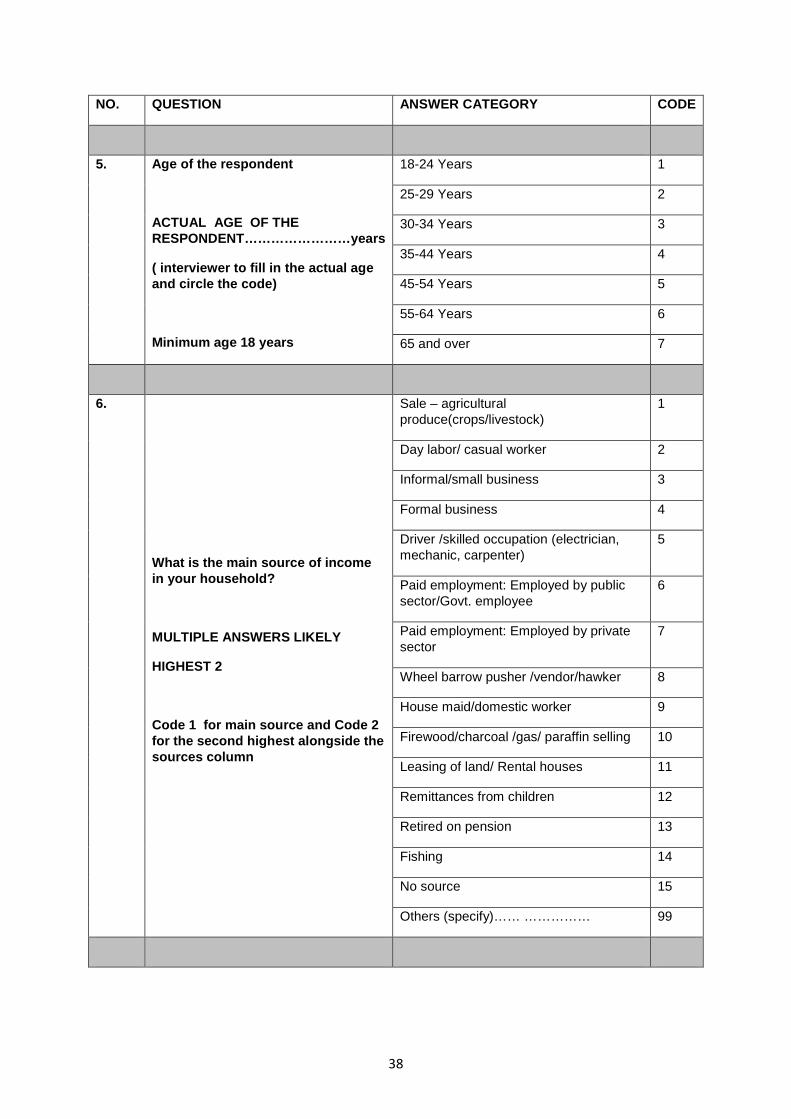
NO. QUESTION ANSWER CATEGORY CODE
5.
Age of the respondent
ACTUAL AGE OF THE RESPONDENT……………………years
( interviewer to fill in the actual age and circle the code)
Minimum age 18 years
18-24 Years 1
25-29 Years 2
30-34 Years 3
35-44 Years 4
45-54 Years 5
55-64 Years 6
65 and over 7
6.
What is the main source of income in your household?
MULTIPLE ANSWERS LIKELY
HIGHEST 2
Code 1 for main source and Code 2 for the second highest alongside the sources column
Sale – agricultural produce(crops/livestock)
1
Day labor/ casual worker 2
Informal/small business 3
Formal business 4
Driver /skilled occupation (electrician, mechanic, carpenter)
5
Paid employment: Employed by public sector/Govt. employee
6
Paid employment: Employed by private sector
7
Wheel barrow pusher /vendor/hawker 8
House maid/domestic worker 9
Firewood/charcoal /gas/ paraffin selling 10
Leasing of land/ Rental houses 11
Remittances from children 12
Retired on pension 13
Fishing 14
No source 15
Others (specify)…… …………… 99
39
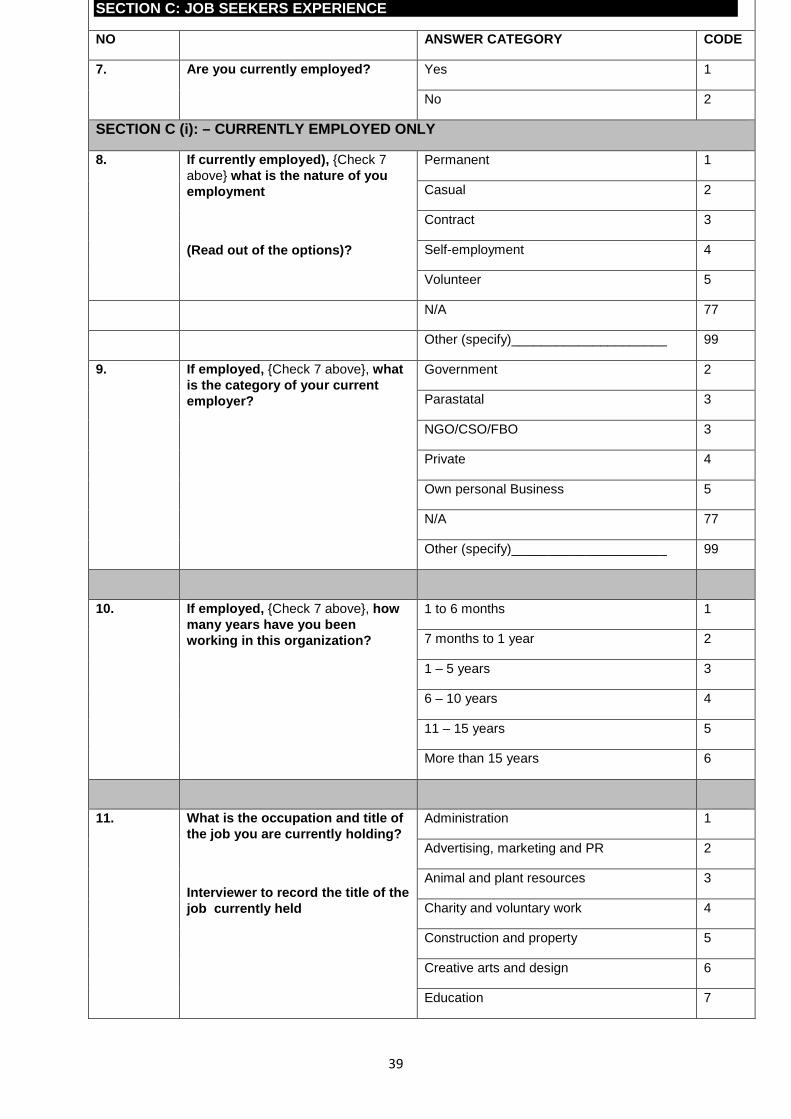
SECTION C: JOB SEEKERS EX PERIENCE
NO ANSWER CATEGORY CODE
7. Are you currently employed?
Yes 1
No 2
SECTION C (i): – CURRENTLY EMPLOYED ONLY
8. If currently employed), {Check 7 above} what is the nature of you employment
(Read out of the options)?
Permanent 1
Casual 2
Contract 3
Self-employment 4
Volunteer 5
N/A 77
Other (specify)_____________________ 99
9. If employed, {Check 7 above}, what is the category of your current employer?
Government 2
Parastatal 3
NGO/CSO/FBO 3
Private 4
Own personal Business 5
N/A 77
Other (specify)_____________________ 99
10. If employed, {Check 7 above}, how many years have you been working in this organization?
1 to 6 months 1
7 months to 1 year 2
1 – 5 years 3
6 – 10 years 4
11 – 15 years 5
More than 15 years 6
11. What is the occupation and title of the job you are currently holding?
Interviewer to record the title of the job currently held
Administration 1
Advertising, marketing and PR 2
Animal and plant resources 3
Charity and voluntary work 4
Construction and property 5
Creative arts and design 6
Education 7
40
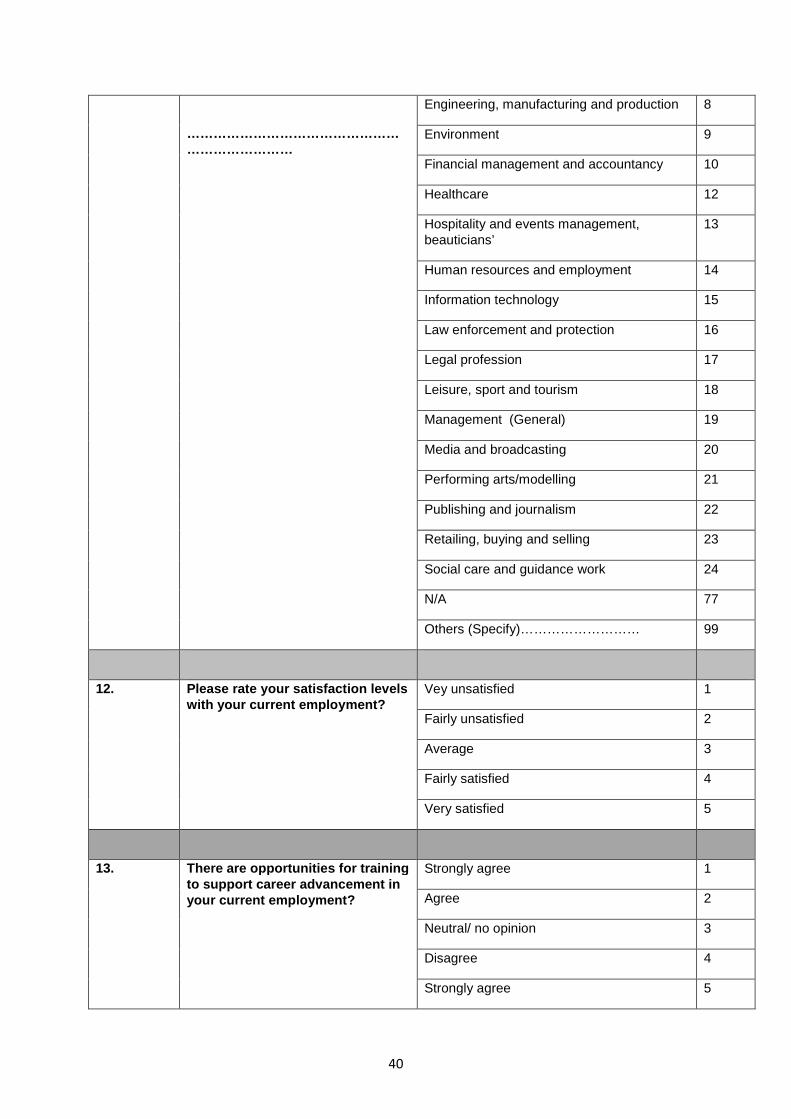
………………………………………………………………
Engineering, manufacturing and production 8
Environment 9
Financial management and accountancy 10
Healthcare 12
Hospitality and events management, beauticians’
13
Human resources and employment 14
Information technology 15
Law enforcement and protection 16
Legal profession 17
Leisure, sport and tourism 18
Management (General) 19
Media and broadcasting 20
Performing arts/modelling 21
Publishing and journalism 22
Retailing, buying and selling 23
Social care and guidance work 24
N/A 77
Others (Specify)……………………… 99
12. Please rate your satisfaction levels with your current employment?
Vey unsatisfied 1
Fairly unsatisfied 2
Average 3
Fairly satisfied 4
Very satisfied 5
13. There are opportunities for training to support career advancement in your current employment?
Strongly agree 1
Agree 2
Neutral/ no opinion 3
Disagree 4
Strongly agree 5
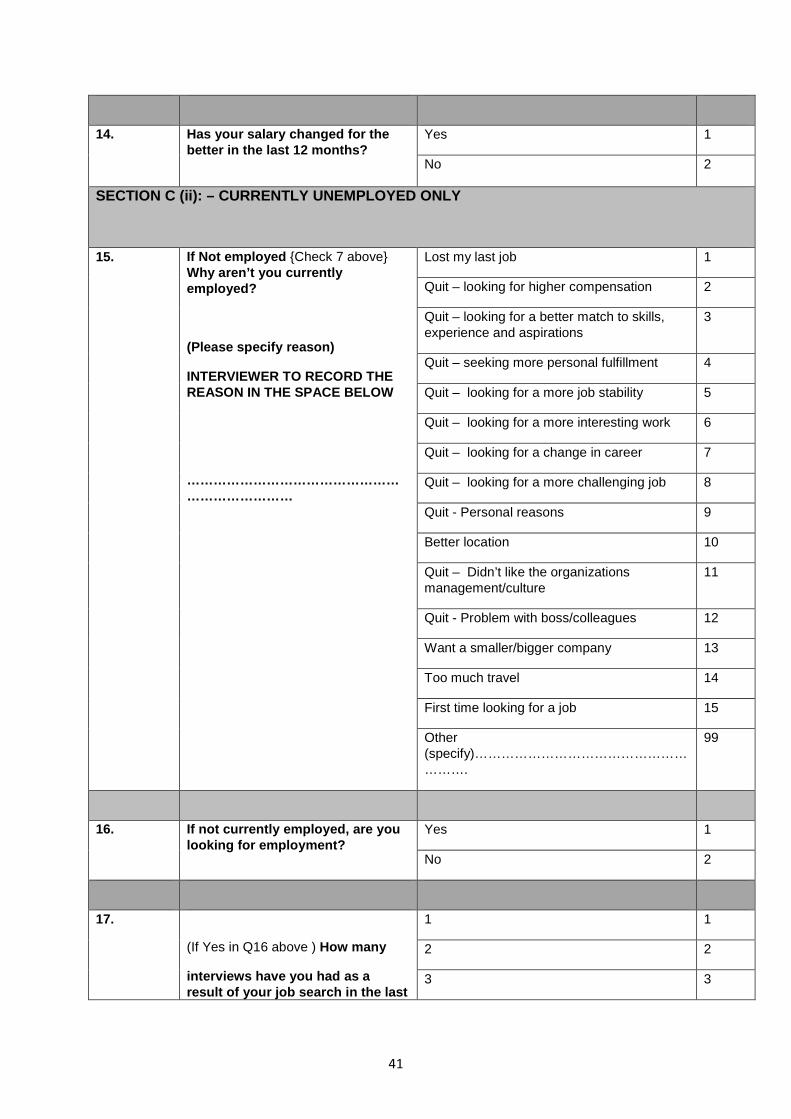
41
14. Has your salary changed for the better in the last 12 months?
Yes 1
No 2
SECTION C (ii): – CURRENTLY UNEMPLOYED ONLY
15. If Not employed {Check 7 above} Why aren’t you currently employed?
(Please specify reason)
INTERVIEWER TO RECORD THE REASON IN THE SPACE BELOW
………………………………………………………………
Lost my last job 1
Quit – looking for higher compensation 2
Quit – looking for a better match to skills, experience and aspirations
3
Quit – seeking more personal fulfillment 4
Quit – looking for a more job stability 5
Quit – looking for a more interesting work 6
Quit – looking for a change in career 7
Quit – looking for a more challenging job 8
Quit - Personal reasons 9
Better location 10
Quit – Didn’t like the organizations management/culture
11
Quit - Problem with boss/colleagues 12
Want a smaller/bigger company 13
Too much travel 14
First time looking for a job 15
Other (specify)………………………………………………….
99
16. If not currently employed, are you looking for employment?
Yes 1
No 2
17.
(If Yes in Q16 above ) How many
interviews have you had as a result of your job search in the last
1 1
2 2
3 3
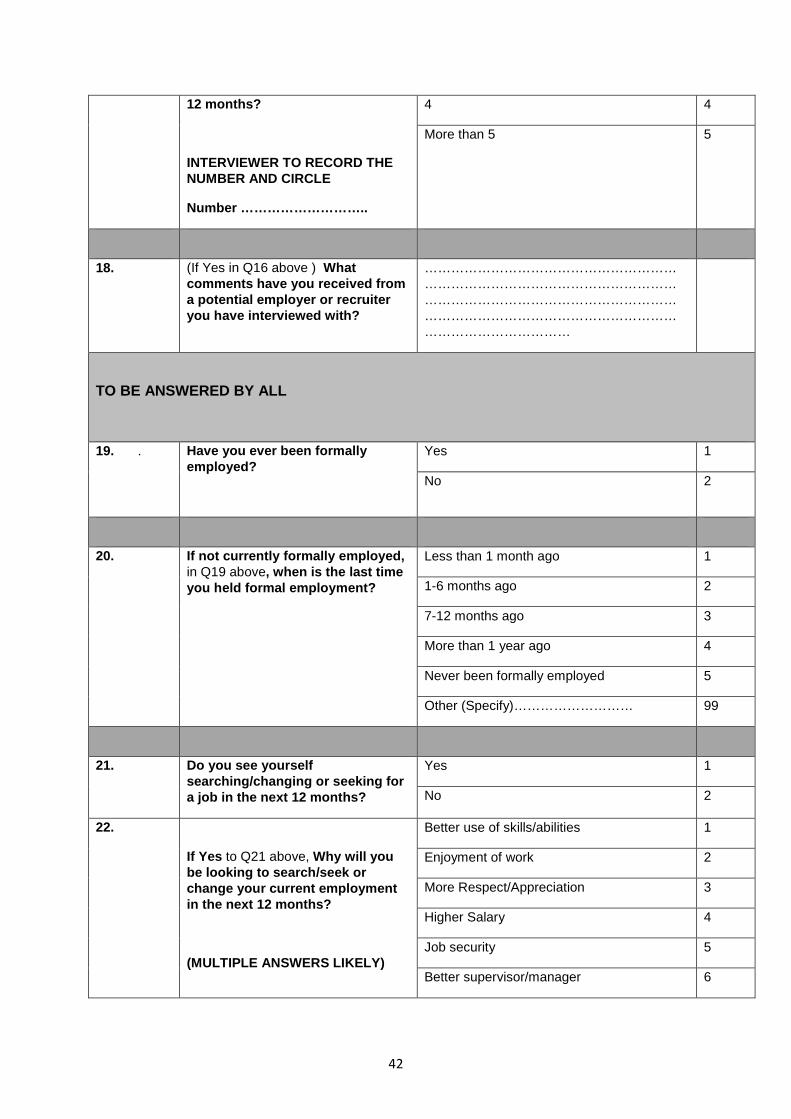
42
12 months?
INTERVIEWER TO RECORD THE NUMBER AND CIRCLE
Number ………………………..
4 4
More than 5 5
18. (If Yes in Q16 above ) What comments have you received from a potential employer or recruiter you have interviewed with?
………………………………………………………………………………………………………………………………………………………………………………………………………………………………………
TO BE ANSWERED BY ALL
19. . Have you ever been formally employed?
Yes 1
No 2
20. If not currently formally employed, in Q19 above, when is the last time you held formal employment?
Less than 1 month ago 1
1-6 months ago 2
7-12 months ago 3
More than 1 year ago 4
Never been formally employed 5
Other (Specify)……………………… 99
21. Do you see yourself searching/changing or seeking for a job in the next 12 months?
Yes 1
No 2
22.
If Yes to Q21 above, Why will you be looking to search/seek or change your current employment in the next 12 months?
(MULTIPLE ANSWERS LIKELY)
Better use of skills/abilities 1
Enjoyment of work 2
More Respect/Appreciation 3
Higher Salary 4
Job security 5
Better supervisor/manager 6
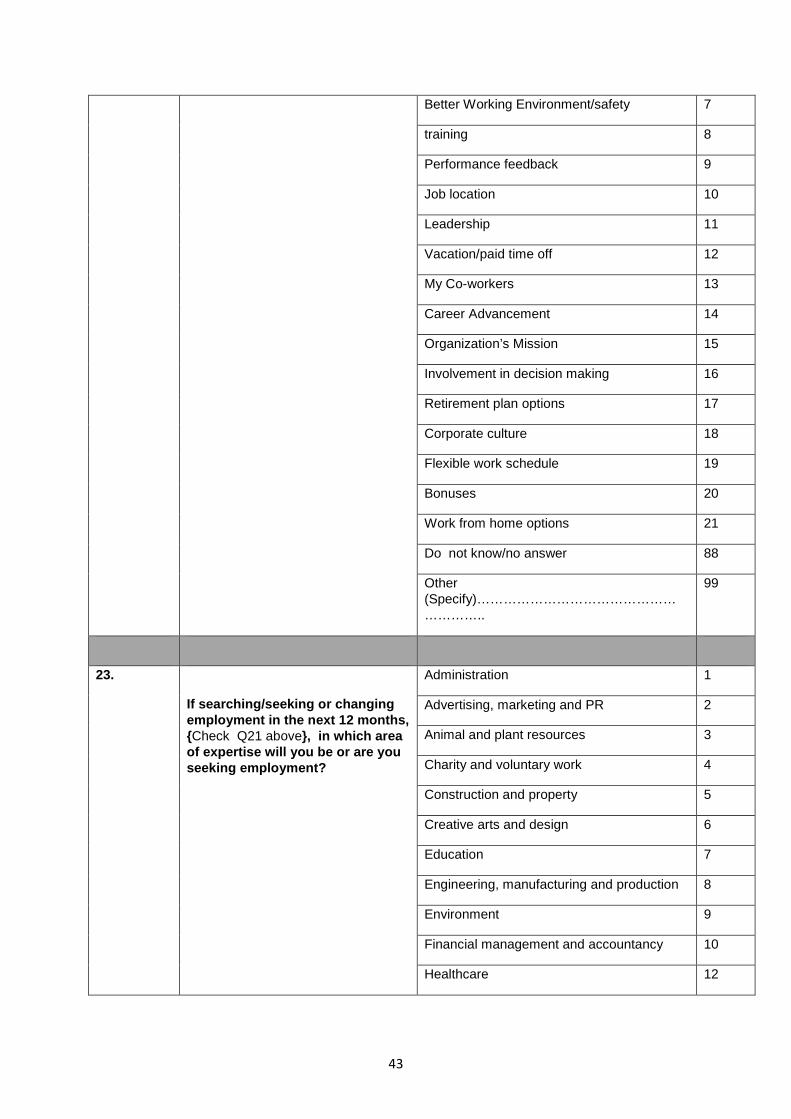
43
Better Working Environment/safety 7
training 8
Performance feedback 9
Job location 10
Leadership 11
Vacation/paid time off 12
My Co-workers 13
Career Advancement 14
Organization’s Mission 15
Involvement in decision making 16
Retirement plan options 17
Corporate culture 18
Flexible work schedule 19
Bonuses 20
Work from home options 21
Do not know/no answer 88
Other (Specify)…………………………………………………..
99
23.
If searching/seeking or changing employment in the next 12 months, {Check Q21 above}, in which area of expertise will you be or are you seeking employment?
Administration 1
Advertising, marketing and PR 2
Animal and plant resources 3
Charity and voluntary work 4
Construction and property 5
Creative arts and design 6
Education 7
Engineering, manufacturing and production 8
Environment 9
Financial management and accountancy 10
Healthcare 12
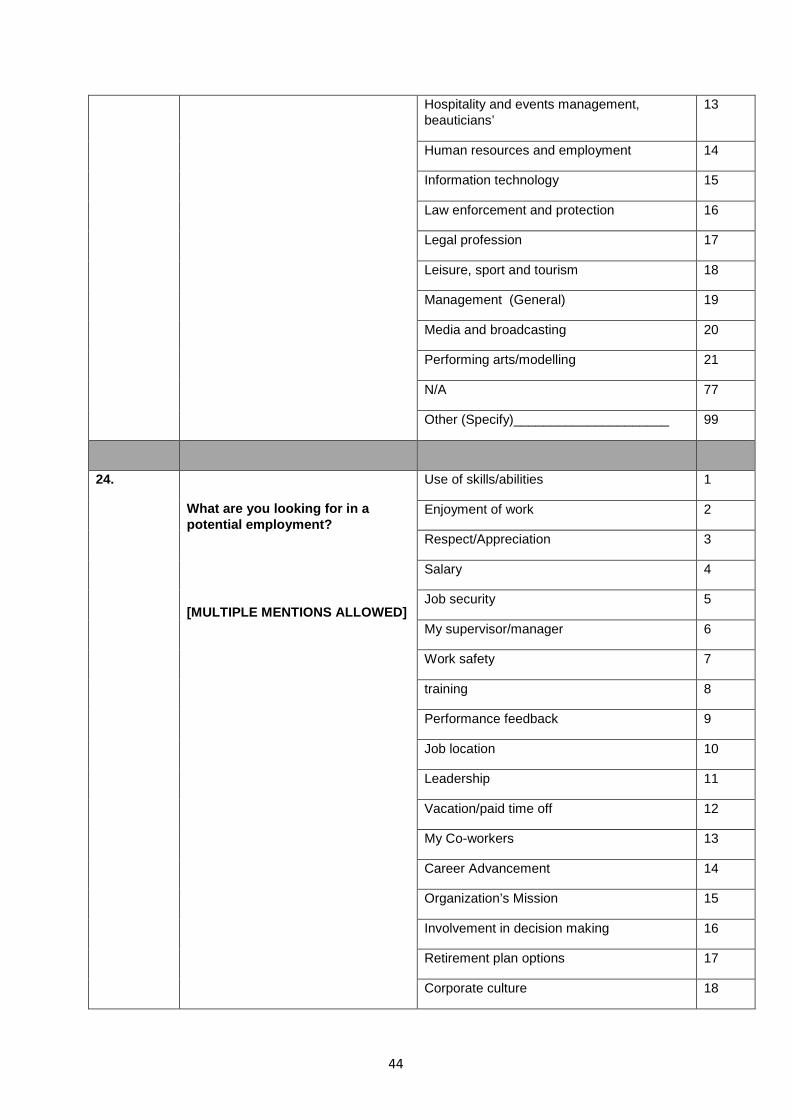
44
Hospitality and events management, beauticians’
13
Human resources and employment 14
Information technology 15
Law enforcement and protection 16
Legal profession 17
Leisure, sport and tourism 18
Management (General) 19
Media and broadcasting 20
Performing arts/modelling 21
N/A 77
Other (Specify)_____________________ 99
24.
What are you looking for in a potential employment?
[MULTIPLE MENTIONS ALLOWED]
Use of skills/abilities 1
Enjoyment of work 2
Respect/Appreciation 3
Salary 4
Job security 5
My supervisor/manager 6
Work safety 7
training 8
Performance feedback 9
Job location 10
Leadership 11
Vacation/paid time off 12
My Co-workers 13
Career Advancement 14
Organization’s Mission 15
Involvement in decision making 16
Retirement plan options 17
Corporate culture 18
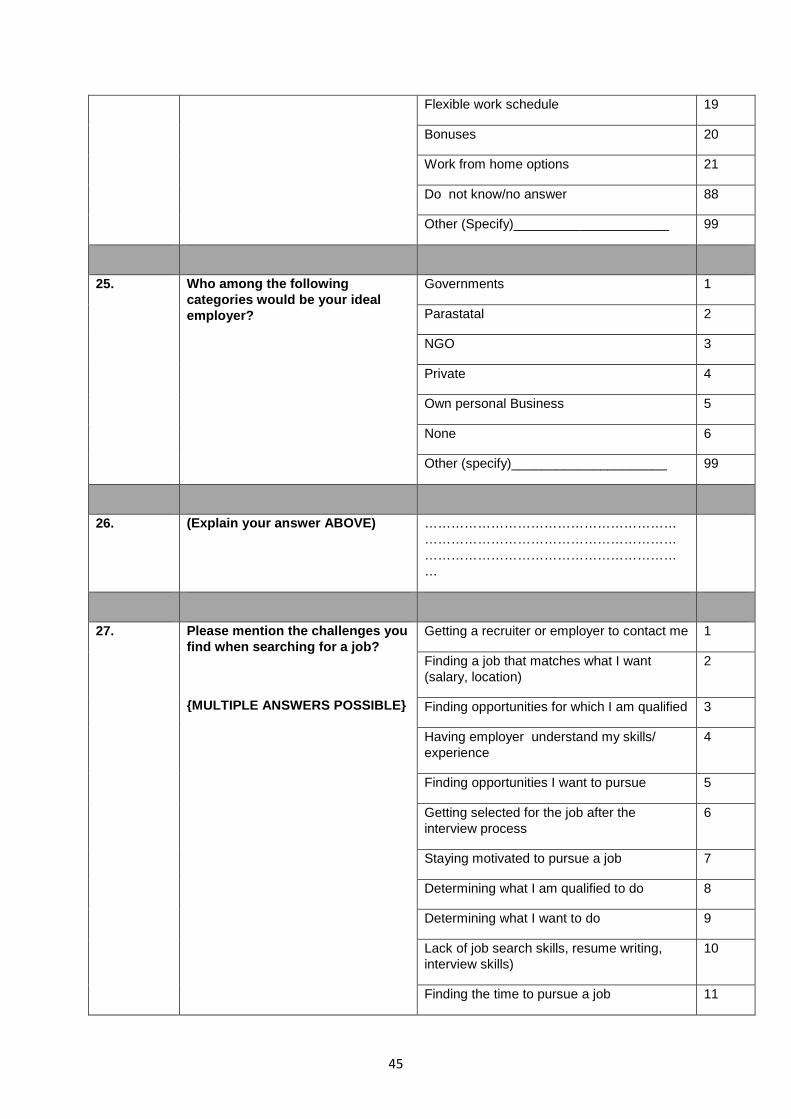
45
Flexible work schedule 19
Bonuses 20
Work from home options 21
Do not know/no answer 88
Other (Specify)_____________________ 99
25. Who among the following categories would be your ideal employer?
Governments 1
Parastatal 2
NGO 3
Private 4
Own personal Business 5
None 6
Other (specify)_____________________ 99
26. (Explain your answer ABOVE)
…………………………………………………………………………………………………………………………………………………………
27. Please mention the challenges you find when searching for a job?
{MULTIPLE ANSWERS POSSIBLE}
Getting a recruiter or employer to contact me 1
Finding a job that matches what I want (salary, location)
2
Finding opportunities for which I am qualified 3
Having employer understand my skills/ experience
4
Finding opportunities I want to pursue 5
Getting selected for the job after the interview process
6
Staying motivated to pursue a job 7
Determining what I am qualified to do 8
Determining what I want to do 9
Lack of job search skills, resume writing, interview skills)
10
Finding the time to pursue a job 11
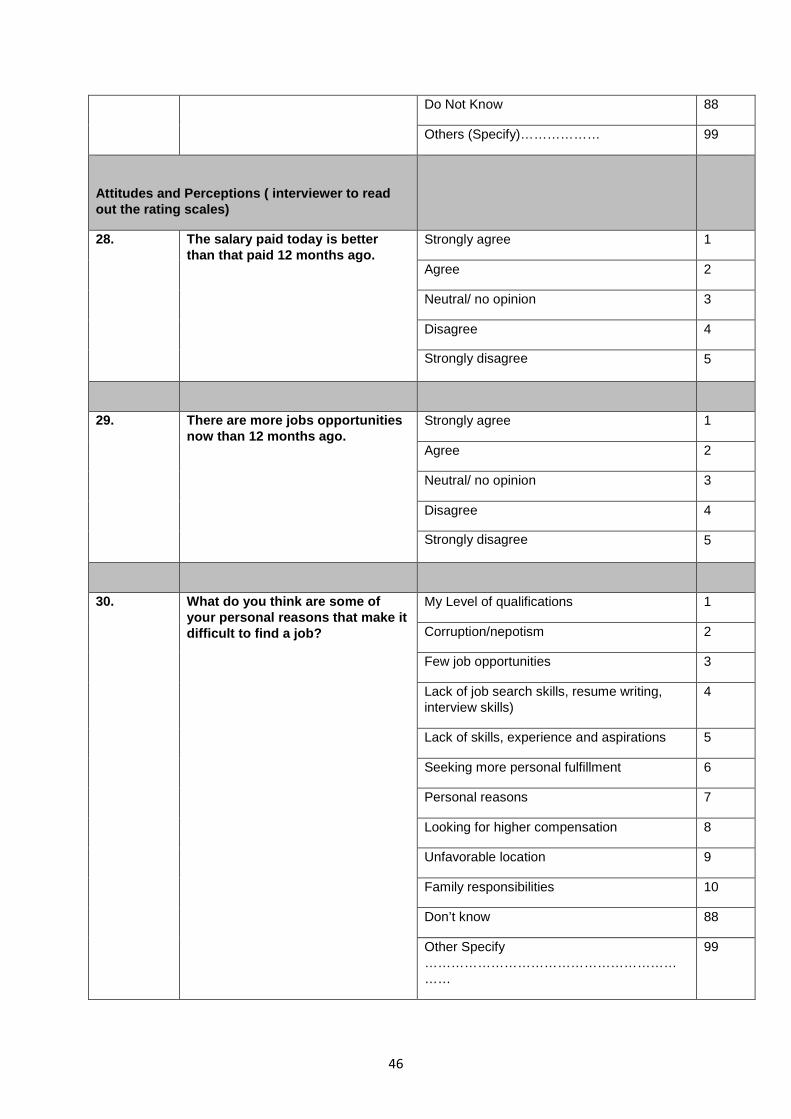
46
Do Not Know 88
Others (Specify)……………… 99
Attitudes and Perceptions ( interviewer to read out the rating scales)
28. The salary paid today is better than that paid 12 months ago.
Strongly agree 1
Agree 2
Neutral/ no opinion 3
Disagree 4
Strongly disagree 5
29. There are more jobs opportunities now than 12 months ago.
Strongly agree 1
Agree 2
Neutral/ no opinion 3
Disagree 4
Strongly disagree 5
30. What do you think are some of your personal reasons that make it difficult to find a job?
My Level of qualifications 1
Corruption/nepotism 2
Few job opportunities 3
Lack of job search skills, resume writing, interview skills)
4
Lack of skills, experience and aspirations 5
Seeking more personal fulfillment 6
Personal reasons 7
Looking for higher compensation 8
Unfavorable location 9
Family responsibilities 10
Don’t know 88
Other Specify ………………………………………………………
99
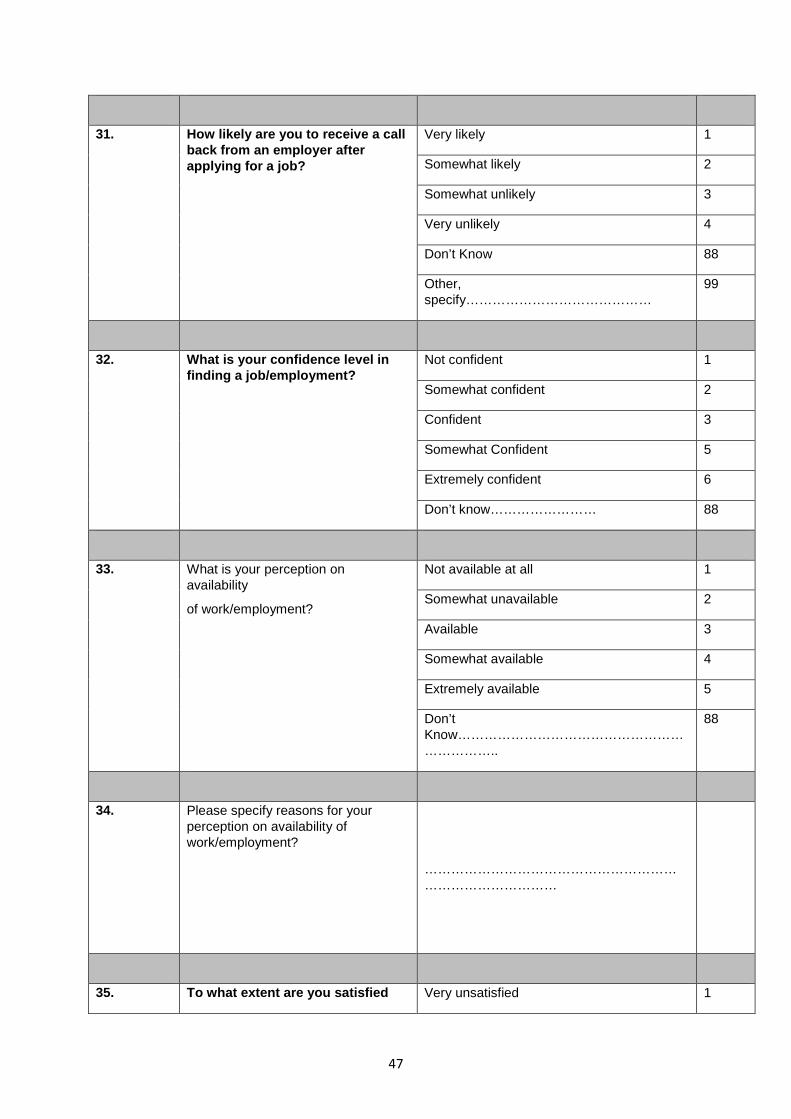
47
31. How likely are you to receive a call back from an employer after applying for a job?
Very likely 1
Somewhat likely 2
Somewhat unlikely 3
Very unlikely 4
Don’t Know 88
Other, specify……………………………………
99
32. What is your confidence level in finding a job/employment?
Not confident 1
Somewhat confident 2
Confident 3
Somewhat Confident 5
Extremely confident 6
Don’t know…………………… 88
33. What is your perception on availability
of work/employment?
Not available at all 1
Somewhat unavailable 2
Available 3
Somewhat available 4
Extremely available 5
Don’t Know…………………………………………………………..
88
34. Please specify reasons for your perception on availability of work/employment?
……………………………………………………………………………
35. To what extent are you satisfied Very unsatisfied 1
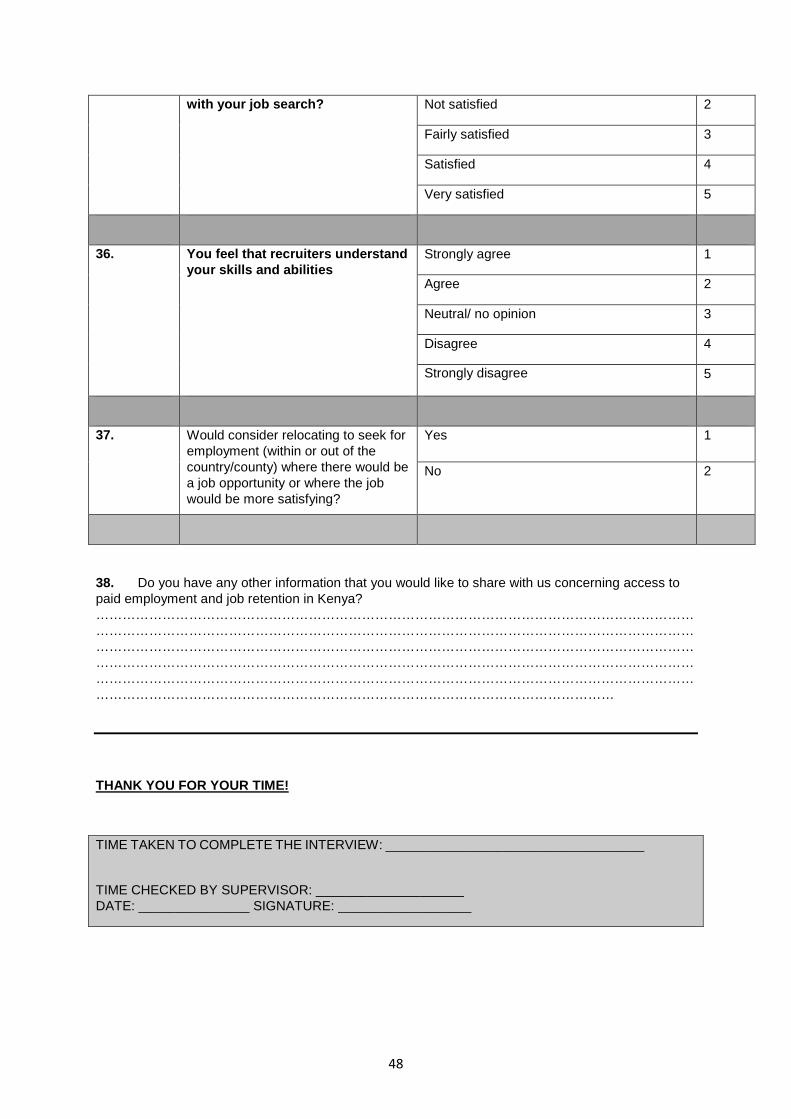
48
38. Do you have any other information that you would like to share with us concerning access to paid employment and job retention in Kenya? ………………………………………………………………………………………………………………………………………………………………………………………………………………………………………………………………………………………………………………………………………………………………………………………………………………………………………………………………………………………………………………………………………………………………………………………………………………………………………………………………………………………………………………………………
THANK YOU FOR YOUR TIME!
TIME TAKEN TO COMPLETE THE INTERVIEW: ___________________________________
TIME CHECKED BY SUPERVISOR: ____________________ DATE: _______________ SIGNATURE: __________________
with your job search?
Not satisfied 2
Fairly satisfied 3
Satisfied 4
Very satisfied 5
36. You feel that recruiters understand your skills and abilities
Strongly agree 1
Agree 2
Neutral/ no opinion 3
Disagree 4
Strongly disagree 5
37. Would consider relocating to seek for employment (within or out of the country/county) where there would be a job opportunity or where the job would be more satisfying?
Yes 1
No 2
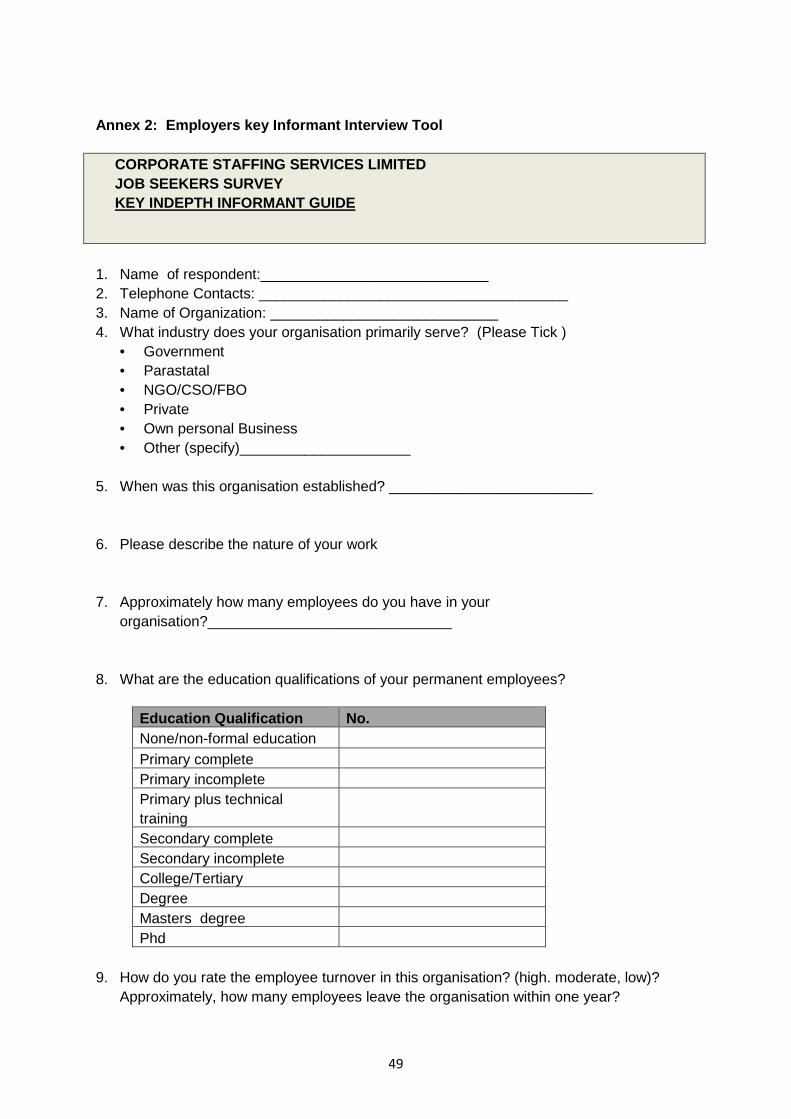
49
Annex 2: Employers key Informant Interview Tool
CORPORATE STAFFING SERVICES LIMITED JOB SEEKERS SURVEY KEY INDEPTH INFORMANT GUIDE
1. Name of respondent:____________________________ 2. Telephone Contacts: ______________________________________ 3. Name of Organization: ____________________________ 4. What industry does your organisation primarily serve? (Please Tick )
• Government • Parastatal • NGO/CSO/FBO • Private • Own personal Business • Other (specify)_____________________
5. When was this organisation established? _________________________ 6. Please describe the nature of your work
7. Approximately how many employees do you have in your organisation?______________________________
8. What are the education qualifications of your permanent employees?
Education Qualification No. None/non-formal education Primary complete Primary incomplete Primary plus technical training
Secondary complete Secondary incomplete College/Tertiary Degree Masters degree Phd
9. How do you rate the employee turnover in this organisation? (high. moderate, low)?
Approximately, how many employees leave the organisation within one year?
50
10. Please mention some of the reasons attributed to the employee turnover.
11. From your experiences, on average, what caliber of employees in this organisation are likely to have the highest job turnover in terms of Age? ___________________ Education qualifications? ________________ Areas of Expertise? ______________________
12. How many people has your organisation actually recruited in the past 12 months? No. _______________________________ Age _________________________ Expertise……………………………..
13. How many of the ones recruited in the last year are still working for you? No. _______________________________ Age _________________________ Expertise……………………………..
14. What channels did you used in the last 12 months to try to fill the vacancies?
15. When looking to hire, which are the 4 most important job skills and attributes that you consider as the most important selection criterion?
16. From your experiences, do you believe there is a significant gap between employer’s
needs and job seekers skills? Please give some of the reasons 17. On the whole, how well prepared are current job seekers for a job search? 18. What could job seekers do to improve their job search? 19. In your opinion, what are the most common mistakes job seekers and applicants make
during the job search process?
20. What are some of the common mistakes new recruits/ employees make during the first year on the job?
21. Do you have any other information that you would like to share with us concerning access to paid employment and job retention in Kenya?
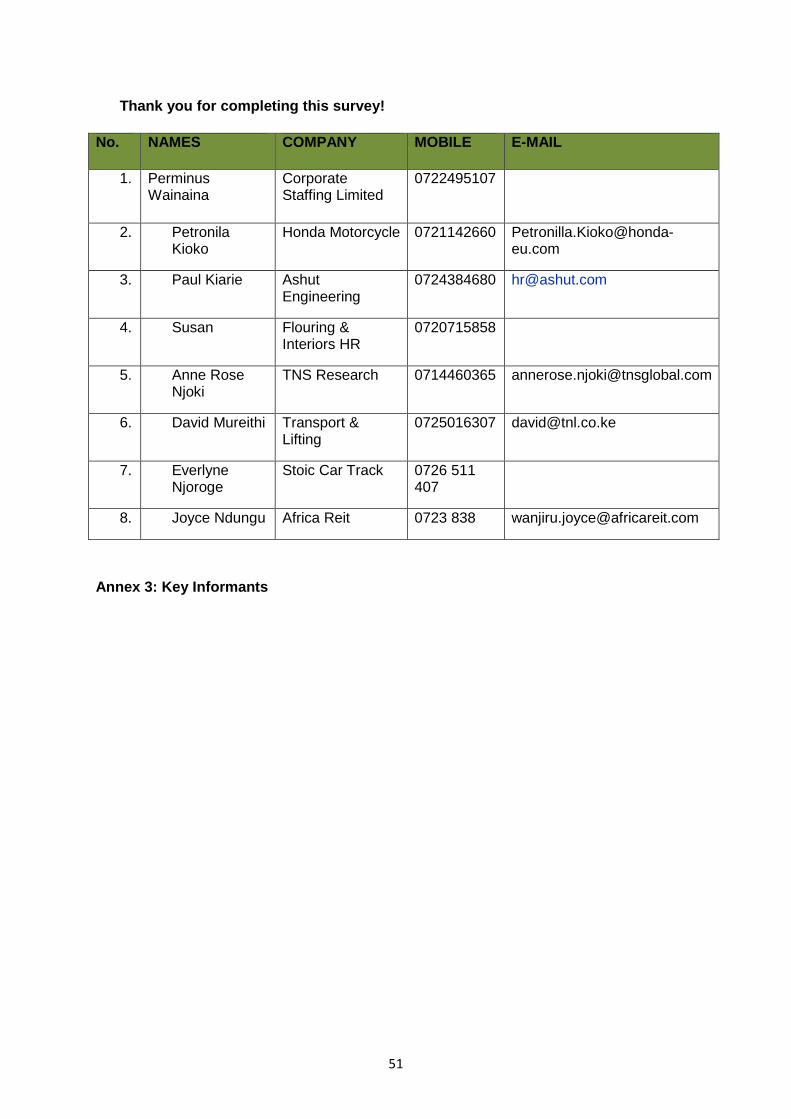
51
Thank you for completing this survey!
Annex 3: Key Informants
No. NAMES COMPANY MOBILE E-MAIL
1. Perminus Wainaina
Corporate Staffing Limited
0722495107
2. Petronila Kioko
Honda Motorcycle 0721142660 [email protected]
3. Paul Kiarie Ashut Engineering
0724384680 [email protected]
4. Susan Flouring & Interiors HR
0720715858
5. Anne Rose Njoki
TNS Research 0714460365 [email protected]
6. David Mureithi Transport & Lifting
0725016307 [email protected]
7. Everlyne Njoroge
Stoic Car Track 0726 511 407
8. Joyce Ndungu Africa Reit 0723 838 [email protected]

52
340