Embed Size (px)
Citation preview
2Q 2014 | VIETNAM OVERVIEW
KNOWLEDGE REPORTVIETNAM
www.colliers.com/vietnam
The Vista, District 2, HCMC
VIETNAM ECONOMIC UPDATE• Vietnam’s macroeconomic improving thanks to
stable FDI inflowsHO CHI MINH CITY & HANOI’S ECONOMIC UPDATEHO CHI MINH CITY PROPERTY MARKET
Office• Market Overview• Market Insight• ForecastRetail• Market Overview• Market Insight• ForecastCondominium• Market Overview• Market Insight• ForecastServiced Apartment• Market Overview• Market Insight• Forecast
HCMC INDUSTRIAL MARKETHANOI PROPERTY MARKET
Office• Market Overview• Market Insight• ForecastRetail• Market Overview• Market Insight• ForecastResidential• Market Overview• Market Insight• Forecast
TABLE OF CONTENTS
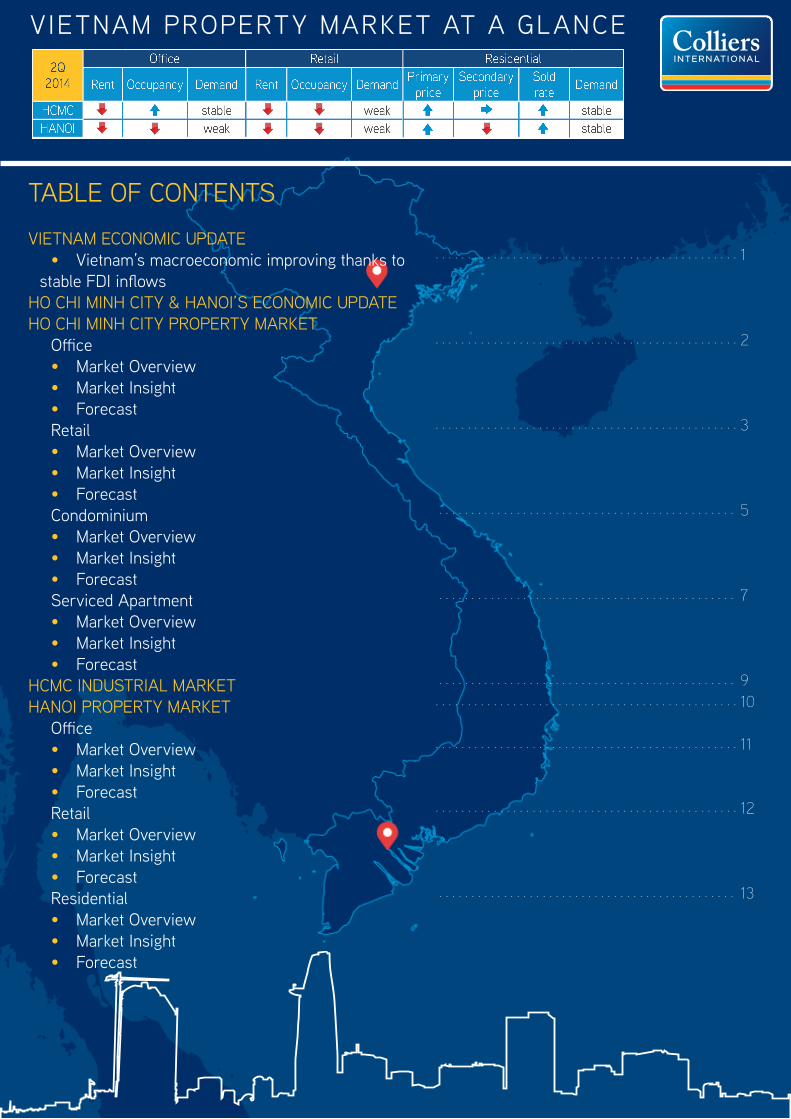
VIETNAM PROPERTY MARKET AT A GLANCE
1
2
3
5
7
910
11
12
13
. . . . . . . . . . . . . . . . . . . . . . . . . . . . . . . . . . . . . . . . . . . . . . .
. . . . . . . . . . . . . . . . . . . . . . . . . . . . . . . . . . . . . . . . . . . . . . .
. . . . . . . . . . . . . . . . . . . . . . . . . . . . . . . . . . . . . . . . . . . . . . .
. . . . . . . . . . . . . . . . . . . . . . . . . . . . . . . . . . . . . . . . . . . . . .
. . . . . . . . . . . . . . . . . . . . . . . . . . . . . . . . . . . . . . . . . . . . . .
. . . . . . . . . . . . . . . . . . . . . . . . . . . . . . . . . . . . . . . . . . . . . .
. . . . . . . . . . . . . . . . . . . . . . . . . . . . . . . . . . . . . . . . . . . . . . .
. . . . . . . . . . . . . . . . . . . . . . . . . . . . . . . . . . . . . . . . . . . . . . .
. . . . . . . . . . . . . . . . . . . . . . . . . . . . . . . . . . . . . . . . . . . . . . .
. . . . . . . . . . . . . . . . . . . . . . . . . . . . . . . . . . . . . . . . . . . . . .
VIETNAM | 2Q 2014 | ECONOMIC UPDATE
P.1 | Colliers International
FDI OF VIETNAM, 2Q 2014
VIETNAM’ S IMPORT - EXPORT FIGURES, 2Q 2014
Source: GSO, Colliers International
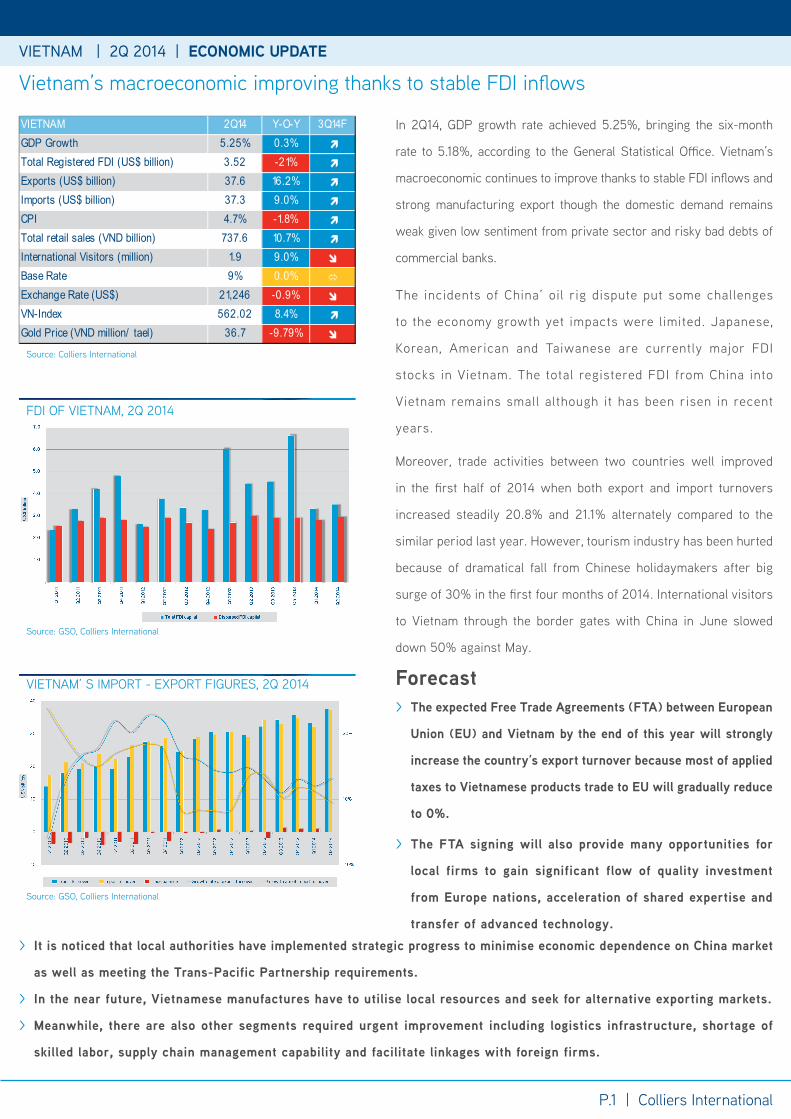
Vietnam’s macroeconomic improving thanks to stable FDI inflows
VIETNAM 2Q14 Y-O-Y 3Q14FGDP Growth 5.25% 0.3% Total Registered FDI (US$ billion) 3.52 -21% Exports (US$ billion) 37.6 16.2% Imports (US$ billion) 37.3 9.0% CPI 4.7% -1.8% Total retail sales (VND billion) 737.6 10.7% International Visitors (million) 1.9 9.0%
Base Rate 9% 0.0%
Exchange Rate (US$) 21,246 -0.9%
VN-Index 562.02 8.4% Gold Price (VND million/ tael) 36.7 -9.79%
Source: Colliers International
Source: GSO, Colliers International
Forecast > The expected Free Trade Agreements (FTA) between European
Union (EU) and Vietnam by the end of this year will strongly
increase the country’s export turnover because most of applied
taxes to Vietnamese products trade to EU will gradually reduce
to 0%.
> The FTA signing will also provide many opportunities for
local firms to gain significant flow of quality investment
from Europe nations, acceleration of shared expertise and
transfer of advanced technology.
In 2Q14, GDP growth rate achieved 5.25%, bringing the six-month
rate to 5.18%, according to the General Statistical Office. Vietnam’s
macroeconomic continues to improve thanks to stable FDI inflows and
strong manufacturing export though the domestic demand remains
weak given low sentiment from private sector and risky bad debts of
commercial banks.
The incidents of China’ oil rig dispute put some challenges
to the economy growth yet impacts were limited. Japanese,
Korean, American and Taiwanese are currently major FDI
stocks in Vietnam. The total registered FDI from China into
Vietnam remains small although it has been risen in recent
years.
Moreover, trade activities between two countries well improved
in the first half of 2014 when both export and import turnovers
increased steadily 20.8% and 21.1% alternately compared to the
similar period last year. However, tourism industry has been hurted
because of dramatical fall from Chinese holidaymakers after big
surge of 30% in the first four months of 2014. International visitors
to Vietnam through the border gates with China in June slowed
down 50% against May.
> It is noticed that local authorities have implemented strategic progress to minimise economic dependence on China market
as well as meeting the Trans-Pacific Partnership requirements.
> In the near future, Vietnamese manufactures have to utilise local resources and seek for alternative exporting markets.
> Meanwhile, there are also other segments required urgent improvement including logistics infrastructure, shortage of
skilled labor, supply chain management capability and facilitate linkages with foreign firms.
HO CHI MINH & HA NOI | 2Q 2014 | ECONOMIC UPDATE
P.2 | Colliers International
HCMC - HANOI GDP GROWTH RATE, 2Q 2014HCMC - HANOI FDI GROWTH BY MONTH
Source: GSO, Colliers International
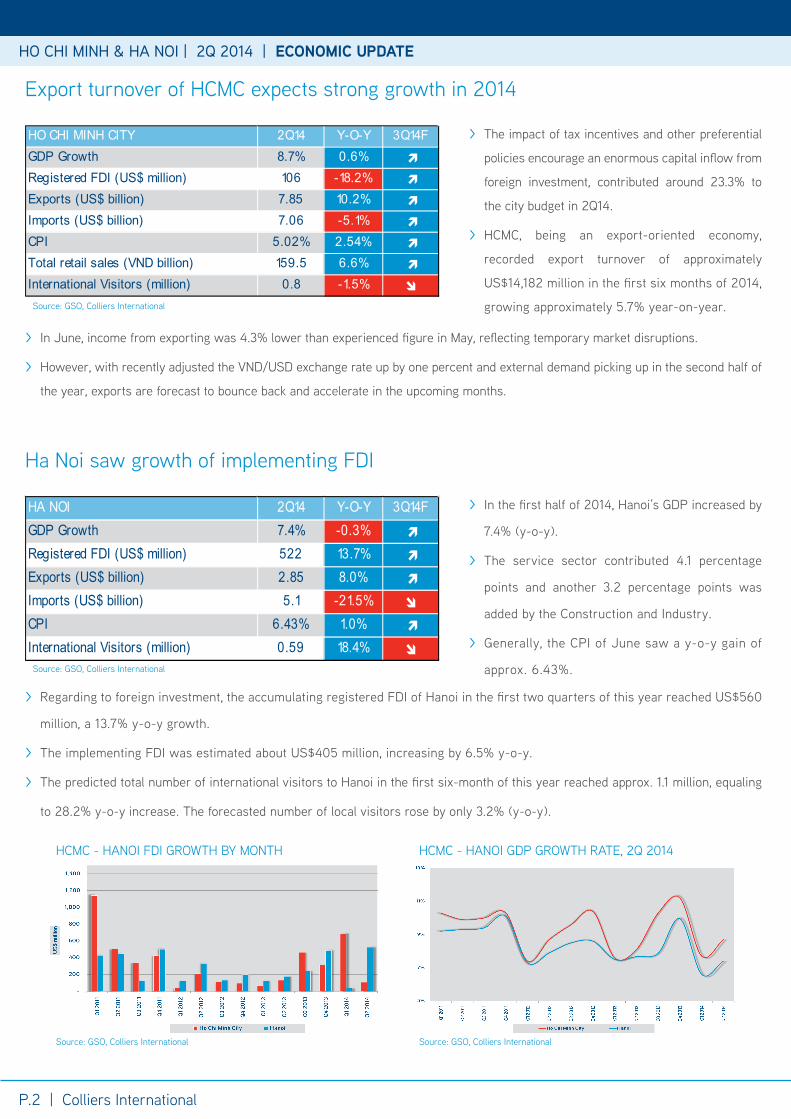
> The impact of tax incentives and other preferential
policies encourage an enormous capital inflow from
foreign investment, contributed around 23.3% to
the city budget in 2Q14.
> HCMC, being an export-oriented economy,
recorded export turnover of approximately
US$14,182 million in the first six months of 2014,
growing approximately 5.7% year-on-year.
Export turnover of HCMC expects strong growth in 2014
HO CHI MINH CITY 2Q14 Y-O-Y 3Q14FGDP Growth 8.7% 0.6% Registered FDI (US$ million) 106 -18.2% Exports (US$ billion) 7.85 10.2% Imports (US$ billion) 7.06 -5.1% CPI 5.02% 2.54% Total retail sales (VND billion) 159.5 6.6% International Visitors (million) 0.8 -1.5%
Source: GSO, Colliers International
Source: GSO, Colliers International
Ha Noi saw growth of implementing FDI
HA NOI 2Q14 Y-O-Y 3Q14FGDP Growth 7.4% -0.3% Registered FDI (US$ million) 522 13.7% Exports (US$ billion) 2.85 8.0% Imports (US$ billion) 5.1 -21.5%
CPI 6.43% 1.0% International Visitors (million) 0.59 18.4%
> In the first half of 2014, Hanoi’s GDP increased by
7.4% (y-o-y).
> The service sector contributed 4.1 percentage
points and another 3.2 percentage points was
added by the Construction and Industry.
> Generally, the CPI of June saw a y-o-y gain of
approx. 6.43%.Source: GSO, Colliers International
HO CHI MINH CITY | 2Q 2014 | PROPERTY MARKET
> Regarding to foreign investment, the accumulating registered FDI of Hanoi in the first two quarters of this year reached US$560
million, a 13.7% y-o-y growth.
> The implementing FDI was estimated about US$405 million, increasing by 6.5% y-o-y.
> The predicted total number of international visitors to Hanoi in the first six-month of this year reached approx. 1.1 million, equaling
to 28.2% y-o-y increase. The forecasted number of local visitors rose by only 3.2% (y-o-y).
> In June, income from exporting was 4.3% lower than experienced figure in May, reflecting temporary market disruptions.
> However, with recently adjusted the VND/USD exchange rate up by one percent and external demand picking up in the second half of
the year, exports are forecast to bounce back and accelerate in the upcoming months.
HO CHI MINH & HA NOI | 2Q 2014 | ECONOMIC UPDATE HO CHI MINH CITY | 2Q 2014 | PROPERTY MARKET
HCMC Property Market Overview
View of HCMC CBD
HO CHI MINH CITY | 2Q 2014 | OFFICE MARKET
P.3 | Colliers International
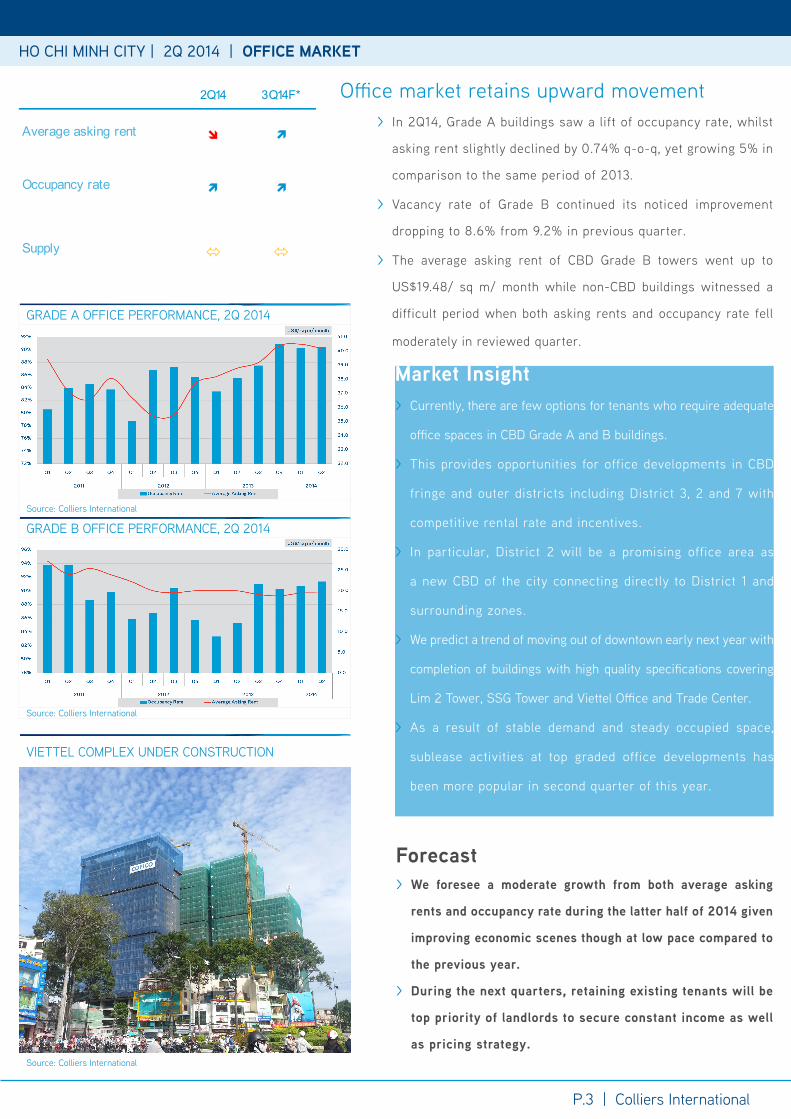
GRADE A OFFICE PERFORMANCE, 2Q 2014
GRADE B OFFICE PERFORMANCE, 2Q 2014Source: Colliers International
Source: Colliers International
VIETTEL COMPLEX UNDER CONSTRUCTION
Source: Colliers International
Forecast > We foresee a moderate growth from both average asking
rents and occupancy rate during the latter half of 2014 given
improving economic scenes though at low pace compared to
the previous year.
> During the next quarters, retaining existing tenants will be
top priority of landlords to secure constant income as well
as pricing strategy.
Office market retains upward movement > In 2Q14, Grade A buildings saw a lift of occupancy rate, whilst
asking rent slightly declined by 0.74% q-o-q, yet growing 5% in
comparison to the same period of 2013.
> Vacancy rate of Grade B continued its noticed improvement
dropping to 8.6% from 9.2% in previous quarter.
> The average asking rent of CBD Grade B towers went up to
US$19.48/ sq m/ month while non-CBD buildings witnessed a
difficult period when both asking rents and occupancy rate fell
moderately in reviewed quarter.
Market Insight > Currently, there are few options for tenants who require adequate
office spaces in CBD Grade A and B buildings.
> This provides opportunities for office developments in CBD
fringe and outer districts including District 3, 2 and 7 with
competitive rental rate and incentives.
> In particular, District 2 will be a promising office area as
a new CBD of the city connecting directly to District 1 and
surrounding zones.
> We predict a trend of moving out of downtown early next year with
completion of buildings with high quality specifications covering
Lim 2 Tower, SSG Tower and Viettel Office and Trade Center.
> As a result of stable demand and steady occupied space,
sublease activities at top graded office developments has
been more popular in second quarter of this year.
2Q14 3Q14F*
Average asking rent
Occupancy rate
Supply
HO CHI MINH CITY | 2Q 2014 | OFFICE MARKET
P.4 | Colliers International
HO CHI MINH CITY | 2Q 2014 | OFFICE MARKET
P.3 | Colliers International
HO CHI MINH CITY | 2Q 2014 | OFFICE MARKET
P.4 | Colliers International
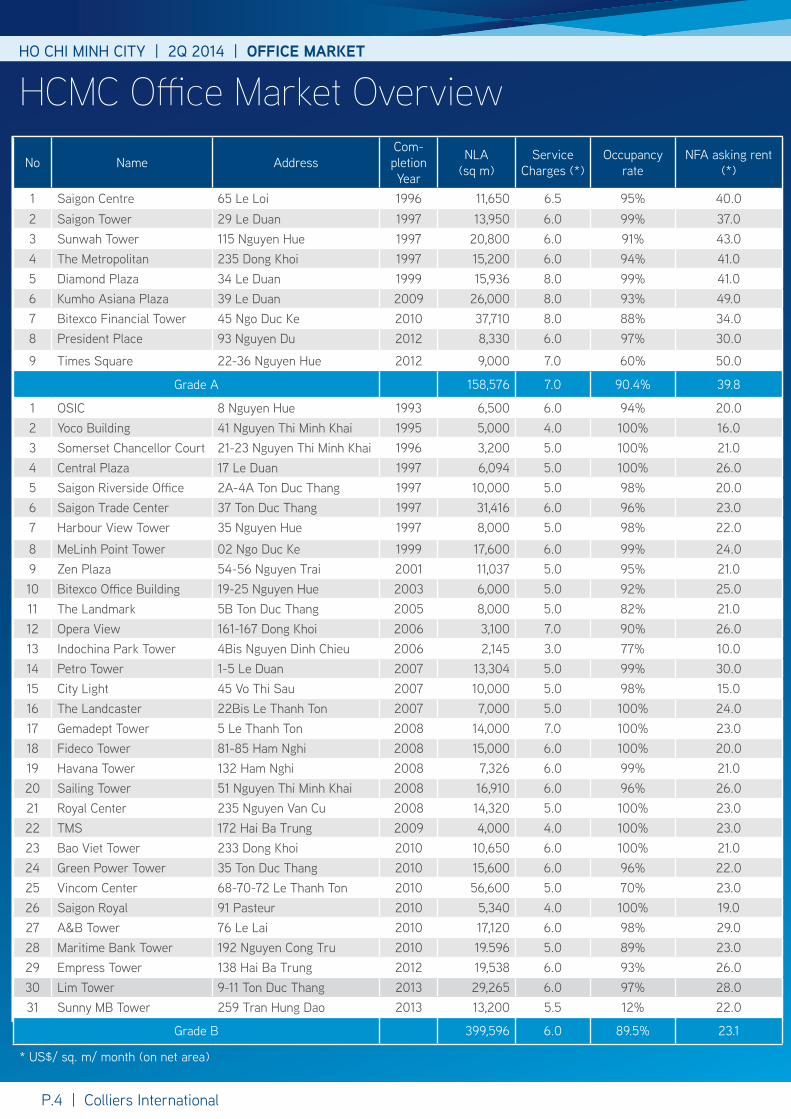
HCMC Office Market Overview
* US$/ sq. m/ month (on net area)
No Name AddressCom-pletion Year
NLA (sq m)
Service Charges (*)
Occupancy rate
NFA asking rent (*)
1 Saigon Centre 65 Le Loi 1996 11,650 6.5 95% 40.02 Saigon Tower 29 Le Duan 1997 13,950 6.0 99% 37.03 Sunwah Tower 115 Nguyen Hue 1997 20,800 6.0 91% 43.04 The Metropolitan 235 Dong Khoi 1997 15,200 6.0 94% 41.05 Diamond Plaza 34 Le Duan 1999 15,936 8.0 99% 41.06 Kumho Asiana Plaza 39 Le Duan 2009 26,000 8.0 93% 49.07 Bitexco Financial Tower 45 Ngo Duc Ke 2010 37,710 8.0 88% 34.08 President Place 93 Nguyen Du 2012 8,330 6.0 97% 30.0
9 Times Square 22-36 Nguyen Hue 2012 9,000 7.0 60% 50.0
Grade A 158,576 7.0 90.4% 39.8
1 OSIC 8 Nguyen Hue 1993 6,500 6.0 94% 20.02 Yoco Building 41 Nguyen Thi Minh Khai 1995 5,000 4.0 100% 16.03 Somerset Chancellor Court 21-23 Nguyen Thi Minh Khai 1996 3,200 5.0 100% 21.04 Central Plaza 17 Le Duan 1997 6,094 5.0 100% 26.05 Saigon Riverside Office 2A-4A Ton Duc Thang 1997 10,000 5.0 98% 20.06 Saigon Trade Center 37 Ton Duc Thang 1997 31,416 6.0 96% 23.07 Harbour View Tower 35 Nguyen Hue 1997 8,000 5.0 98% 22.0
8 MeLinh Point Tower 02 Ngo Duc Ke 1999 17,600 6.0 99% 24.09 Zen Plaza 54-56 Nguyen Trai 2001 11,037 5.0 95% 21.010 Bitexco Office Building 19-25 Nguyen Hue 2003 6,000 5.0 92% 25.011 The Landmark 5B Ton Duc Thang 2005 8,000 5.0 82% 21.012 Opera View 161-167 Dong Khoi 2006 3,100 7.0 90% 26.013 Indochina Park Tower 4Bis Nguyen Dinh Chieu 2006 2,145 3.0 77% 10.014 Petro Tower 1-5 Le Duan 2007 13,304 5.0 99% 30.015 City Light 45 Vo Thi Sau 2007 10,000 5.0 98% 15.016 The Landcaster 22Bis Le Thanh Ton 2007 7,000 5.0 100% 24.017 Gemadept Tower 5 Le Thanh Ton 2008 14,000 7.0 100% 23.018 Fideco Tower 81-85 Ham Nghi 2008 15,000 6.0 100% 20.019 Havana Tower 132 Ham Nghi 2008 7,326 6.0 99% 21.020 Sailing Tower 51 Nguyen Thi Minh Khai 2008 16,910 6.0 96% 26.021 Royal Center 235 Nguyen Van Cu 2008 14,320 5.0 100% 23.022 TMS 172 Hai Ba Trung 2009 4,000 4.0 100% 23.023 Bao Viet Tower 233 Dong Khoi 2010 10,650 6.0 100% 21.024 Green Power Tower 35 Ton Duc Thang 2010 15,600 6.0 96% 22.025 Vincom Center 68-70-72 Le Thanh Ton 2010 56,600 5.0 70% 23.026 Saigon Royal 91 Pasteur 2010 5,340 4.0 100% 19.027 A&B Tower 76 Le Lai 2010 17,120 6.0 98% 29.028 Maritime Bank Tower 192 Nguyen Cong Tru 2010 19.596 5.0 89% 23.029 Empress Tower 138 Hai Ba Trung 2012 19,538 6.0 93% 26.030 Lim Tower 9-11 Ton Duc Thang 2013 29,265 6.0 97% 28.031 Sunny MB Tower 259 Tran Hung Dao 2013 13,200 5.5 12% 22.0
Grade B 399,596 6.0 89.5% 23.1
HO CHI MINH CITY | 2Q 2014 | RETAIL MARKET
P.5 | Colliers International
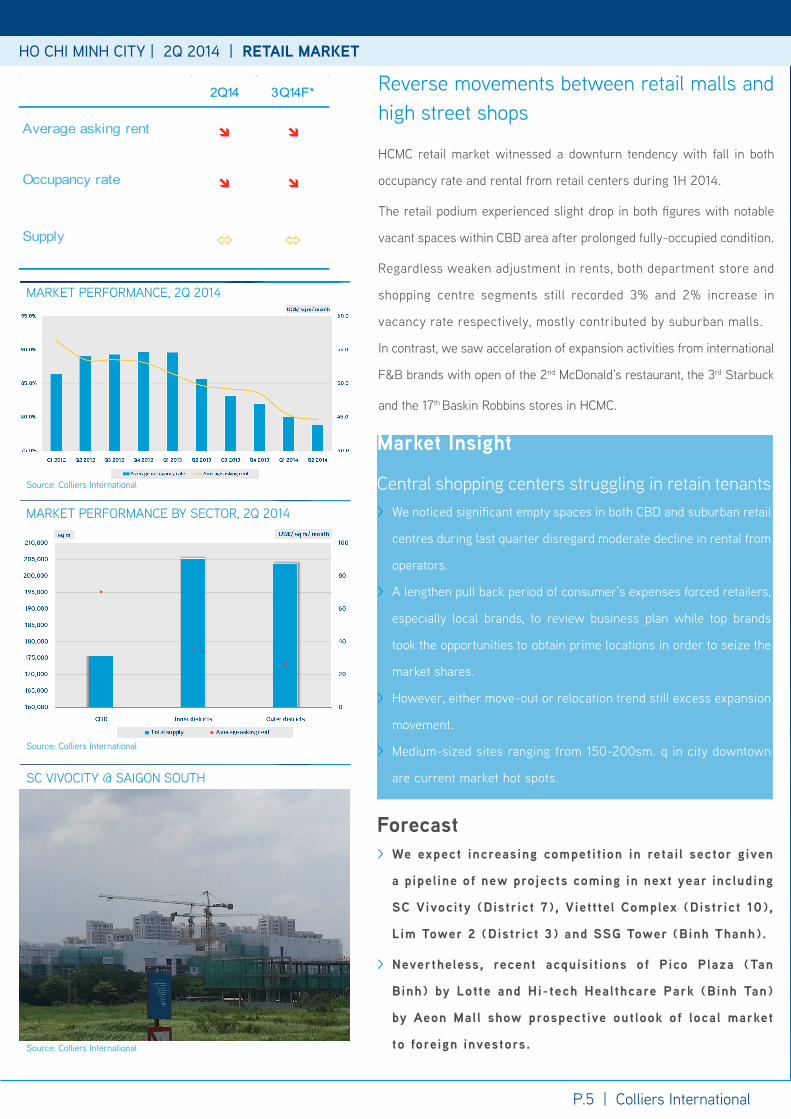
HCMC retail market witnessed a downturn tendency with fall in both
occupancy rate and rental from retail centers during 1H 2014.
The retail podium experienced slight drop in both figures with notable
vacant spaces within CBD area after prolonged fully-occupied condition.
Regardless weaken adjustment in rents, both department store and
shopping centre segments still recorded 3% and 2% increase in
vacancy rate respectively, mostly contributed by suburban malls.
In contrast, we saw accelaration of expansion activities from international
F&B brands with open of the 2nd McDonald’s restaurant, the 3rd Starbuck
and the 17th Baskin Robbins stores in HCMC.
MARKET PERFORMANCE, 2Q 2014
MARKET PERFORMANCE BY SECTOR, 2Q 2014
SC VIVOCITY @ SAIGON SOUTH
Source: Colliers International
Source: Colliers International
Source: Colliers International
Forecast > We expect increasing competit ion in retai l sector given
a pipeline of new projects coming in next year including
SC Vivocity (District 7), Vietttel Complex (District 10),
Lim Tower 2 (District 3) and SSG Tower (Binh Thanh).
> Nevertheless, recent acquisit ions of Pico Plaza (Tan
Binh) by Lotte and Hi-tech Healthcare Park (Binh Tan)
by Aeon Mal l show prospective outlook of local market
to foreign investors.
Reverse movements between retail malls and high street shops
Market Insight
Central shopping centers struggling in retain tenants > We noticed significant empty spaces in both CBD and suburban retail
centres during last quarter disregard moderate decline in rental from
operators.
> A lengthen pull back period of consumer’s expenses forced retailers,
especially local brands, to review business plan while top brands
took the opportunities to obtain prime locations in order to seize the
market shares.
> However, either move-out or relocation trend still excess expansion
movement.
> Medium-sized sites ranging from 150-200sm. q in city downtown
are current market hot spots.
HO CHI MINH CITY | 2Q 2014 | RETAIL MARKET
P.6 | Colliers International
2Q14 3Q14F*
Average asking rent
Occupancy rate
Supply
HO CHI MINH CITY | 2Q 2014 | RETAIL MARKET
P.5 | Colliers International
HO CHI MINH CITY | 2Q 2014 | RETAIL MARKET
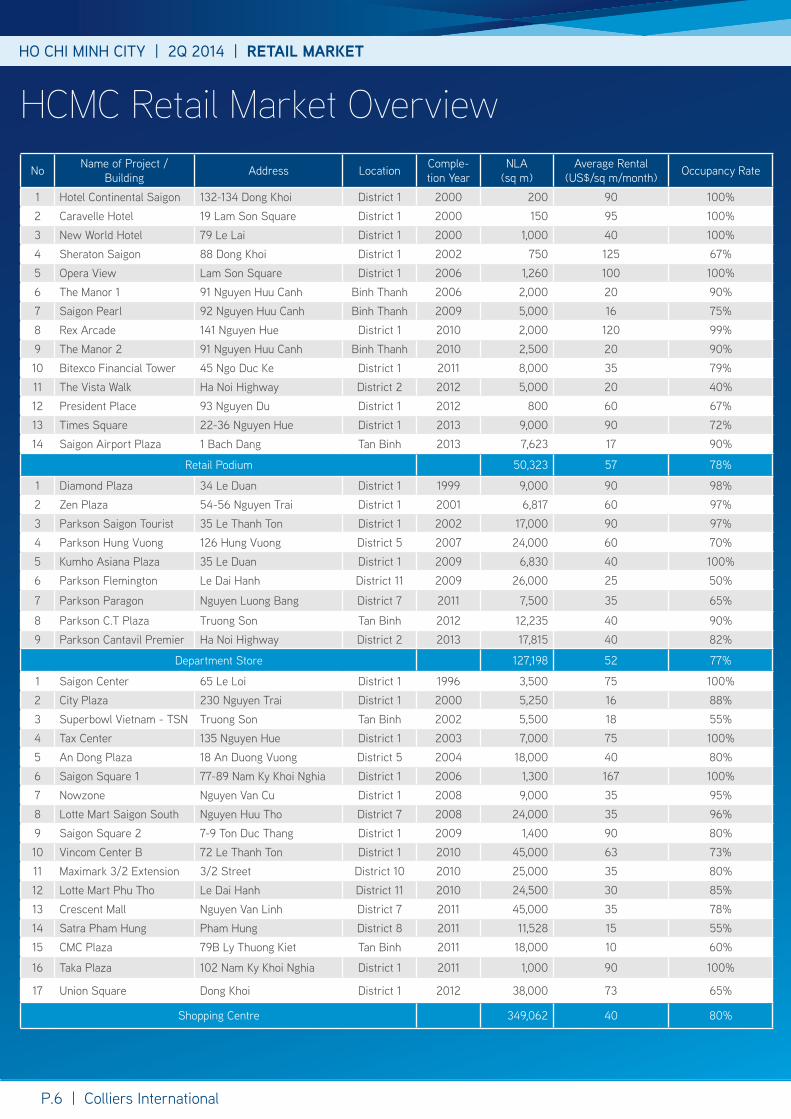
No Name of Project /Building Address Location Comple-
tion YearNLA
(sq m)Average Rental
(US$/sq m/month) Occupancy Rate
1 Hotel Continental Saigon 132-134 Dong Khoi District 1 2000 200 90 100%2 Caravelle Hotel 19 Lam Son Square District 1 2000 150 95 100%3 New World Hotel 79 Le Lai District 1 2000 1,000 40 100%4 Sheraton Saigon 88 Dong Khoi District 1 2002 750 125 67%5 Opera View Lam Son Square District 1 2006 1,260 100 100%6 The Manor 1 91 Nguyen Huu Canh Binh Thanh 2006 2,000 20 90%7 Saigon Pearl 92 Nguyen Huu Canh Binh Thanh 2009 5,000 16 75%8 Rex Arcade 141 Nguyen Hue District 1 2010 2,000 120 99%9 The Manor 2 91 Nguyen Huu Canh Binh Thanh 2010 2,500 20 90%10 Bitexco Financial Tower 45 Ngo Duc Ke District 1 2011 8,000 35 79%11 The Vista Walk Ha Noi Highway District 2 2012 5,000 20 40%12 President Place 93 Nguyen Du District 1 2012 800 60 67%13 Times Square 22-36 Nguyen Hue District 1 2013 9,000 90 72%14 Saigon Airport Plaza 1 Bach Dang Tan Binh 2013 7,623 17 90%
Retail Podium 50,323 57 78%
1 Diamond Plaza 34 Le Duan District 1 1999 9,000 90 98%2 Zen Plaza 54-56 Nguyen Trai District 1 2001 6,817 60 97%3 Parkson Saigon Tourist 35 Le Thanh Ton District 1 2002 17,000 90 97%4 Parkson Hung Vuong 126 Hung Vuong District 5 2007 24,000 60 70%5 Kumho Asiana Plaza 35 Le Duan District 1 2009 6,830 40 100%6 Parkson Flemington Le Dai Hanh District 11 2009 26,000 25 50%
7 Parkson Paragon Nguyen Luong Bang District 7 2011 7,500 35 65%
8 Parkson C.T Plaza Truong Son Tan Binh 2012 12,235 40 90%9 Parkson Cantavil Premier Ha Noi Highway District 2 2013 17,815 40 82%
Department Store 127,198 52 77%
1 Saigon Center 65 Le Loi District 1 1996 3,500 75 100%2 City Plaza 230 Nguyen Trai District 1 2000 5,250 16 88%3 Superbowl Vietnam - TSN Truong Son Tan Binh 2002 5,500 18 55%4 Tax Center 135 Nguyen Hue District 1 2003 7,000 75 100%5 An Dong Plaza 18 An Duong Vuong District 5 2004 18,000 40 80%6 Saigon Square 1 77-89 Nam Ky Khoi Nghia District 1 2006 1,300 167 100%7 Nowzone Nguyen Van Cu District 1 2008 9,000 35 95%8 Lotte Mart Saigon South Nguyen Huu Tho District 7 2008 24,000 35 96%9 Saigon Square 2 7-9 Ton Duc Thang District 1 2009 1,400 90 80%10 Vincom Center B 72 Le Thanh Ton District 1 2010 45,000 63 73%11 Maximark 3/2 Extension 3/2 Street District 10 2010 25,000 35 80%12 Lotte Mart Phu Tho Le Dai Hanh District 11 2010 24,500 30 85%13 Crescent Mall Nguyen Van Linh District 7 2011 45,000 35 78%14 Satra Pham Hung Pham Hung District 8 2011 11,528 15 55%15 CMC Plaza 79B Ly Thuong Kiet Tan Binh 2011 18,000 10 60%
16 Taka Plaza 102 Nam Ky Khoi Nghia District 1 2011 1,000 90 100%
17 Union Square Dong Khoi District 1 2012 38,000 73 65%
Shopping Centre 349,062 40 80%
HCMC Retail Market Overview
P.6 | Colliers International
HO CHI MINH CITY | 2Q 2014 | CONDOMINIUM MARKET
P.7 | Colliers International
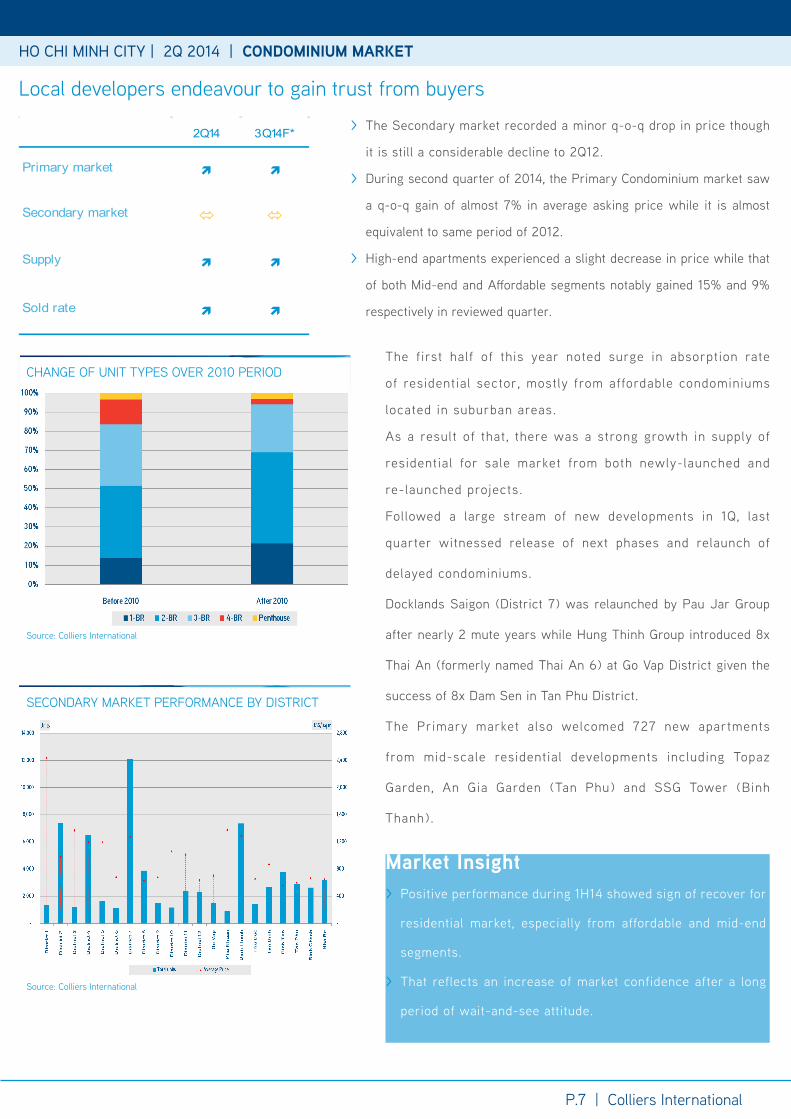
CHANGE OF UNIT TYPES OVER 2010 PERIOD
SECONDARY MARKET PERFORMANCE BY DISTRICT
The first half of this year noted surge in absorption rate
of residential sector, mostly from affordable condominiums
located in suburban areas.
As a result of that, there was a strong growth in supply of
residential for sale market from both newly-launched and
re-launched projects.
Followed a large stream of new developments in 1Q, last
quarter witnessed release of next phases and relaunch of
delayed condominiums.
Docklands Saigon (District 7) was relaunched by Pau Jar Group
after nearly 2 mute years while Hung Thinh Group introduced 8x
Thai An (formerly named Thai An 6) at Go Vap District given the
success of 8x Dam Sen in Tan Phu District.
The Primary market also welcomed 727 new apartments
from mid-scale residential developments including Topaz
Garden, An Gia Garden (Tan Phu) and SSG Tower (Binh
Thanh).
Source: Colliers International
Source: Colliers International
Market Insight > Positive performance during 1H14 showed sign of recover for
residential market, especially from affordable and mid-end
segments.
> That reflects an increase of market confidence after a long
period of wait-and-see attitude.
Local developers endeavour to gain trust from buyers
> The Secondary market recorded a minor q-o-q drop in price though
it is still a considerable decline to 2Q12.
> During second quarter of 2014, the Primary Condominium market saw
a q-o-q gain of almost 7% in average asking price while it is almost
equivalent to same period of 2012.
> High-end apartments experienced a slight decrease in price while that
of both Mid-end and Affordable segments notably gained 15% and 9%
respectively in reviewed quarter.
HO CHI MINH CITY | 2Q 2014 | CONDOMINIUM MARKET
2Q14 3Q14F*
Primary market
Secondary market
Supply
Sold rate
HO CHI MINH CITY | 2Q 2014 | CONDOMINIUM MARKET
P.7 | Colliers International
HO CHI MINH CITY | 2Q 2014 | CONDOMINIUM MARKET
> We saw significant efforts from local developers in building reputation and gaining buyer’s trust via good construction
progress from many projects.
> Instead of totally rely on traditional sources from bank loan and customer’s cashflow, the developers now seek for
alternative financial supports including partners, construction vendors and even brokerage firms.
> Multiple partners can share development risks whilst construction companies are willing to obtain en bloc of units for
trading as part of their business strategy.
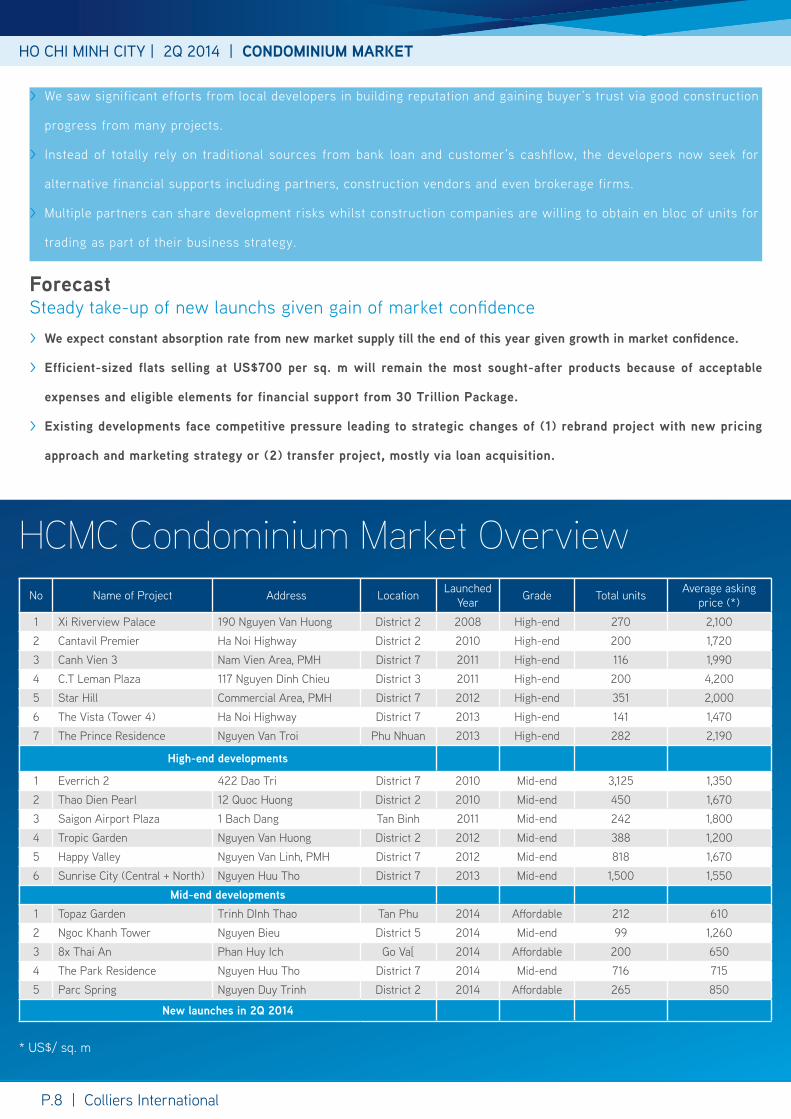
No Name of Project Address Location Launched Year Grade Total units Average asking
price (*)
1 Xi Riverview Palace 190 Nguyen Van Huong District 2 2008 High-end 270 2,1002 Cantavil Premier Ha Noi Highway District 2 2010 High-end 200 1,7203 Canh Vien 3 Nam Vien Area, PMH District 7 2011 High-end 116 1,9904 C.T Leman Plaza 117 Nguyen Dinh Chieu District 3 2011 High-end 200 4,2005 Star Hill Commercial Area, PMH District 7 2012 High-end 351 2,0006 The Vista (Tower 4) Ha Noi Highway District 7 2013 High-end 141 1,4707 The Prince Residence Nguyen Van Troi Phu Nhuan 2013 High-end 282 2,190
High-end developments
1 Everrich 2 422 Dao Tri District 7 2010 Mid-end 3,125 1,3502 Thao Dien Pearl 12 Quoc Huong District 2 2010 Mid-end 450 1,6703 Saigon Airport Plaza 1 Bach Dang Tan Binh 2011 Mid-end 242 1,8004 Tropic Garden Nguyen Van Huong District 2 2012 Mid-end 388 1,2005 Happy Valley Nguyen Van Linh, PMH District 7 2012 Mid-end 818 1,6706 Sunrise City (Central + North) Nguyen Huu Tho District 7 2013 Mid-end 1,500 1,550
Mid-end developments1 Topaz Garden Trinh DInh Thao Tan Phu 2014 Affordable 212 6102 Ngoc Khanh Tower Nguyen Bieu District 5 2014 Mid-end 99 1,2603 8x Thai An Phan Huy Ich Go Va[ 2014 Affordable 200 6504 The Park Residence Nguyen Huu Tho District 7 2014 Mid-end 716 7155 Parc Spring Nguyen Duy Trinh District 2 2014 Affordable 265 850
New launches in 2Q 2014
HCMC Condominium Market Overview
* US$/ sq. m
P.8 | Colliers International
ForecastSteady take-up of new launchs given gain of market confidence > We expect constant absorption rate from new market supply till the end of this year given growth in market confidence.
> Efficient-sized flats selling at US$700 per sq. m will remain the most sought-after products because of acceptable
expenses and eligible elements for financial support from 30 Trillion Package.
> Existing developments face competitive pressure leading to strategic changes of (1) rebrand project with new pricing
approach and marketing strategy or (2) transfer project, mostly via loan acquisition.
HO CHI MINH CITY | 2Q 2014 | SERVICED APARTMENT MARKET
P.9 | Colliers International
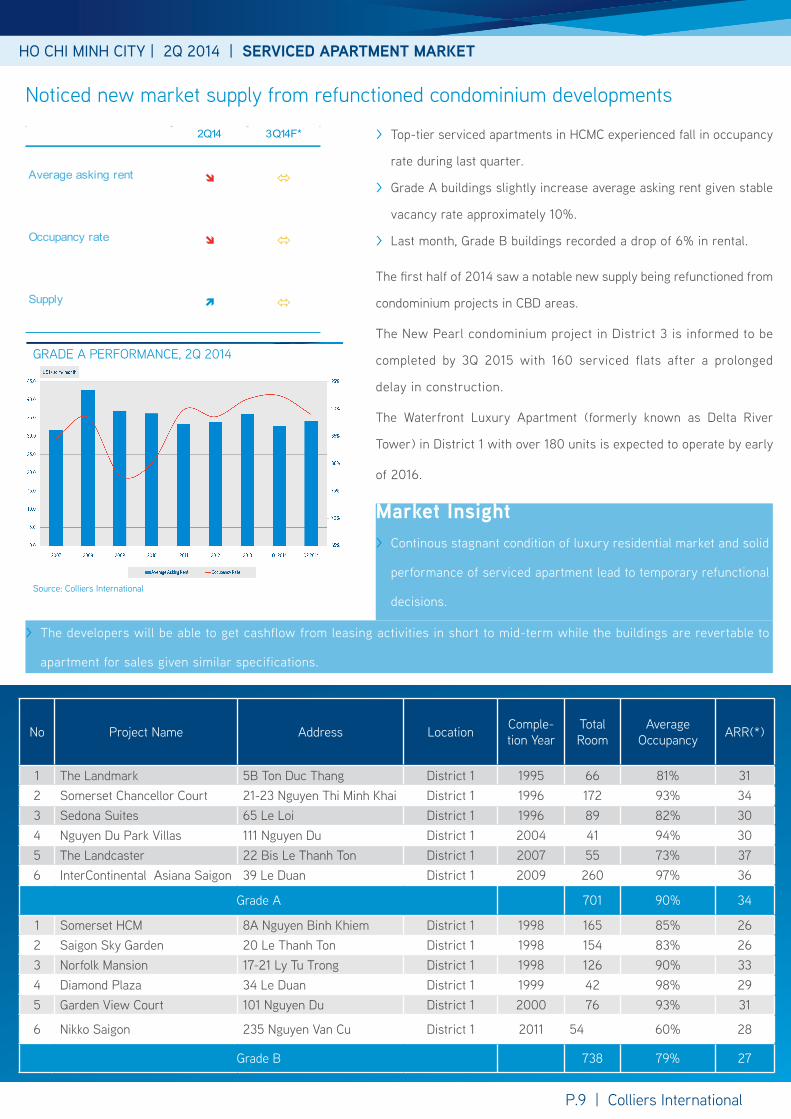
> Top-tier serviced apartments in HCMC experienced fall in occupancy
rate during last quarter.
> Grade A buildings slightly increase average asking rent given stable
vacancy rate approximately 10%.
> Last month, Grade B buildings recorded a drop of 6% in rental.
Market Insight > Continous stagnant condition of luxury residential market and solid
performance of serviced apartment lead to temporary refunctional
decisions.
2Q14 3Q14F*
Average asking rent
Occupancy rate
Supply
GRADE A PERFORMANCE, 2Q 2014
Source: Colliers International
Noticed new market supply from refunctioned condominium developments
The first half of 2014 saw a notable new supply being refunctioned from
condominium projects in CBD areas.
The New Pearl condominium project in District 3 is informed to be
completed by 3Q 2015 with 160 serviced flats after a prolonged
delay in construction.
The Waterfront Luxury Apartment (formerly known as Delta River
Tower) in District 1 with over 180 units is expected to operate by early
of 2016.
No Project Name Address Location Comple-tion Year
Total Room
Average Occupancy ARR(*)
1 The Landmark 5B Ton Duc Thang District 1 1995 66 81% 312 Somerset Chancellor Court 21-23 Nguyen Thi Minh Khai District 1 1996 172 93% 343 Sedona Suites 65 Le Loi District 1 1996 89 82% 304 Nguyen Du Park Villas 111 Nguyen Du District 1 2004 41 94% 305 The Landcaster 22 Bis Le Thanh Ton District 1 2007 55 73% 376 InterContinental Asiana Saigon 39 Le Duan District 1 2009 260 97% 36
Grade A 701 90% 34
1 Somerset HCM 8A Nguyen Binh Khiem District 1 1998 165 85% 262 Saigon Sky Garden 20 Le Thanh Ton District 1 1998 154 83% 263 Norfolk Mansion 17-21 Ly Tu Trong District 1 1998 126 90% 334 Diamond Plaza 34 Le Duan District 1 1999 42 98% 295 Garden View Court 101 Nguyen Du District 1 2000 76 93% 31
6 Nikko Saigon 235 Nguyen Van Cu District 1 2011 54 60% 28
Grade B 738 79% 27
> The developers will be able to get cashflow from leasing activities in short to mid-term while the buildings are revertable to
apartment for sales given similar specifications.
HO CHI MINH CITY | 2Q 2014 | INDUSTRIAL MARKET
P.10 | Colliers International
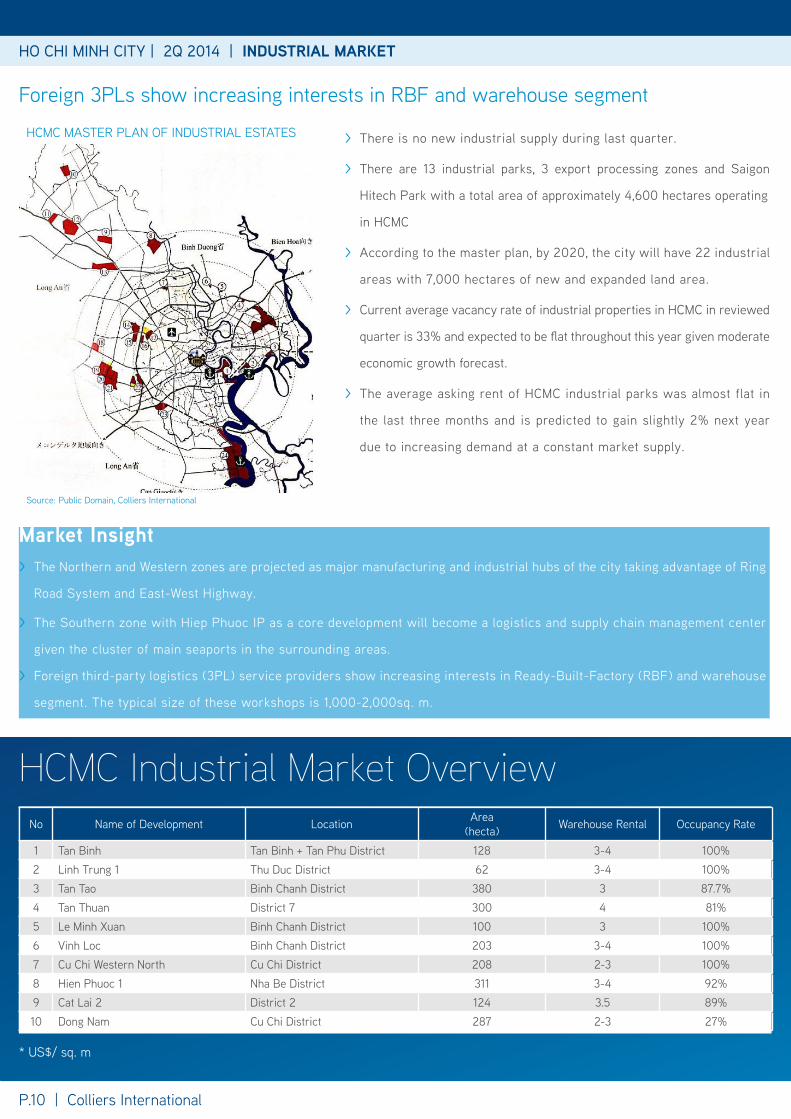
> There is no new industrial supply during last quarter.
> There are 13 industrial parks, 3 export processing zones and Saigon
Hitech Park with a total area of approximately 4,600 hectares operating
in HCMC
> According to the master plan, by 2020, the city will have 22 industrial
areas with 7,000 hectares of new and expanded land area.
> Current average vacancy rate of industrial properties in HCMC in reviewed
quarter is 33% and expected to be flat throughout this year given moderate
economic growth forecast.
> The average asking rent of HCMC industrial parks was almost flat in
the last three months and is predicted to gain slightly 2% next year
due to increasing demand at a constant market supply.
HCMC MASTER PLAN OF INDUSTRIAL ESTATES
Source: Public Domain, Colliers International
Foreign 3PLs show increasing interests in RBF and warehouse segment
HCMC Industrial Market OverviewNo Name of Development Location Area
(hecta) Warehouse Rental Occupancy Rate
1 Tan Binh Tan Binh + Tan Phu District 128 3-4 100%2 Linh Trung 1 Thu Duc District 62 3-4 100%3 Tan Tao Binh Chanh District 380 3 87.7%4 Tan Thuan District 7 300 4 81%5 Le Minh Xuan Binh Chanh District 100 3 100%6 Vinh Loc Binh Chanh District 203 3-4 100%7 Cu Chi Western North Cu Chi District 208 2-3 100%8 Hien Phuoc 1 Nha Be District 311 3-4 92%9 Cat Lai 2 District 2 124 3.5 89%10 Dong Nam Cu Chi District 287 2-3 27%
* US$/ sq. m
Market Insight > The Northern and Western zones are projected as major manufacturing and industrial hubs of the city taking advantage of Ring
Road System and East-West Highway.
> The Southern zone with Hiep Phuoc IP as a core development will become a logistics and supply chain management center
given the cluster of main seaports in the surrounding areas.
> Foreign third-party logistics (3PL) service providers show increasing interests in Ready-Built-Factory (RBF) and warehouse
segment. The typical size of these workshops is 1,000-2,000sq. m.

HANOI | 2Q 2014 | PROPERTY MARKET
HANOI | 2Q 2014 | PROPERTY MARKET
Hanoi Property Market Overview
Keangnam Hanoi Landmark Tower
P.11 | Colliers International
GRADE A OFFICE PERFORMANCE
Source: Colliers International
FUTURE SUPPLY BY DISTRICT
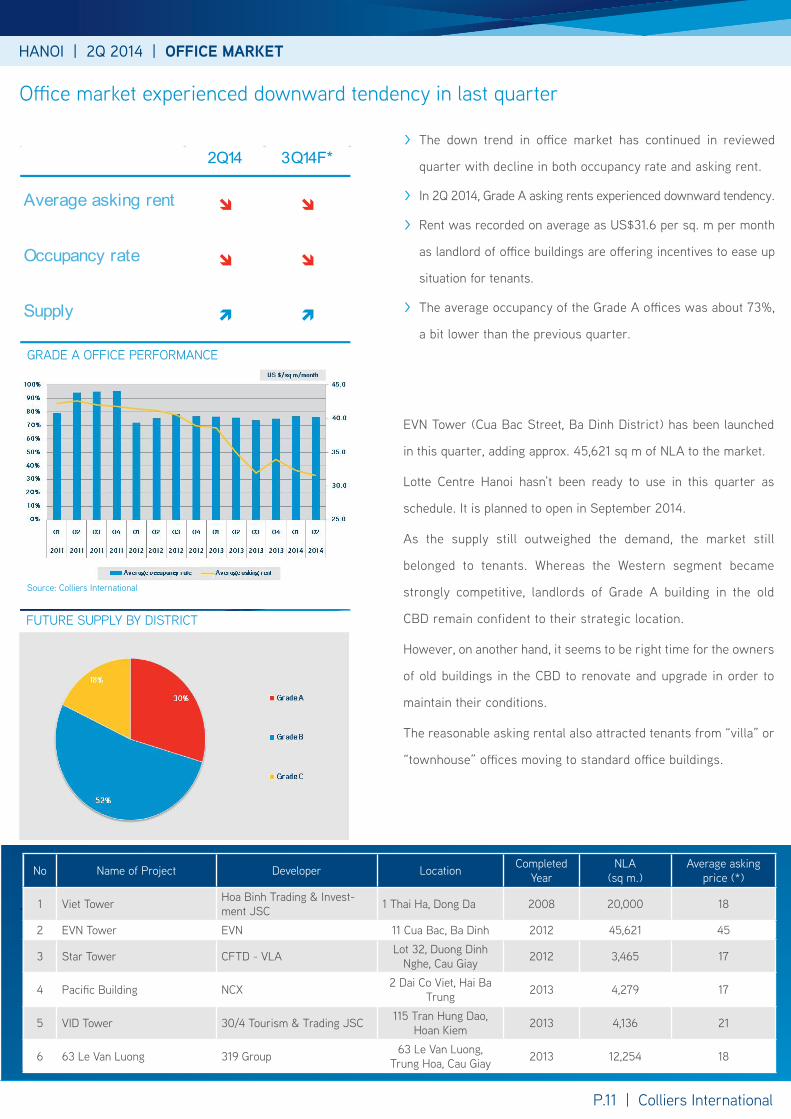
Office market experienced downward tendency in last quarter
> The down trend in office market has continued in reviewed
quarter with decline in both occupancy rate and asking rent.
> In 2Q 2014, Grade A asking rents experienced downward tendency.
> Rent was recorded on average as US$31.6 per sq. m per month
as landlord of office buildings are offering incentives to ease up
situation for tenants.
> The average occupancy of the Grade A offices was about 73%,
a bit lower than the previous quarter.
2Q14 3Q14F*
Average asking rent
Occupancy rate
Supply
HANOI | 2Q 2014 | OFFICE MARKET
EVN Tower (Cua Bac Street, Ba Dinh District) has been launched
in this quarter, adding approx. 45,621 sq m of NLA to the market.
Lotte Centre Hanoi hasn’t been ready to use in this quarter as
schedule. It is planned to open in September 2014.
As the supply still outweighed the demand, the market still
belonged to tenants. Whereas the Western segment became
strongly competitive, landlords of Grade A building in the old
CBD remain confident to their strategic location.
However, on another hand, it seems to be right time for the owners
of old buildings in the CBD to renovate and upgrade in order to
maintain their conditions.
The reasonable asking rental also attracted tenants from “villa” or
“townhouse” offices moving to standard office buildings.
Source: Colliers International
No Name of Project Developer Location Completed Year
NLA(sq m.)
Average asking price (*)
1 Viet Tower Hoa Binh Trading & Invest-ment JSC 1 Thai Ha, Dong Da 2008 20,000 18
2 EVN Tower EVN 11 Cua Bac, Ba Dinh 2012 45,621 45
3 Star Tower CFTD - VLA Lot 32, Duong Dinh Nghe, Cau Giay 2012 3,465 17
4 Pacific Building NCX 2 Dai Co Viet, Hai Ba Trung 2013 4,279 17
5 VID Tower 30/4 Tourism & Trading JSC 115 Tran Hung Dao, Hoan Kiem 2013 4,136 21
6 63 Le Van Luong 319 Group 63 Le Van Luong, Trung Hoa, Cau Giay 2013 12,254 18
HANOI | 2Q 2014 | OFFICE MARKET
MARKET SUPPLY, 2Q 2014
HANOI | 2Q 2014 | RETAIL MARKET
P.12 | Colliers International
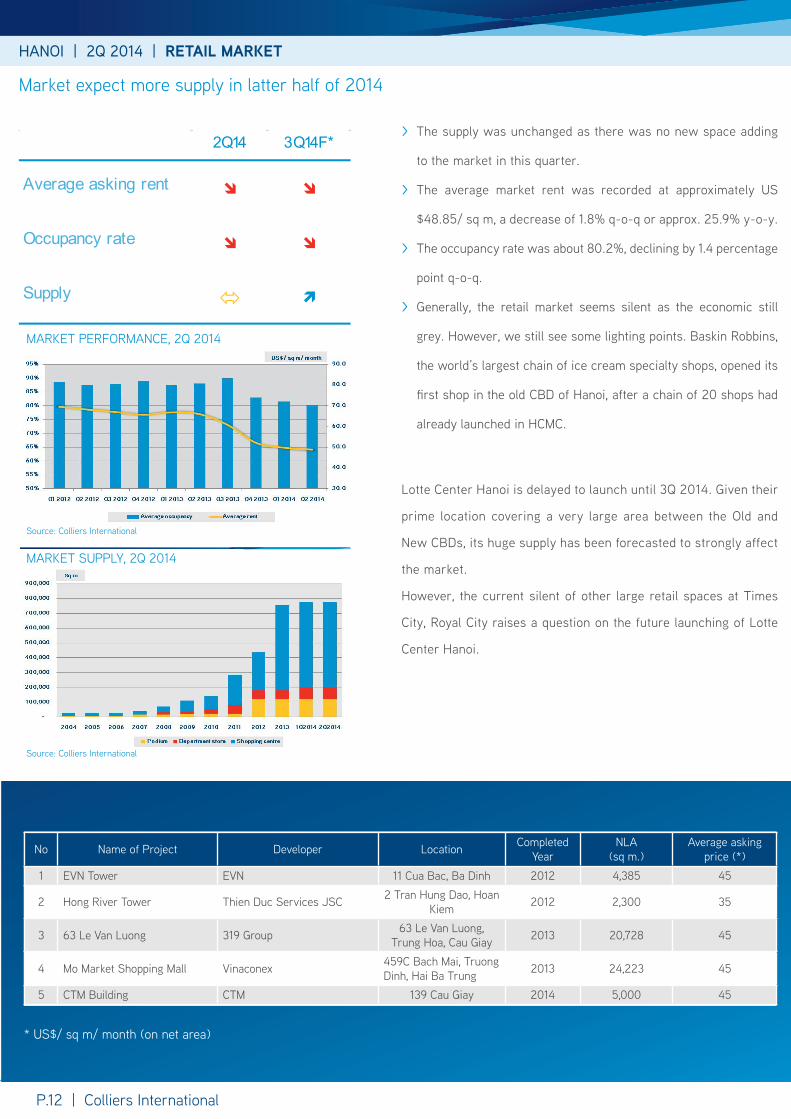
> The supply was unchanged as there was no new space adding
to the market in this quarter.
> The average market rent was recorded at approximately US
$48.85/ sq m, a decrease of 1.8% q-o-q or approx. 25.9% y-o-y.
> The occupancy rate was about 80.2%, declining by 1.4 percentage
point q-o-q.
> Generally, the retail market seems silent as the economic still
grey. However, we still see some lighting points. Baskin Robbins,
the world’s largest chain of ice cream specialty shops, opened its
first shop in the old CBD of Hanoi, after a chain of 20 shops had
already launched in HCMC.
MARKET PERFORMANCE, 2Q 2014
Source: Colliers International
Source: Colliers International
Market expect more supply in latter half of 2014
Lotte Center Hanoi is delayed to launch until 3Q 2014. Given their
prime location covering a very large area between the Old and
New CBDs, its huge supply has been forecasted to strongly affect
the market.
However, the current silent of other large retail spaces at Times
City, Royal City raises a question on the future launching of Lotte
Center Hanoi.
2Q14 3Q14F*
Average asking rent
Occupancy rate
Supply
No Name of Project Developer Location Completed Year
NLA(sq m.)
Average asking price (*)
1 EVN Tower EVN 11 Cua Bac, Ba Dinh 2012 4,385 45
2 Hong River Tower Thien Duc Services JSC 2 Tran Hung Dao, Hoan Kiem 2012 2,300 35
3 63 Le Van Luong 319 Group 63 Le Van Luong, Trung Hoa, Cau Giay 2013 20,728 45
4 Mo Market Shopping Mall Vinaconex 459C Bach Mai, Truong Dinh, Hai Ba Trung 2013 24,223 45
5 CTM Building CTM 139 Cau Giay 2014 5,000 45
* US$/ sq m/ month (on net area)
HANOI | 2Q 2014 | RESIDENTIAL MARKET
P.13 | Colliers International
PRIMARY MARKET PERFORMANCE, 2Q 2014
Source: Colliers International
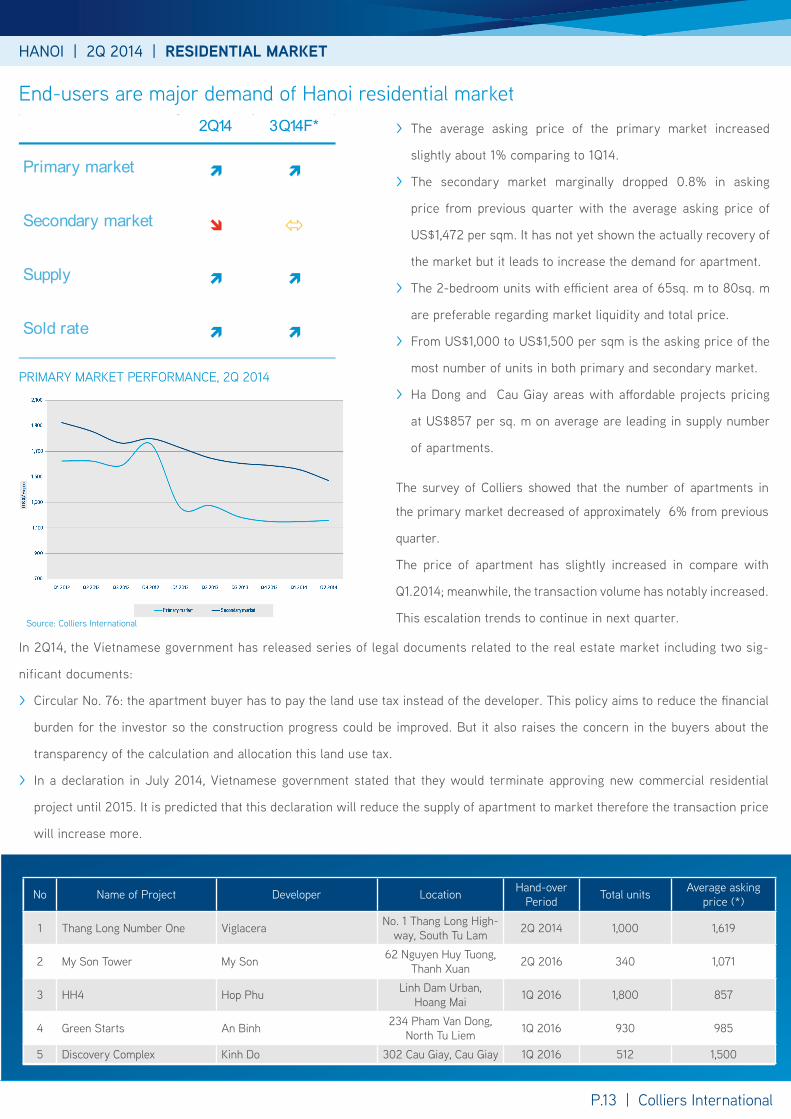
End-users are major demand of Hanoi residential market > The average asking price of the primary market increased
slightly about 1% comparing to 1Q14.
> The secondary market marginally dropped 0.8% in asking
price from previous quarter with the average asking price of
US$1,472 per sqm. It has not yet shown the actually recovery of
the market but it leads to increase the demand for apartment.
> The 2-bedroom units with efficient area of 65sq. m to 80sq. m
are preferable regarding market liquidity and total price.
> From US$1,000 to US$1,500 per sqm is the asking price of the
most number of units in both primary and secondary market.
> Ha Dong and Cau Giay areas with affordable projects pricing
at US$857 per sq. m on average are leading in supply number
of apartments.
2Q14 3Q14F*
Primary market
Secondary market
Supply
Sold rate
The survey of Colliers showed that the number of apartments in
the primary market decreased of approximately 6% from previous
quarter.
The price of apartment has slightly increased in compare with
Q1.2014; meanwhile, the transaction volume has notably increased.
This escalation trends to continue in next quarter.
In 2Q14, the Vietnamese government has released series of legal documents related to the real estate market including two sig-
nificant documents:
> Circular No. 76: the apartment buyer has to pay the land use tax instead of the developer. This policy aims to reduce the financial
burden for the investor so the construction progress could be improved. But it also raises the concern in the buyers about the
transparency of the calculation and allocation this land use tax.
> In a declaration in July 2014, Vietnamese government stated that they would terminate approving new commercial residential
project until 2015. It is predicted that this declaration will reduce the supply of apartment to market therefore the transaction price
will increase more.
No Name of Project Developer Location Hand-over Period Total units Average asking
price (*)
1 Thang Long Number One Viglacera No. 1 Thang Long High-way, South Tu Lam 2Q 2014 1,000 1,619
2 My Son Tower My Son 62 Nguyen Huy Tuong, Thanh Xuan 2Q 2016 340 1,071
3 HH4 Hop Phu Linh Dam Urban, Hoang Mai 1Q 2016 1,800 857
4 Green Starts An Binh 234 Pham Van Dong, North Tu Liem 1Q 2016 930 985
5 Discovery Complex Kinh Do 302 Cau Giay, Cau Giay 1Q 2016 512 1,500

P.13 | Colliers International
KNOWLEDGE REPORT | 2Q 2014 | VIETNAM
With more than 100 professionals in 2 offices in Vietnam, the team is market driven and has proven and successful track record with both international and local experience.
From Hanoi to Ho Chi Minh City, we provide a full range of real estate services
•Research > Market research across all sectors > Market analysis, advisory, and strategy
•Valuation & Advisory Services > Valuation for land, existing property or development sites > Feasibility studies to determine NPV, IRR and highest & best use
•Office Services > Tenant Representation > Landlord Representation
•Residential Sales & Leasing
•Retail Services
• Investment Services
•Real Estate Management Services
•Corporate Services
• Industrial Leasing
The foundation of our services is the strength and depth of our experience.
COLLIERS INTERNATIONAL
HO CHI MINH CITYBitexco Office Building, 7th Floor19-25 Nguyen Hue StreetDistrict 1, HCM City, VietnamTel: + 84 8 3827 5665
HANOICapital Tower, 10th Floor109 Tran Hung Dao Street, Hoan Kiem District, Hanoi, VietnamTel: +84 4 3941 3277
485 offices in63 countries on6 continents
Accelerating success
QUANG NGUYENResearch [email protected]+84 938 056 603
About Colliers InternationalColliers International is a leader in global real estate services, defined by our spirit of enterprise.Through a culture of service excellence and a shared sense of initiative, we integrate the resources of real estate specialists worldwide to accelerate the success of our partners.
We connect through a shared set of values that shape a collaborative environment throughout our organization that is unsurpassed in the industry.
Publication Coverage Frequency Content Availability
Research & Forecast Report
Vietnam Cities Quarterly All market sectors Publicly available
CBD Report HCMC CBD Monthly Office, Retail, Hotel and Serviced Apartment
Publicly available
Asia Pacific Office Report
Asia Pacific in-cluding Vietnam
Quarterly Office market Publicly available
Vietnam Property Market Report
Vietnam cities Quarterly All market sectors On subscription
Development Recommendation
Vietnam cities At request All market sectors On subscription
$2billion in annual revenue
2.5billion square feet under management
15,700professionalsand staff
www.colliers.com/vietnam
Please contact, If you would like to recieve our other research reports
LINH PHAMResearch [email protected]+84 912 013 536
This document has been prepared by Colliers International for advertising and general information only. Colliers International makes no guarantees, representations or warranties of any kind, expressed or implied, regarding the information including, but not limited to, warranties of content, accuracy and reliability. Any interested party should undertake their own inquiries as to the accuracy of the information. Colliers International excludes unequivocally all inferred or implied terms, conditions and warranties arising out of this document and excludes all liability for loss and damages arising there from. This publication is the copyrighted property of Colliers International and/or its licensor(s). ©2013. All rights reserved.
YEN NGUYENResearch [email protected]+84 915 478 778