Embed Size (px)
Citation preview

04/28/2014Clarus MarketMetrics®Information not guaranteed. © 2014 - 2015 Terradatum and its suppliers and licensors (www.terradatum.com/about/licensors.td).
Connor and Paris MacIVORRE/MAX's Paris911 Team
Market Dynamics
1 of 19

Q1 2014485,000
Q1 2011417,500
%+16%
Change67,500
Q1 2011 vs. Q1 2014: The median sold price is up 16%Median Sold Price by Quarter
RE/MAX's Paris911 Team
Q1 2011 vs. Q1 2014
Connor and Paris MacIVOR
Clarus MarketMetrics® 1 of 2 04/28/2014Information not guaranteed. © 2014 - 2015 Terradatum and its suppliers and licensors (www.terradatum.com/about/licensors.td).
AllBathrooms:MLS: AllAllSq Ft:
ValenciaResidential: (Single Family Residence)Period: All All
Property Types:Cities:
AllConstruction Type:Price: Lot Size:Bedrooms:3 years (quarterly)CRMLS
2 of 19

Median Sold Price by QuarterQ1 2011 vs. Q1 2014: The median sold price is up 16%
RE/MAX's Paris911 TeamConnor and Paris MacIVOR
Time Period Median Price # Units Average DOMQ1 2014 485,000 131 63Q4 2013 476,000 171 55Q3 2013 480,000 179 43Q2 2013 460,000 198 44Q1 2013 437,500 143 57Q4 2012 450,000 164 81Q3 2012 415,000 169 96Q2 2012 407,700 202 81Q1 2012 389,900 147 116Q4 2011 382,000 169 96Q3 2011 412,500 172 93Q2 2011 406,500 171 105Q1 2011 417,500 118 103
Clarus MarketMetrics® 2 of 2 04/28/2014Information not guaranteed. © 2014 - 2015 Terradatum and its suppliers and licensors (www.terradatum.com/about/licensors.td).
3 of 19

Q1 11 vs. Q1 14: The median price of for sale properties is up 28% and the median price of sold properties is up 16%
RE/MAX's Paris911 Team
Q1 2011 vs. Q1 2014
430,000 +28%
Connor and Paris MacIVOR
550,000Q1 2014
Median For Sale vs. Median Sold
ChangeQ1 2011 %120,000
Q1 2011 Q1 2014 %417,500 +16%
Q1 2011 vs. Q1 2014
485,000Change67,500
Clarus MarketMetrics® 1 of 2 04/28/2014Information not guaranteed. © 2014 - 2015 Terradatum and its suppliers and licensors (www.terradatum.com/about/licensors.td).
AllBathrooms:MLS: AllAllSq Ft:
ValenciaResidential: (Single Family Residence)Period: All All
Property Types:Cities:
AllConstruction Type:Price: Lot Size:Bedrooms:3 years (quarterly)CRMLS
4 of 19

Median For Sale vs. Median SoldQ1 11 vs. Q1 14: The median price of for sale properties is up 28% and the median price of sold properties is up 16%
RE/MAX's Paris911 TeamConnor and Paris MacIVOR
Time Period For SaleMedian SoldMedianFor Sale # Properties # PropertiesSold Price
Difference
Q1 2014 343 131550,000 485,000 -65,000Q4 2013 307 171529,999 476,000 -53,999Q3 2013 377 179525,000 480,000 -45,000Q2 2013 328 198484,900 460,000 -24,900Q1 2013 274 143469,450 437,500 -31,950Q4 2012 238 164449,450 450,000 550Q3 2012 327 169460,000 415,000 -45,000Q2 2012 399 202439,500 407,700 -31,800Q1 2012 437 147415,000 389,900 -25,100Q4 2011 442 169415,000 382,000 -33,000Q3 2011 486 172418,995 412,500 -6,495Q2 2011 515 171425,000 406,500 -18,500Q1 2011 484 118430,000 417,500 -12,500
Clarus MarketMetrics®Information not guaranteed. © 2014 - 2015 Terradatum and its suppliers and licensors (www.terradatum.com/about/licensors.td).
2 of 2 04/28/2014
5 of 19

Q1 2014131
Q1 2011118
%+11%
Change13
Q1 2011 vs. Q1 2014: The number of Sold properties is up 11%Sold Properties by Quarter
RE/MAX's Paris911 Team
Q1 2011 vs. Q1 2014
Connor and Paris MacIVOR
Clarus MarketMetrics® 1 of 2 04/28/2014Information not guaranteed. © 2014 - 2015 Terradatum and its suppliers and licensors (www.terradatum.com/about/licensors.td).
AllBathrooms:MLS: AllAllSq Ft:
ValenciaResidential: (Single Family Residence)Period: All All
Property Types:Cities:
AllConstruction Type:Price: Lot Size:Bedrooms:3 years (quarterly)CRMLS
6 of 19

Sold Properties by QuarterQ1 2011 vs. Q1 2014: The number of Sold properties is up 11%
RE/MAX's Paris911 TeamConnor and Paris MacIVOR
Time Period
Full Market# Properties Median Price Average DOM
Bank Properties# Properties % Bank Median Price
Non-Bank Properties# Properties % Non-Bank Median Price
Q1 2014 485,000131 63 16 12.2 428,500 115 87.8 490,000Q4 2013 476,000171 55 24 14.0 430,000 147 86.0 495,000Q3 2013 480,000179 43 29 16.2 400,000 150 83.8 494,500Q2 2013 460,000198 44 41 20.7 405,000 157 79.3 480,000Q1 2013 437,500143 57 51 35.7 361,000 92 64.3 461,000Q4 2012 450,000164 81 75 45.7 390,000 89 54.3 475,000Q3 2012 415,000169 96 83 49.1 366,500 86 50.9 449,250Q2 2012 407,700202 81 93 46.0 375,000 109 54.0 455,000Q1 2012 389,900147 116 85 57.8 362,500 62 42.2 420,000Q4 2011 382,000169 96 86 50.9 350,000 83 49.1 404,500Q3 2011 412,500172 93 78 45.4 357,500 94 54.6 442,500Q2 2011 406,500171 105 80 46.8 374,950 91 53.2 425,000Q1 2011 417,500118 103 65 55.1 390,000 53 44.9 470,000
Clarus MarketMetrics® 2 of 2 04/28/2014Information not guaranteed. © 2014 - 2015 Terradatum and its suppliers and licensors (www.terradatum.com/about/licensors.td).
7 of 19

Q1 2014169
Q1 2011148
%+14%
Change21
Q1 2011 vs. Q1 2014: The number of Under Contract properties is up 14%Under Contract Properties by Quarter
RE/MAX's Paris911 Team
Q1 2011 vs. Q1 2014
Connor and Paris MacIVOR
Clarus MarketMetrics® 1 of 2 04/28/2014Information not guaranteed. © 2014 - 2015 Terradatum and its suppliers and licensors (www.terradatum.com/about/licensors.td).
AllBathrooms:MLS: AllAllSq Ft:
ValenciaResidential: (Single Family Residence)Period: All All
Property Types:Cities:
AllConstruction Type:Price: Lot Size:Bedrooms:3 years (quarterly)CRMLS
8 of 19

Under Contract Properties by QuarterQ1 2011 vs. Q1 2014: The number of Under Contract properties is up 14%
RE/MAX's Paris911 TeamConnor and Paris MacIVOR
Time Period
Full Market# Properties Median Price Average DOM
Bank Properties# Properties % Bank Median Price
Non-Bank Properties# Properties % Non-Bank Median Price
Q1 2014 520,000169 56 520,00087.0147520,00013.022Q4 2013 484,800145 59 484,95089.7130423,00010.315Q3 2013 499,000164 52 509,00084.8139437,50015.225Q2 2013 465,600183 33 475,00086.9159430,00013.124Q1 2013 449,450172 52 477,40074.4128362,50025.644Q4 2012 430,000133 66 454,00060.981359,95039.152Q3 2012 436,250176 82 475,00053.494396,35046.682Q2 2012 419,990203 81 455,49553.2108384,90046.895Q1 2012 399,450192 107 449,45041.780355,00058.3112Q4 2011 398,000151 105 427,00042.464374,90057.687Q3 2011 399,999163 94 439,50054.088375,00046.075Q2 2011 409,925182 102 435,17456.0102362,50044.080Q1 2011 415,000148 101 454,50046.068387,40054.080
Clarus MarketMetrics® 2 of 2 04/28/2014Information not guaranteed. © 2014 - 2015 Terradatum and its suppliers and licensors (www.terradatum.com/about/licensors.td).
9 of 19
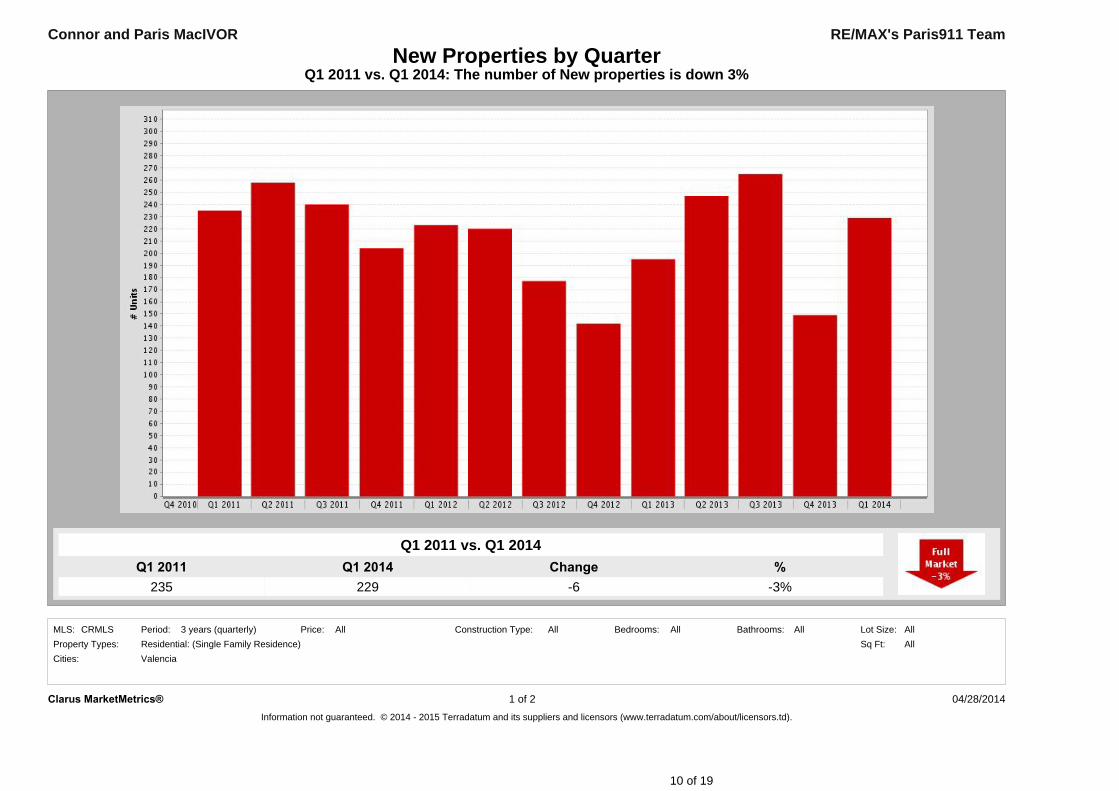
Q1 2014229
Q1 2011235
%-3%
Change-6
Q1 2011 vs. Q1 2014: The number of New properties is down 3%New Properties by Quarter
RE/MAX's Paris911 Team
Q1 2011 vs. Q1 2014
Connor and Paris MacIVOR
Clarus MarketMetrics® 1 of 2 04/28/2014Information not guaranteed. © 2014 - 2015 Terradatum and its suppliers and licensors (www.terradatum.com/about/licensors.td).
AllBathrooms:MLS: AllAllSq Ft:
ValenciaResidential: (Single Family Residence)Period: All All
Property Types:Cities:
AllConstruction Type:Price: Lot Size:Bedrooms:3 years (quarterly)CRMLS
10 of 19

New Properties by QuarterQ1 2011 vs. Q1 2014: The number of New properties is down 3%
RE/MAX's Paris911 TeamConnor and Paris MacIVOR
Time Period # Properties
Full MarketMedian Price
Bank Properties# Properties % Bank Median Price
Non-Bank Properties# Properties % Non-Bank Median Price
Q1 2014 545,000229 19 8.3 510,000 210 91.7 549,942Q4 2013 500,000149 14 9.4 437,400 135 90.6 515,000Q3 2013 525,000265 41 15.5 449,000 224 84.5 539,450Q2 2013 479,900247 27 10.9 429,900 220 89.1 499,000Q1 2013 469,900195 33 16.9 375,000 162 83.1 489,900Q4 2012 430,000142 61 43.0 379,900 81 57.0 450,000Q3 2012 459,900177 74 41.8 392,000 103 58.2 510,000Q2 2012 437,250220 92 41.8 364,500 128 58.2 475,000Q1 2012 419,000223 117 52.5 379,900 106 47.5 469,450Q4 2011 415,000204 107 52.5 365,563 97 47.5 475,000Q3 2011 416,100240 117 48.8 375,000 123 51.2 459,900Q2 2011 417,000258 114 44.2 359,450 144 55.8 450,000Q1 2011 439,900235 122 51.9 375,000 113 48.1 489,000
Clarus MarketMetrics® 2 of 2 04/28/2014Information not guaranteed. © 2014 - 2015 Terradatum and its suppliers and licensors (www.terradatum.com/about/licensors.td).
11 of 19
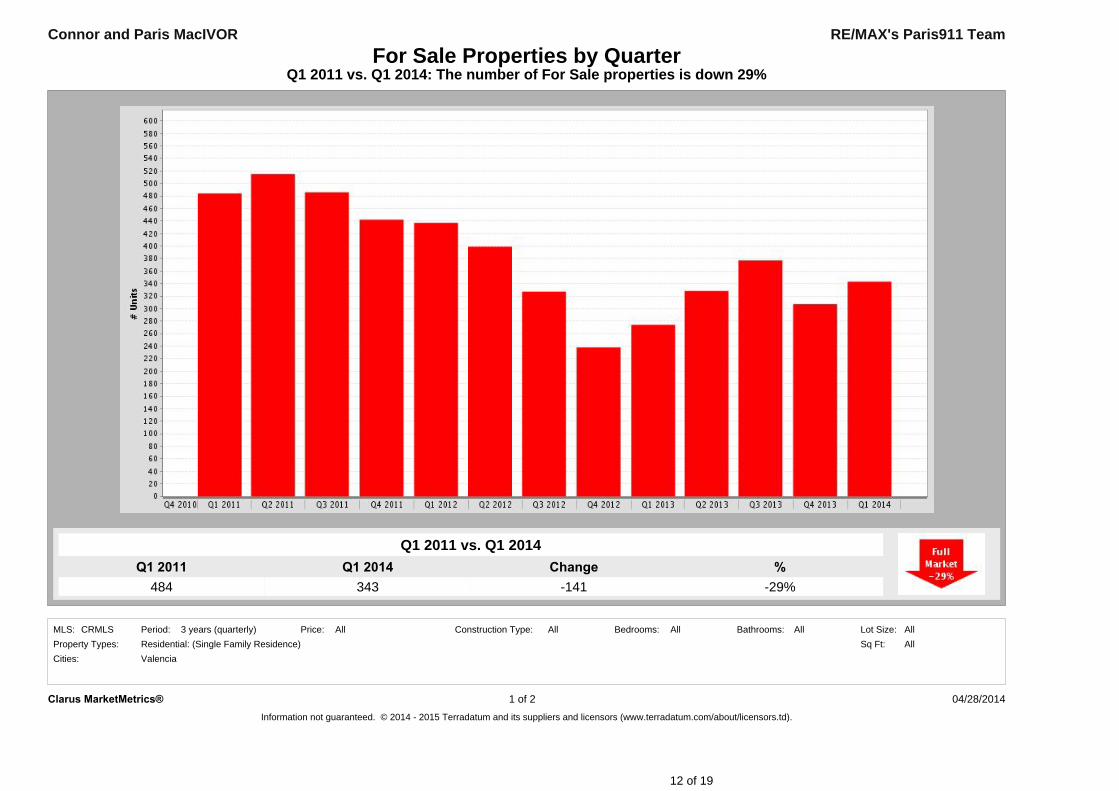
Q1 2014343
Q1 2011484
%-29%
Change-141
Q1 2011 vs. Q1 2014: The number of For Sale properties is down 29%For Sale Properties by Quarter
RE/MAX's Paris911 Team
Q1 2011 vs. Q1 2014
Connor and Paris MacIVOR
Clarus MarketMetrics® 1 of 2 04/28/2014Information not guaranteed. © 2014 - 2015 Terradatum and its suppliers and licensors (www.terradatum.com/about/licensors.td).
AllBathrooms:MLS: AllAllSq Ft:
ValenciaResidential: (Single Family Residence)Period: All All
Property Types:Cities:
AllConstruction Type:Price: Lot Size:Bedrooms:3 years (quarterly)CRMLS
12 of 19
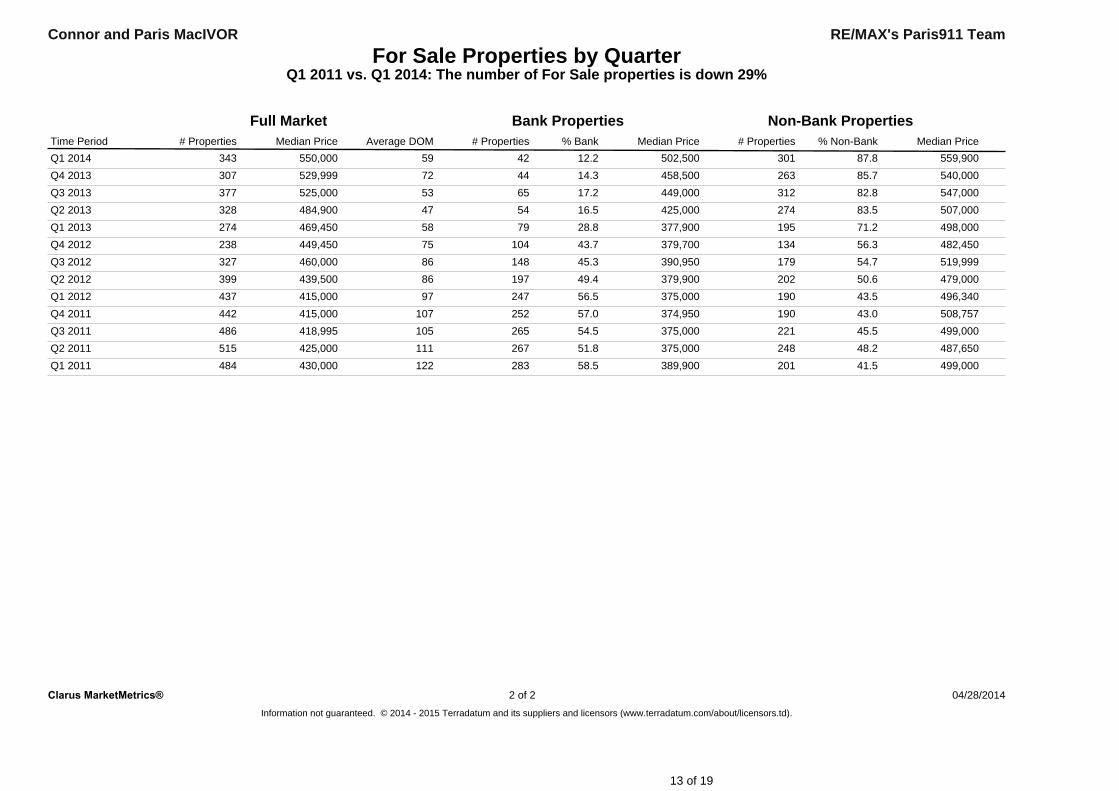
For Sale Properties by QuarterQ1 2011 vs. Q1 2014: The number of For Sale properties is down 29%
RE/MAX's Paris911 TeamConnor and Paris MacIVOR
# PropertiesTime Period
Full Market# Properties Median Price Average DOM
Bank Properties Non-Bank Properties% Bank Median Price # Properties % Non-Bank Median Price
Q1 2014 550,000343 59 42 12.2 502,500 301 87.8 559,900Q4 2013 529,999307 72 44 14.3 458,500 263 85.7 540,000Q3 2013 525,000377 53 65 17.2 449,000 312 82.8 547,000Q2 2013 484,900328 47 54 16.5 425,000 274 83.5 507,000Q1 2013 469,450274 58 79 28.8 377,900 195 71.2 498,000Q4 2012 449,450238 75 104 43.7 379,700 134 56.3 482,450Q3 2012 460,000327 86 148 45.3 390,950 179 54.7 519,999Q2 2012 439,500399 86 197 49.4 379,900 202 50.6 479,000Q1 2012 415,000437 97 247 56.5 375,000 190 43.5 496,340Q4 2011 415,000442 107 252 57.0 374,950 190 43.0 508,757Q3 2011 418,995486 105 265 54.5 375,000 221 45.5 499,000Q2 2011 425,000515 111 267 51.8 375,000 248 48.2 487,650Q1 2011 430,000484 122 283 58.5 389,900 201 41.5 499,000
Clarus MarketMetrics® 2 of 2 04/28/2014Information not guaranteed. © 2014 - 2015 Terradatum and its suppliers and licensors (www.terradatum.com/about/licensors.td).
13 of 19

Q1 201453
Q1 201179
%-33%
Change-26
Q1 2011 vs. Q1 2014: The number of Expired properties is down 33%Expired Properties by Quarter
RE/MAX's Paris911 Team
Q1 2011 vs. Q1 2014
Connor and Paris MacIVOR
Clarus MarketMetrics® 1 of 2 04/28/2014Information not guaranteed. © 2014 - 2015 Terradatum and its suppliers and licensors (www.terradatum.com/about/licensors.td).
AllBathrooms:MLS: AllAllSq Ft:
ValenciaResidential: (Single Family Residence)Period: All All
Property Types:Cities:
AllConstruction Type:Price: Lot Size:Bedrooms:3 years (quarterly)CRMLS
14 of 19
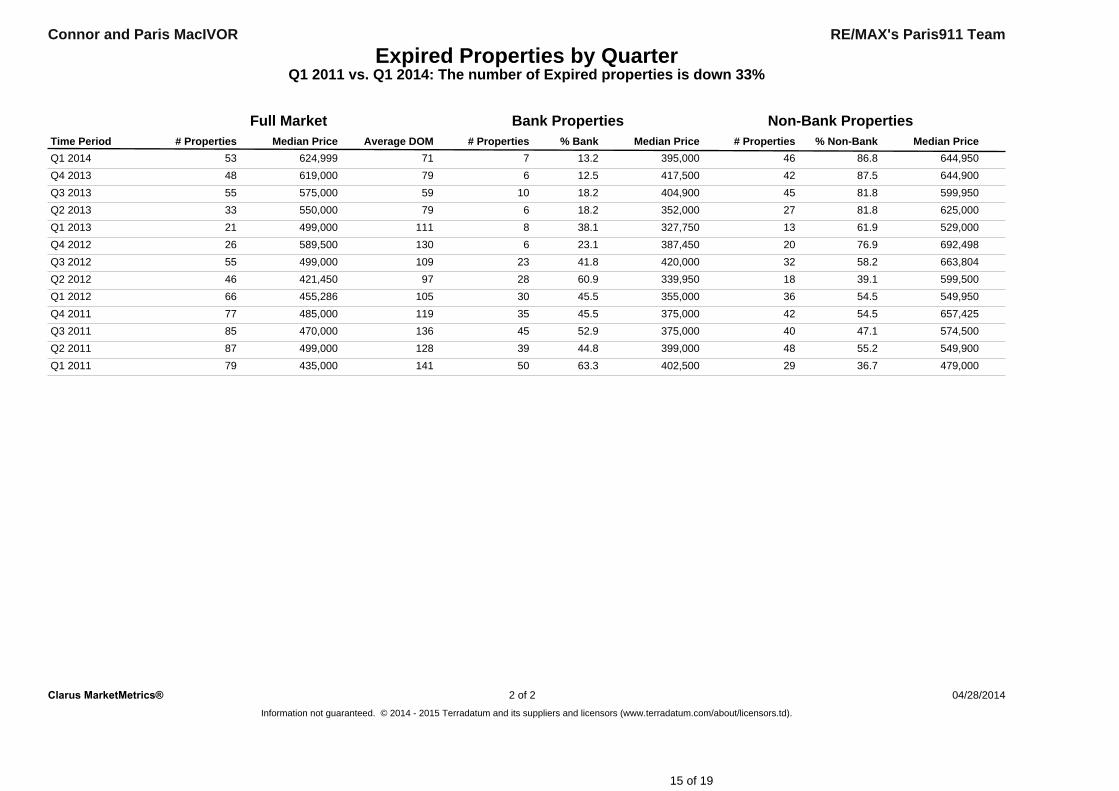
Expired Properties by QuarterQ1 2011 vs. Q1 2014: The number of Expired properties is down 33%
RE/MAX's Paris911 TeamConnor and Paris MacIVOR
Time Period Median Price# Properties Average DOM
Full Market# Properties % Bank Median Price Median Price# Properties
Bank Properties% Non-Bank
Non-Bank Properties
Q1 2014 624,99953 71 7 13.2 395,000 46 86.8 644,950Q4 2013 619,00048 79 6 12.5 417,500 42 87.5 644,900Q3 2013 575,00055 59 10 18.2 404,900 45 81.8 599,950Q2 2013 550,00033 79 6 18.2 352,000 27 81.8 625,000Q1 2013 499,00021 111 8 38.1 327,750 13 61.9 529,000Q4 2012 589,50026 130 6 23.1 387,450 20 76.9 692,498Q3 2012 499,00055 109 23 41.8 420,000 32 58.2 663,804Q2 2012 421,45046 97 28 60.9 339,950 18 39.1 599,500Q1 2012 455,28666 105 30 45.5 355,000 36 54.5 549,950Q4 2011 485,00077 119 35 45.5 375,000 42 54.5 657,425Q3 2011 470,00085 136 45 52.9 375,000 40 47.1 574,500Q2 2011 499,00087 128 39 44.8 399,000 48 55.2 549,900Q1 2011 435,00079 141 50 63.3 402,500 29 36.7 479,000
Clarus MarketMetrics® 2 of 2 04/28/2014Information not guaranteed. © 2014 - 2015 Terradatum and its suppliers and licensors (www.terradatum.com/about/licensors.td).
15 of 19

Q1 2011 vs. Q1 2014: The number of for sale properties is down 29% and the number of sold properties is up 11%
RE/MAX's Paris911 Team
Q1 2011 vs. Q1 2014
484 -29%
Connor and Paris MacIVOR
343Q1 2014
Supply & Demand by Quarter
ChangeQ1 2011 %-141
Q1 2011 Q1 2014 %118 +11%
Q1 2011 vs. Q1 2014
131Change
13
Clarus MarketMetrics® 1 of 2 04/28/2014Information not guaranteed. © 2014 - 2015 Terradatum and its suppliers and licensors (www.terradatum.com/about/licensors.td).
AllBathrooms:MLS: AllAllSq Ft:
ValenciaResidential: (Single Family Residence)Period: All All
Property Types:Cities:
AllConstruction Type:Price: Lot Size:Bedrooms:3 years (quarterly)CRMLS
16 of 19

Supply & Demand by QuarterQ1 2011 vs. Q1 2014: The number of for sale properties is down 29% and the number of sold properties is up 11%
Connor and Paris MacIVOR RE/MAX's Paris911 Team
Time Period For SaleFor Sale SoldSold# Properties Average DOM Average DOM# Properties
Q1 2014 59 63343 131Q4 2013 72 55307 171Q3 2013 53 43377 179Q2 2013 47 44328 198Q1 2013 58 57274 143Q4 2012 75 81238 164Q3 2012 86 96327 169Q2 2012 86 81399 202Q1 2012 97 116437 147Q4 2011 107 96442 169Q3 2011 105 93486 172Q2 2011 111 105515 171Q1 2011 122 103484 118
Clarus MarketMetrics® 2 of 2 04/28/2014Information not guaranteed. © 2014 - 2015 Terradatum and its suppliers and licensors (www.terradatum.com/about/licensors.td).
17 of 19

Q1 201456
Q1 2011101
%-44%
Change-45
Q1 2011 vs. Q1 2014: The average days on market is down 44%The Average Days on Market by Quarter
RE/MAX's Paris911 Team
Q1 2011 vs. Q1 2014
Connor and Paris MacIVOR
Clarus MarketMetrics® 1 of 2 04/28/2014Information not guaranteed. © 2014 - 2015 Terradatum and its suppliers and licensors (www.terradatum.com/about/licensors.td).
AllBathrooms:MLS: AllAllSq Ft:
ValenciaResidential: (Single Family Residence)Period: All All
Property Types:Cities:
AllConstruction Type:Price: Lot Size:Bedrooms:3 years (quarterly)CRMLS
18 of 19

The Average Days on Market by QuarterQ1 2011 vs. Q1 2014: The average days on market is down 44%
RE/MAX's Paris911 TeamConnor and Paris MacIVOR
Time Period # UC UnitsAverage DOMQ1 2014 16956Q4 2013 14559Q3 2013 16452Q2 2013 18333Q1 2013 17252Q4 2012 13366Q3 2012 17682Q2 2012 20381Q1 2012 192107Q4 2011 151105Q3 2011 16394Q2 2011 182102Q1 2011 148101
Clarus MarketMetrics® 2 of 2 04/28/2014Information not guaranteed. © 2014 - 2015 Terradatum and its suppliers and licensors (www.terradatum.com/about/licensors.td).
19 of 19


![Clase05 Remax]](https://img.pdfslide.us/doc/110x75/577c77921a28abe0548ca629/clase05-remax.jpg)