Embed Size (px)
Citation preview

CANADIAN HOUSING HEALTH CHECK
Risks contained despite some local overheating concerns
Nation-wide indicators continued to suggest that there is a low probability of a wide-
spread and steep downturn in Canada’s housing market in the next 12 months.
At the local level, indicators paint distinct risk profiles with overheating concerns
topping the list in Vancouver and Toronto, and weak economy posing the main threat
in Calgary.
Escalating prices in Vancouver and Toronto: Affordability-related risks continued
to increase significantly in Vancouver and Toronto this year, as prices accelerated
further, especially for single-detached homes. Vancouver, in particular, showed
strong signs of overheating, although recent declines in sales brought some cooling.
New BC tax on foreign buyers: The surprise introduction by the BC government of
a new 15% tax on home purchased by foreign nationals in Metro Vancouver added a
new layer of risk for the Vancouver market. The tax is without precedents in Canada
and substantially raises uncertainty in the short term.
Energy sector downturn: Modest increases in oil prices this year have been a posi-
tive development; yet, oil-producing provincial economies continue to face difficult
challenges, which maintains material negative risks for housing demand and prices in
Alberta and other oil industry sensitive markets in the near term.
Unemployment: Labour market-related risks eased at the national level in recent
months; however, they remain elevated in Alberta and Saskatchewan where the job-
less rate continued to rise to decades-high levels.
Condo construction boom: The risk of over-building has diminished considerably
this year. While condo units under construction remain historically elevated, complet-
ed but unsold inventories have come down in most markets. High levels of construc-
tion are part of the solution to ease resale market tightness in Vancouver and Toronto.
Housing policy: Ongoing concerns about housing affordability, government exposure
to housing and stability of hot housing markets and the financial system keep the odds
of policy intervention elevated.
Interest rates: The probability of an imminent interest rate hike is low and therefore
poses minimal short-term risks at this stage.
September 2016
Largest four housing markets
Toronto — Record-high resale activity
has been sustained so far in 2016.
Prices continue to accelerate, with
stronger gains registered in single-
detached segments—which remain in
short supply. Healthy condo absorption
has significantly mitigated earlier risks
posed by a spike in condo completions
in early 2015. Rapidly eroding afforda-
bility is a growing source of concern.
Montreal — The market took a pause
this spring after a solid start to the
year. A positive development recently
has been a notable decline in invento-
ries (both existing and newly built),
which firmed up market conditions.
Montreal’s overall vulnerability profile
is improving.
Vancouver — Extremely poor—and still
rapidly deteriorating—affordability is a
significant vulnerability. Home prices
have escalated at mind-boggling rates
(more than 30% y/y); however, resales
have begun to come down since reach-
ing an all-time high this winter. The
new BC tax on foreign buyers in Metro
Vancouver may lead to further sales
decline in the near term.
Calgary — Still under the weight of the
provincial recession. Weakening de-
mographics, surging unemployment
and rising inventories are growing
sources of concerns. Home resales
have recovered somewhat since hitting
a multi-year low at the start of 2016;
however, the scope for further gains is
limited in the near-term. Downward
pressure on prices is likely to persist.
Canada Vancouver Calgary Toronto Montreal
Affordability
Resale market balance
Rental market balance
Interest rates
Labour market
Demographics
New home inventory - singles
New home inventory - multiples
Homes under construction - singles
Homes under construction - multiples
Significantly outside historical norms and posing much higher risk than usual
Modestly outside historical norms and posing moderately higher risk than usual
Within historical norms or not posing any immediate threat
Monitoring dashboard
Craig Wright
Chief Economist
(416) 974-7457
Robert Hogue
Senior Economist
416-974-6192

CANADIAN HOUSING HEALTH CHECK | SEPTEMBER 2016
2
Background
Canadian Housing Health Check provides RBC Economics’ assessment of key indicators of Canada’s housing market that are
deemed to offer early warning of potential imbalances. This monitoring exercise is one of the tools used regularly by RBC Econom-
ics to follow developments in this important sector of the Canadian economy. The report focuses on indicators that have been closely
correlated (leading or coincident) with housing downturns and significant home price declines during housing cycles in the past three
decades or so. While we believe that housing affordability and the sales-to-new listings ratio (and months’ inventory) are the best
indicators of market stress and price pressure, respectively, no single indicator provides perfect and accurate early warning signals of
impending trouble. Accordingly, Canadian Housing Health Check emphasizes a ‘dashboard’ approach to convey the point that trou-
ble in the housing market can arise from many directions and that it is imperative to monitor the situation broadly. This approach is
complemented by a detailed review of individual indicators that includes a graphical depiction of the current situation within a his-
torical context and a brief discussion of the rationale of our assessment.
About the graphics and risk ‘zone’ system The dashboard graphics display the current values of the indicators (dark blue bar) within zones that we consider safe (green), con-
cerning (yellow) or dangerous (red). The width of each graphics represents the range of values posted by the indicator during the past
30 years (or period of time available). The far left corresponds to the safest measure ever recorded and the far right, to the most ex-
treme imbalance reached historically. For most indicators, the left corresponds to low values but for some (sales-to-new listings ratio
and net immigration) to high values.
The yellow and red zones appearing in dashboard graphics and individual indicator charts generally were determined by analyzing
past housing downturns and constitute our estimations of thresholds above (or, in some cases, below) which market imbalances and
significant home price declines occurred at the national level in Canada. The yellow zone comprises a range of values that, histori-
cally, have been mostly associated with imbalances but not always with housing downturns (i.e. sustained price declines). In other
words, these values give somewhat ambiguous and sometimes ‘false’ signals. The red zone, however, comprises values that repre-
sent imbalances much more clearly and of larger magnitude. An indicator in the red zone should be considered a source of worry.
The farther to the right in the red zone in the dashboard graphics are the values, the more extreme is the imbalance, the more intense
is the stress exerted on the market and, ultimately, the more severe the potential correction.
The specific rules at the national level are as follows:
RBC Affordability Measure for the aggregate of all housing types: yellow threshold = 45.7% (0.3 standard deviations above
the long-term mean); and red at 49.8% (1.0 standard deviations above the mean).
Sales-to-new listings ratio: yellow threshold = 0.40; and red = 0.35.
Months of inventory: yellow threshold = 7.0; red = 8.5.
Rental vacancy rate: yellow threshold = 3.0% (long-term mean); and red = 3.5% (0.5 standard deviations above the mean).
Real 5-year bond yield relative to trailing 12-month average: yellow threshold = 1.0 percentage point (1 standard deviation
above the mean); red = 2.0 percentage points (2 standard deviations).
Unemployment rate relative to trailing 12-month average: yellow threshold = 0.41 percentage points (0.6 standard deviation
above the mean); red = 1.0 percentage point (1.5 standard deviations).
Net immigration per 1,000 population: yellow threshold = 6.5 (0.5 standard deviations above the mean); red = 5.0 (0.4 stand-
ard deviations below the mean).
Completed and unoccupied units per 1,000 population, singles and semis: yellow threshold = 0.27 (0.3 standard deviations
above the mean); red = 0.34 (1.3 standard deviation above the mean).
Completed and unoccupied units per 1,000 population, multiples: yellow threshold = 0.36 (the mean); red = 0.43 (0.9 stand-
ard deviation above the mean).
Housing under construction per 1,000 population, singles: yellow threshold = 2.12 (0.5 standard deviations from the mean);
red = 2.34 (1 standard deviation from the mean).
Housing under construction per 1,000 population, multiples: yellow threshold = 3.86 (0.5 standard deviations from the
mean); red = 4.49 (1 standard deviation from the mean).
The areas shaded in grey in the indicator charts correspond to housing downturns – i.e., periods during which home prices (as de-
fined as average prices of homes sold on the MLS system) fell by more than 5% from monthly peak to trough. It is important to note
that the precise timing of these downturns can vary depending on the home price measure used. The grey shaded areas, therefore,
should be seen as broad guidelines.

CANADIAN HOUSING HEALTH CHECK | SEPTEMBER 2016
3
CANADA
Affordability
Deteriorating
Existing home market balance
Tightening
Declining
Rising slightly
Demand fundamentals
Fairly stable
Declining modestly
Rising sharply
Supply fundamentals
Stable
Declining
Declining slightly
Rising
Six-month trend
RBC affordability measure- aggregate
Low High
Sales-to-new listings ratio
LowHigh
Months of inventory
Low High
Change in real 5-Year bond yields
Low High
Low High
Housing under construction per capita - singles
Low High
YellowHousing under construction per capita - multiples
Low High
Yellow
Rental vacancy rate
Change in the unemployment rate
Low High
Yellow
LowHigh
Yellow
Net immigration rate
Low High
YellowCompleted and unsold units per capita - singles and semis
Low High
YellowCompleted and unosold units
per capita - multiples

CANADIAN HOUSING HEALTH CHECK | SEPTEMBER 2016
4
Affordability
CANADA
Existing home market balance
20
25
30
35
40
45
50
55
60
65
70
1980 1982 1984 1986 1988 1990 1992 1994 1996 1998 2000 2002 2004 2006 2008 2010 2012 2014 2016
Long-term average
RBC affordability measure - aggregate
Source: RBC Economics Research, Brookfield RPS, Statistics Canada, Bank of Canada, Royal LePage
Ownership costs as % of household income, Canada
In our view, affordability is the most meaningful indicator of underlying
market stress. Other traditional metrics such price-to-income and price-to-rent ratios can be useful guides of market imbalance under many circumstances;
however at this juncture, affordability is a superior gauge because it explicitly
takes into account interest rates (the other measures don’t), which have been—and, in the near term, expected to remain—abnormally low in Canada.
The most recent reading of RBC’s aggregate housing affordability meas-
ure (42.8% in Q2 2016) suggests the presence of greater-than-average
market stress for buyers in Canada with the situation steadily deteriorat-
ing since the spring of 2015. Affordability is most stretched for single-
detached home in Canada’s largest markets. Condo affordability (34.4%)
is generally quite close to historical norms, which implies little in the way
of undue stress in this category.
We estimate the ‘danger zone’ for the aggregate measure to be above 45.0%
nationally.
0.0
0.1
0.2
0.3
0.4
0.5
0.6
0.7
0.8
0.9
1980 1982 1984 1986 1988 1990 1992 1994 1996 1998 2000 2002 2004 2006 2008 2010 2012 2014 2016
Monthly, S.A.
Sales-to-new listings ratio
Source: RBC Economics Research, Canadian Real Estate Association
Monthly, S.A., Canada
Sales-to-new listings ratio
Buyer's market
Balanced market
Seller's market
The sales-to-new listings ratio is a reliable gauge of the degree of slack or
tightness in the resale market. When the ratio approaches, or is above 0.60, the market favours sellers and prices typically rise rapidly. When the ratio
approaches, or is below 0.40, the market favours buyers and prices come
under intense downward pressure. Anything in between is considered a bal-anced market and prices tend to rise modestly.
Canada-wide, the sales-to-new listings ratio climbed into seller’s market
territory this year and was 0.62 in July 2016, just slightly below the six-
year high of 0.65 reached in April and May. In recent months, home
resales in Canada have come off this spring’s all-time highs, while new
listings have partially rebounded following steady declines during the
first half of 2016. The majority of markets are considered balanced with
Toronto and Vancouver (both sellers’ market) bucking the trend.
Historically, the largest price declines occurred when the ratio fell below
0.35.
0
1
2
3
4
5
6
7
8
9
10
2003 2004 2005 2006 2007 2008 2009 2010 2011 2012 2013 2014 2015 2016
Long-term average
Monthly, S.A., Canada
Months of inventory
Source: RBC Economics Research, Canadian Real Estate Association
The total number of homes for sale expressed as the number of months it
would take to sell them at the current pace of sales is another resale market balance indicator. Historical correlation with prices is difficult to establish
with precision, however, because the Canadian Real Estate Association has
been publishing this indicator only since 2004.
Nonetheless, based on what track record is available, we estimate that down-
ward pressure on prices start to build at levels between 7.0 and 8.5 months,
and that severe pressure emerges at levels exceeding 8.5.
The slowdown in listings during the first half of 2016 amid strong resales
reduced the number of months’ inventory in Canada to the lowest level
(4.6) in more than six years. This level is consistent with continued price
increases.
Demand-supply balance indicators for the existing home market, there-
fore, continue to suggest little in the way of any imminent threat to the
stability of the national market.
0
1
2
3
4
5
6
1989 1991 1993 1995 1997 1999 2001 2003 2005 2007 2009 2011 2013 2015
Long-term average
Rental vacancy rate
Annual:1988-2010; Semi-annual: 2011-currentSource: RBC Economics Research, CMHC
%, total CMAs, purpose-built apartment buildings of three units or more, Canada The rental vacancy rate has not correlated very closely with prices historical-
ly. However, we believe that the Canadian housing story will be very sensi-
tive to the supply of new units into the marketplace, much of which (almost
entirely condos) will be directed toward the rental market. Therefore, this
gauge of market absorption in the rental segment should be monitored close-ly.
A main drawback of the vacancy rate as a monitoring tool is that it is pub-
lished only once a year (in October) by CMHC.
The latest data for October 2015 shows further increase from 2.8% in
October 2014 to 3.3% at the national level, which slightly exceeds the
long-term average (2.9%). The rise primarily reflected large increases in
Alberta and Saskatchewan.
We would consider a vacancy rate above 3.5% as a sign of oversupply in the
rental space.

CANADIAN HOUSING HEALTH CHECK | SEPTEMBER 2016
5
Demand fundamentals
CANADA
Supply fundamentals
-4
-3
-2
-1
0
1
2
3
4
5
6
1980 1982 1984 1986 1988 1990 1992 1994 1996 1998 2000 2002 2004 2006 2008 2010 2012 2014 2016
Percentage points, Canada
Real 5-year bond yields relative to trailing 12-month average
Source: RBC Economics Research, Bank of Canada, Statistics Canada
Surges in interest rates have been strongly associated with market downturns
and price declines in several housing cycles in the past 30 years in Canada.
A 100 basis-point rise relative to the trailing 12-month average would apply
intense downward pressure on the market and a 200 basis point surge would likely destabilize it and potentially cause a significant price decline.
The yield on the five-year Government of Canada bond continued to
trend lower this year and is currently near historical lows. The real yield
was slightly below its 12-month trailing average since March after mov-
ing briefly above it late last year and early this year. Interest rates re-
main a very supportive influence on housing demand in Canada.
RBC’s base case interest rate forecast calls for the overnight rate to
remain unchanged through the end of 2017, and for longer-term rates to
increase before then. This scenario would pose limited risks to the hous-
ing market in the near term.
-2
-1
1
2
3
4
1980 1982 1984 1986 1988 1990 1992 1994 1996 1998 2000 2002 2004 2006 2008 2010 2012 2014 2016
Percentage points, Canada
Unemployment rate relative to trailing 12-month average
Source: RBC Economics Research, Statistics Canada
Similarly, spikes of unemployment have been associated with housing down-
turns in the past 30 years, although they have tended to lag price declines rather than lead them.
We estimate that a 0.25 percentage point increase in Canada’s unemployment
rate relative to the trailing 12-month average would stress the market moder-
ately, but that a full percentage-point surge would threaten the stability of the market.
The unemployment rate has eased since spring after rising modestly
during the course of 2015. It dipped below the trailing 12-month average
since May.
Labour market conditions pose little risk nationally at this point. Such is
not the case everywhere across the country, however. Labour market-
related risks are prominent in markets in oil-producing provinces.
1
2
3
4
5
6
7
8
9
10
1980 1982 1984 1986 1988 1990 1992 1994 1996 1998 2000 2002 2004 2006 2008 2010 2012 2014 2016
Long-term average
Trailing 4-quarter sum, Canada, per 1,000 population
Net immigration rate
Source: RBC Economics Research, Statistics Canada
Net immigration into Canada is another indicator that has not correlated
closely with housing downturns or price declines historically; however, given
the boom in condo construction in major Canadian cities, any sign that the
strong inflow of immigrants is slowing would be concerning.
The rate of net immigration in Canada (measured per 1,000 population)
recently picked up significantly after falling between Q4/14 and Q2/15.
The latest rate for Q1/16 rose to 7.7 from a 16-year low of 5.1 in Q3/15. This
is now comfortably above the 6.5 threshold signalling some degree of vulner-ability.
Further increase in the rate is likely to occur in light of the federal gov-
ernment this year increasing its target for new permanent residents by
more than 10%.
0.0
0.1
0.2
0.3
0.4
0.5
1980 1982 1984 1986 1988 1990 1992 1994 1996 1998 2000 2002 2004 2006 2008 2010 2012 2014 2016
Long-term average
Units per 1,000 population, Canada, n.s.a.
Completed and unsold units - singles and semis
Source: RBC Economics Research, Statistics Canada, Canada Mortgage and Housing Corporation
A telltale of an overbuilt market is the number of units recently completed but
remaining unsold.
We segment the Canadian market into singles and multiples to identify poten-
tial sources of trouble.
On the single-family homes side, the stock of unsold units has remained
quite stable at 0.22-0.24 units per 1,000 population since mid-2014.
There continues to be no signs of any excess supply of new single-
detached units in Canada at this stage. If fact, the opposite is the case in
several markets where single-detached are in short supply.
We would consider the situation concerning at 0.29 units and dangerous at
0.36 units.

CANADIAN HOUSING HEALTH CHECK | SEPTEMBER 2016
6
Supply fundamentals
CANADA
0.0
0.1
0.2
0.3
0.4
0.5
0.6
0.7
0.8
1980 1982 1984 1986 1988 1990 1992 1994 1996 1998 2000 2002 2004 2006 2008 2010 2012 2014 2016
Long-term average
Units per 1,000 population, Canada, n.s.a.
Completed and unsold units - multiples
Source: RBC Economics Research, Statistics Canada, Canada Mortgage and Housing Corporation
On the multi-unit dwellings side, market absorption has been quite solid
this year at a time when completions moderated from last year’s strong
pace. This helped to draw down the inventory of unsold units in Canada.
The rate of unsold units eased to 0.32 units per 1,000 population in July
2016, down from a 19-year high of 0.41 units in May 2015.
The unsold inventory surged in the early months of 2015 due to a wave in
condo completions in the Toronto area.
The latest read of this indicator was slightly below the long-term average
(0.36) and well below the 0.48 threshold that would signal a high degree
of excess.
Overall, the inventory of completed but unsold condos evolved construc-
tively in the past year in Canada, thereby lessening oversupply risks.
0.0
0.5
1.0
1.5
2.0
2.5
3.0
3.5
1980 1982 1984 1986 1988 1990 1992 1994 1996 1998 2000 2002 2004 2006 2008 2010 2012 2014 2016
Long-term average
Units per 1,000 population, Canada, n.s.a.
Housing under construction - singles
Source: RBC Economics Research, Statistics Canada, Canada Mortgage and Housing Corporation
The object of much concern in recent past has been the number of housing
units under construction in Canada.
We continue to find that little concern of overbuilding is warranted in the
single family home segment, where levels remain well below historical
averages (when measured on a per 1,000 population basis) with the trend
even declining slightly in the past several years, including so far in 2016.
In some of Canada’s largest markets, demand for single family homes
significantly outstrips supply.
0.0
1.0
2.0
3.0
4.0
5.0
6.0
1980 1982 1984 1986 1988 1990 1992 1994 1996 1998 2000 2002 2004 2006 2008 2010 2012 2014 2016
Long-term average
Units per 1,000 population, Canada, n.s.a.
Housing under construction - multiples
Source: RBC Economics Research, Statistics Canada, Canada Mortgage and Housing Corporation
On the multiples side, however, there continues to be historically-high
levels of condo units under construction in Canada.
There were 5.8 multi-unit dwellings per 1,000 population under construc-
tion in Canada in Q2/16, matching the decades-high reached in 2014.
Strictly speaking, this level is well into the ‘high risk zone’ (4.5 units or
higher); however, in the context of tight demand-supply balances in mar-
kets such as Vancouver and Toronto, strong construction should be seen
as being part of the solution to bring about some kind of cooling.
Most of the units being built are in the Toronto (34% of total) and Van-
couver (17%) areas.
Strong condo construction in large part reflects structural changes that
arose from policy (e.g. rules limiting urban sprawl) and affordability
(condo apartments are the more affordable housing type) considerations,
and therefore, represents a market share gain over single-family homes.
Nonetheless, the prospects for high levels of condo completions in the
period ahead entail a fair degree of absorption risks.

CANADIAN HOUSING HEALTH CHECK | SEPTEMBER 2016
7
GREATER TORONTO AREA
Affordability
Deteriorating rapidly
Existing home market balance
Tightening
Declining
Stable
Demand fundamentals
Fairly stable
Declining
Rising slightly
Supply fundamentals
Stable
Declining
Stable
Rising
Six-month trend
Change in real 5-Year bond yields
Low High
RBC affordability measure- aggregate
Low High
Sales-to-new listings ratio
LowHigh
Months of inventory
- OntarioLow High
Low High
Yellow
Rental vacancy rate
Change in the unemployment rate
Low High
Yellow
LowHigh
Yellow
Population growth
Low High
YellowCompleted and unsold units per capita - singles and semis
Low High
YellowCompleted and unsold units per
capita - multiples
Low High
Housing under construction per capita - singles
Low High
YellowHousing under construction per capita - multiples

CANADIAN HOUSING HEALTH CHECK | SEPTEMBER 2016
8
Affordability in the GTA has been on a deteriorating trend since 2012
with the pace of deterioration accelerating in the past year. RBC’s meas-
ure is now in a zone that historically has been associated with high risks.
Most of the affordability pressure is concentrated in the single-family
home side of the market. Condo affordability, on the other hand, is much
less strained, as the level remains reasonably close to its long-term aver-
age.
Stretched affordability does not appear to be a primary consideration for
GTA homebuyers at this stage. Home resales reached record levels in the
first half of 2016, although they have retreated somewhat since hitting a
peak in May.
The Toronto-area market would be more sensitive to a substantial rise in
interest rates than most markets in Canada due to its high prices.
Demand-supply conditions remain very tight in the GTA. This is a
sellers’ market. The sales-to-new listings ratio reached a seven-year high
of 0.76 in May 2016, well above the 0.60 threshold marking conditions
favouring sellers. The ratio has eased back a little since then (it was 0.71
in July). Tight market conditions fuel strong—and still accelerating—
price increases, particularly for detached homes (more than 19% y/y),
far exceeding household income growth.
At this stage, the sales-to-new listings ratio suggests little in the way of
any imminent price declines in the region.
On the contrary, current conditions point toward further acceleration in
price gains in the coming months, thereby further exacerbating the
GTA’s affordability challenges.
Affordability
GREATER TORONTO AREA
Existing home market balance
0
1
2
3
4
5
6
7
8
9
10
2003 2004 2005 2006 2007 2008 2009 2010 2011 2012 2013 2014 2015 2016
Long-term average
Monthly, S.A., Ontario
Months of inventory
Source: RBC Economics Research, Canadian Real Estate Association
Demand-supply tightness is corroborated by very low inventory of homes
for sales (active listings).
Although data is available only at the provincial level, the number of
months’ inventory in Ontario is at its lowest point (2.1 months in July
2016) since records have been published by the Canadian Real Estate
Association (2003).
Concerns that Toronto’s condo boom would flood the rental market and
cause vacancies to rise have not materialized to date.
The rental vacancy rate in the GTA has remained stable and low in re-
cent years. It was 1.6% in October 2015 (the most recent read from
CMHC).
According to the Toronto Real Estate Board, condo rental activity
paused in the second quarter, following very strong growth in recent
years. The Board attributed the recent pause to a declining in condo
rental listings, which limited choice for renters. Average rent continued
to rise at a brisk pace (by more than 6% y/y for a one-bedroom apart-
ment).
So far, there is little evidence that condo investors who rent their units
have overestimated rental demand.
20
30
40
50
60
70
80
1980 1982 1984 1986 1988 1990 1992 1994 1996 1998 2000 2002 2004 2006 2008 2010 2012 2014 2016
Long-term average
RBC affordability measure - aggregate
Source: RBC Economics Research, Brookfield RPS, Statistics Canada, Bank of Canada, Royal LePage
Ownership costs as % of household income, Toronto
0.0
0.1
0.2
0.3
0.4
0.5
0.6
0.7
0.8
0.9
1.0
1980 1982 1984 1986 1988 1990 1992 1994 1996 1998 2000 2002 2004 2006 2008 2010 2012 2014 2016
Monthly, S.A.
Sales-to-new listings ratio
Source: RBC Economics Research, Canadian Real Estate Association
Monthly, S.A., Toronto
Sales-to-new listings ratio
Buyer's market
Balanced market
Seller's market
0
1
2
3
4
5
6
1989 1991 1993 1995 1997 1999 2001 2003 2005 2007 2009 2011 2013 2015
Long-term average
Rental vacancy rate
Source: RBC Economics Research, CMHC
%, purpose-built apartment buildings of three units or more, Toronto

CANADIAN HOUSING HEALTH CHECK | SEPTEMBER 2016
9
Labour market conditions in the GTA continue to be generally support-
ive for the area’s housing market.
Toronto’s unemployment rate recently fell to its lowest level (6.4% in
July 2016) since the middle of 2008.
Labour market-related risks are low at this point.
Demand fundamentals
GREATER TORONTO AREA
Supply fundamentals
-2
-1
1
2
3
4
1990 1992 1994 1996 1998 2000 2002 2004 2006 2008 2010 2012 2014 2016
Percentage points, Toronto
Unemployment rate relative to trailing 12-month average
Source: RBC Economics Research, Statistics Canada
0.0
0.5
1.0
1.5
2.0
2.5
3.0
3.5
4.0
1988 1990 1992 1994 1996 1998 2000 2002 2004 2006 2008 2010 2012 2014 2016
Long-term average
Y/Y % change in the 15+ population, Toronto
Adult population growth
Source: RBC Economics Research, Statistics Canada
Solid demographic fundamentals have long supported GTA’s housing
market.
Those fundamentals improved this year, following a period of softening
in 2014-2015.
The rate of growth in adult population picked up from 1.6% in mid-2015
to 1.8% most recently, thereby inching closer to GTA’s long-term aver-
age of 1.9%.
A rate below 1.5% would be a source of concern.
GTA home builders are responding to the dearth of single-family homes
in the area, with starts rising 25% y/y so far in 2016 (from historically
low levels in 2015).
This is as a positive development that will help address the tightness issue
in this housing category.
Inventories of newly completed and unsold the single-family continue to
be historically low despite trending slightly higher in the past four years.
There is no indication of overbuilding of single-family homes in the area
at present.
The inventory of recently completed and unsold condo units is no longer
a source of concern in the Toronto area.
Absorption of newly built condos has been brisk in the GTA in the past
year and stocks of unsold units have come down considerably.
The unabsorbed inventory fell from a 22-year peak of 0.58 units per
1,000 population in May 2015 to 0.25 units in July 2016, which is within
the ‘safe zone’—i.e., below the 0.27 threshold signalling the potential for
mild excess supply.
A surge in condo completions (reflecting several large condo projects
reportedly reaching the ‘completed’ stage) led to a sharp increase in the
number of unsold units in early 2015. Completions returned to more
normal levels subsequently.
0.00
0.05
0.10
0.15
0.20
0.25
0.30
0.35
0.40
1988 1990 1992 1994 1996 1998 2000 2002 2004 2006 2008 2010 2012 2014 2016
Long-term average
Units per 1,000 population, Toronto, n.s.a.
Completed and unsold units - singles and semis
Source: RBC Economics Research, Statistics Canada, Canada Mortgage and Housing Corporation
0.0
0.2
0.4
0.6
0.8
1.0
1.2
1988 1990 1992 1994 1996 1998 2000 2002 2004 2006 2008 2010 2012 2014 2016
Long-term average
Units per 1,000 population, Toronto, n.s.a.
Completed and unsold units - multiples
Source: RBC Economics Research, Statistics Canada, Canada Mortgage and Housing Corporation

CANADIAN HOUSING HEALTH CHECK | SEPTEMBER 2016
10
Supply fundamentals
GREATER TORONTO AREA
0.0
0.5
1.0
1.5
2.0
2.5
3.0
3.5
4.0
4.5
5.0
1988 1990 1992 1994 1996 1998 2000 2002 2004 2006 2008 2010 2012 2014 2016
Long-term average
Units per 1,000 population, Toronto, n.s.a.
Housing under construction - singles
Source: RBC Economics Research, Statistics Canada, Canada Mortgage and Housing Corporation
Single-detached starts picked up this year and boosted the number of
such units currently under construction; however, this level remains
below the long-term average for the area when measured in per 1,000
population terms.
Recent levels of construction therefore do not signal any impending wave
of single-unit supply that might cause trouble for the market.
Policy to reduce urban sprawl and favour higher density urban develop-
ment contributed to a significant slowdown in single-detached home
construction since the mid-2000s.
0.0
2.0
4.0
6.0
8.0
10.0
12.0
14.0
1988 1990 1992 1994 1996 1998 2000 2002 2004 2006 2008 2010 2012 2014 2016
Long-term average
Units per 1,000 population, Toronto, n.s.a.
Housing under construction - multiples
Source: RBC Economics Research, Statistics Canada, Canada Mortgage and Housing Corporation
The number of multi-unit dwellings under construction has rebounded
since mid-2015 although it is still down noticeably from the all-time highs
reached in 2014.
The recent rise was attributed to a sharp increase in multi-unit starts in
2015 following two years of decline, although the pace has moderated so
far this year.
Expressed on a per 1,000 population basis, multi-unit construction re-
mains in a high risk zone; however, the potential threat to the market is
tempered by the healthier unsold condo inventory.
The main risk of high levels of construction is that many units could
reach the completed stage at once, thereby flooding the condo resale and/
or rental markets. So far, both of these markets have absorbed the in-
creased supply quite handily.

CANADIAN HOUSING HEALTH CHECK | SEPTEMBER 2016
11
GREATER MONTREAL AREA
Affordability
Deteriorating slightly
Existing home market balance
Tightening
Declining
Rising
Demand fundamentals
Fairly stable
Declining
Rising
Supply fundamentals
Stable
Declining
Stable
Declining
Six-month trend
Change in real 5-Year bond yields
Low High
RBC affordability measure- aggregate
Low High
Sales-to-new listings ratio
LowHigh
Months of inventory -
QuebecLow High
Low High
Yellow
Rental vacancy rate
Change in the unemployment rate
Low High
Yellow
LowHigh
Yellow
Population growth
Low High
YellowCompleted and unsold units per capita - singles and semis
Low High
YellowCompleted and unsold units per capita - multiples
Low High
Housing under construction per capita - singles
Low High
YellowHousing under construction per capita - multiples

CANADIAN HOUSING HEALTH CHECK | SEPTEMBER 2016
12
Affordability
GREATER MONTREAL AREA
Existing home market balance
Existing home supply expressed as number of months’ inventory shows a
steady declining trend in Quebec since early 2015, although it remains
historically high at the juncture.
This is consistent with the modest firming in marked conditions in Mon-
treal.
The wave of condo completions in 2014 increased competition for pur-
pose-built apartment buildings, which over time has translated into high-
er rental vacancy rates.
The vacancy rate in the Montreal area rose from 3.4% in October 2014
to 4.0% in October 2015, thereby signalling some mild degree of oversup-
ply in the rental market.
20
25
30
35
40
45
50
55
60
1980 1982 1984 1986 1988 1990 1992 1994 1996 1998 2000 2002 2004 2006 2008 2010 2012 2014 2016
Long-term average
RBC affordability measure - aggregate
Source: RBC Economics Research, Brookfield RPS, Statistics Canada, Bank of Canada, Royal LePage
Ownership costs as % of household income, Montreal
Affordability deteriorated slightly in the Montreal area this year after
showing an improving trend in the previous six years. Despite the recent
erosion, affordability does not pose any unusual risks at this point.
RBC’s aggregate measure was 39.4% in Q2/16, up 1.6 percentage points
from a year ago but still within the safe range.
0.0
0.2
0.4
0.6
0.8
1.0
1.2
1.4
1980 1982 1984 1986 1988 1990 1992 1994 1996 1998 2000 2002 2004 2006 2008 2010 2012 2014 2016
Monthly, S.A.
Sales-to-new listings ratio
Source: RBC Economics Research, Canadian Real Estate Association
Monthly, S.A., Montreal
Sales-to-new listings ratio
Buyer's market
Balanced market
Seller's market
Demand-supply conditions in the Montreal area have been on a gradual-
ly tightening trend since last year. The sales-to-new listings ratio contin-
ued to drift higher this year to 0.54 by July, near the highest point in
more than three years.
After rising by 6.0% last year, home resales started 2016 on a solid note
but then stalled in the spring. Meanwhile, the inventory of homes for sale
has been drawn successively, including for condos (which had been a
significant issue earlier). New listings have dropped steadily below year-
ago levels.
The upward trend in the sales-to-new listings ratio suggests that the rate
of price increases may strengthen in the period ahead, and do not point
to any imminent risk of a downward price spiral.
0
2
4
6
8
10
12
14
16
18
2003 2004 2005 2006 2007 2008 2009 2010 2011 2012 2013 2014 2015 2016
Long-term average
Monthly, S.A., Quebec
Months of inventory
Source: RBC Economics Research, Canadian Real Estate Association
0
1
2
3
4
5
6
7
8
1989 1991 1993 1995 1997 1999 2001 2003 2005 2007 2009 2011 2013 2015
long-term average
Rental vacancy rate
Source: RBC Economics Research, Statistics Canada
%, purpose-built apartment buildings of three units or more, Montreal

CANADIAN HOUSING HEALTH CHECK | SEPTEMBER 2016
13
Montreal’s job market showed notable improvement this year. The un-
employment fell by almost a full percentage point since the beginning of
2016. It currently stands at 7.8%, its second-lowest level in three years.
The drop offered further support for the housing market and therefore
was a positive development from a risk point of view.
Demand fundamentals
GREATER MONTREAL AREA
Supply fundamentals
Following a two year-long period of easing growth, Montreal’s adult
population has grown a little faster since mid-2015 and returned to the
long-term average of 1.0% this spring.
Overall demographics currently pose little risks for the market.
-2
-1
1
2
3
4
1990 1992 1994 1996 1998 2000 2002 2004 2006 2008 2010 2012 2014 2016
Percentage points, Montreal
Unemployment rate relative to trailing 12-month average
Source: RBC Economics Research, Statistics Canada
0.0
0.4
0.8
1.2
1.6
2.0
1988 1990 1992 1994 1996 1998 2000 2002 2004 2006 2008 2010 2012 2014 2016
Long-term average
Y/Y % change in the 15+ population, Montreal
Adult population growth
Source: RBC Economics Research, Statistics Canada
0.0
0.1
0.2
0.3
0.4
0.5
0.6
0.7
0.8
0.9
1988 1990 1992 1994 1996 1998 2000 2002 2004 2006 2008 2010 2012 2014 2016
Long-term average
Units per 1,000 population, Montreal, n.s.a.
Completed and unsold units - singles and semis
Source: RBC Economics Research, Statistics Canada, Canada Mortgage and Housing Corporation
There continues to be very few newly completed single-family homes that
are unsold in the Montreal area.
We see no evidence of an overbuild in this market segment.
0.0
0.4
0.8
1.2
1.6
2.0
2.4
1988 1990 1992 1994 1996 1998 2000 2002 2004 2006 2008 2010 2012 2014 2016
Long-term average
Units per 1,000 population, Montreal, n.s.a.
Completed and unsold units - multiples
Source: RBC Economics Research, Statistics Canada, Canada Mortgage and Housing Corporation
On the multi-unit dwelling side, conditions improved noticeably in the
past year with the stock of unabsorbed units declining markedly. The
stock fell from 0.91 units per 1,000 population in August 2015 to 0.75
units by July 2016.
Nonetheless, despite this improvement, the stock remains somewhat
elevated from a historical perspective. It is still above the long-term aver-
age of 0.69 units in the area.
This suggests that some degree of surplus persists in the multi-unit seg-
ment of the market in Montreal.

CANADIAN HOUSING HEALTH CHECK | SEPTEMBER 2016
14
Supply fundamentals
GREATER MONTREAL AREA
0.0
0.2
0.4
0.6
0.8
1.0
1.2
1.4
1.6
1.8
2.0
1998 2000 2002 2004 2006 2008 2010 2012 2014 2016
Long-term average
Units per 1,000 population, Montreal, n.s.a.
Housing under construction - singles
Source: RBC Economics Research, Statistics Canada, Canada Mortgage and Housing Corporation
The risk of any overbuilding of single-family homes in the short term is
extremely remote.
Current levels of units under construction are significantly below long-
run averages, well within the ‘safe zone’.
0.0
1.0
2.0
3.0
4.0
5.0
6.0
7.0
1998 2000 2002 2004 2006 2008 2010 2012 2014 2016
Long-term average
Units per 1,000 population, Montreal, n.s.a.
Housing under construction - multiples
Source: RBC Economics Research, Statistics Canada, Canada Mortgage and Housing Corporation
A sharp increase in completed units in purpose-built apartment buildings
this year significantly reduced the number multi-unit dwellings under
construction in Montreal.
In per 1,000 population terms, that number fell from an all-time high of
5.8 units in January 2016 to 4.9 units in July. While the level remains
historically elevated, it no longer sends a strong signal for a potential risk
of overbuilding.
Strong condo construction activity in the past decade partly reflected a
structural shift toward multiples supported by urban development policy
and affordability advantage relative to single-family homes.

CANADIAN HOUSING HEALTH CHECK | SEPTEMBER 2016
15
GREATER VANCOUVER AREA
Affordability
Deteriorating sharply
Existing home market balance
Easing rapidly
Stable
Declining
Demand fundamentals
Fairly stable
Declining
Easing slightly
Supply fundamentals
Declining
Declining
Rising
Rising rapidly
Six-month trend
Change in real 5-Year bond yields
Low High
RBC affordability measure- aggregate
Low High
Sales-to-new listings ratio
LowHigh
Months of inventory - BC
Low High
Low High
Yellow
Rental vacancy rate
Change in the unemployment rate
Low High
Yellow
LowHigh
Yellow
Population growth
Low High
YellowCompleted and unsold units per capita - singles and semis
Low High
Completed and unsold units per
capita - multiples
Low High
Housing under construction per capita - singles
Low High
Housing under construction per capita - multiples
CANADIAN HOUSING HEALTH CHECK | SEPTEMBER 2016
16
Affordability
GREATER VANCOUVER AREA
Existing home market balance
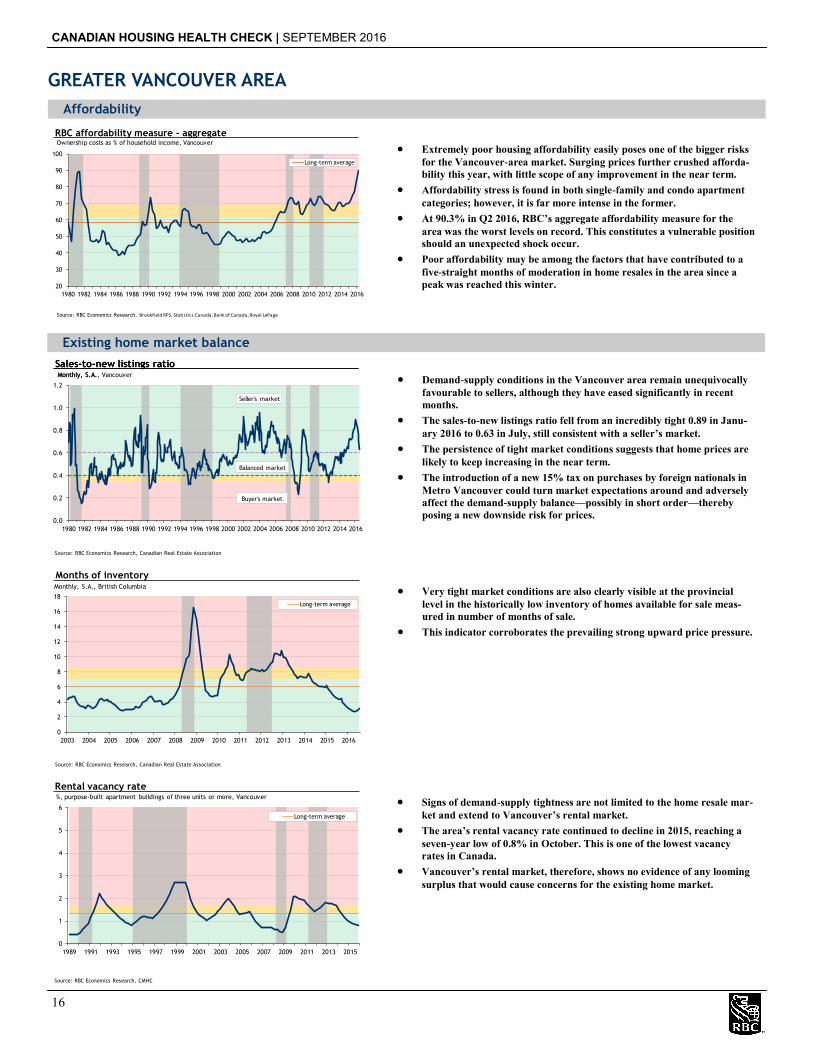
Very tight market conditions are also clearly visible at the provincial
level in the historically low inventory of homes available for sale meas-
ured in number of months of sale.
This indicator corroborates the prevailing strong upward price pressure.
Signs of demand-supply tightness are not limited to the home resale mar-
ket and extend to Vancouver’s rental market.
The area’s rental vacancy rate continued to decline in 2015, reaching a
seven-year low of 0.8% in October. This is one of the lowest vacancy
rates in Canada.
Vancouver’s rental market, therefore, shows no evidence of any looming
surplus that would cause concerns for the existing home market.
20
30
40
50
60
70
80
90
100
1980 1982 1984 1986 1988 1990 1992 1994 1996 1998 2000 2002 2004 2006 2008 2010 2012 2014 2016
Long-term average
RBC affordability measure - aggregate
Source: RBC Economics Research, Brookfield RPS, Statistics Canada, Bank of Canada, Royal LePage
Ownership costs as % of household income, Vancouver
0.0
0.2
0.4
0.6
0.8
1.0
1.2
1980 1982 1984 1986 1988 1990 1992 1994 1996 1998 2000 2002 2004 2006 2008 2010 2012 2014 2016
Monthly, S.A.
Sales-to-new listings ratio
Source: RBC Economics Research, Canadian Real Estate Association
Monthly, S.A., Vancouver
Sales-to-new listings ratio
Buyer's market
Balanced market
Seller's market
Extremely poor housing affordability easily poses one of the bigger risks
for the Vancouver-area market. Surging prices further crushed afforda-
bility this year, with little scope of any improvement in the near term.
Affordability stress is found in both single-family and condo apartment
categories; however, it is far more intense in the former.
At 90.3% in Q2 2016, RBC’s aggregate affordability measure for the
area was the worst levels on record. This constitutes a vulnerable position
should an unexpected shock occur.
Poor affordability may be among the factors that have contributed to a
five-straight months of moderation in home resales in the area since a
peak was reached this winter.
Demand-supply conditions in the Vancouver area remain unequivocally
favourable to sellers, although they have eased significantly in recent
months.
The sales-to-new listings ratio fell from an incredibly tight 0.89 in Janu-
ary 2016 to 0.63 in July, still consistent with a seller’s market.
The persistence of tight market conditions suggests that home prices are
likely to keep increasing in the near term.
The introduction of a new 15% tax on purchases by foreign nationals in
Metro Vancouver could turn market expectations around and adversely
affect the demand-supply balance—possibly in short order—thereby
posing a new downside risk for prices.
0
2
4
6
8
10
12
14
16
18
2003 2004 2005 2006 2007 2008 2009 2010 2011 2012 2013 2014 2015 2016
Long-term average
Monthly, S.A., British Columbia
Months of inventory
Source: RBC Economics Research, Canadian Real Estate Association
0
1
2
3
4
5
6
1989 1991 1993 1995 1997 1999 2001 2003 2005 2007 2009 2011 2013 2015
Long-term average
Rental vacancy rate
Source: RBC Economics Research, CMHC
%, purpose-built apartment buildings of three units or more, Vancouver

CANADIAN HOUSING HEALTH CHECK | SEPTEMBER 2016
17
The job situation in Vancouver has been very positive this past year with
employment up by an impressive 6.6% y/y in July and the jobless rate
falling to its lowest point (5.4% in June) in seven years.
Labour market developments do not pose any immediate threat to the
housing market. On the contrary, they offer substantial support current-
ly.
Demand fundamentals
GREATER VANCOUVER AREA
Supply fundamentals
Adult population growth (1.7% y/y in July 2016) remained slightly weak-
er than the long-term average (2.2%) for the area.
At this stage, demographic factors represent an ambiguous risk factor
for the market.
-2
-1
1
2
3
4
1990 1992 1994 1996 1998 2000 2002 2004 2006 2008 2010 2012 2014 2016
Percentage points, Vancouver
Unemployment rate relative to trailing 12-month average
Source: RBC Economics Research, Statistics Canada
0.0
0.5
1.0
1.5
2.0
2.5
3.0
3.5
4.0
1988 1990 1992 1994 1996 1998 2000 2002 2004 2006 2008 2010 2012 2014 2016
Long-term average
Y/Y % change in the 15+ population, Vancouver
Adult population growth
Source: RBC Economics Research, Statistics Canada
0.0
0.2
0.4
0.6
0.8
1.0
1.2
1.4
1.6
1988 1990 1992 1994 1996 1998 2000 2002 2004 2006 2008 2010 2012 2014 2016
Long-term average
Units per 1,000 population, Vancouver, n.s.a.
Completed and unsold units - singles and semis
Source: RBC Economics Research, Statistics Canada, Canada Mortgage and Housing Corporation
Absorption of single-detached and semi-detached has been quite vigorous
since early 2014 and this continued to be the case in 2016. As a result, the
number of recently completed and unsold units has fallen steadily, reach-
ing 0.34 units per 1,000 population in July 2016— well into the ‘safe
zone’.
With singles and semi-detached completions continuing to rise only mod-
estly this year, the Vancouver-area market does not show any signs of
being overbuilt at this point. On the contrary, very tight market condi-
tions for existing homes suggest that supply is short.
0.0
0.5
1.0
1.5
2.0
2.5
3.0
1988 1990 1992 1994 1996 1998 2000 2002 2004 2006 2008 2010 2012 2014 2016
Long-term average
Units per 1,000 population, Vancouver, n.s.a.
Completed and unsold units - multiples
Source: RBC Economics Research, Statistics Canada, Canada Mortgage and Housing Corporation
Similarly, the situation on the multi-unit dwelling side of the market
remains safe.
The number of completed and unsold units has trended lower since early
2014, reaching a nine-year low in July 2016.
Moderate levels of apartment completions in 2014 and 2015 limited the
flow of new supply into the market, and this continued to be the case in
2016 despite a slight increase in completions.
The Vancouver condo market does not appear to be overbuilt at this
point.

CANADIAN HOUSING HEALTH CHECK | SEPTEMBER 2016
18
Supply fundamentals
GREATER VANCOUVER AREA
0.0
0.5
1.0
1.5
2.0
2.5
3.0
3.5
4.0
1988 1990 1992 1994 1996 1998 2000 2002 2004 2006 2008 2010 2012 2014 2016
Long-term average
Units per 1,000 population, Vancouver, n.s.a.
Housing under construction - singles
Source: RBC Economics Research, Statistics Canada, Canada Mortgage and Housing Corporation
0.0
2.0
4.0
6.0
8.0
10.0
12.0
14.0
1988 1990 1992 1994 1996 1998 2000 2002 2004 2006 2008 2010 2012 2014 2016
Long-term average
Units per 1,000 population, Vancouver, n.s.a.
Housing under construction - multiples
Source: RBC Economics Research, Statistics Canada, Canada Mortgage and Housing Corporation
Builders’ response to the shortage of single-family homes in the Vancou-
ver area has become more vigorous in 2016 with starts rising by 17%
year to date, and the number of single units under construction reaching
its highest level in nearly 22 years.
On its own, the rising number of single-family homes under construction
suggest increasing risks; however, very low inventories of single-detached
homes for sale in the market implies that absorption is likely to remain
strong.
Fueled by very strong housing starts this year, the number of multi-
family units under construction (on a per 1000 population basis) rose to a
new record level in recent months, thereby signaling greater-than-usual
risks for the future balance of the market.
Such risks are tempered by the very tight market conditions in the resale
market and low inventories of newly built and unsold units.
CANADIAN HOUSING HEALTH CHECK | SEPTEMBER 2016
19
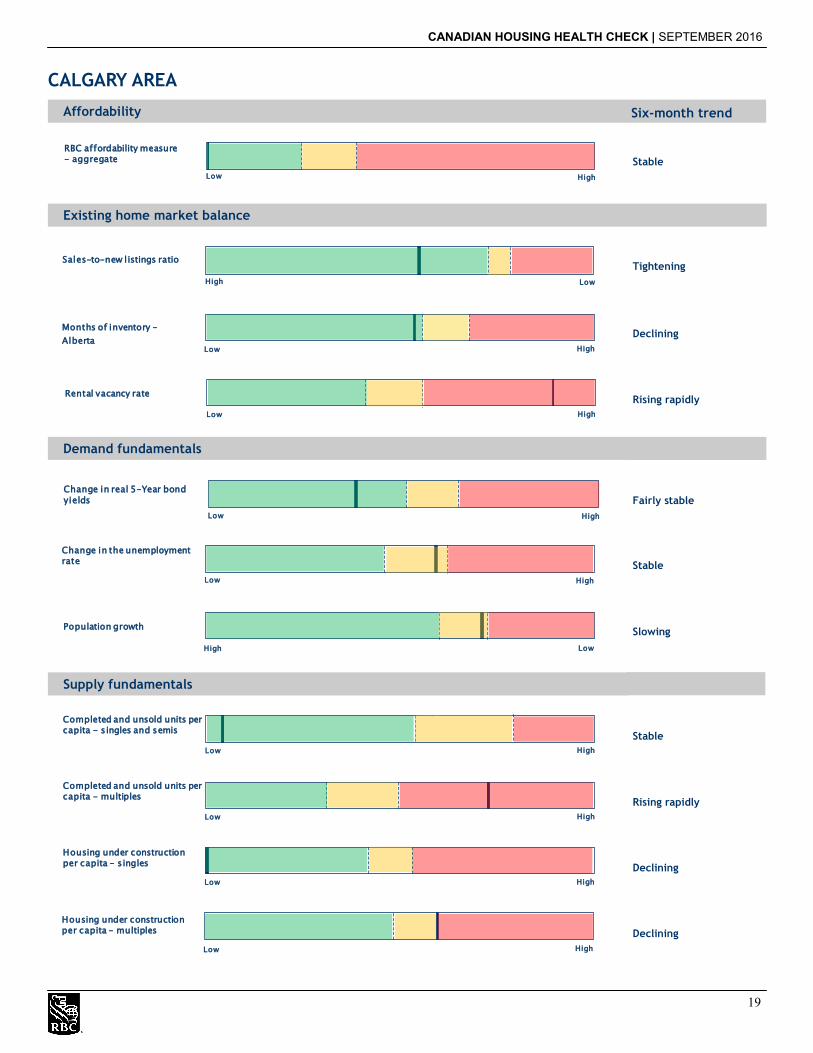
CALGARY AREA
Affordability
Stable
Existing home market balance
Tightening
Declining
Rising rapidly
Demand fundamentals
Fairly stable
Stable
Slowing
Supply fundamentals
Stable
Rising rapidly
Declining
Declining
Six-month trend
Change in real 5-Year bond yields
Low High
RBC affordability measure- aggregate
Low High
Sales-to-new listings ratio
LowHigh
Months of inventory -
AlbertaLow High
Low High
Yellow
Rental vacancy rate
Change in the unemployment rate
Low High
Yellow
LowHigh
Yellow
Population growth
Low High
YellowCompleted and unsold units per capita - singles and semis
Low High
Completed and unsold units per capita - multiples
Low High
Housing under construction per capita - singles
Low High
YellowHousing under construction per capita - multiples

CANADIAN HOUSING HEALTH CHECK | SEPTEMBER 2016
20
Affordability
CALGARY AREA
Existing home market balance
The picture for the overall inventory of homes for sale in Alberta also
improved in recent months, although it continues to show plentiful op-
tions for buyers. The number of months’ inventory was 5.8 in July, down
from cyclical high of 7.0 in February but still well above the 4.6 that
prevailed a year ago.
Calgary Real Estate Board reported that active listings in the area were
up by more than 11% in July relative to a year ago, which is consistent
with the provincial picture of ample options for buyers.
It is also consistent with downward pressure on prices persisting in the
short term, albeit at a diminishing intensity.
The recent drawdown in active inventory has eased downside risks for
prices in the area.
Calgary’s rental market shows signs of increasingly being over-supplied.
The rental vacancy rate surged to a six-year high of 5.3% in October
2015. It was 1.4% a year earlier.
Such high vacancy rate raises significant downside risks for rent values
in the area and revenue prospects for condo investors.
20
30
40
50
60
70
80
90
1980 1982 1984 1986 1988 1990 1992 1994 1996 1998 2000 2002 2004 2006 2008 2010 2012 2014 2016
Long-term average
RBC affordability measure - aggregate
Source: RBC Economics Research, Brookfield RPS, Statistics Canada, Bank of Canada, Royal LePage
Ownership costs as % of household income, Calgary
Housing affordability is a generally constructive factor for the Calgary-
area market, remaining quite stable in past year (in the range of 34%-
35% for RBC’s aggregate measure).
In the current difficult context—with historically low oil prices and surg-
ing unemployment sapping the confidence of both buyers and sellers—
the good affordability standing reduces the risk of a significant price
decline.
Calgary faces many tough issues; however, there is no evidence to suggest
that affordability is one of them.
0.0
0.2
0.4
0.6
0.8
1.0
1.2
1980 1982 1984 1986 1988 1990 1992 1994 1996 1998 2000 2002 2004 2006 2008 2010 2012 2014 2016
Monthly, S.A.
Sales-to-new listings ratio
Source: RBC Economics Research, Canadian Real Estate Association
Monthly, S.A., Calgary
Sales-to-new listings ratio
Buyer's market
Balanced market
Seller's market
After weakening considerably in 2015, demand-supply conditions im-
proved so far this year on the back of a slight recovery in home resales
(from a historically low base) and significant reduction in new listings.
The sales-to-new listings ratio—which rose from 0.41 in December 2015
to 0.56 in July—would suggest that the Calgary market is balanced;
however, there continues to be a hefty inventory of active listings.
Despite showing signs of stabilizing recently, housing demand remains
soft in Calgary. Home resales plummeted by 29% in 2015 and are still
down almost 11% year-to-date in 2016.
0
2
4
6
8
10
12
2003 2004 2005 2006 2007 2008 2009 2010 2011 2012 2013 2014 2015 2016
Long-term average
Monthly, S.A., Alberta
Months of inventory
Source: RBC Economics Research, Canadian Real Estate Association
0
1
2
3
4
5
6
7
8
1989 1991 1993 1995 1997 1999 2001 2003 2005 2007 2009 2011 2013 2015
Long-term average
Rental vacancy rate
Source: RBC Economics Research, Statistics Canada
%, purpose-built apartment buildings of three units or more, Calgary

CANADIAN HOUSING HEALTH CHECK | SEPTEMBER 2016
21
Calgary’s labour market continues to be significantly challenged. The
area’s jobless rate was at a decades-high of 8.6% in July amid a loss of
nearly 32,000 jobs in the past 14 months.
The speed with which labour market conditions have deteriorated still
poses significant risks for the housing market; however, it has eased
somewhat in recent months.
Demand fundamentals
CALGARY AREA
Supply fundamentals
Deteriorating job prospects contributed significantly to a slowdown in
Calgary’s adult population growth—from a recent cyclical high of 4.0%
in early 2014 to a five-year low of 2.0% in July 2016.
Calgary’s 2016 Civic Census showed a net migration loss in the 12
months ending April 2016 for only the second time in the past quarter
century. Given the area’s current economic predicament, further losses
can be expected in the near term.
Demographics-related risks are rising rapidly in the Calgary area.
-2
-1
1
2
3
4
1990 1992 1994 1996 1998 2000 2002 2004 2006 2008 2010 2012 2014 2016
Percentage points, Calgary
Unemployment rate relative to trailing 12-month average
Source: RBC Economics Research, Statistics Canada
0.0
1.0
2.0
3.0
4.0
5.0
1988 1990 1992 1994 1996 1998 2000 2002 2004 2006 2008 2010 2012 2014 2016
Long-term average
Y/Y % change in the 15+ population, Calgary
Adult population growth
Source: RBC Economics Research, Statistics Canada
0.0
0.2
0.4
0.6
0.8
1.0
1.2
1.4
1.6
1988 1990 1992 1994 1996 1998 2000 2002 2004 2006 2008 2010 2012 2014 2016
Long-term average
Units per 1,000 population, Calgary, n.s.a.
Completed and unsold units - singles and semis
Source: RBC Economics Research, Statistics Canada, Canada Mortgage and Housing Corporation
There are few signs of overbuilding of single-detached homes in Calgary.
The number of unsold single-detached and semi-detached has trended
lower after 2000 and stabilized at historically low levels since early 2015
(on a per 1000 population basis).
Despite the turbulence in the resale market, stability of the unsold inven-
tory is being achieved by drastic curtailment of new single-family home
construction. Single-family home starts plummeted by 36% last year
and were down 27% y/y in the first seven months of 2016.
Such builder restraint substantially minimizes overbuilding risks in this
category.
0.0
0.1
0.2
0.3
0.4
0.5
0.6
0.7
0.8
1988 1990 1992 1994 1996 1998 2000 2002 2004 2006 2008 2010 2012 2014 2016
Long-term average
Units per 1,000 population, Calgary, n.s.a.
Completed and unsold units - multiples
Source: RBC Economics Research, Statistics Canada, Canada Mortgage and Housing Corporation
The number of unabsorbed multi-unit dwellings has surged since the
spring of 2015, albeit from extremely low levels (when Calgary arguably
had a supply shortage).
The stock of unsold units was driven higher by sharp increases in condo
apartment completions (up by 39% in 2015 and 19% year-to-date in
2016) at a time when demand turned cold.
The completed and unsold inventory recently rocketed passed the long-
term average (on a per 1000 population basis) for the area and into the
high risk zone. There is growing evidence of surplus in this segment of
the market in Calgary, which may threaten the stability of the market.

CANADIAN HOUSING HEALTH CHECK | SEPTEMBER 2016
22
Supply fundamentals
CALGARY AREA
0
1
2
3
4
5
6
7
8
1988 1990 1992 1994 1996 1998 2000 2002 2004 2006 2008 2010 2012 2014 2016
Long-term average
Units per 1,000 population, Calgary, n.s.a.
Housing under construction - singles
Source: RBC Economics Research, Statistics Canada, Canada Mortgage and Housing Corporation
The dramatic scaling back of single-detached home starts contributed to
a steady decline in the number of units under construction in the past
year to historically low levels in recent months.
Such subdued levels of construction pose minimal risks of destabilizing
the market.
0
2
4
6
8
10
12
14
1988 1990 1992 1994 1996 1998 2000 2002 2004 2006 2008 2010 2012 2014 2016
Long-term average
Units per 1,000 population, Calgary, n.s.a.
Housing under construction - multiples
Source: RBC Economics Research, Statistics Canada, Canada Mortgage and Housing Corporation
There has been some moderation on the multi-unit side as well this year;
however, the level of construction remains historically elevated due to a
wave in condo starts in 2014 that continues to proceed through the con-
struction ‘pipeline’.
Current levels pose significant—albeit diminishing—risks for the market
especially in light of soft demand and high unsold inventories.
Sharp drops in condo apartment starts in 2015 (down 26%) and so far in
2016 (down 32%) suggest that further moderation is likely ahead.
The material contained in this report is the property of Royal Bank of Canada and may not be reproduced in any way, in whole or in part, without express authoriza-tion of the copyright holder in writing. The statements and statistics contained herein have been prepared by RBC Economics Research based on information from
sources considered to be reliable. We make no representation or warranty, express or implied, as to its accuracy or completeness. This publication is for the infor-
mation of investors and business persons and does not constitute an offer to sell or a solicitation to buy securities.
®Registered trademark of Royal Bank of Canada.
©Royal Bank of Canada.