Embed Size (px)
Citation preview

PUNERESIDENTIAL & OFFICEJULY TO DECEMBER 2017

2
RESIDENTIAL RECAP H1 2017
Launches hit a new low since 2010
Discounts coupled with government’s focus
on affordable housing led to 11% YoY
increase in sales
More than half the new launches were in the
less than INR 25 lakh price bracket
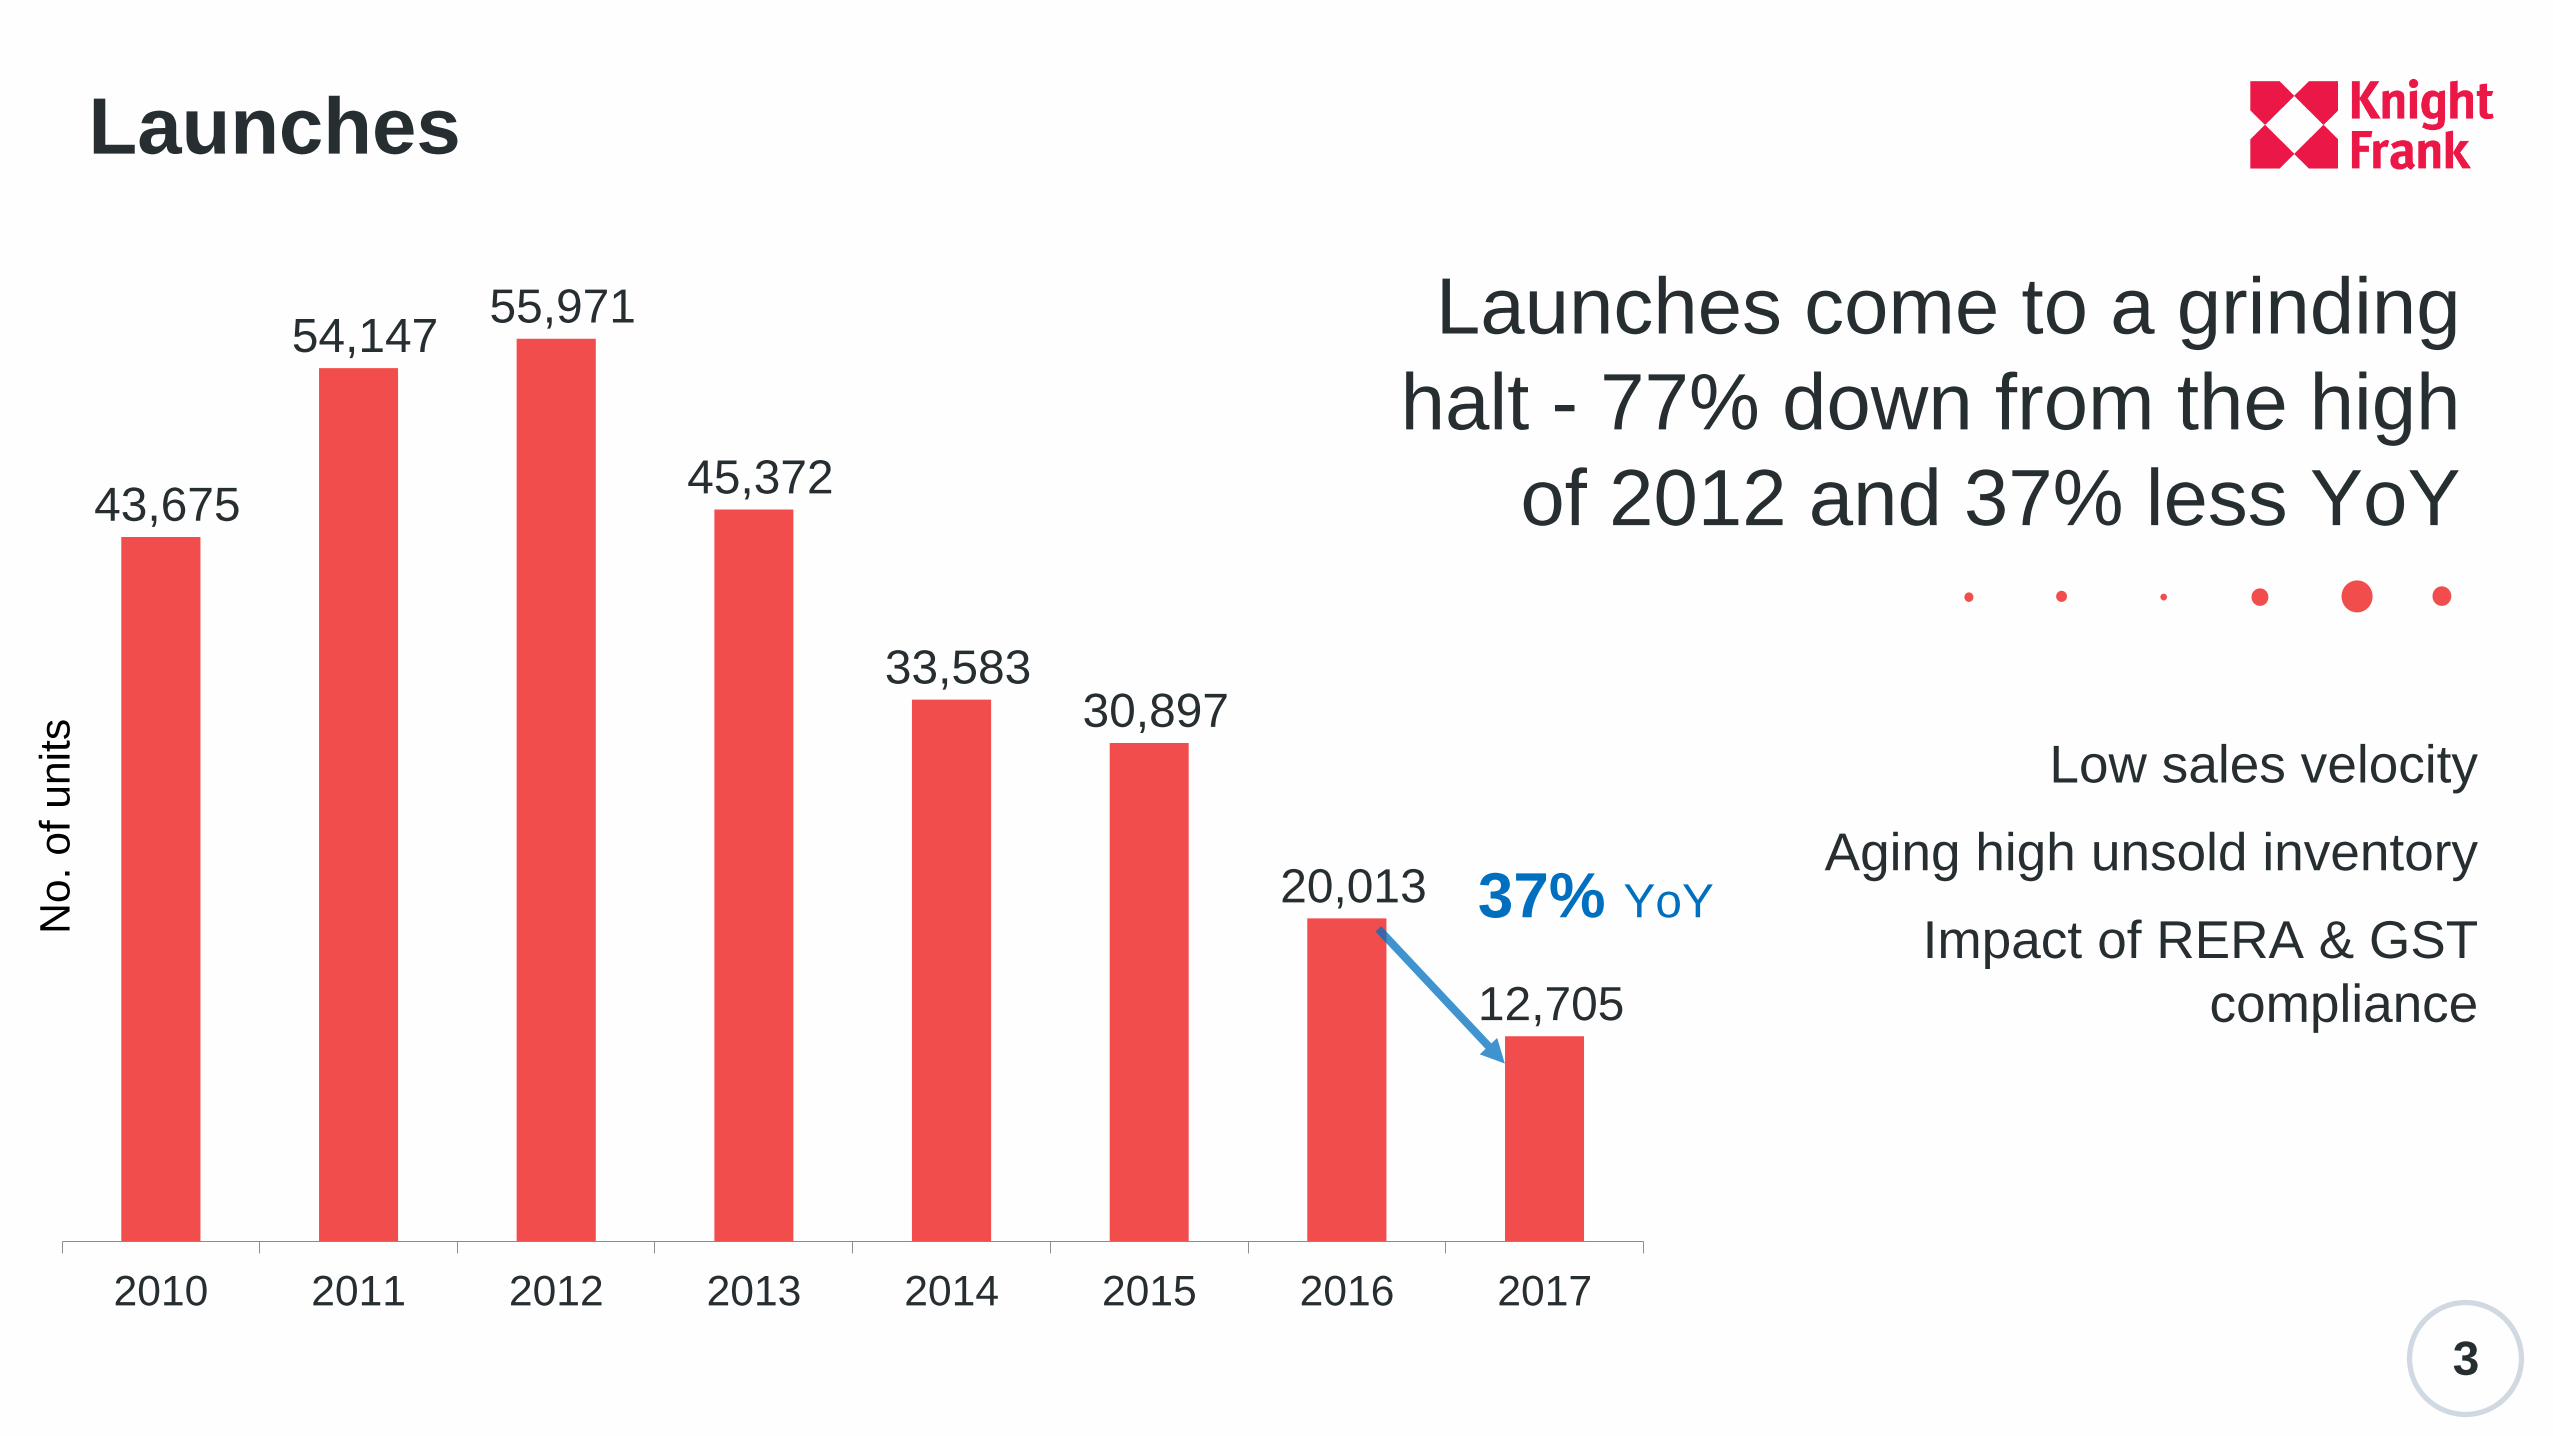
Low sales velocity
Aging high unsold inventory
Impact of RERA & GST
compliance
3
43,675
54,147 55,971
45,372
33,583 30,897
20,013
12,705
2010 2011 2012 2013 2014 2015 2016 2017
37% YoY
Launches
Launches come to a grinding
halt - 77% down from the high
of 2012 and 37% less YoY
No
. of u
nits
4
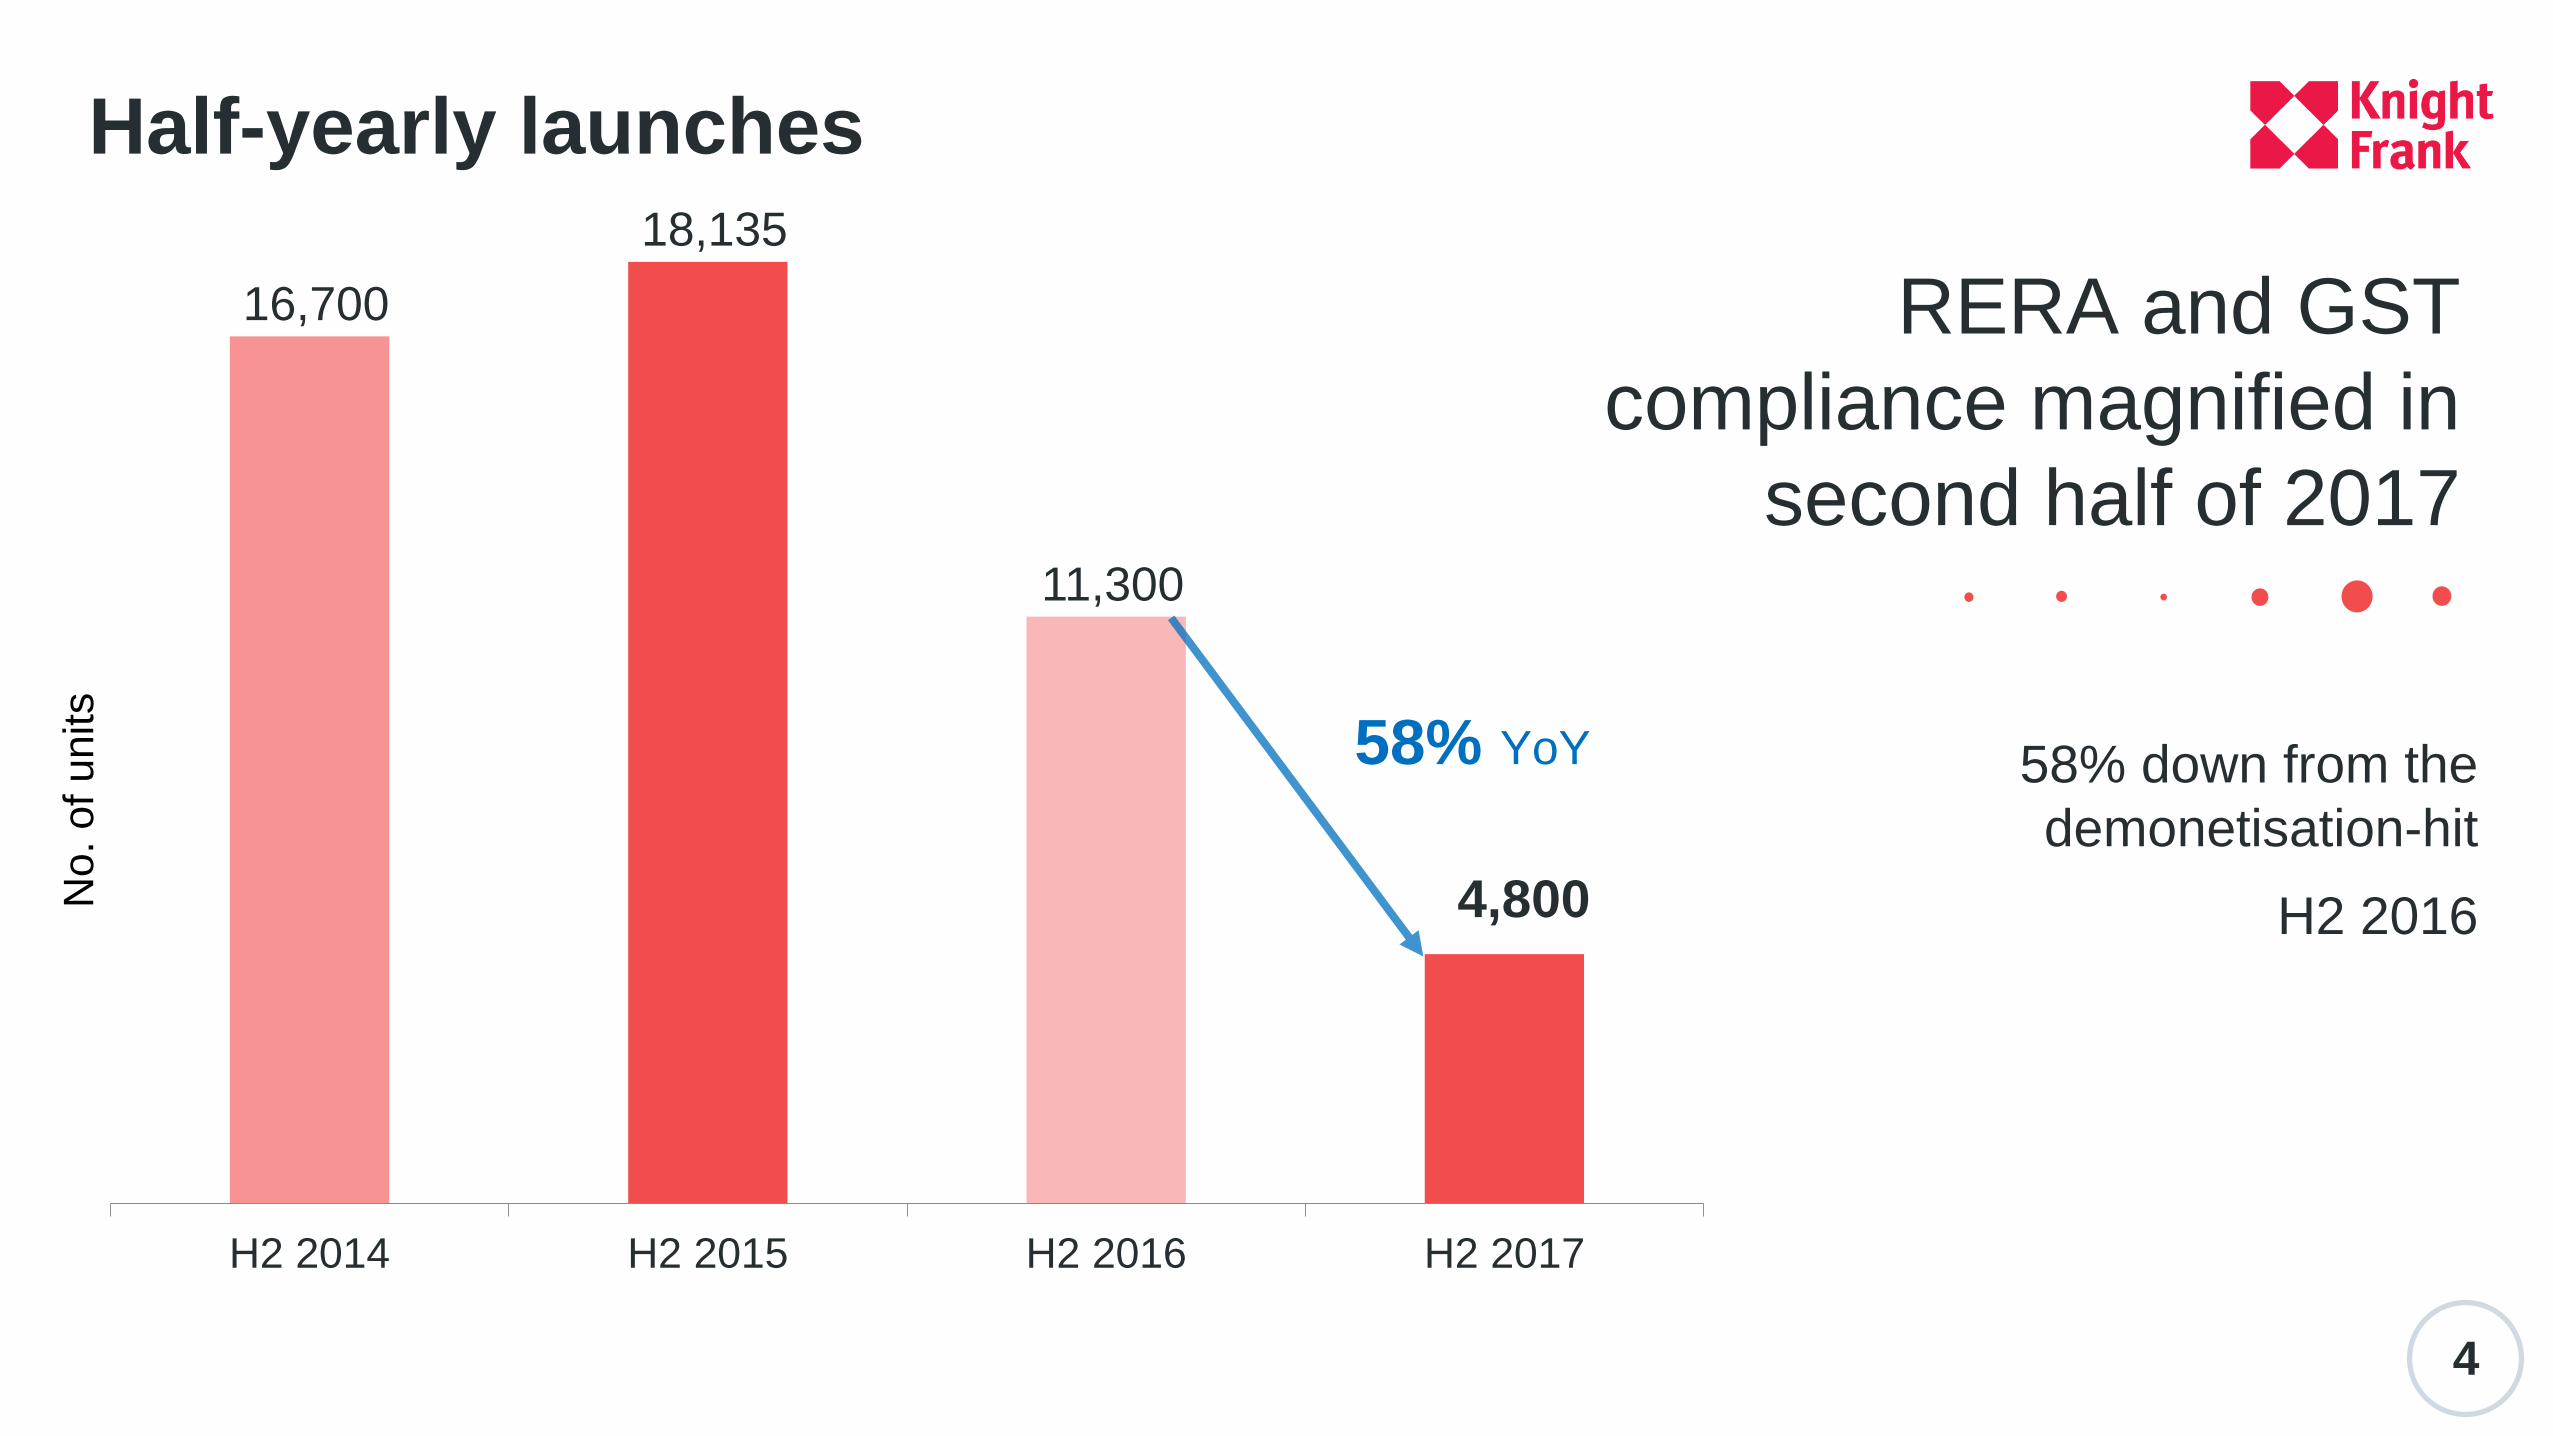
16,700
18,135
11,300
4,800
H2 2014 H2 2015 H2 2016 H2 2017
58% YoY
Half-yearly launches
RERA and GST
compliance magnified in
second half of 2017
58% down from the
demonetisation-hit
H2 2016
No
. of u
nits
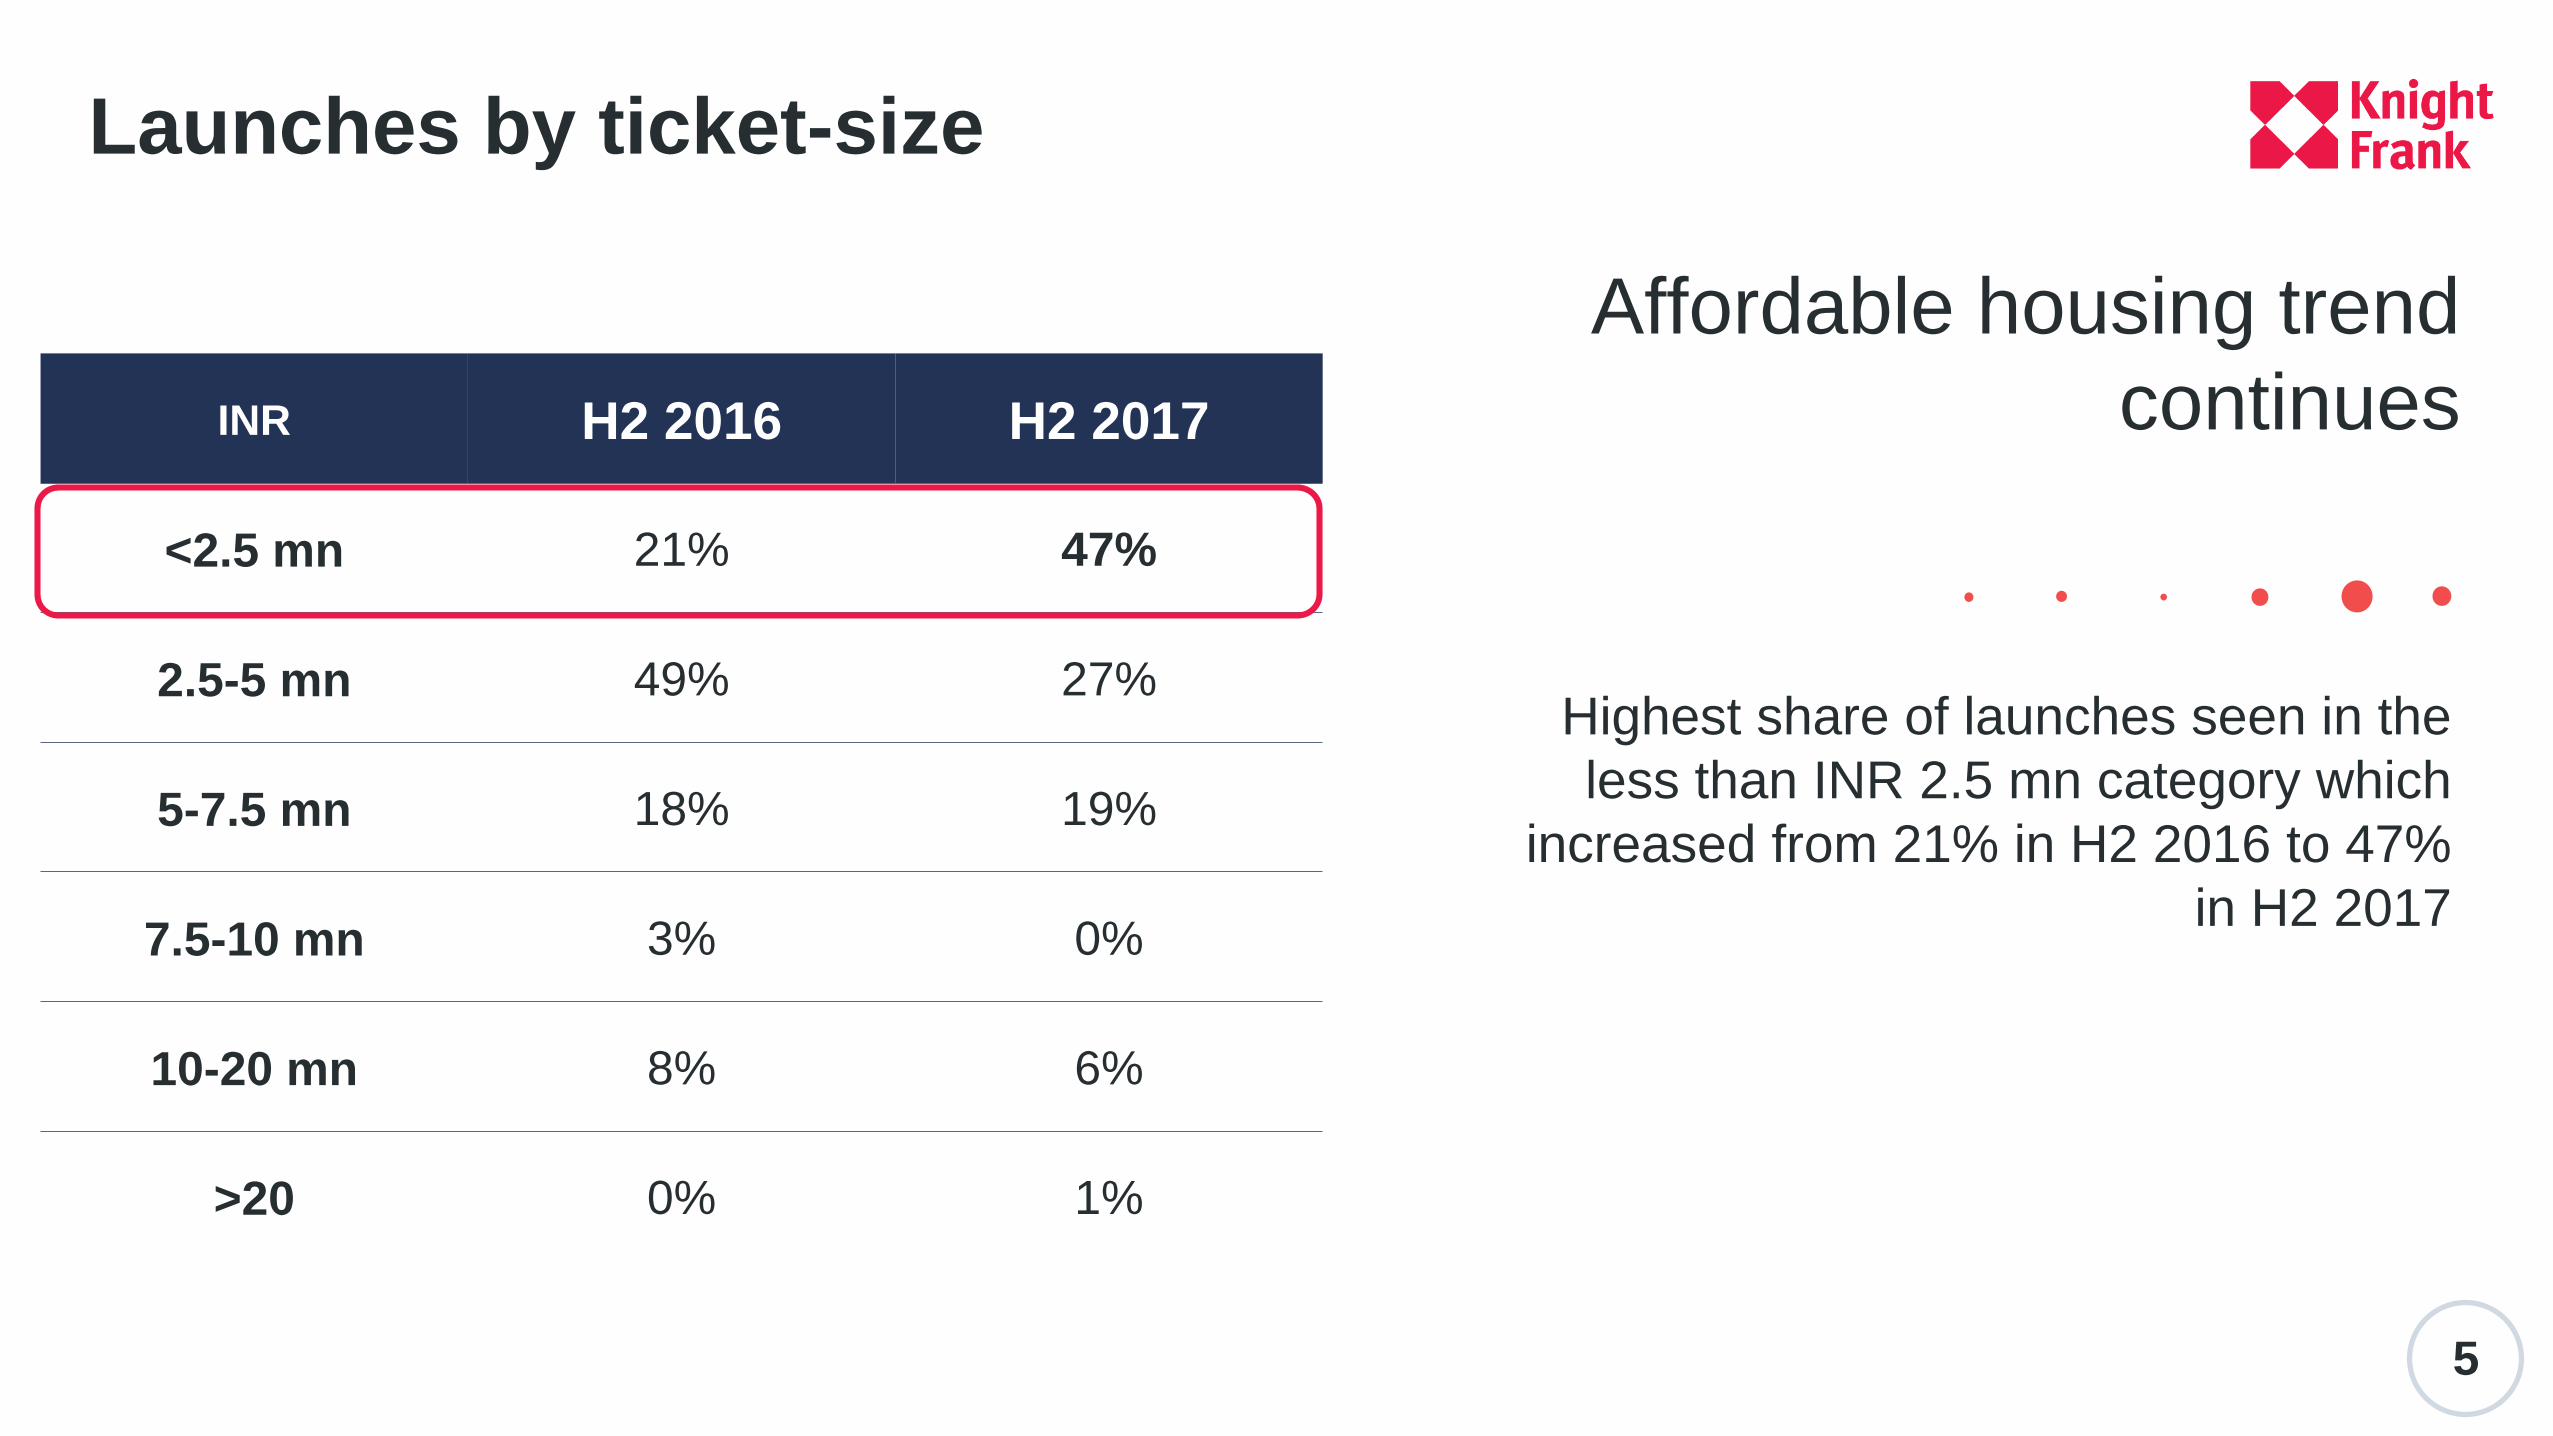
Highest share of launches seen in the
less than INR 2.5 mn category which
increased from 21% in H2 2016 to 47%
in H2 2017
5
Launches by ticket-size
Affordable housing trend
continuesINR H2 2016 H2 2017
<2.5 mn 21% 47%
2.5-5 mn 49% 27%
5-7.5 mn 18% 19%
7.5-10 mn 3% 0%
10-20 mn 8% 6%
>20 0% 1%
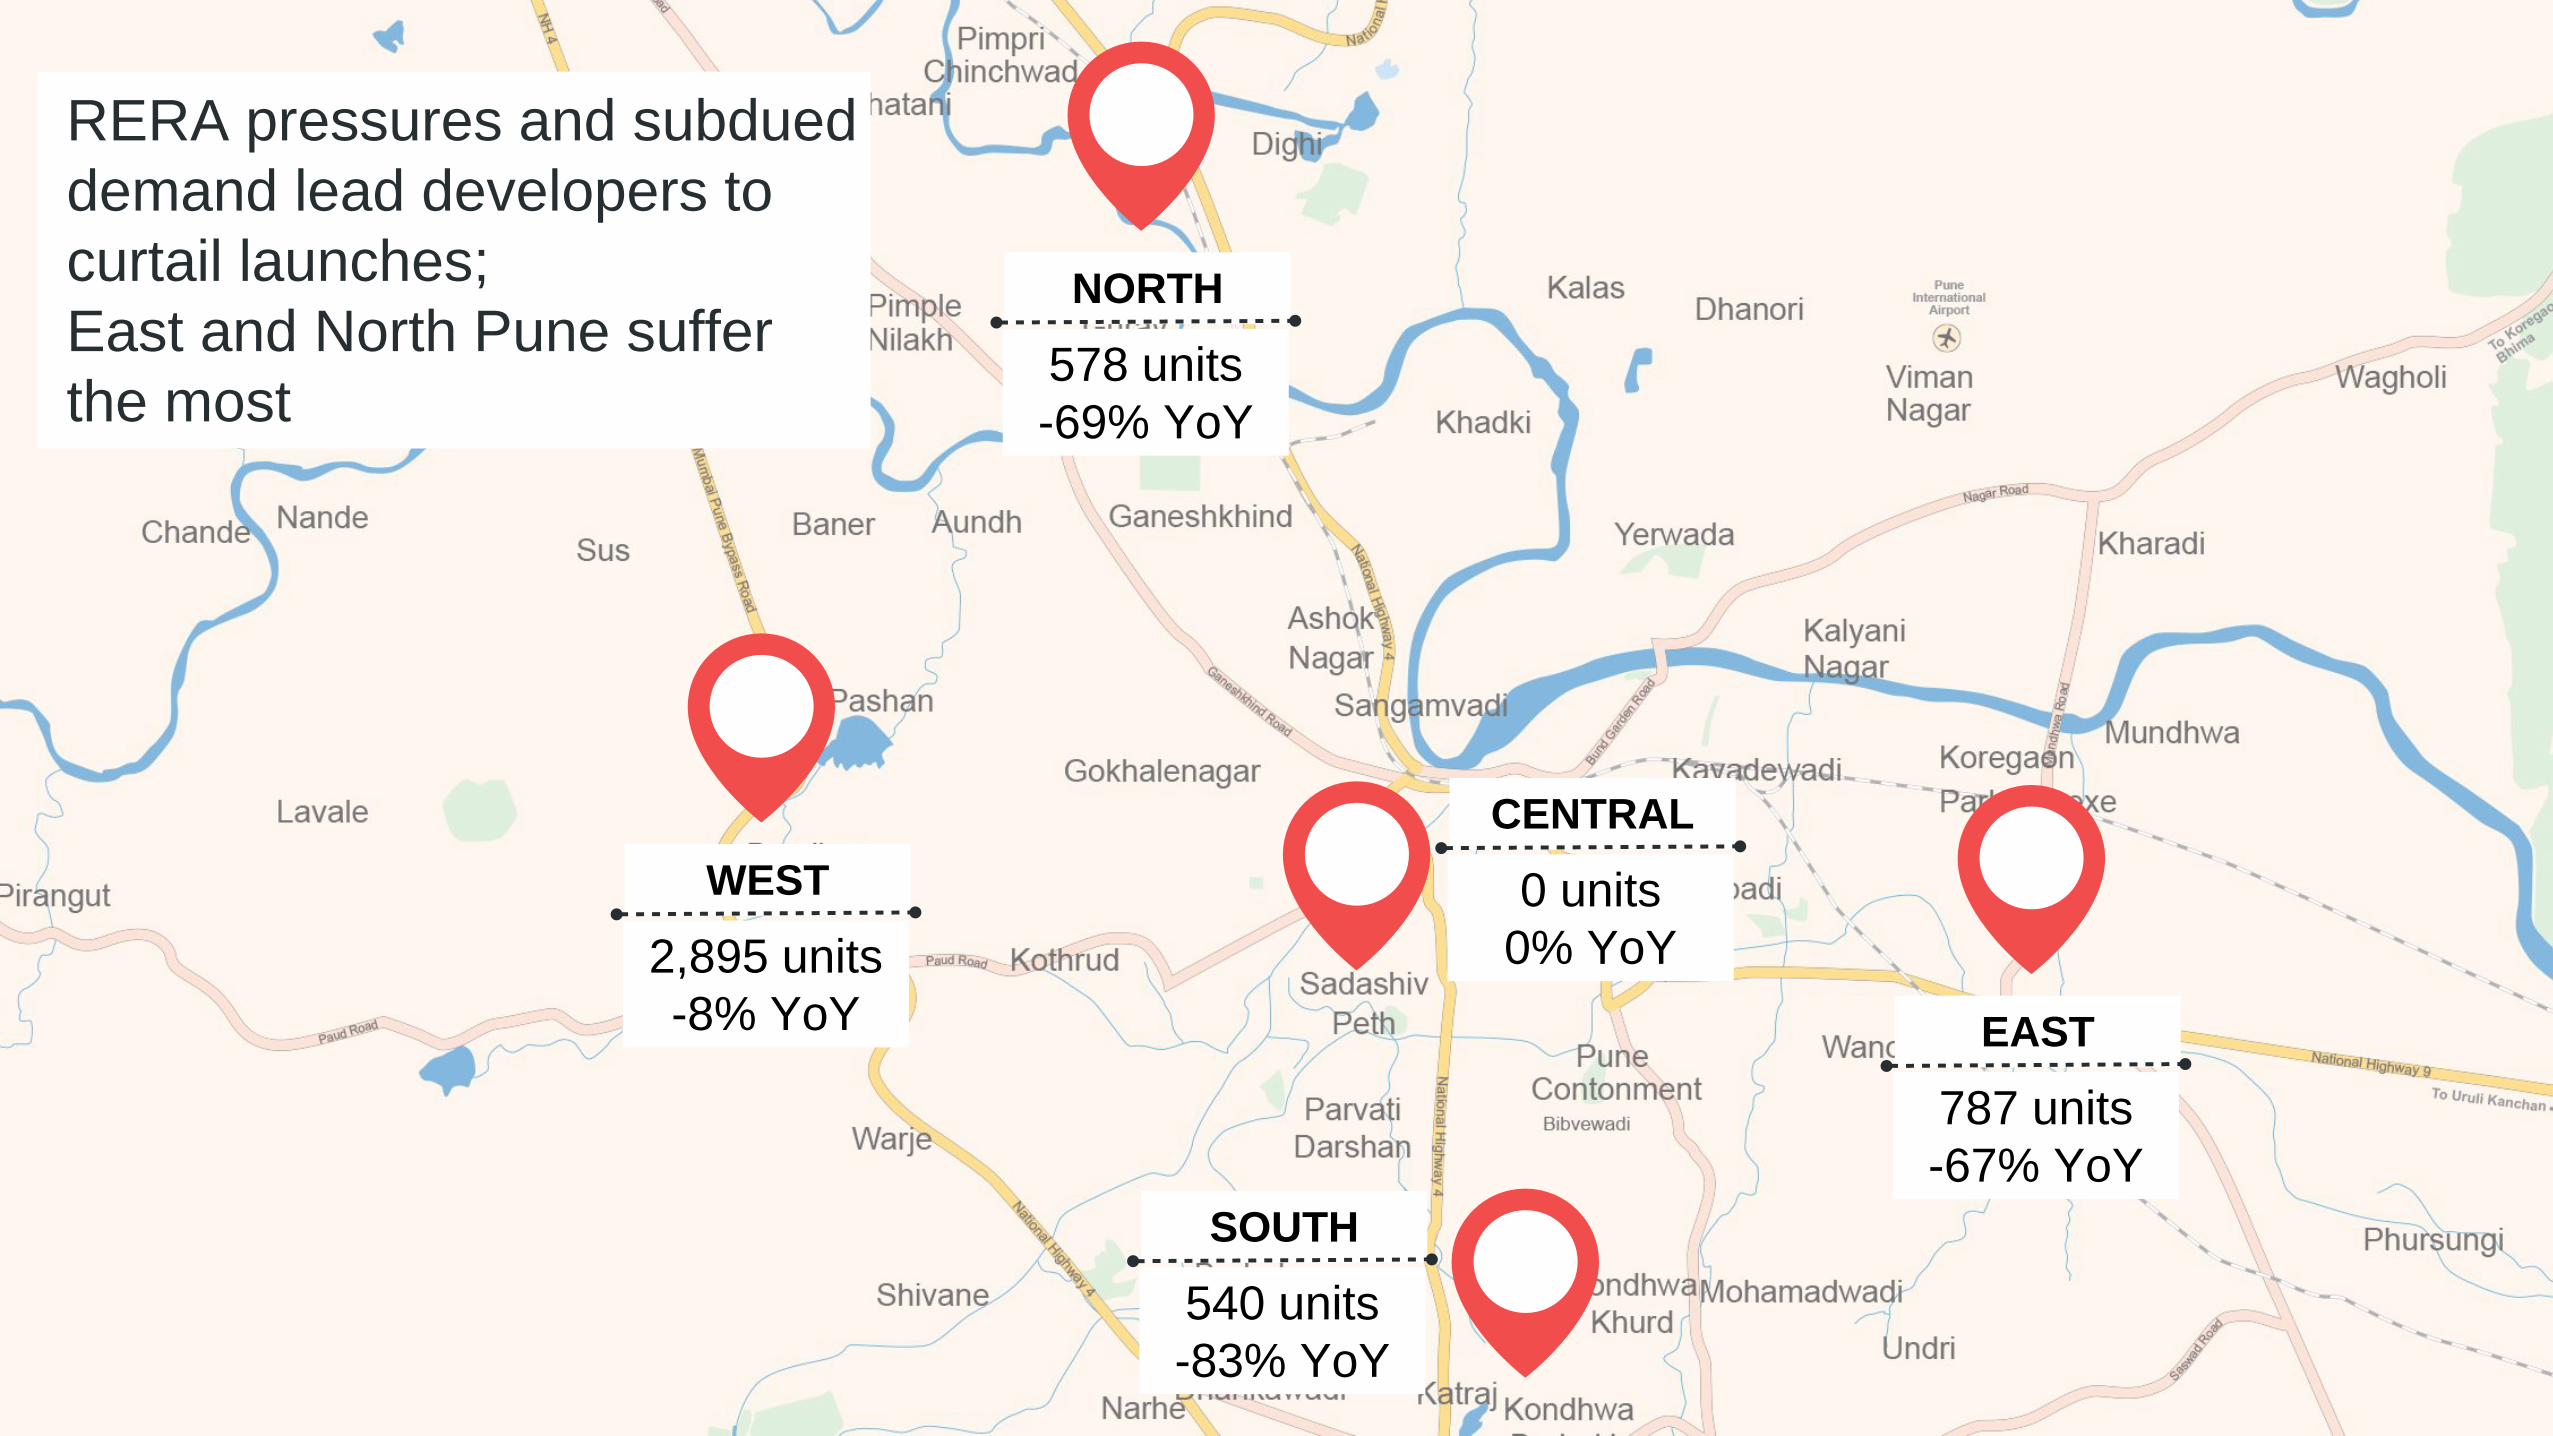
EAST
787 units
-67% YoY
NORTH
578 units
-69% YoY
WEST
2,895 units
-8% YoY
SOUTH
540 units
-83% YoY
CENTRAL
0 units
0% YoY
RERA pressures and subdued
demand lead developers to
curtail launches;
East and North Pune suffer
the most
7
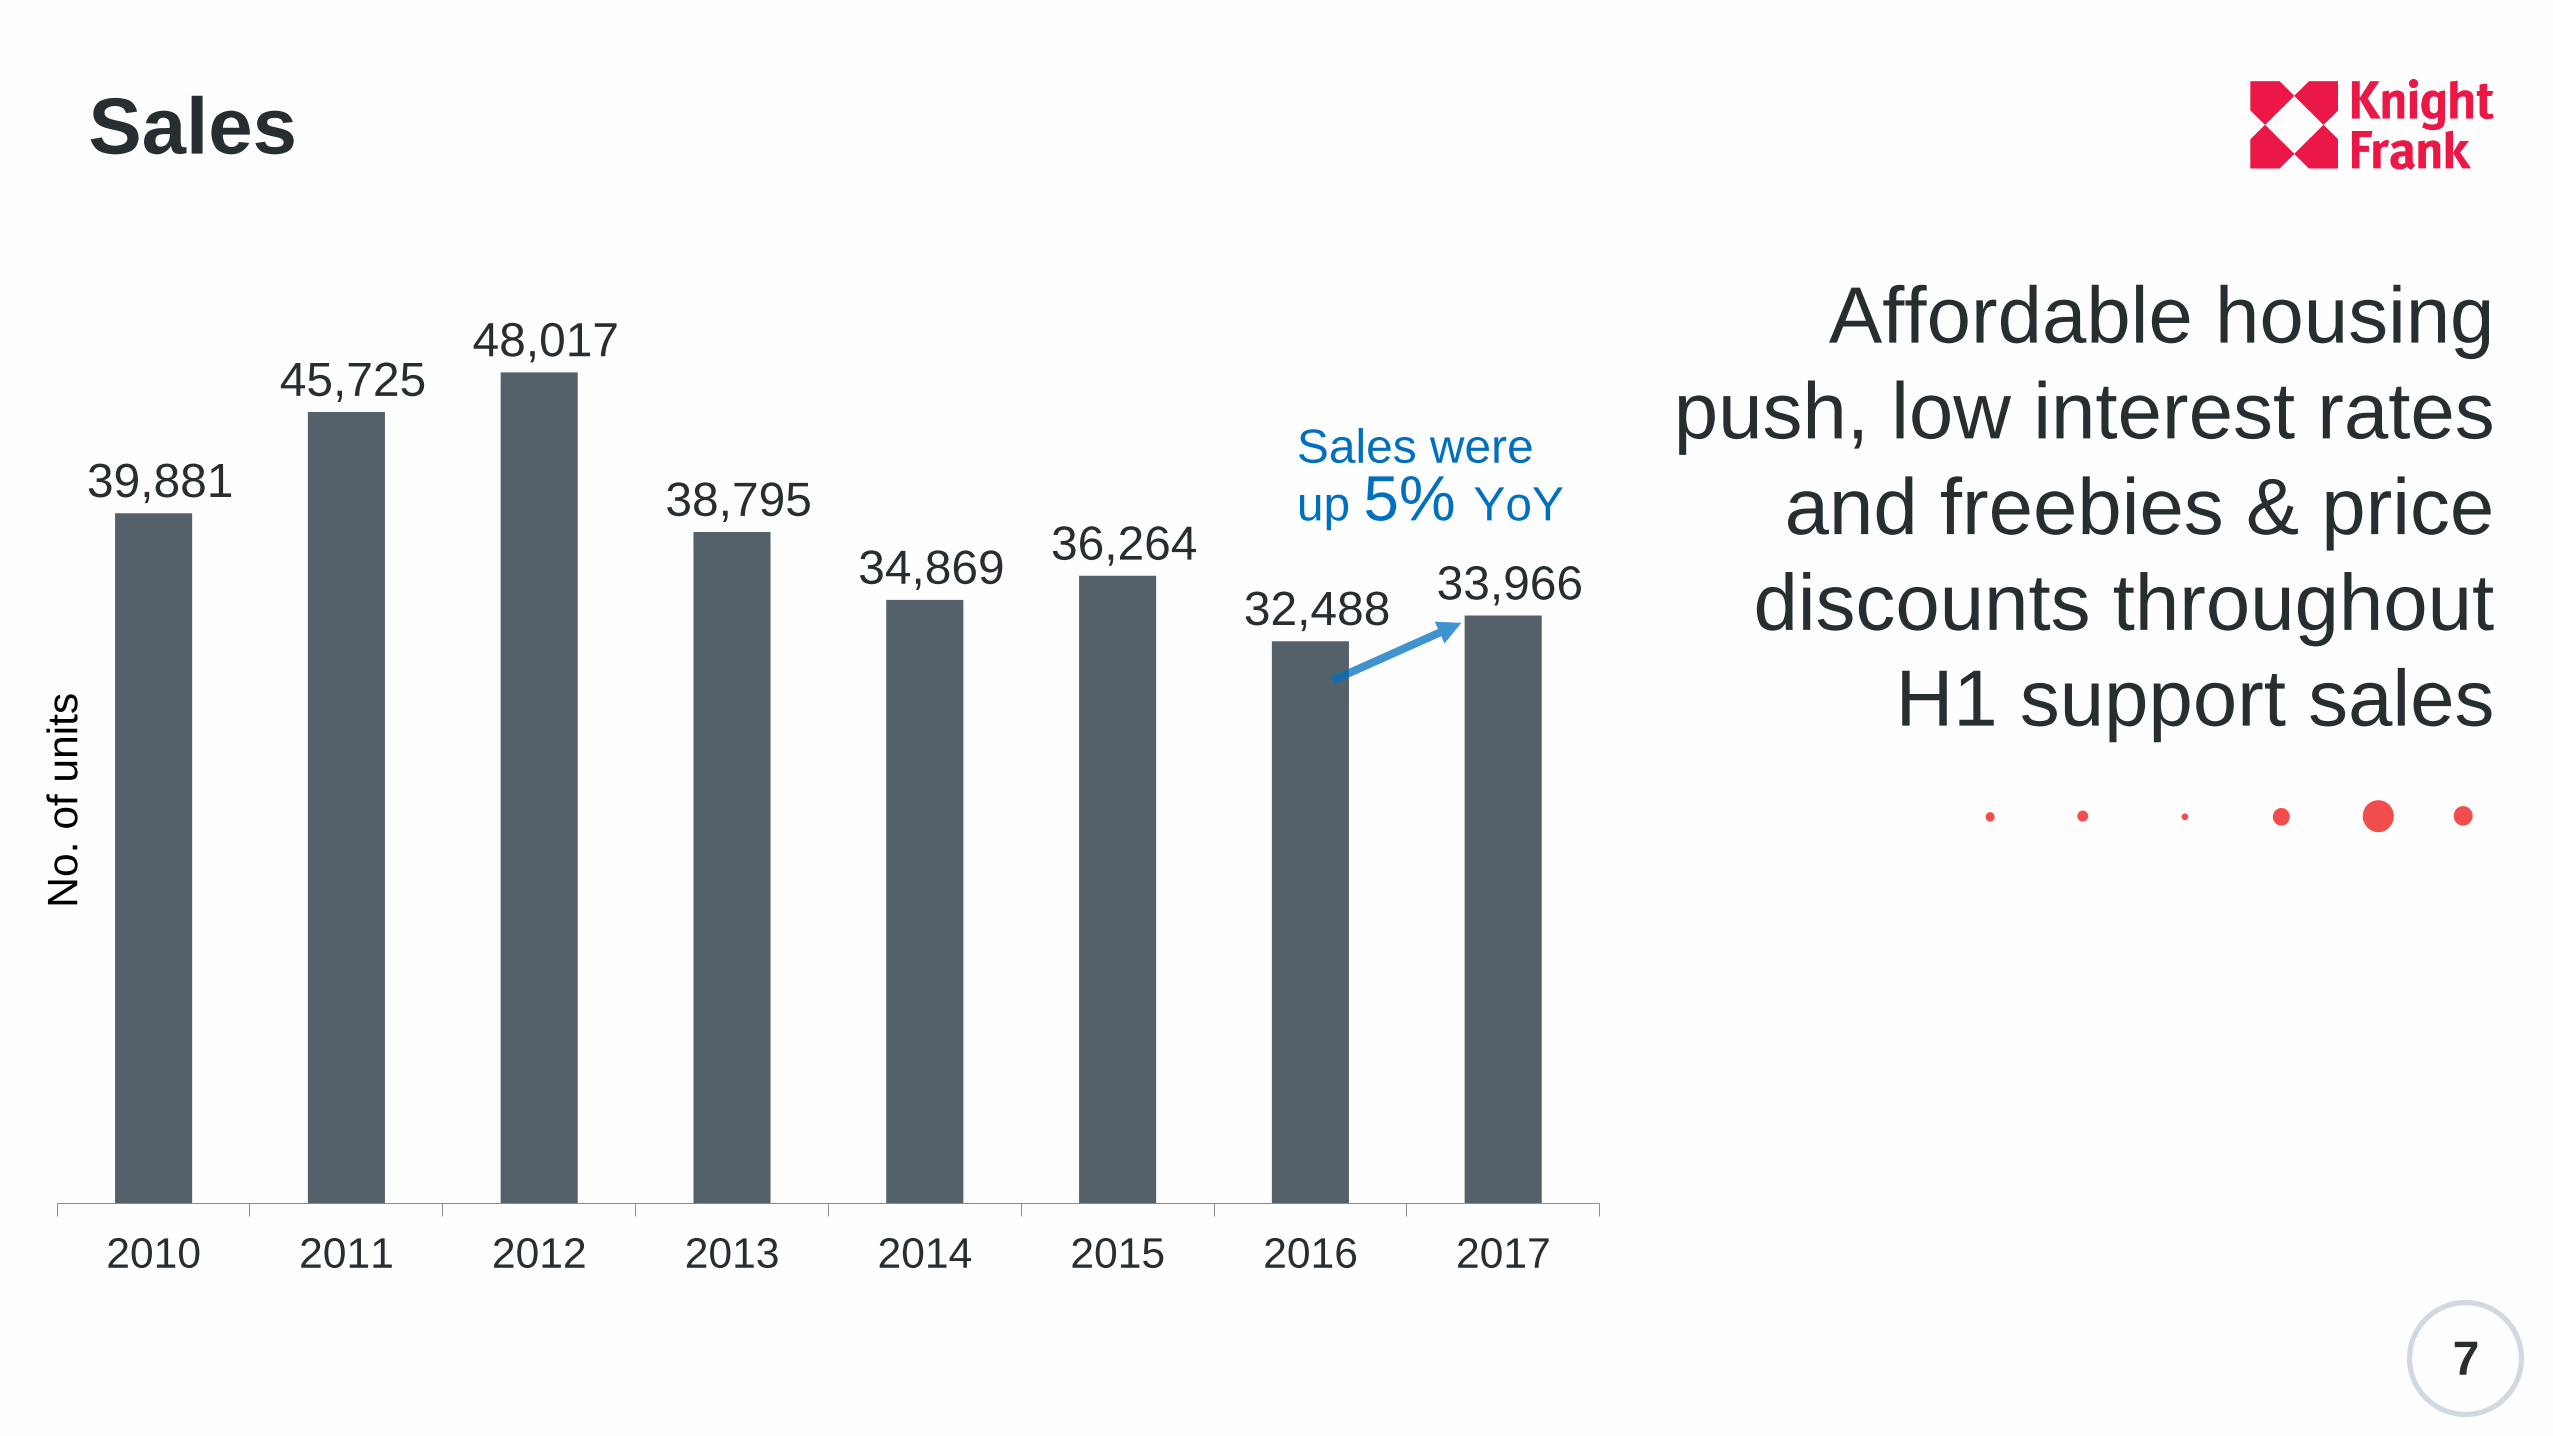
39,881
45,725 48,017
38,795
34,869 36,264
32,488 33,966
2010 2011 2012 2013 2014 2015 2016 2017
Sales were
up 5% YoY
Sales
Affordable housing
push, low interest rates
and freebies & price
discounts throughout
H1 support sales
No
. of u
nits
8
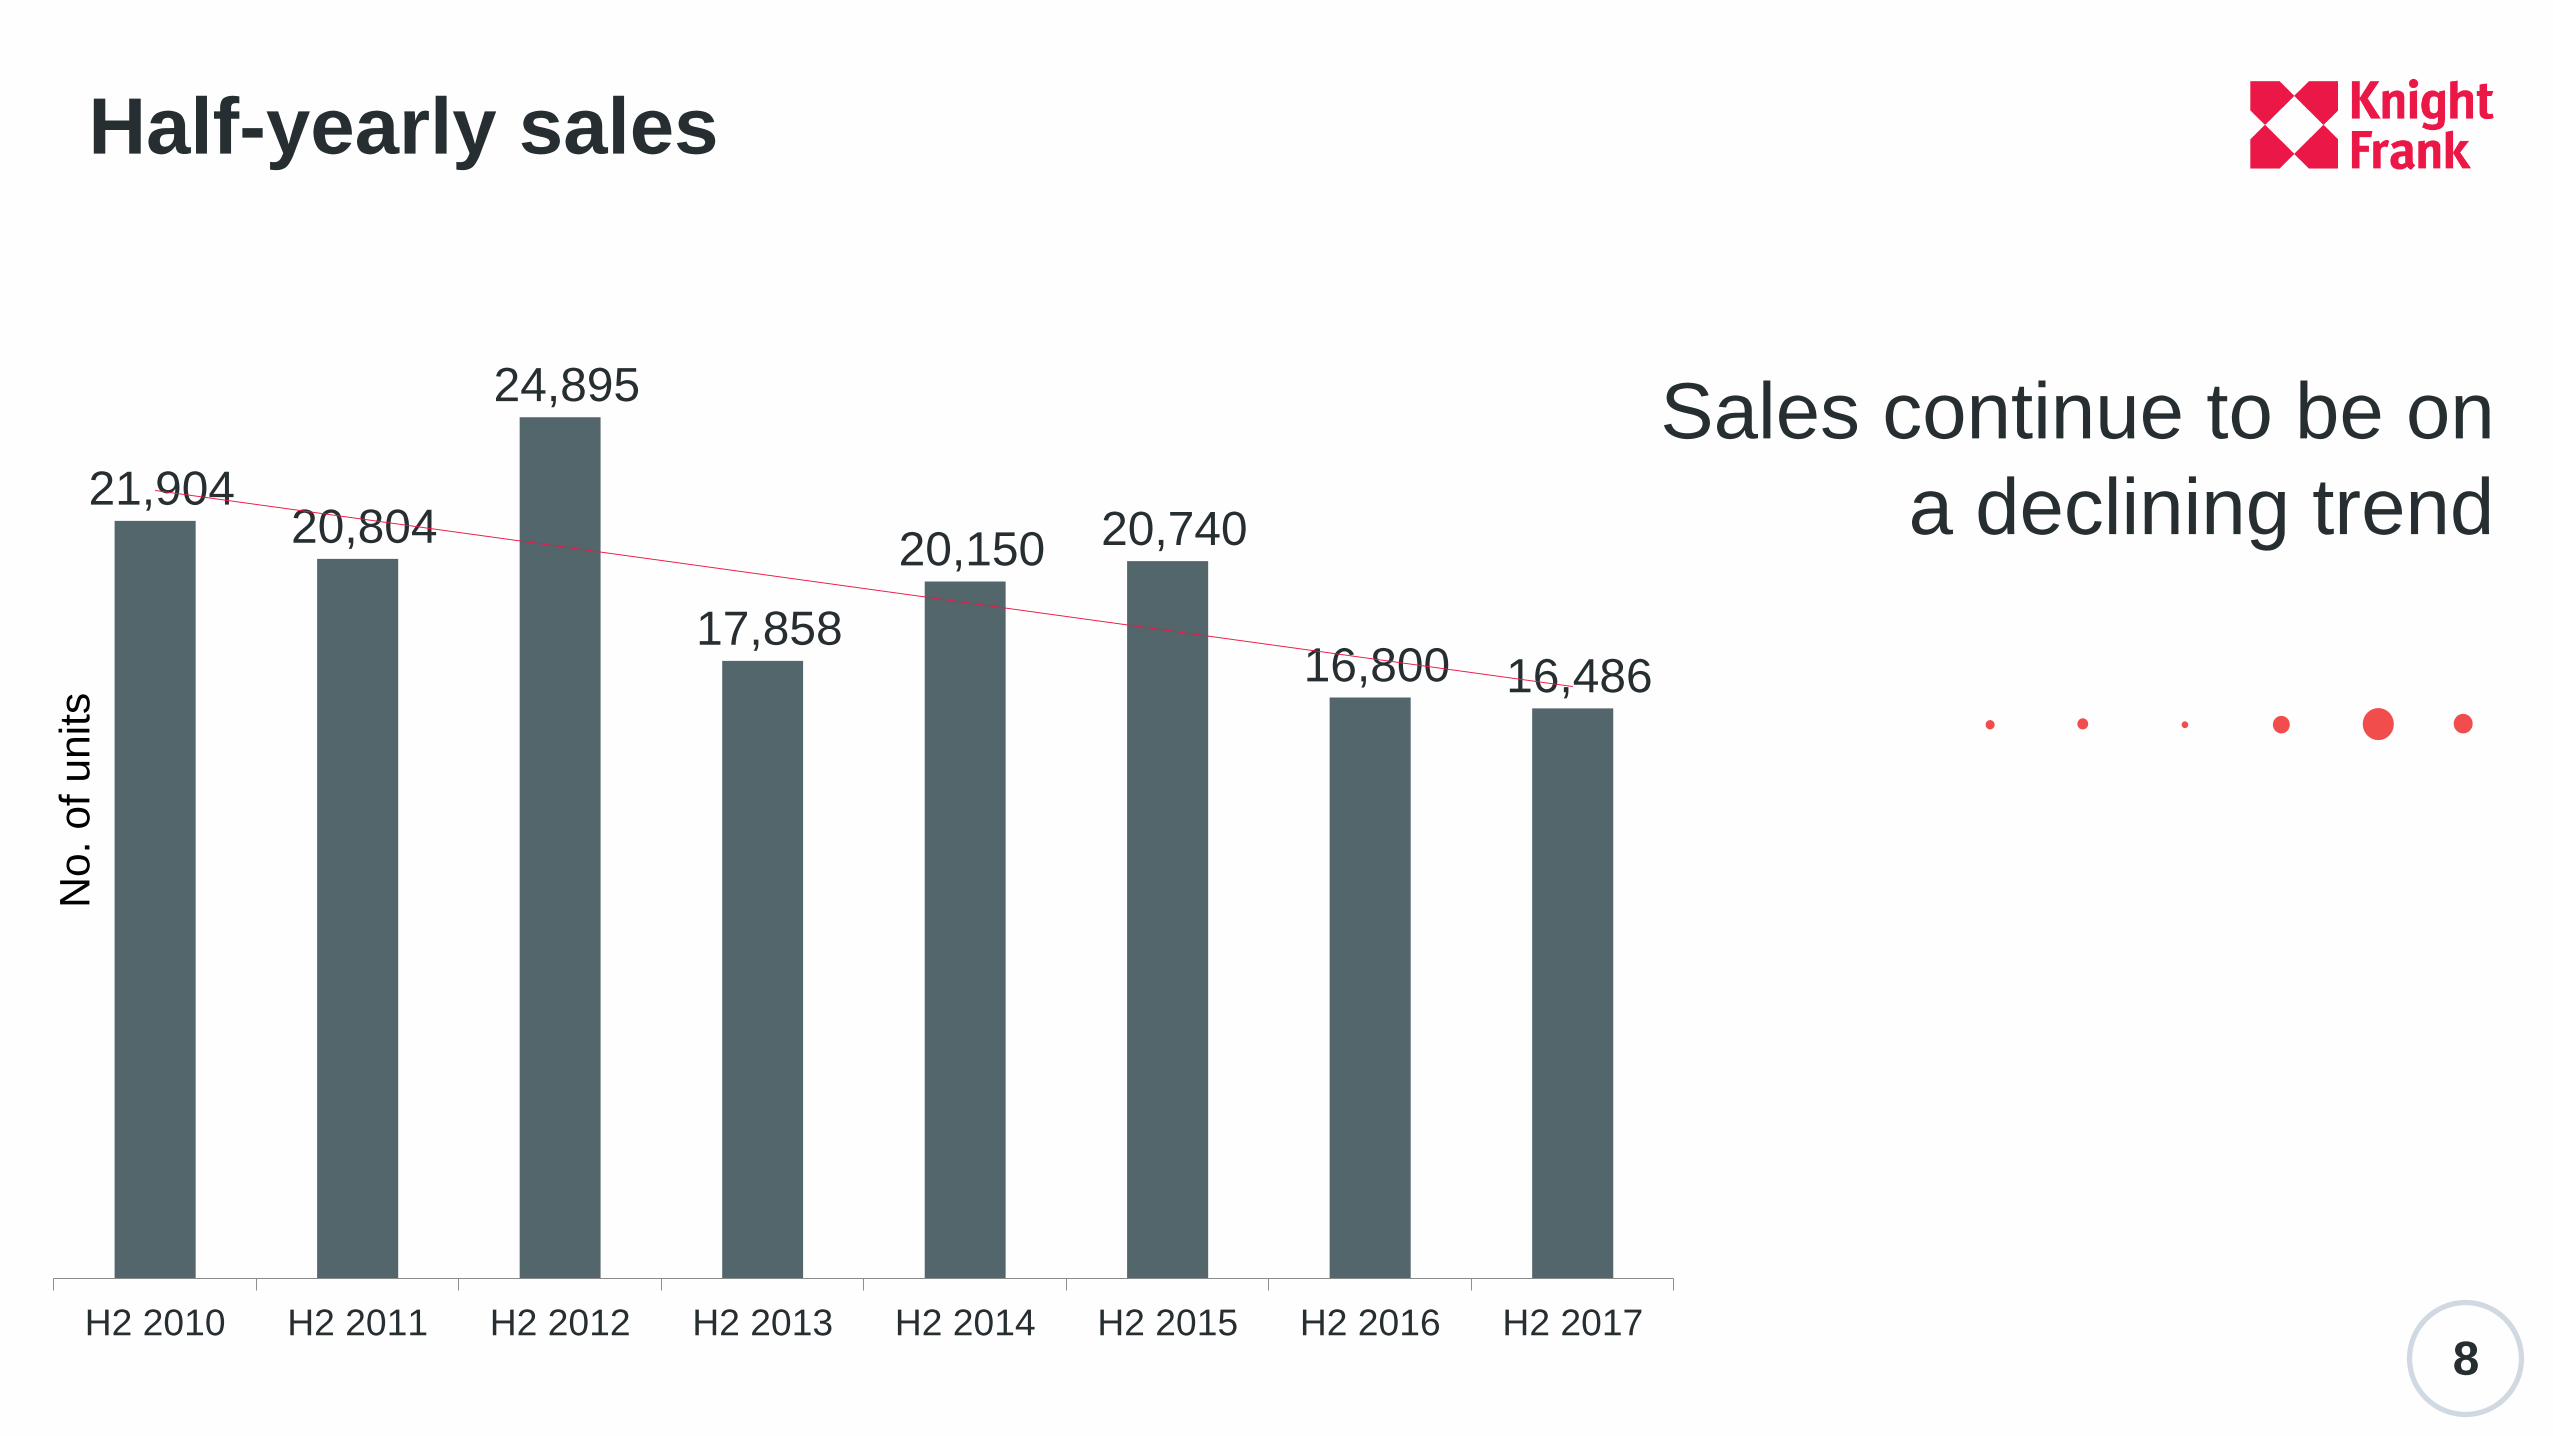
21,904 20,804
24,895
17,858
20,150 20,740
16,800 16,486
H2 2010 H2 2011 H2 2012 H2 2013 H2 2014 H2 2015 H2 2016 H2 2017
Half-yearly sales
Sales continue to be on
a declining trend
No
. of u
nits
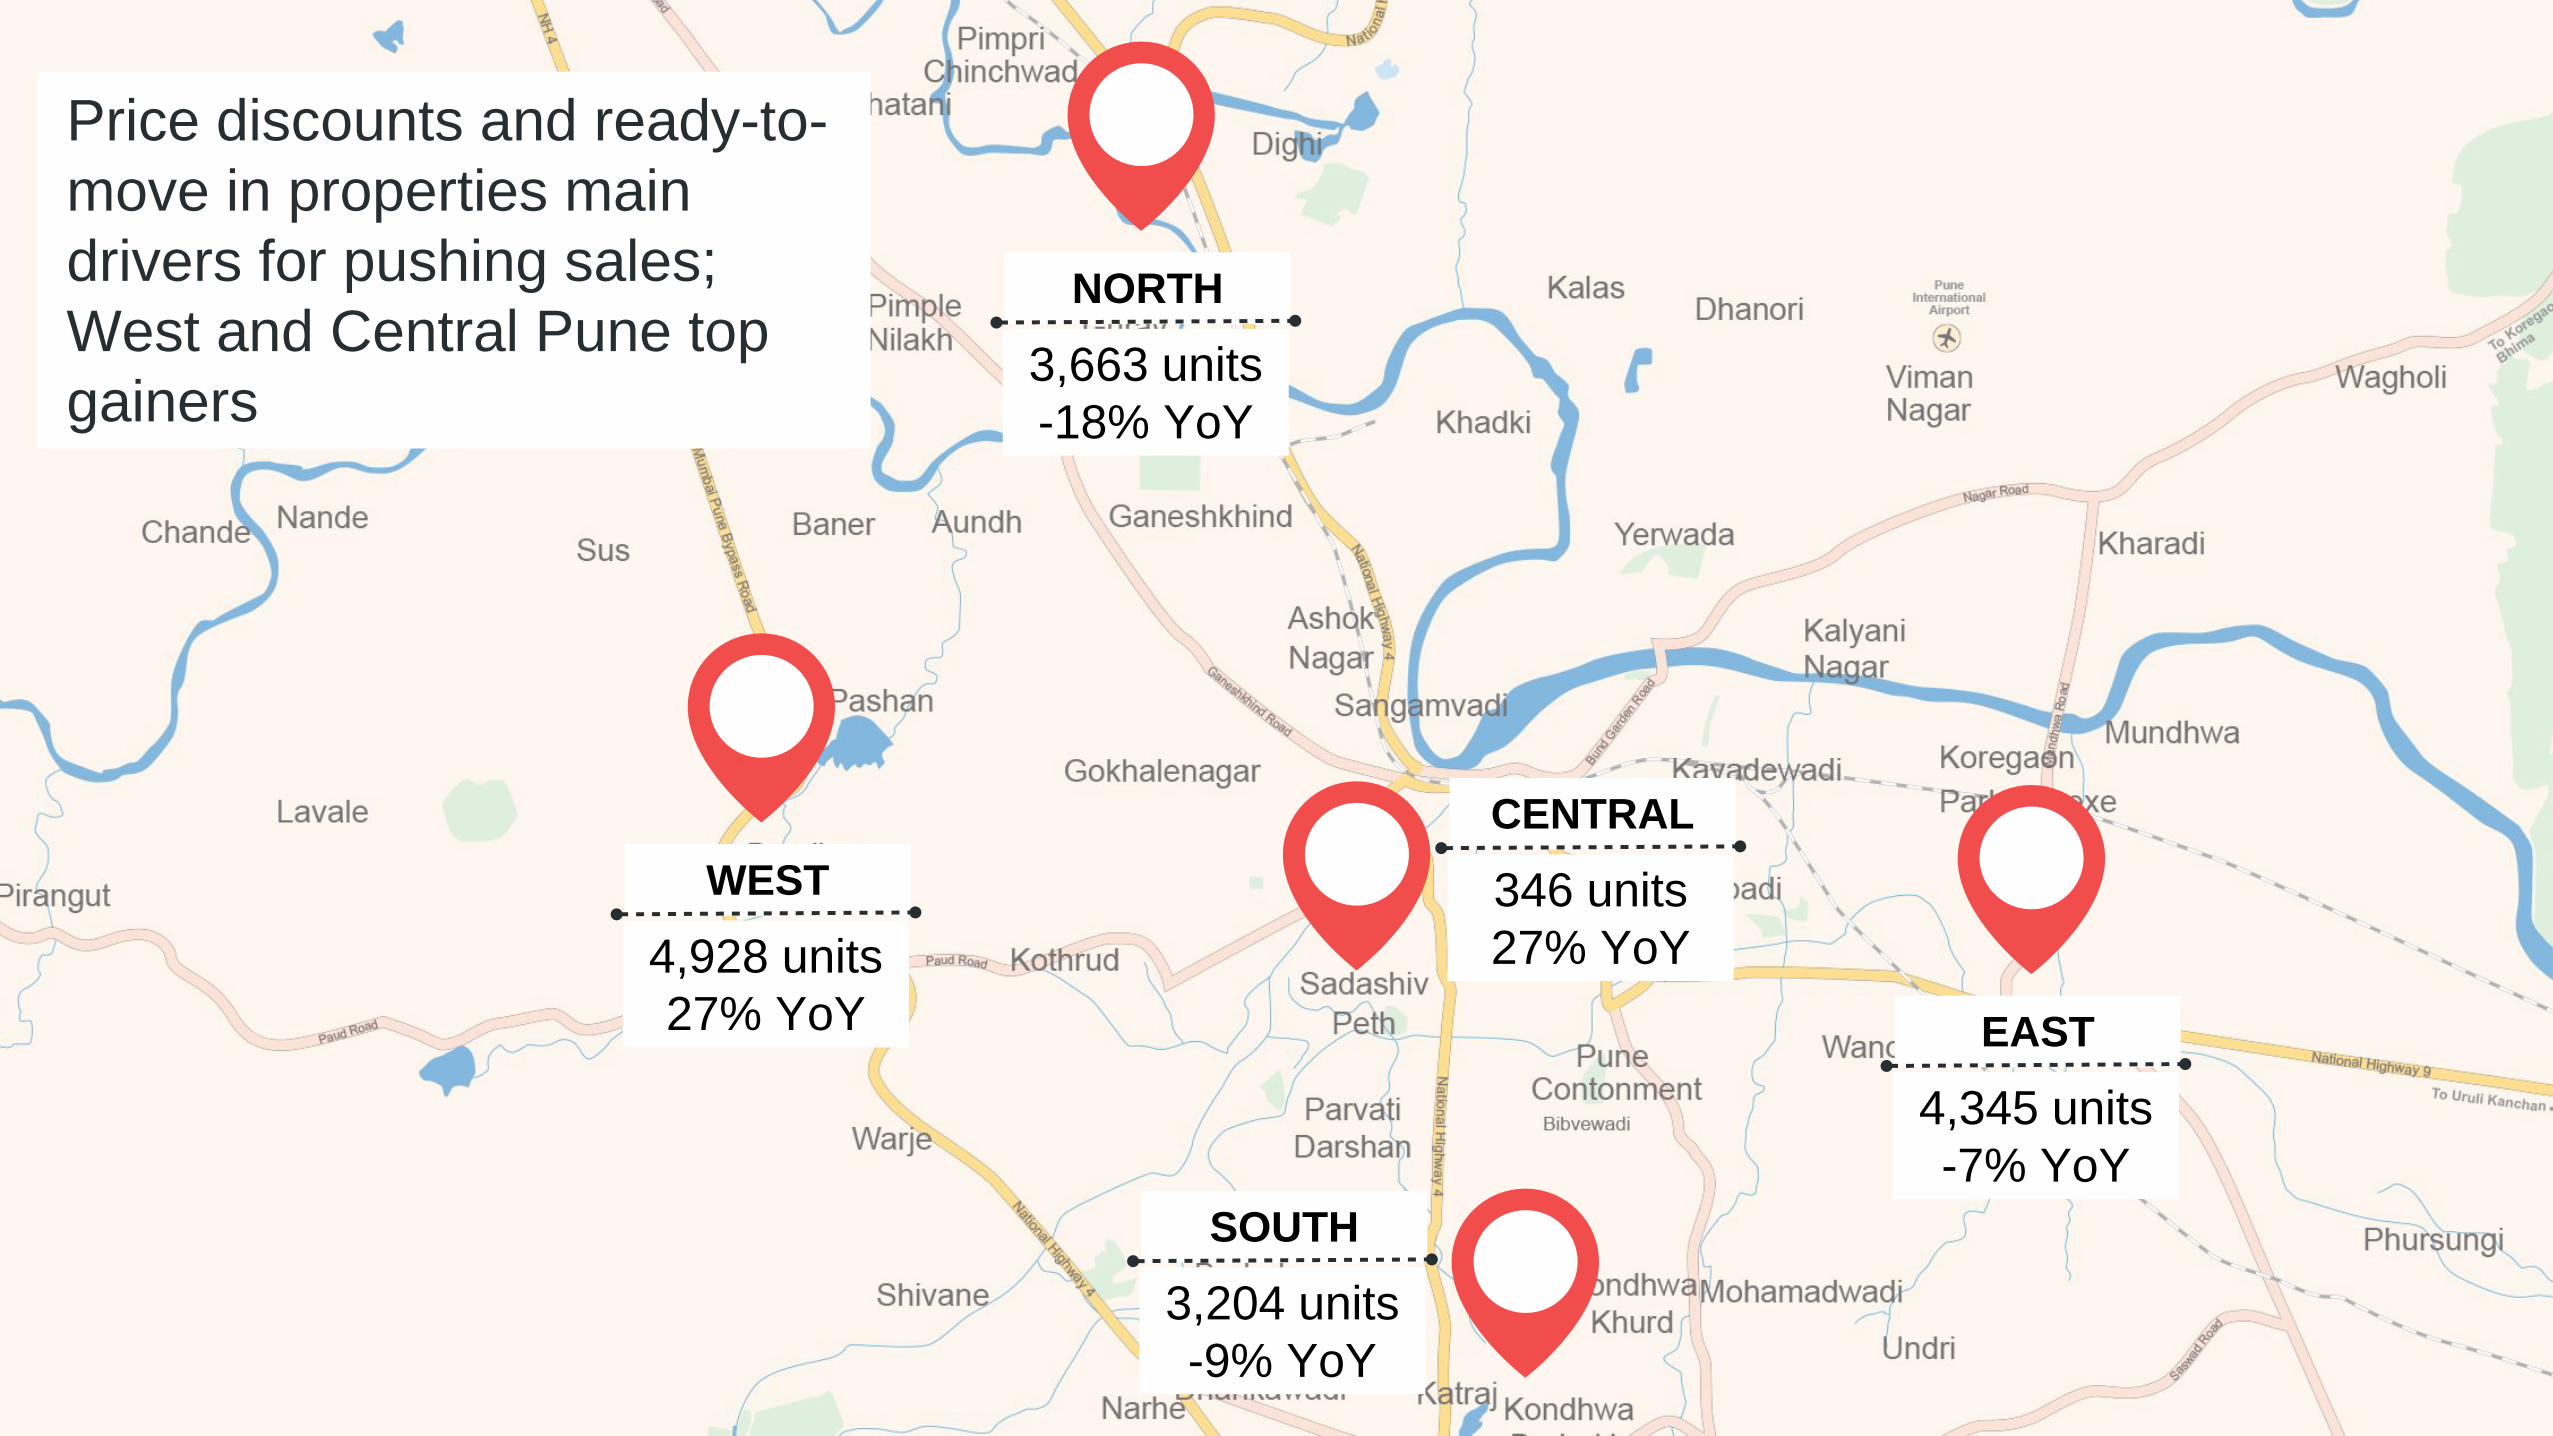
EAST
4,345 units
-7% YoY
NORTH
3,663 units
-18% YoY
WEST
4,928 units
27% YoY
SOUTH
3,204 units
-9% YoY
CENTRAL
346 units
27% YoY
Price discounts and ready-to-
move in properties main
drivers for pushing sales;
West and Central Pune top
gainers
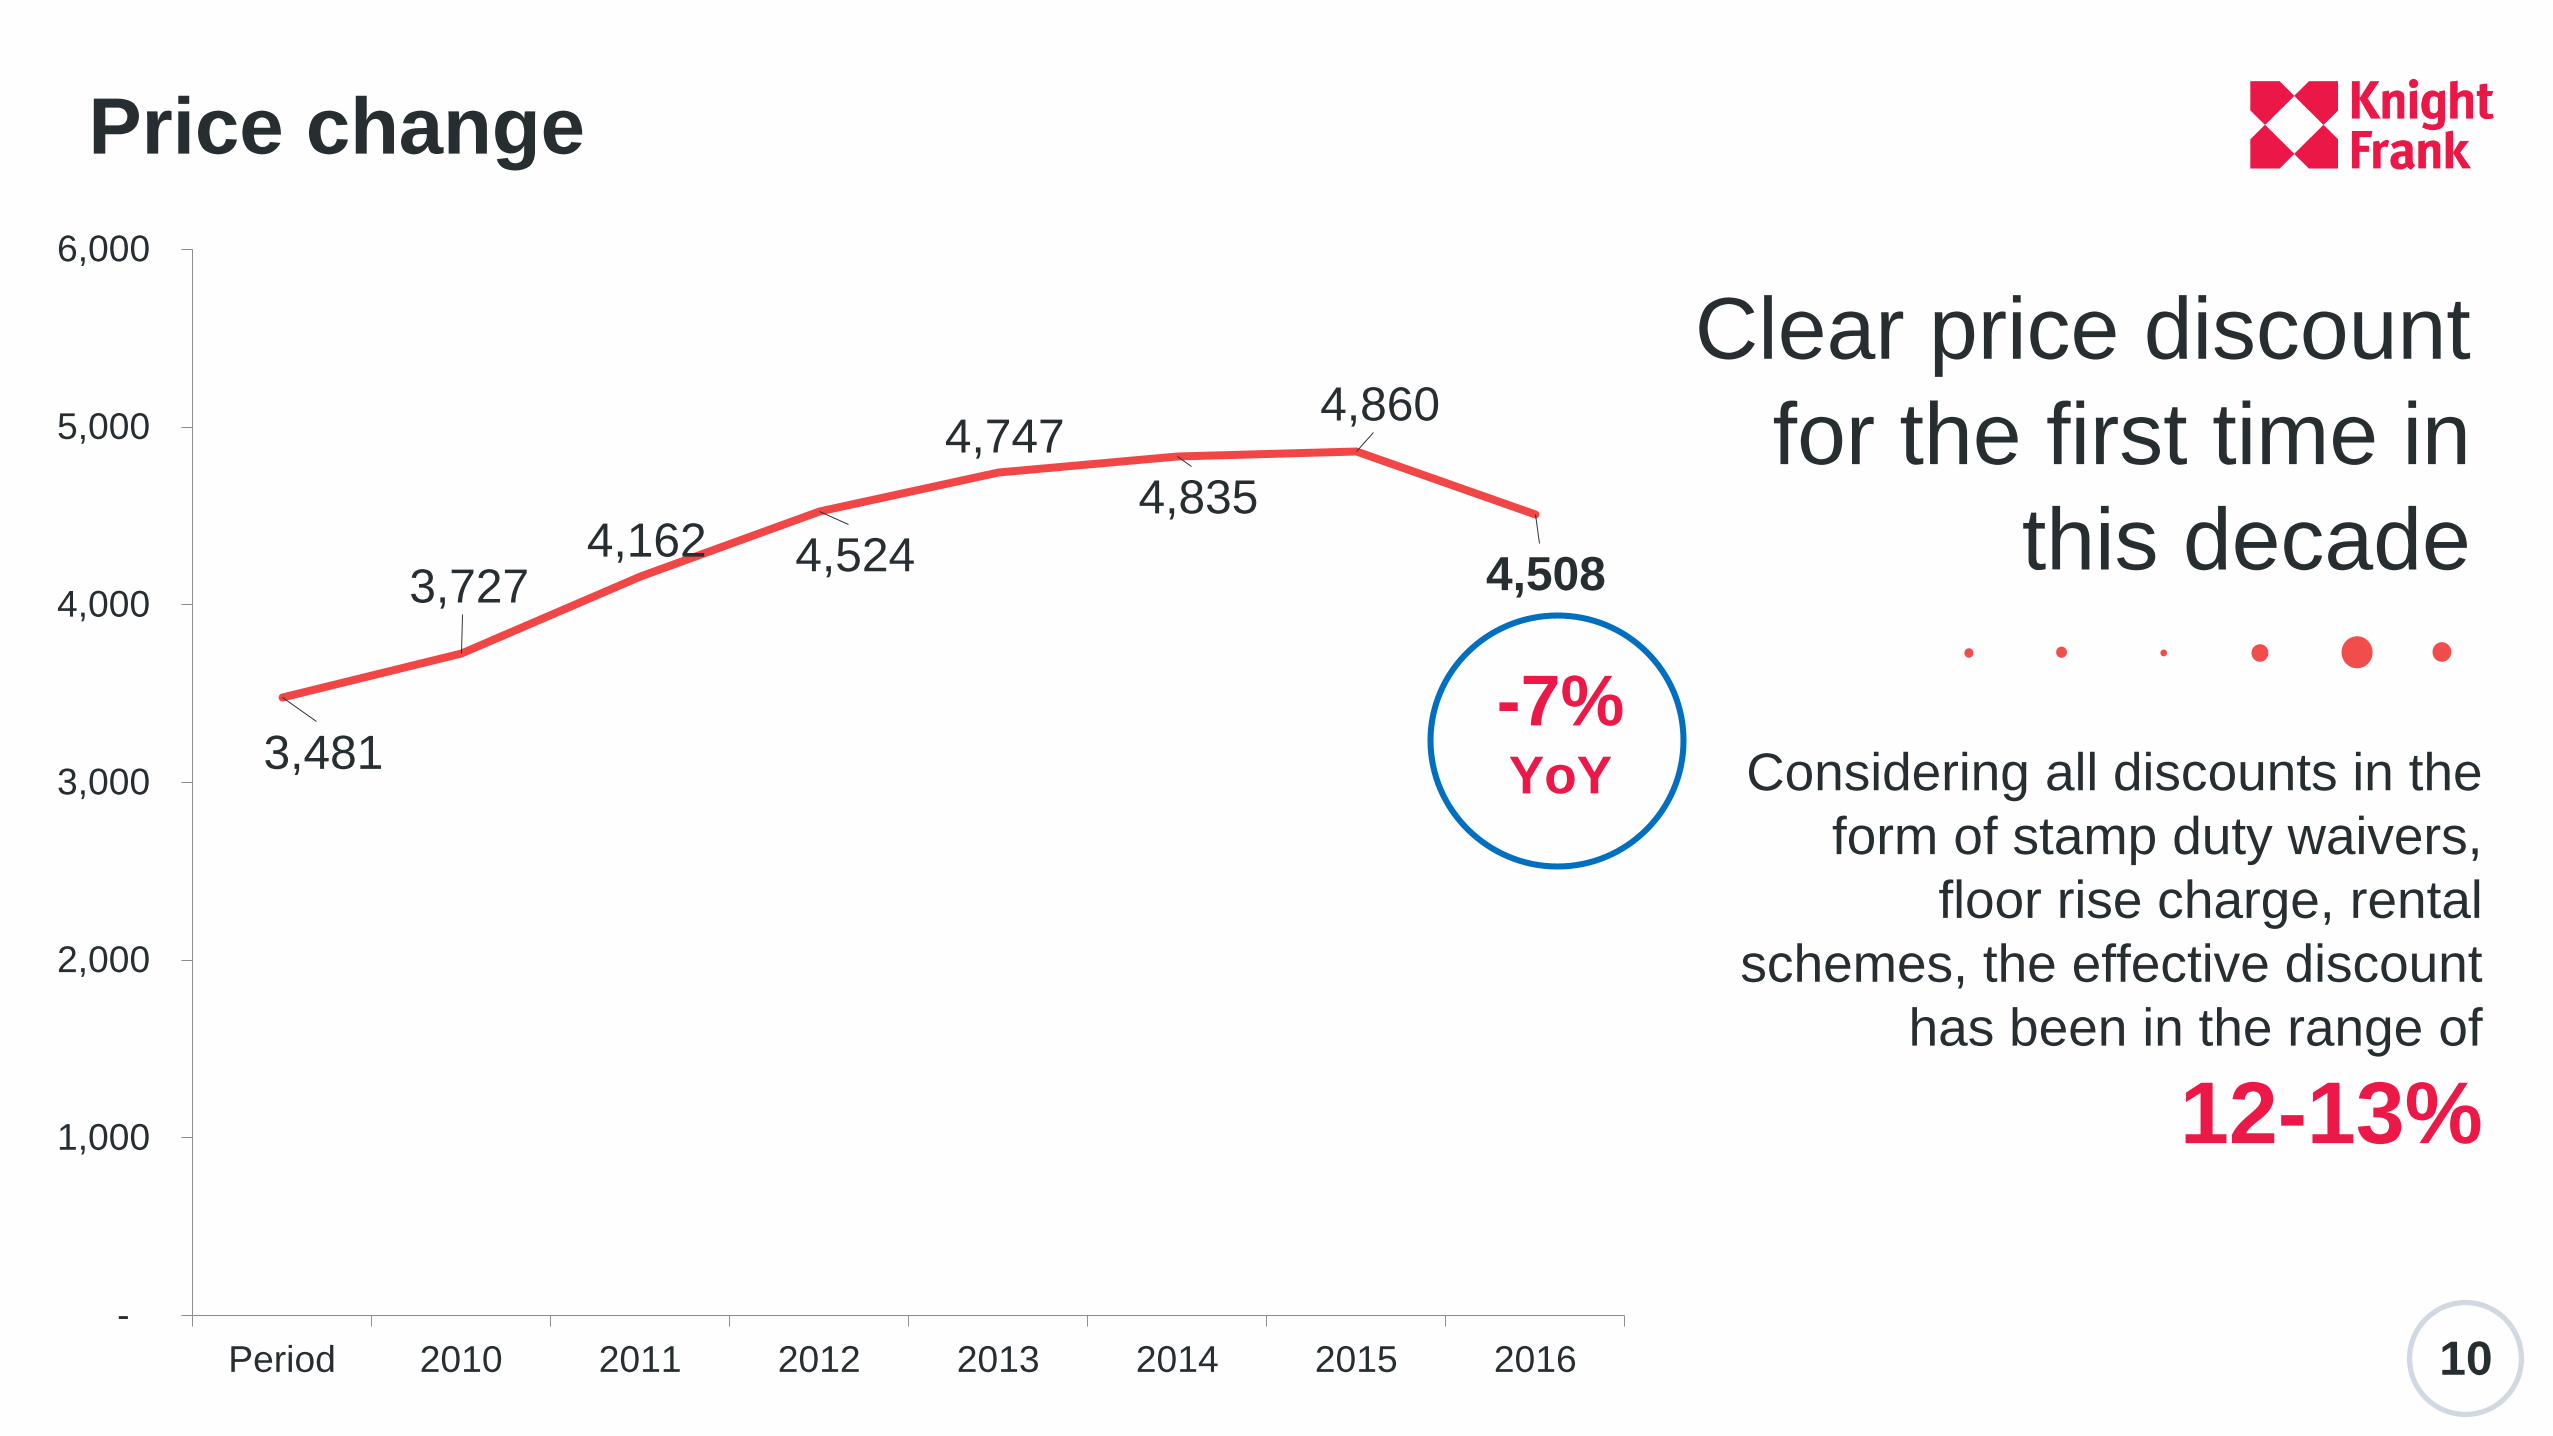
Considering all discounts in the
form of stamp duty waivers,
floor rise charge, rental
schemes, the effective discount
has been in the range of
12-13%
10
3,481
3,727 4,162 4,524
4,747
4,835
4,860
4,508
-
1,000
2,000
3,000
4,000
5,000
6,000
Period 2010 2011 2012 2013 2014 2015 2016
-7%YoY
Clear price discount
for the first time in
this decade
Price change
70
80
90
100
110
120
130
140
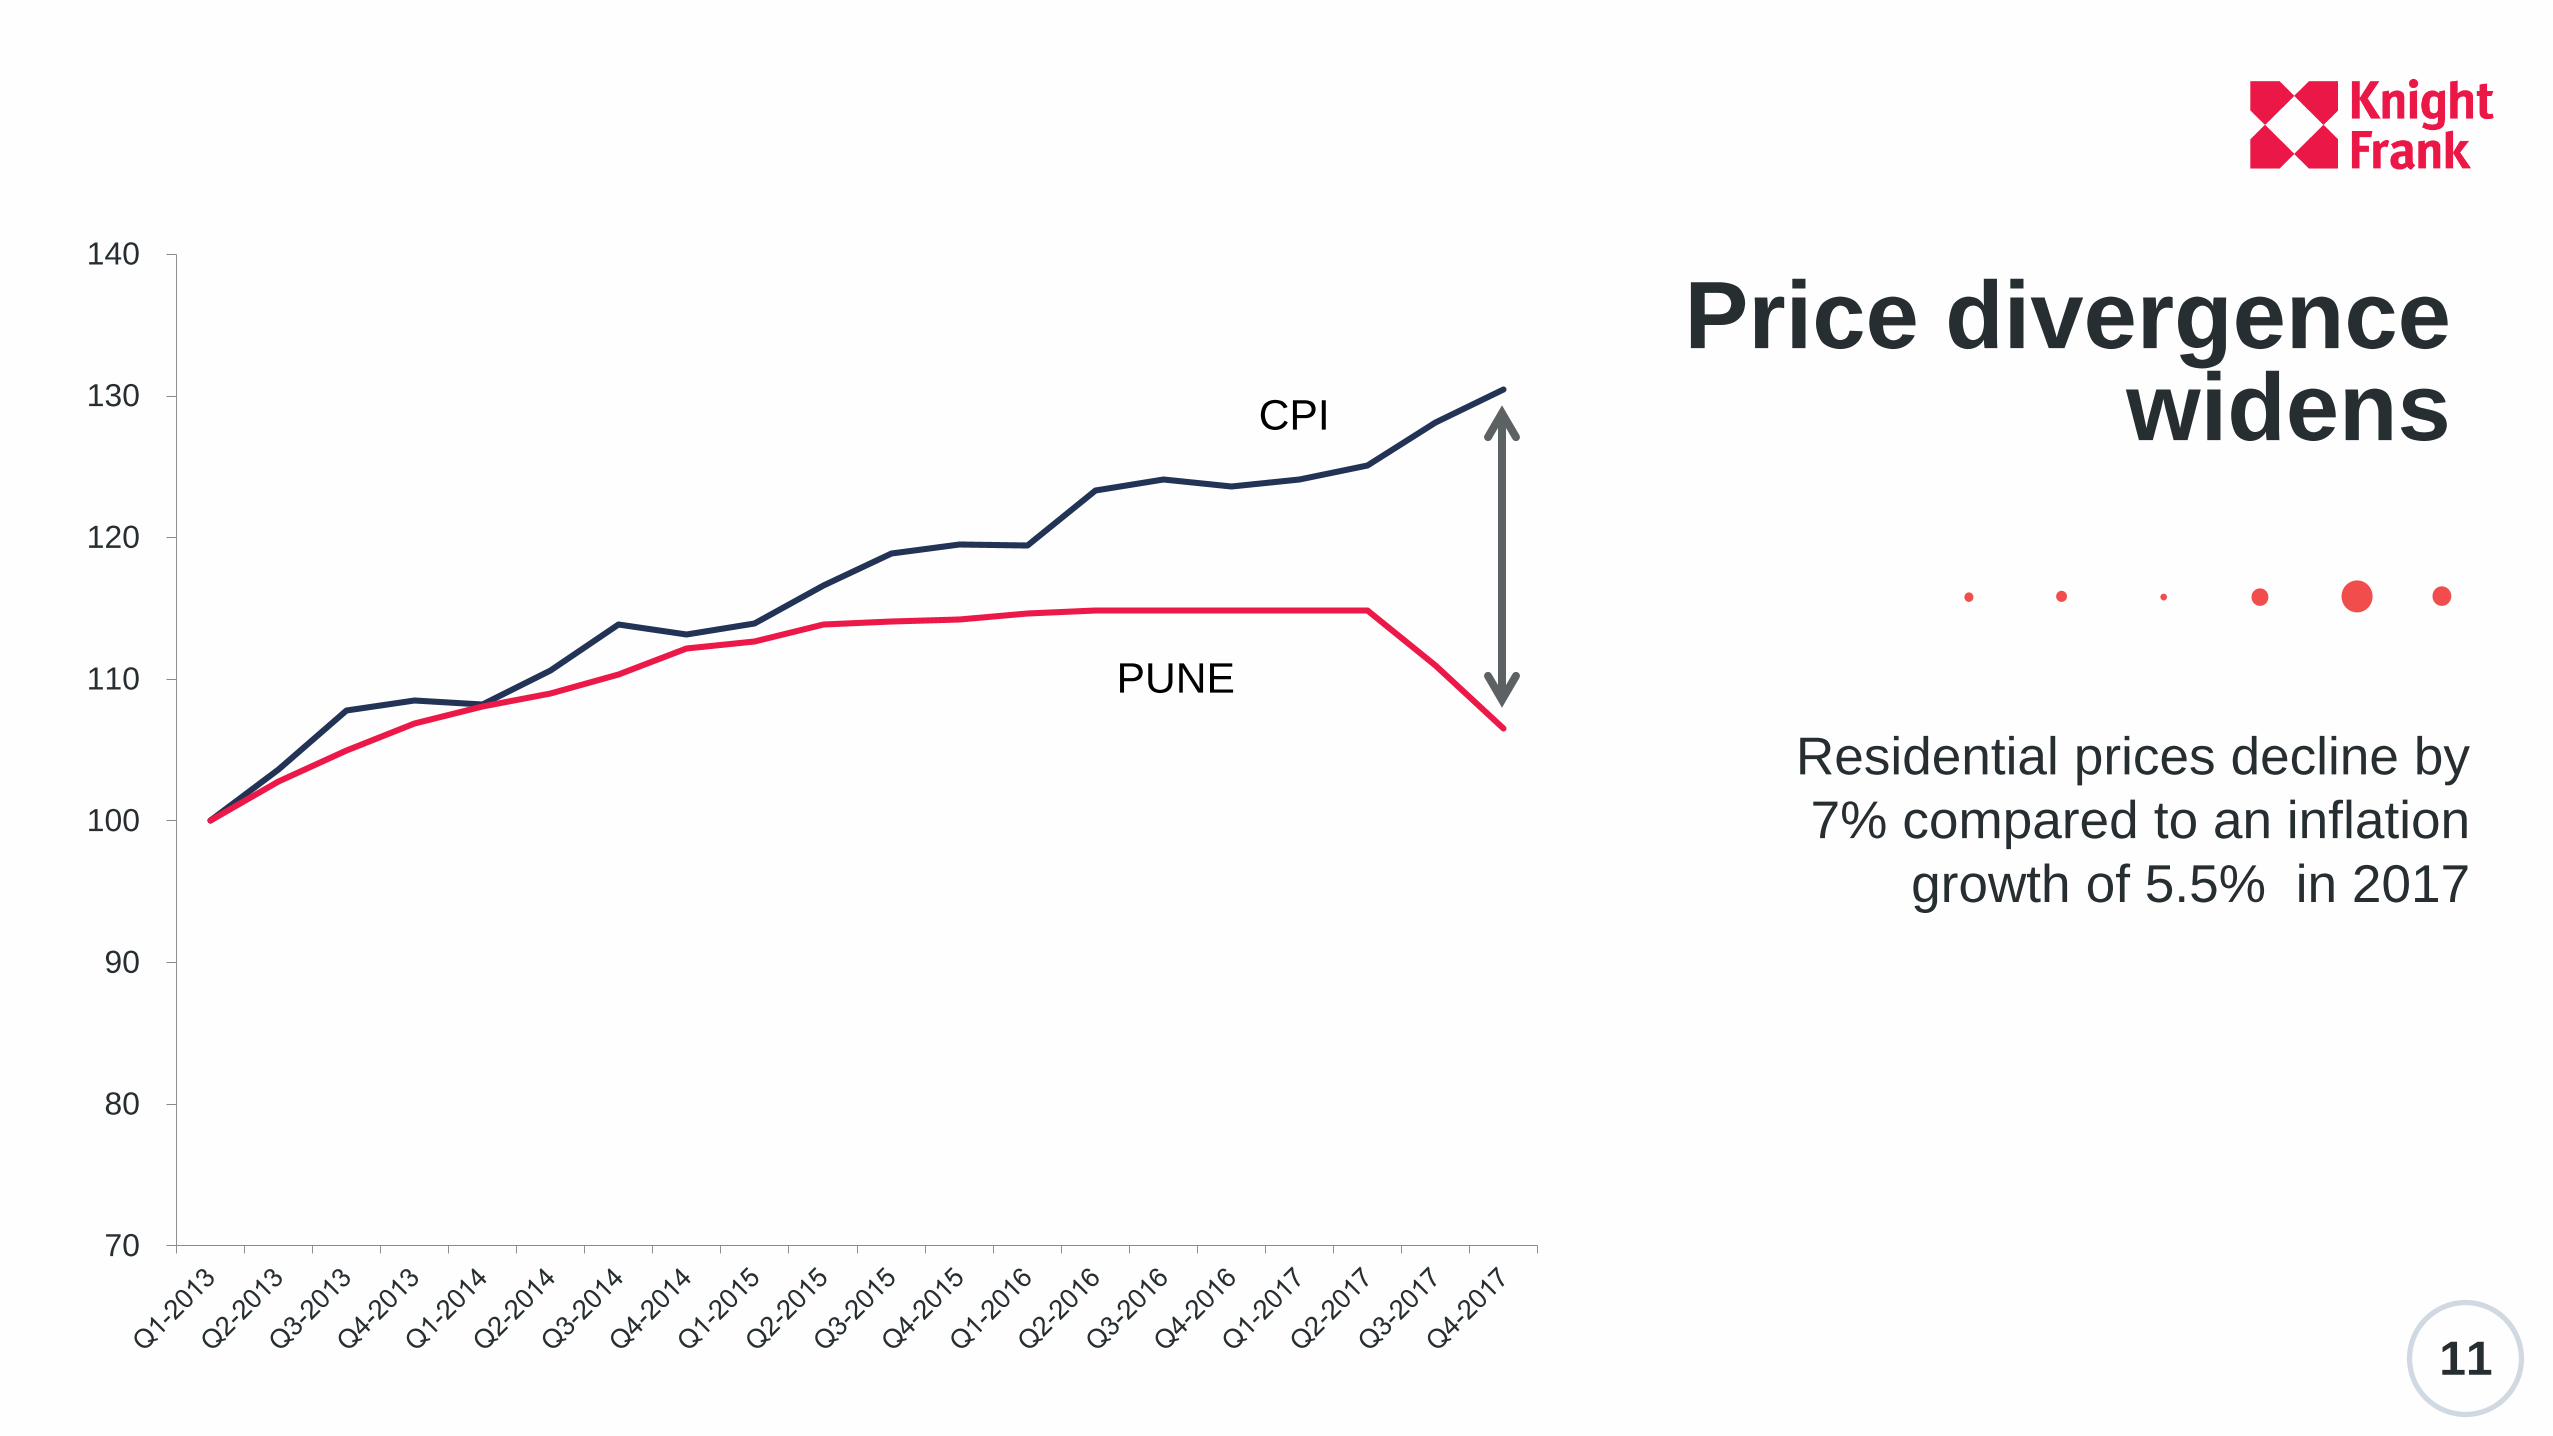
Residential prices decline by
7% compared to an inflation
growth of 5.5% in 2017
Price divergence widens
11
CPI
PUNE
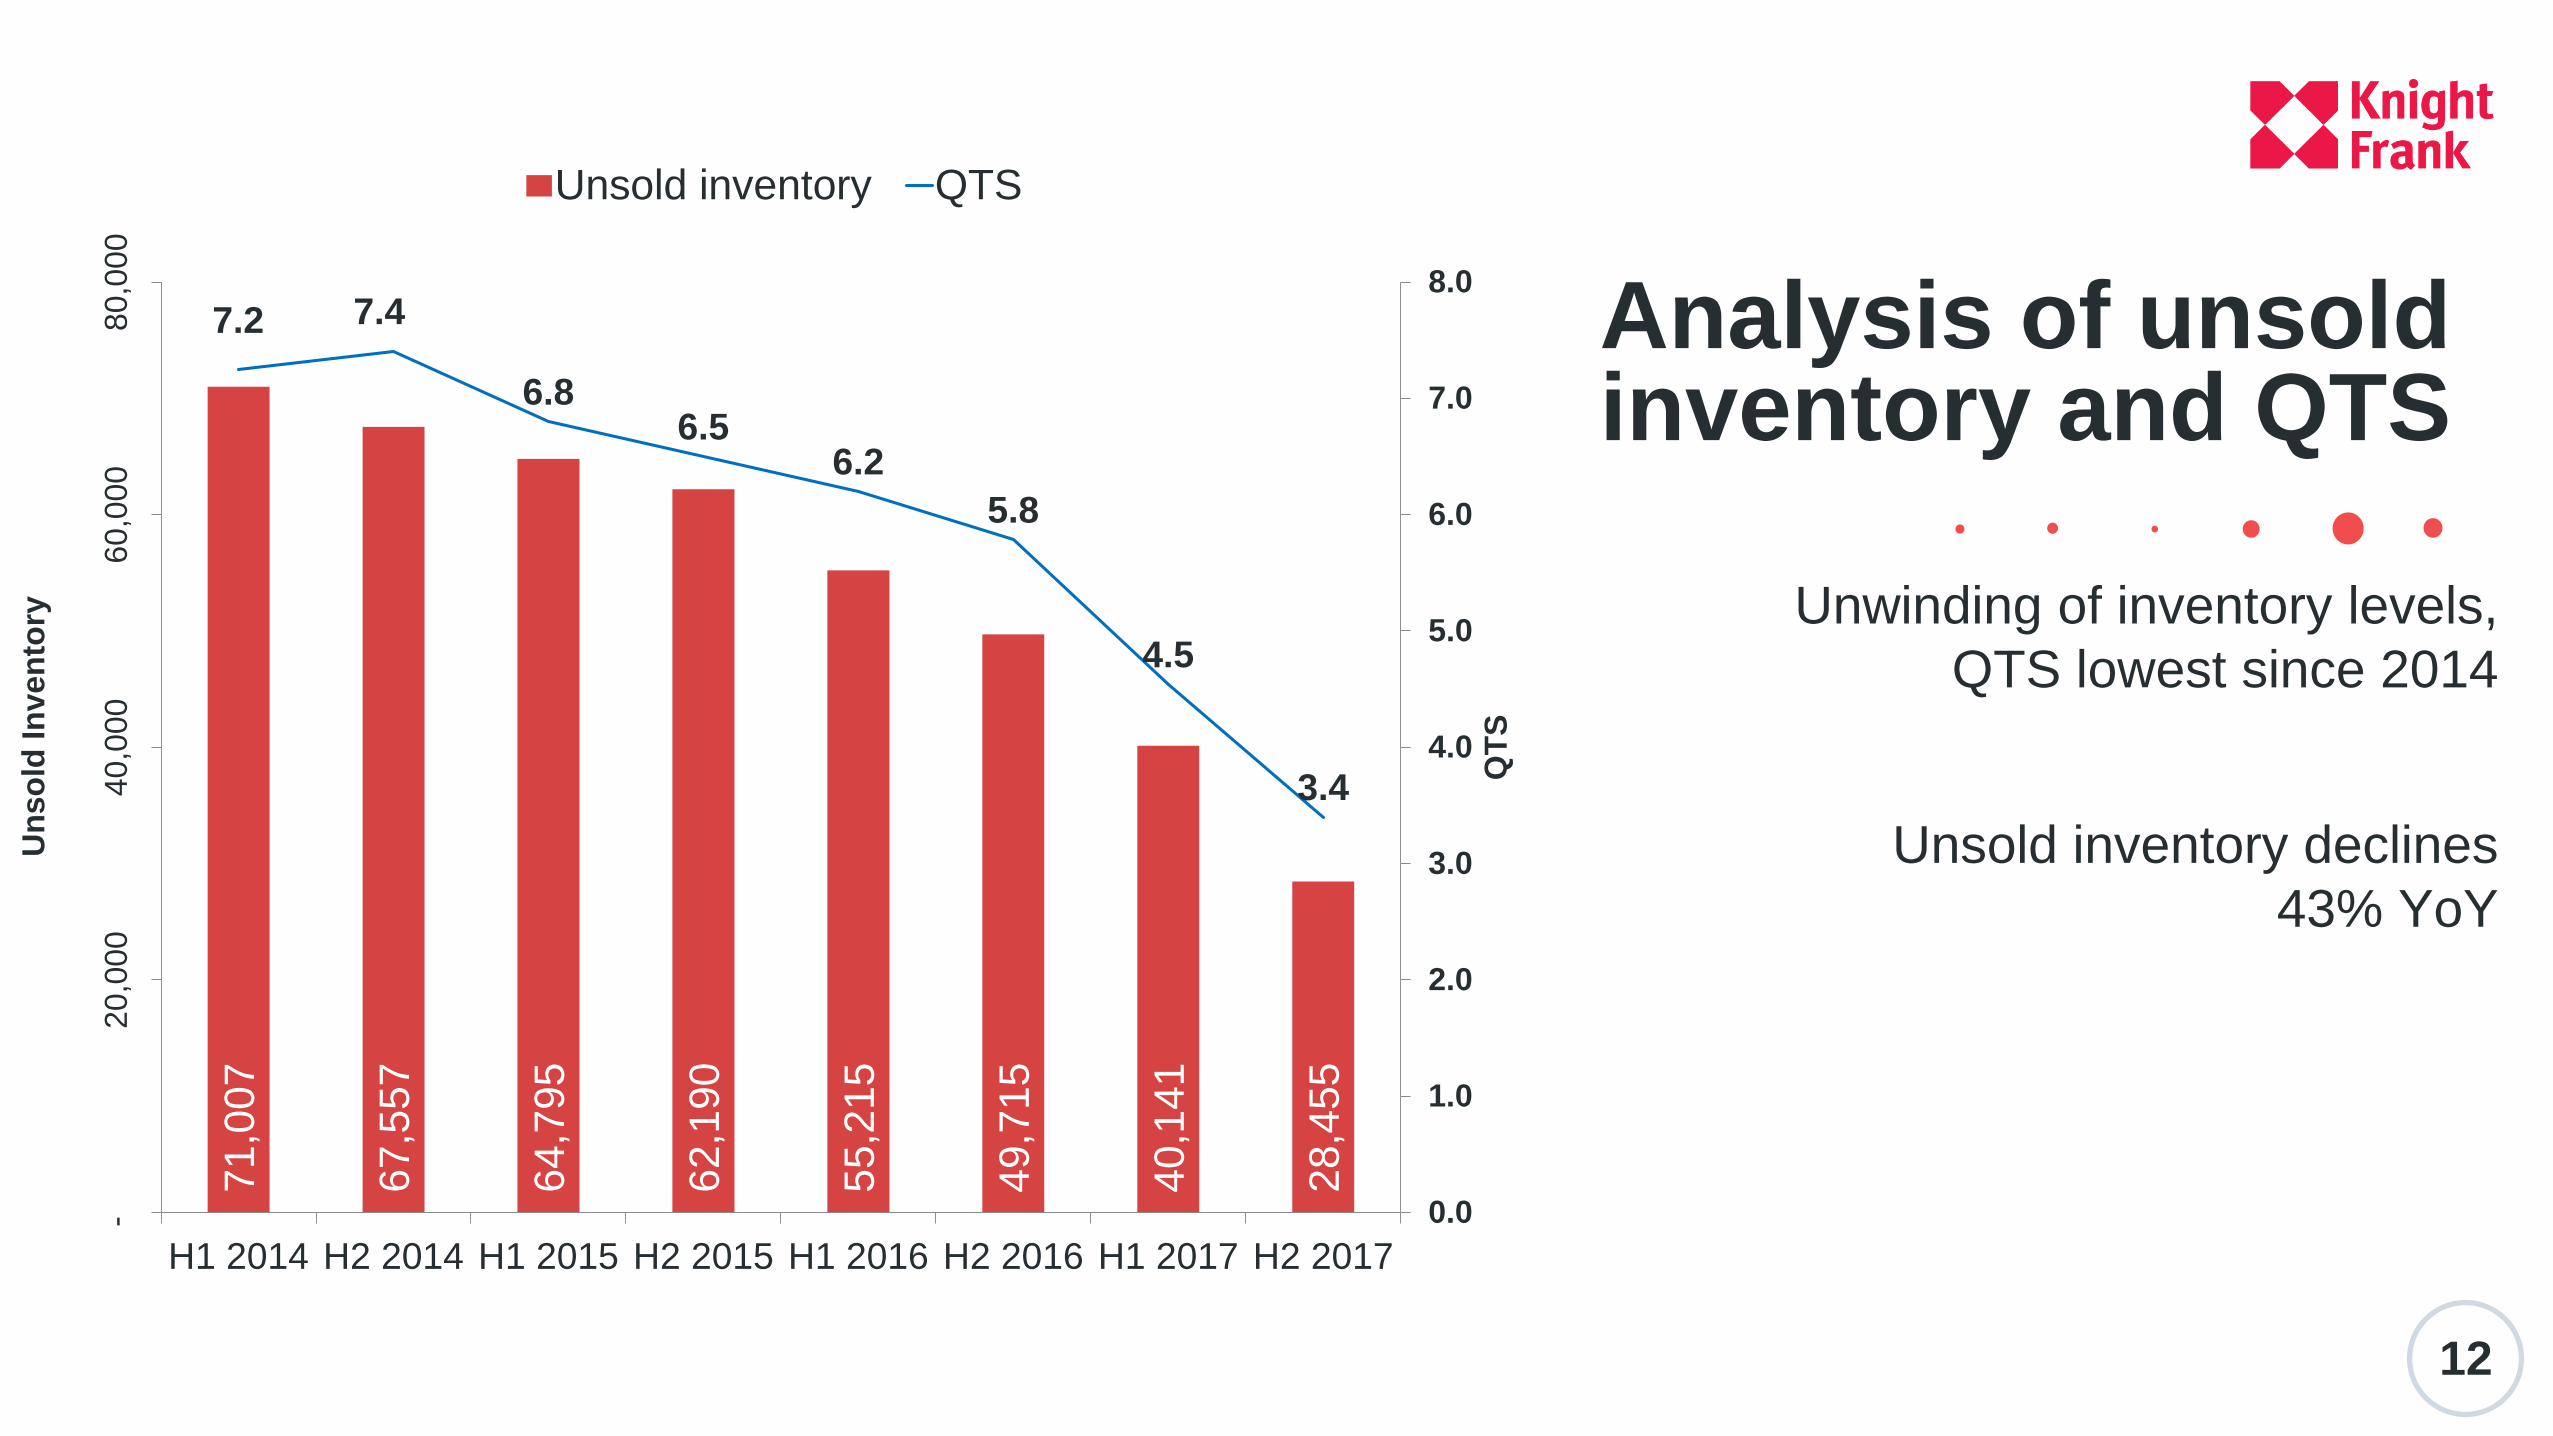
Unwinding of inventory levels,
QTS lowest since 2014
Unsold inventory declines
43% YoY
Analysis of unsold inventory and QTS
12
71,0
07
67,5
57
64,7
95
62,1
90
55,2
15
49,7
15
40,1
41
28,4
55
7.2 7.4
6.86.5
6.2
5.8
4.5
3.4
0.0
1.0
2.0
3.0
4.0
5.0
6.0
7.0
8.0
- 2
0,0
00
40,0
00
60,0
00
80,0
00
H1 2014 H2 2014 H1 2015 H2 2015 H1 2016 H2 2016 H1 2017 H2 2017
QT
S
Un
so
ld In
ven
tory
Unsold inventory QTS
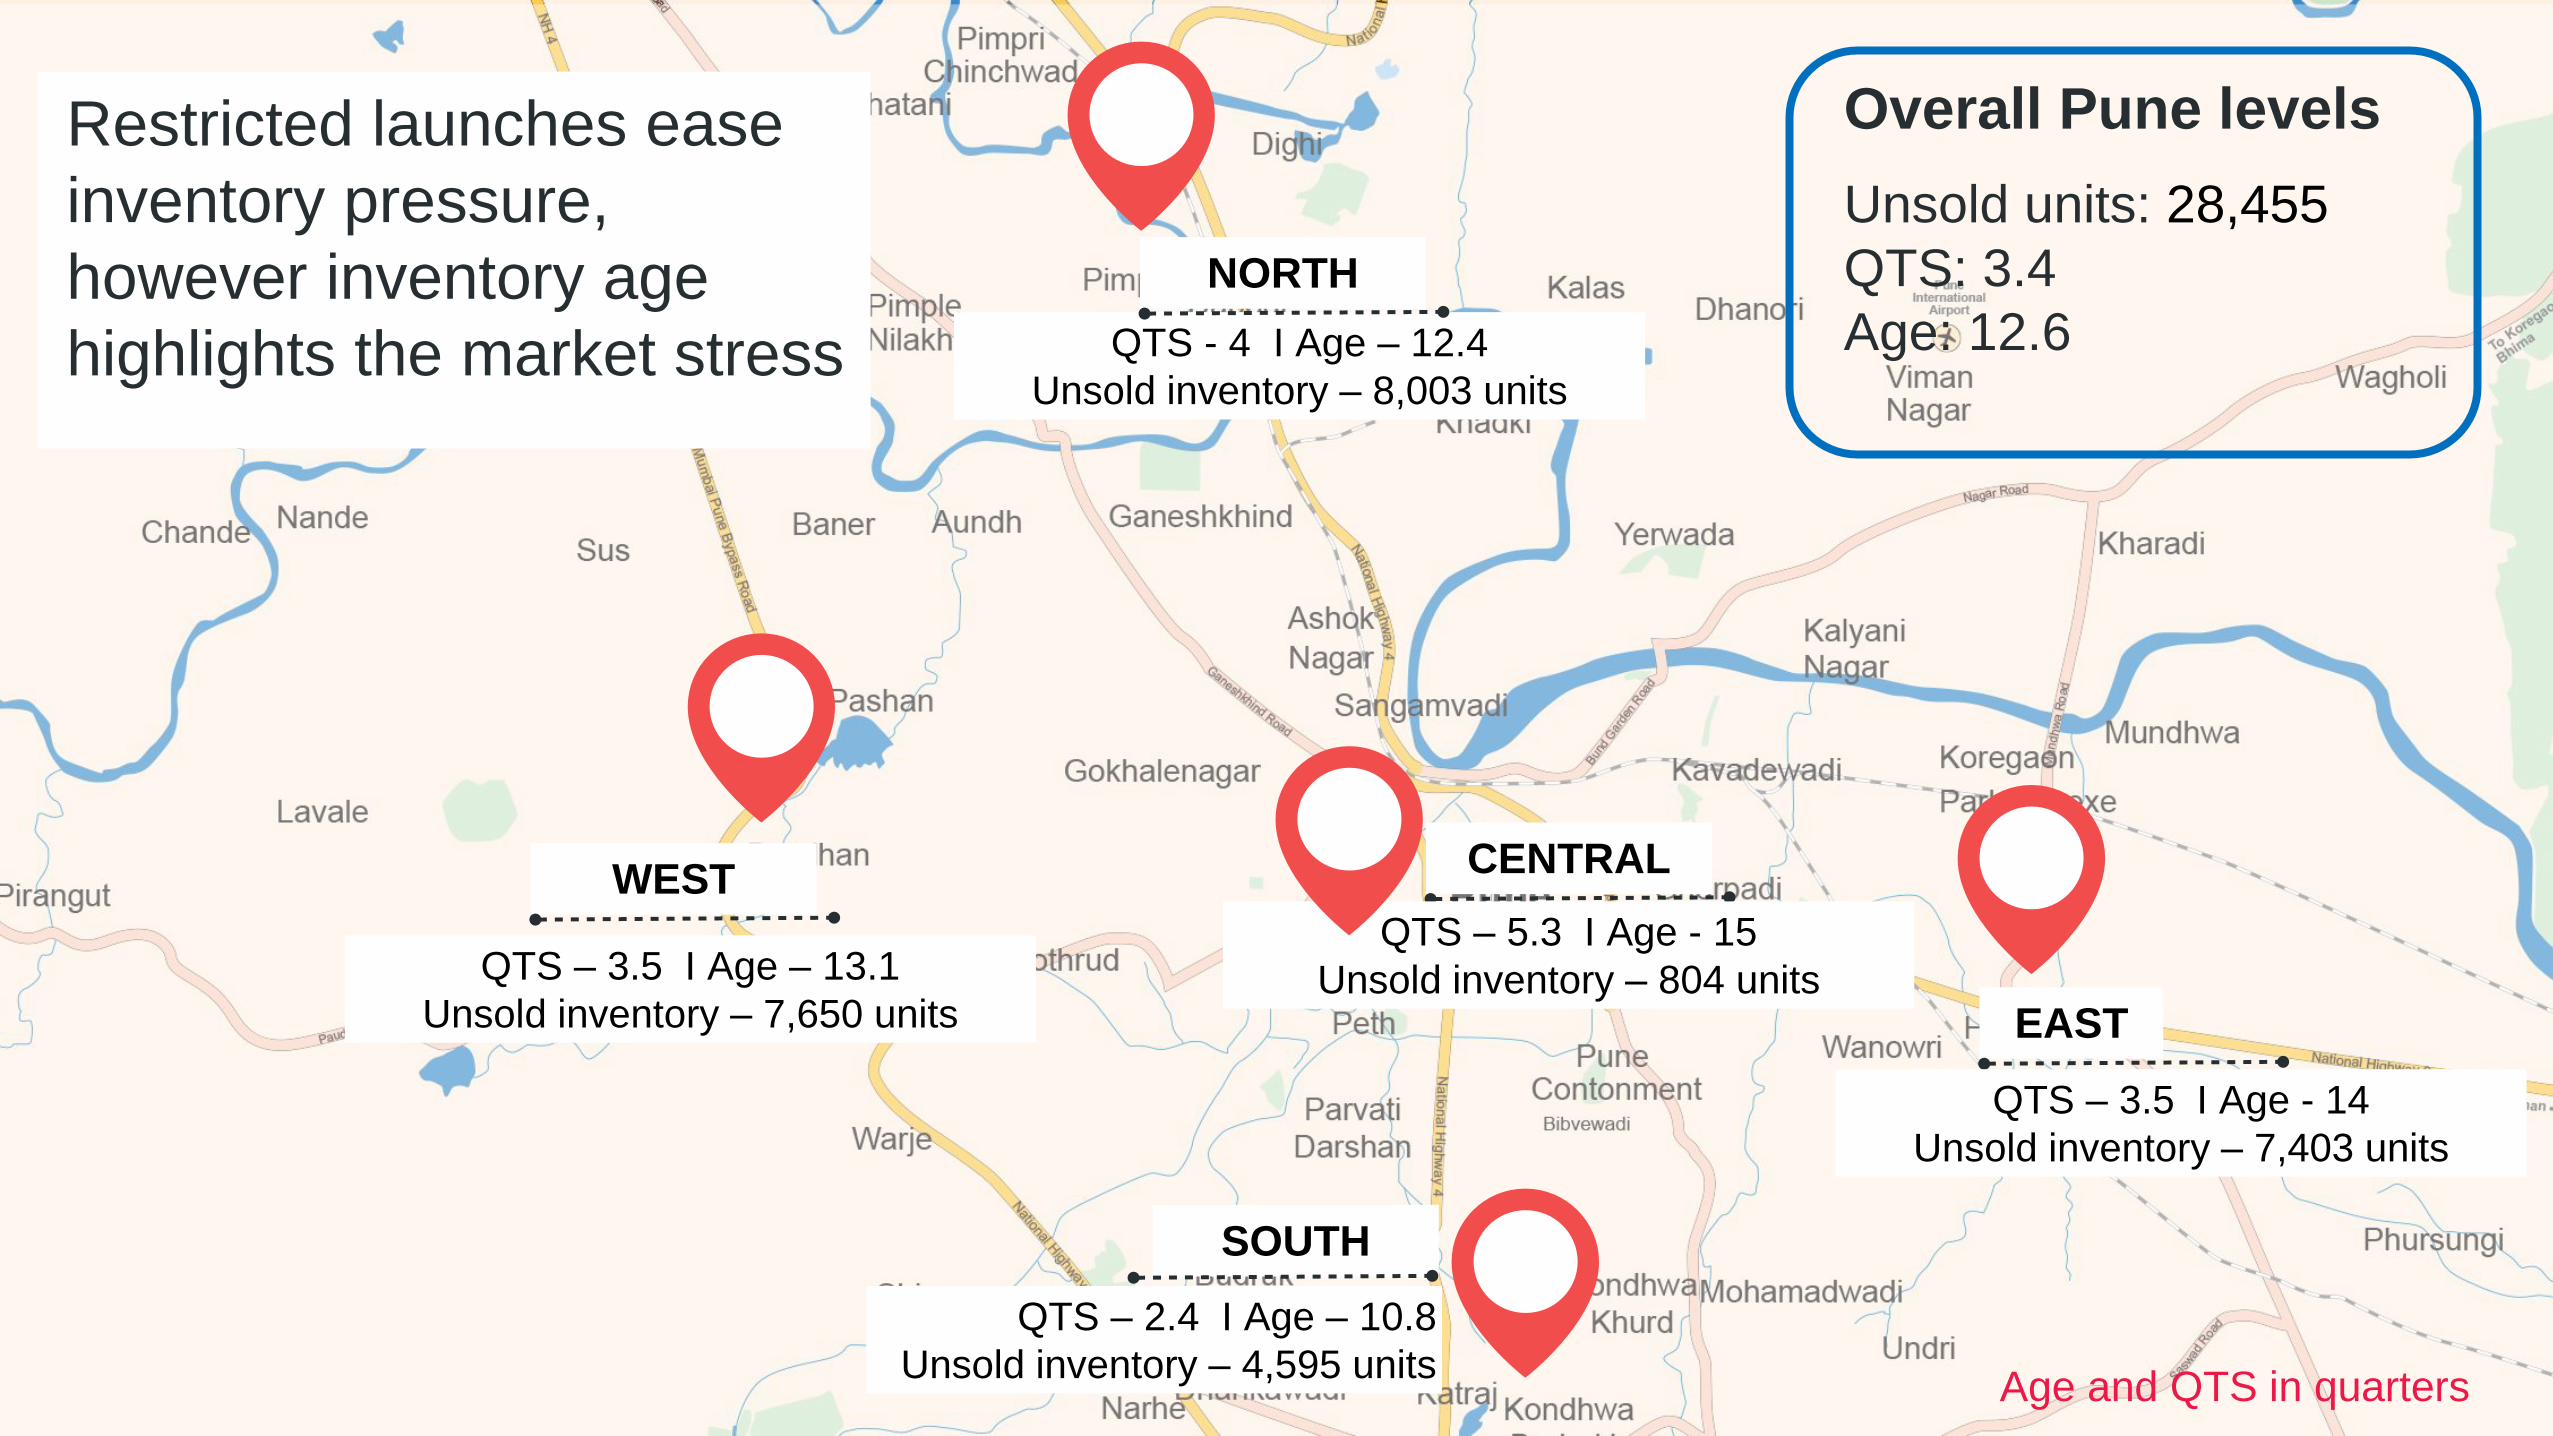
Restricted launches ease
inventory pressure,
however inventory age
highlights the market stress
NORTH
QTS - 4 I Age – 12.4
Unsold inventory – 8,003 units
WEST
QTS – 3.5 I Age – 13.1
Unsold inventory – 7,650 units EAST
QTS – 3.5 I Age - 14
Unsold inventory – 7,403 units
CENTRAL
QTS – 5.3 I Age - 15
Unsold inventory – 804 units
SOUTH
QTS – 2.4 I Age – 10.8
Unsold inventory – 4,595 units
Overall Pune levels
Unsold units: 28,455
QTS: 3.4
Age: 12.6
Age and QTS in quarters
KEY FINDINGS
14
01 03
02 04
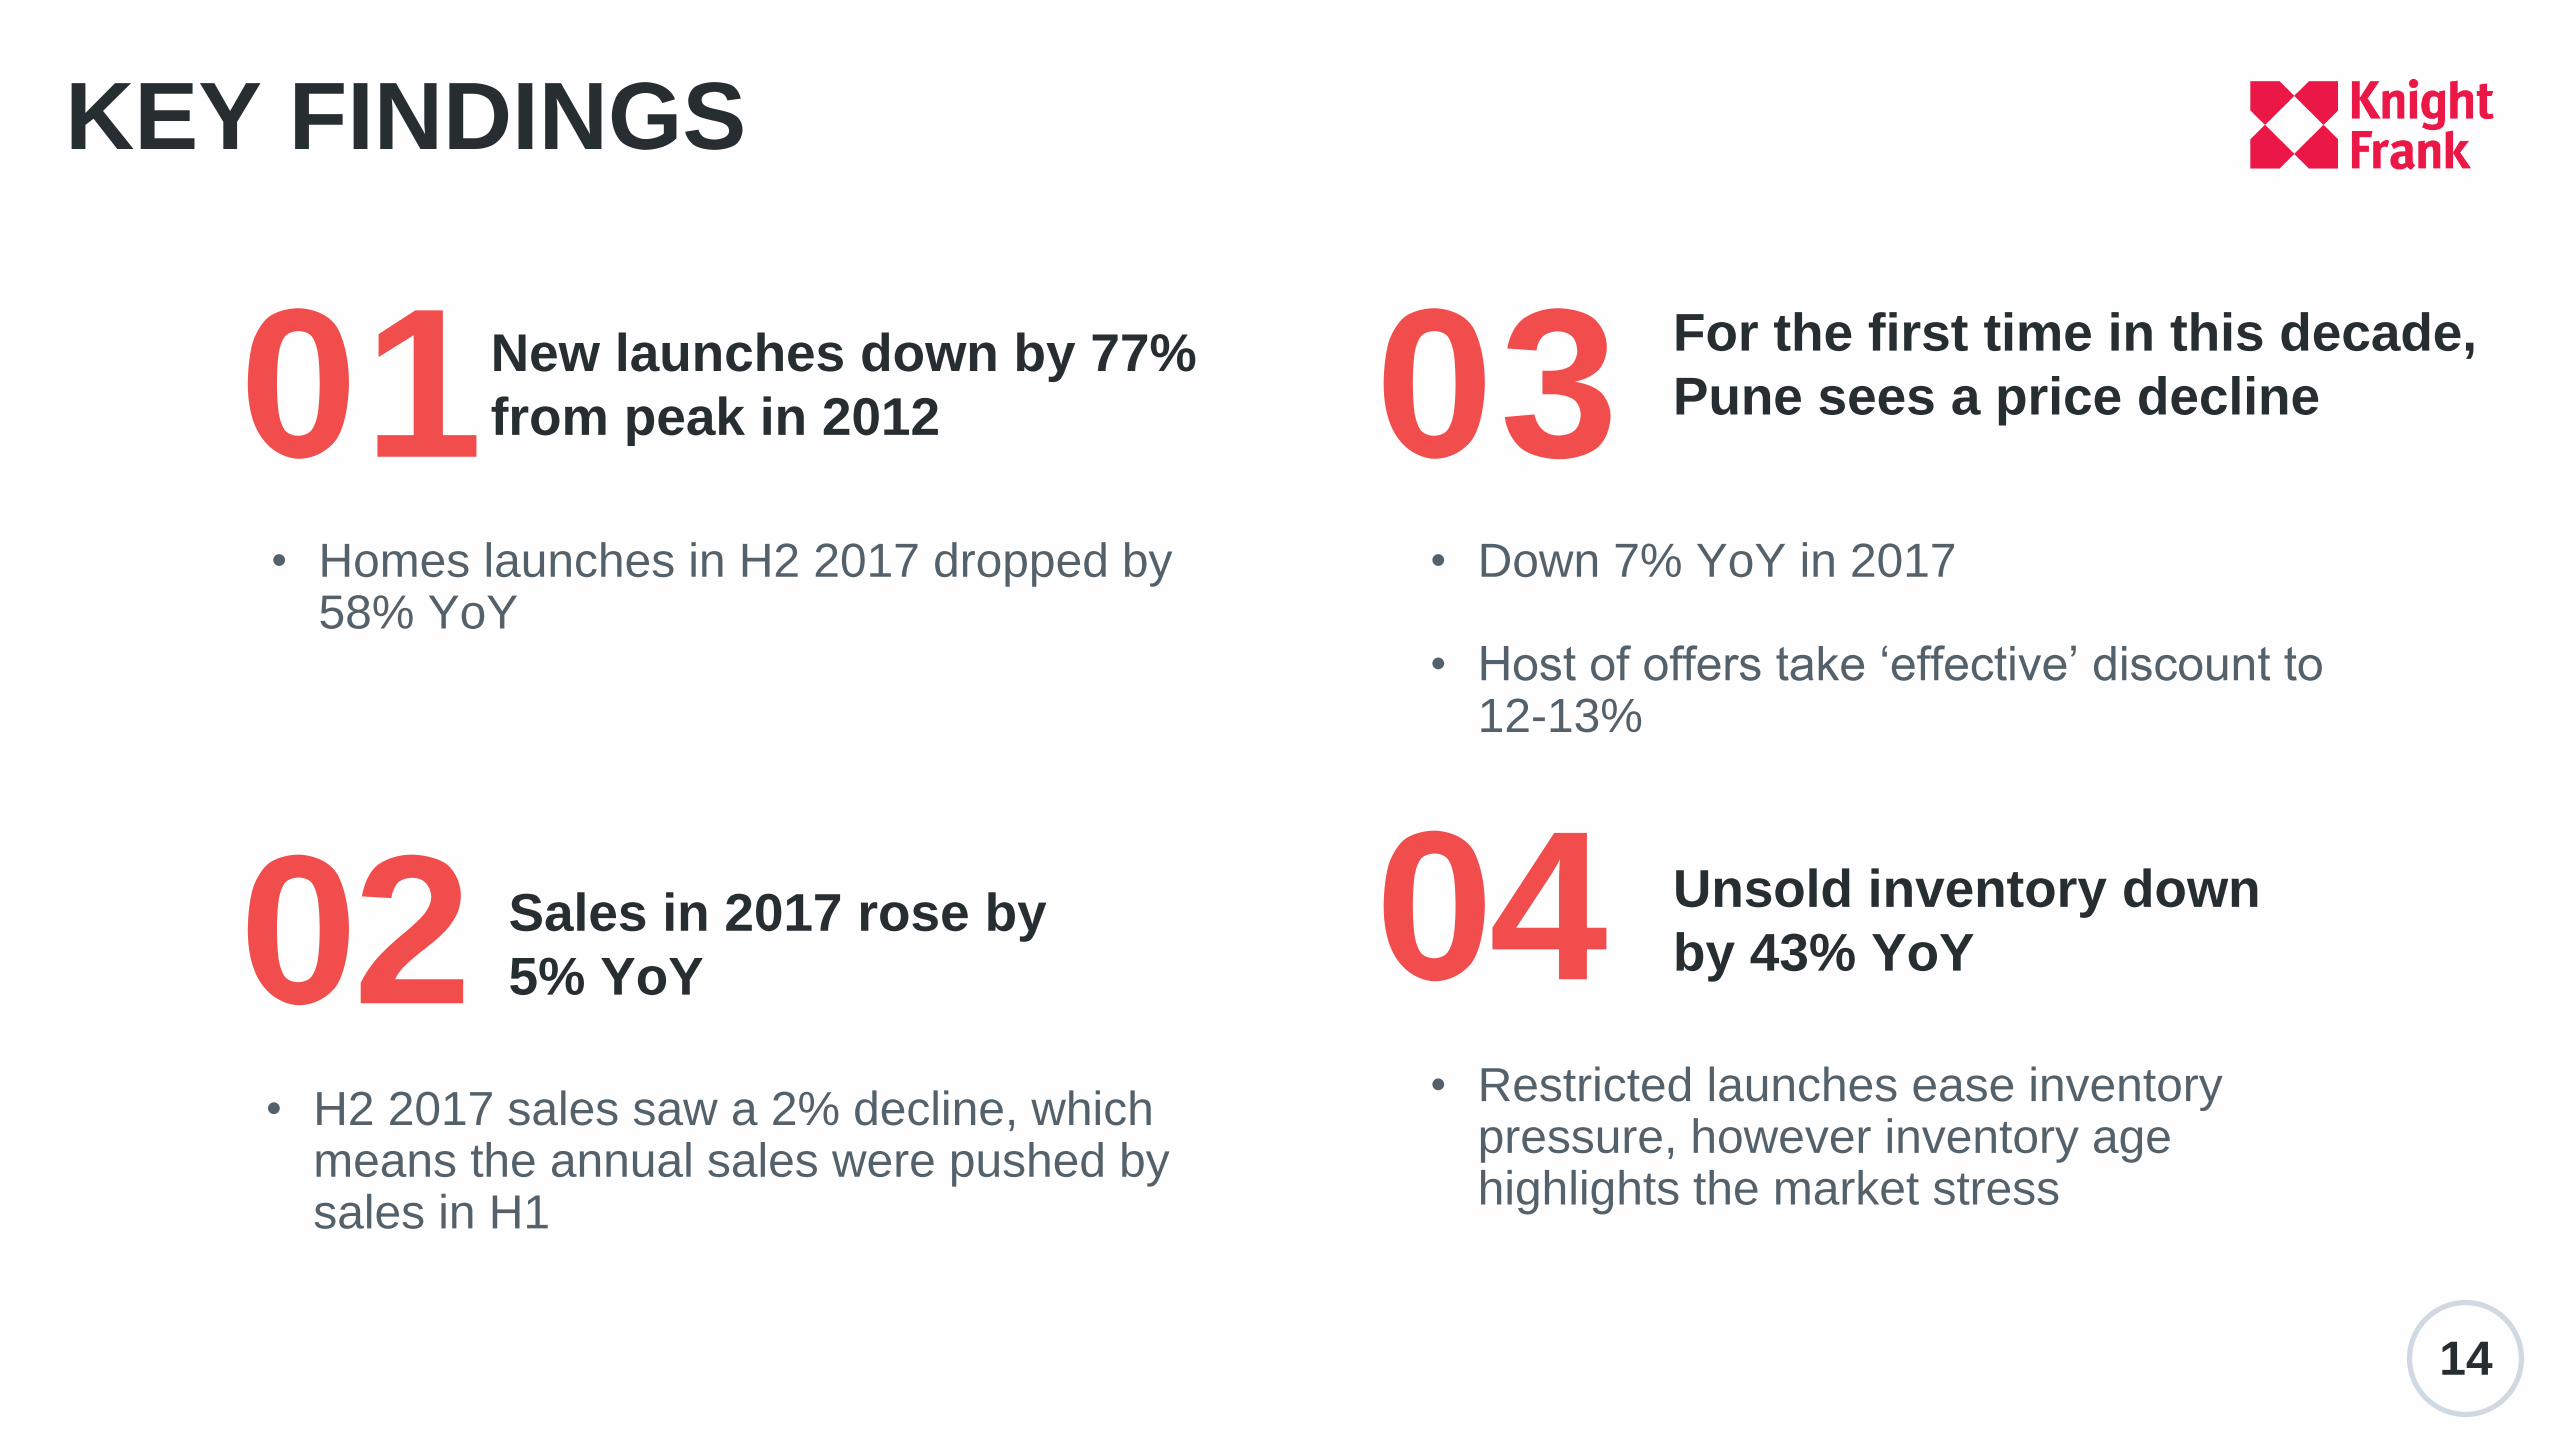
New launches down by 77%
from peak in 2012
For the first time in this decade,
Pune sees a price decline
• Down 7% YoY in 2017
• Host of offers take ‘effective’ discount to 12-13%
Unsold inventory down
by 43% YoY
• Restricted launches ease inventory pressure, however inventory age highlights the market stress
Sales in 2017 rose by
5% YoY
• H2 2017 sales saw a 2% decline, which means the annual sales were pushed by sales in H1
• Homes launches in H2 2017 dropped by 58% YoY
15
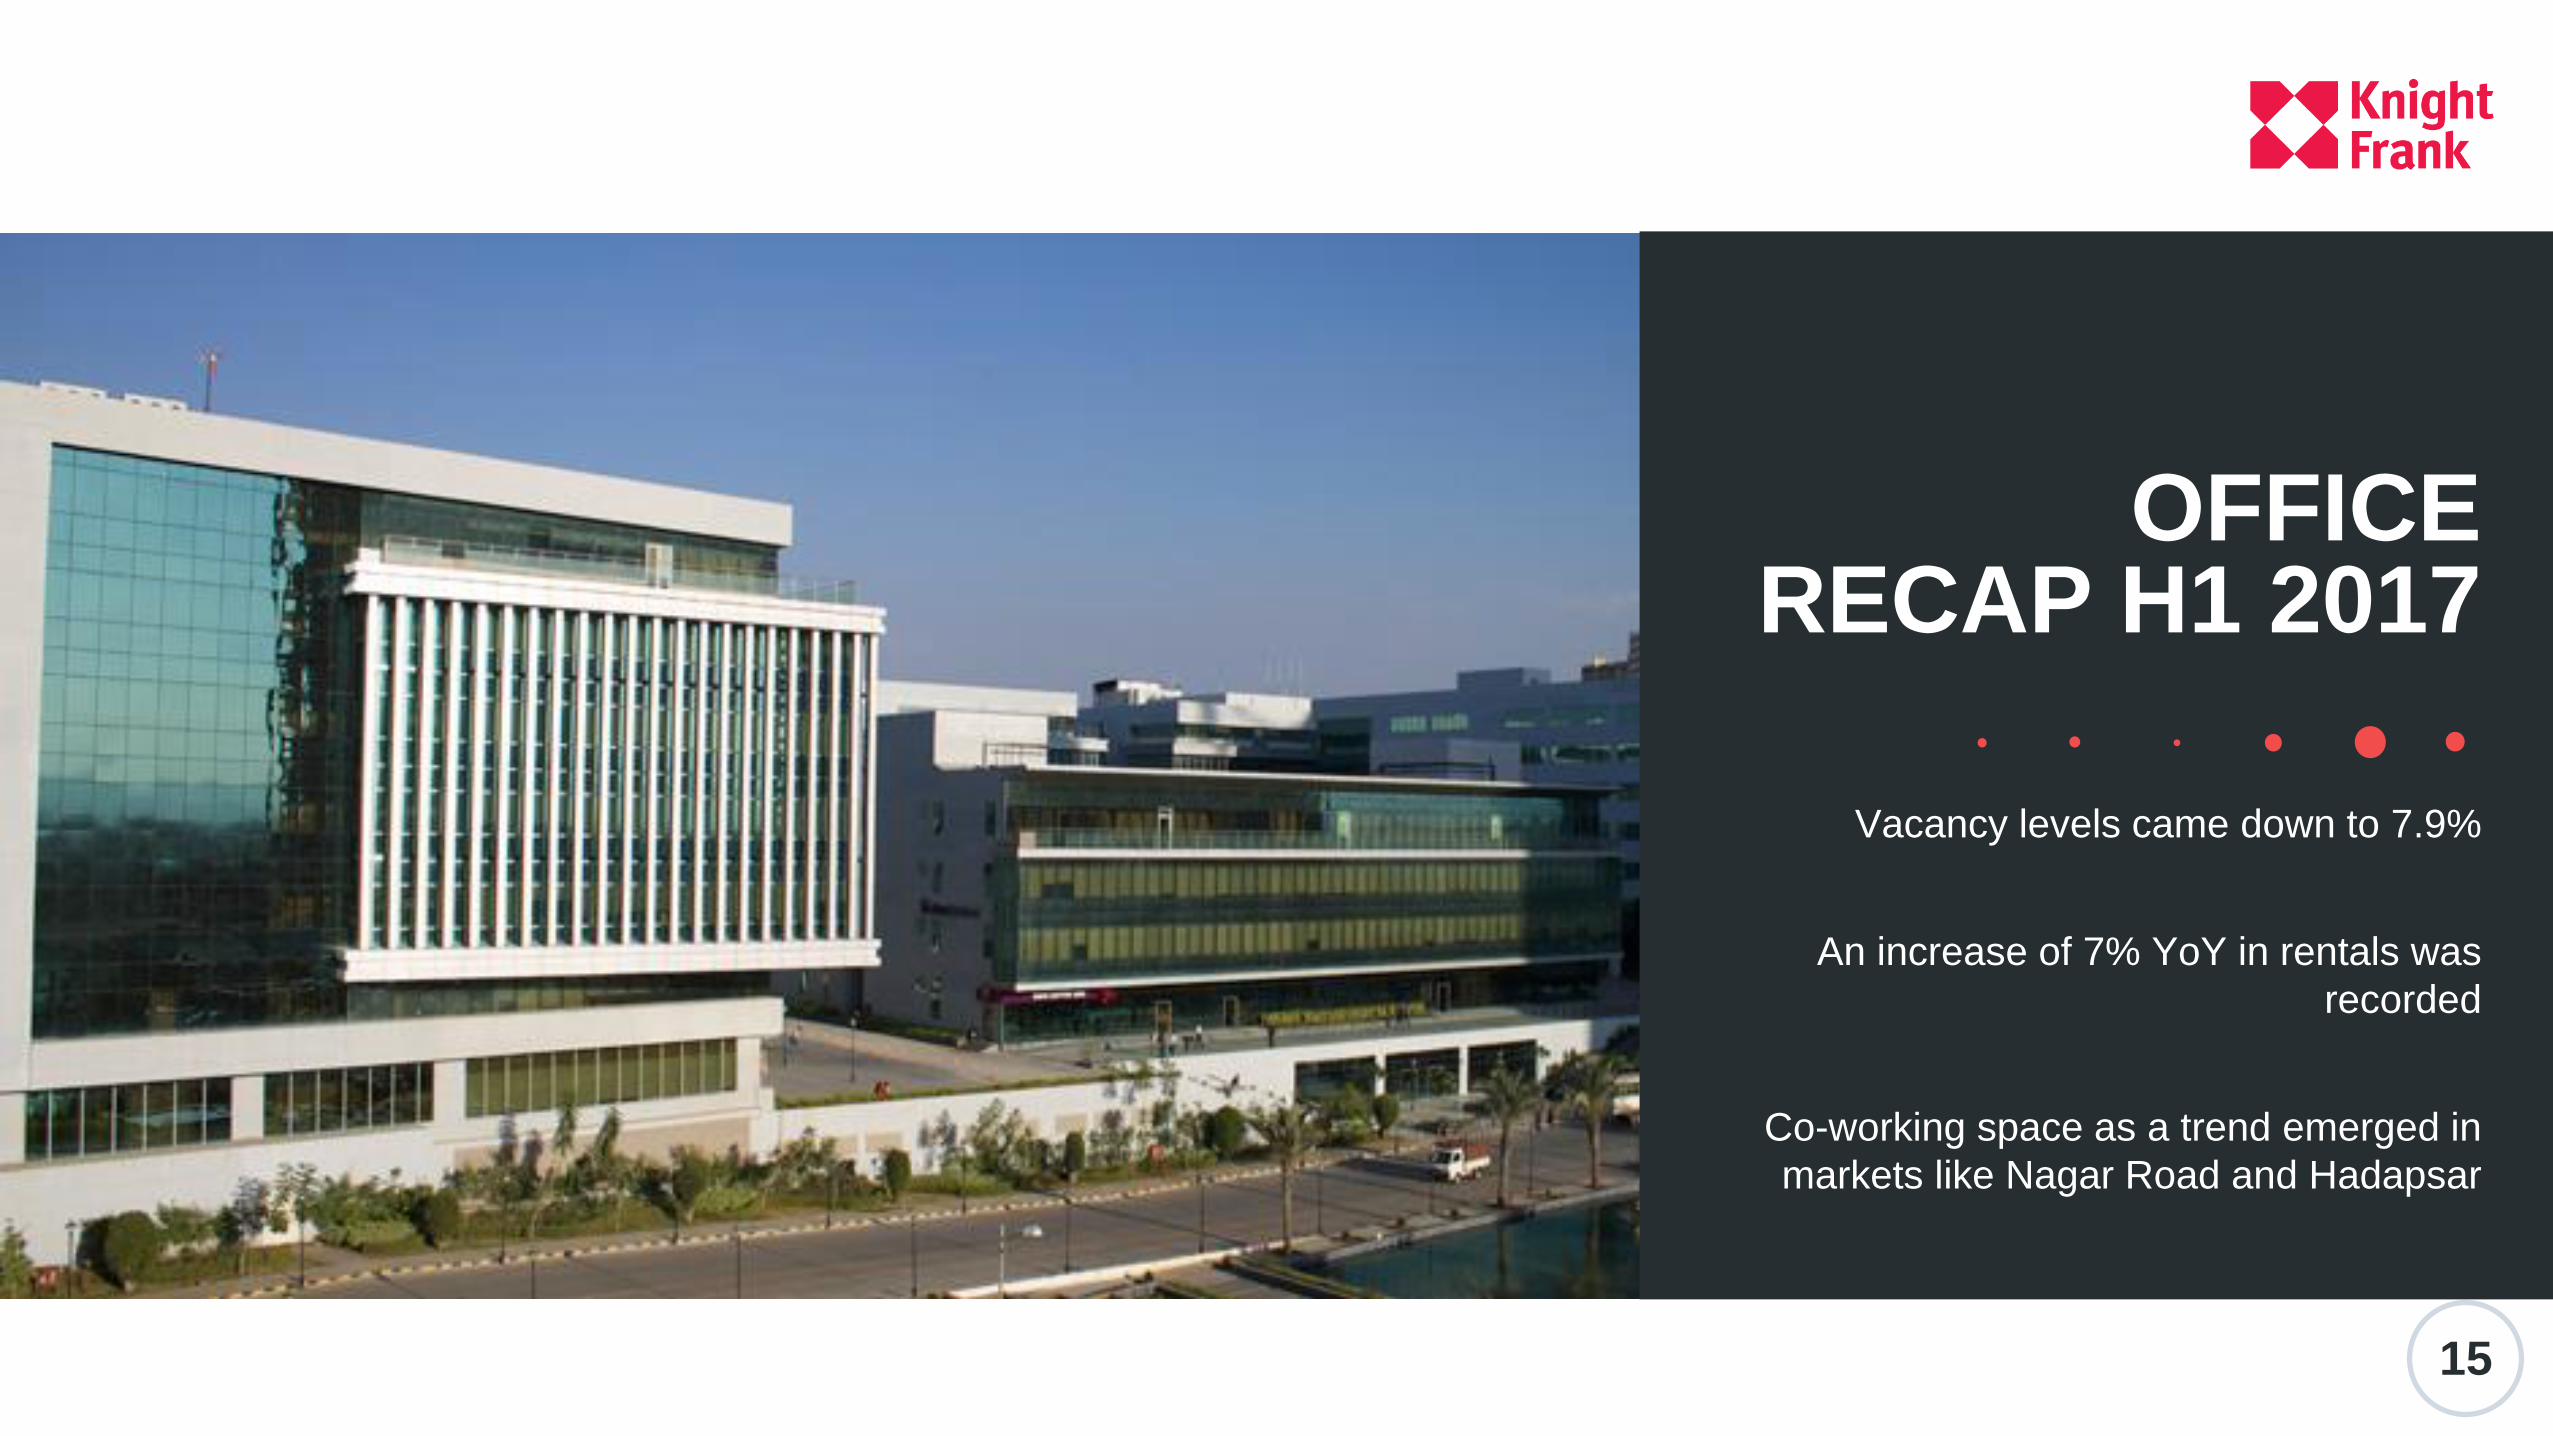
Vacancy levels came down to 7.9%
An increase of 7% YoY in rentals was
recorded
Co-working space as a trend emerged in
markets like Nagar Road and Hadapsar
OFFICERECAP H1 2017
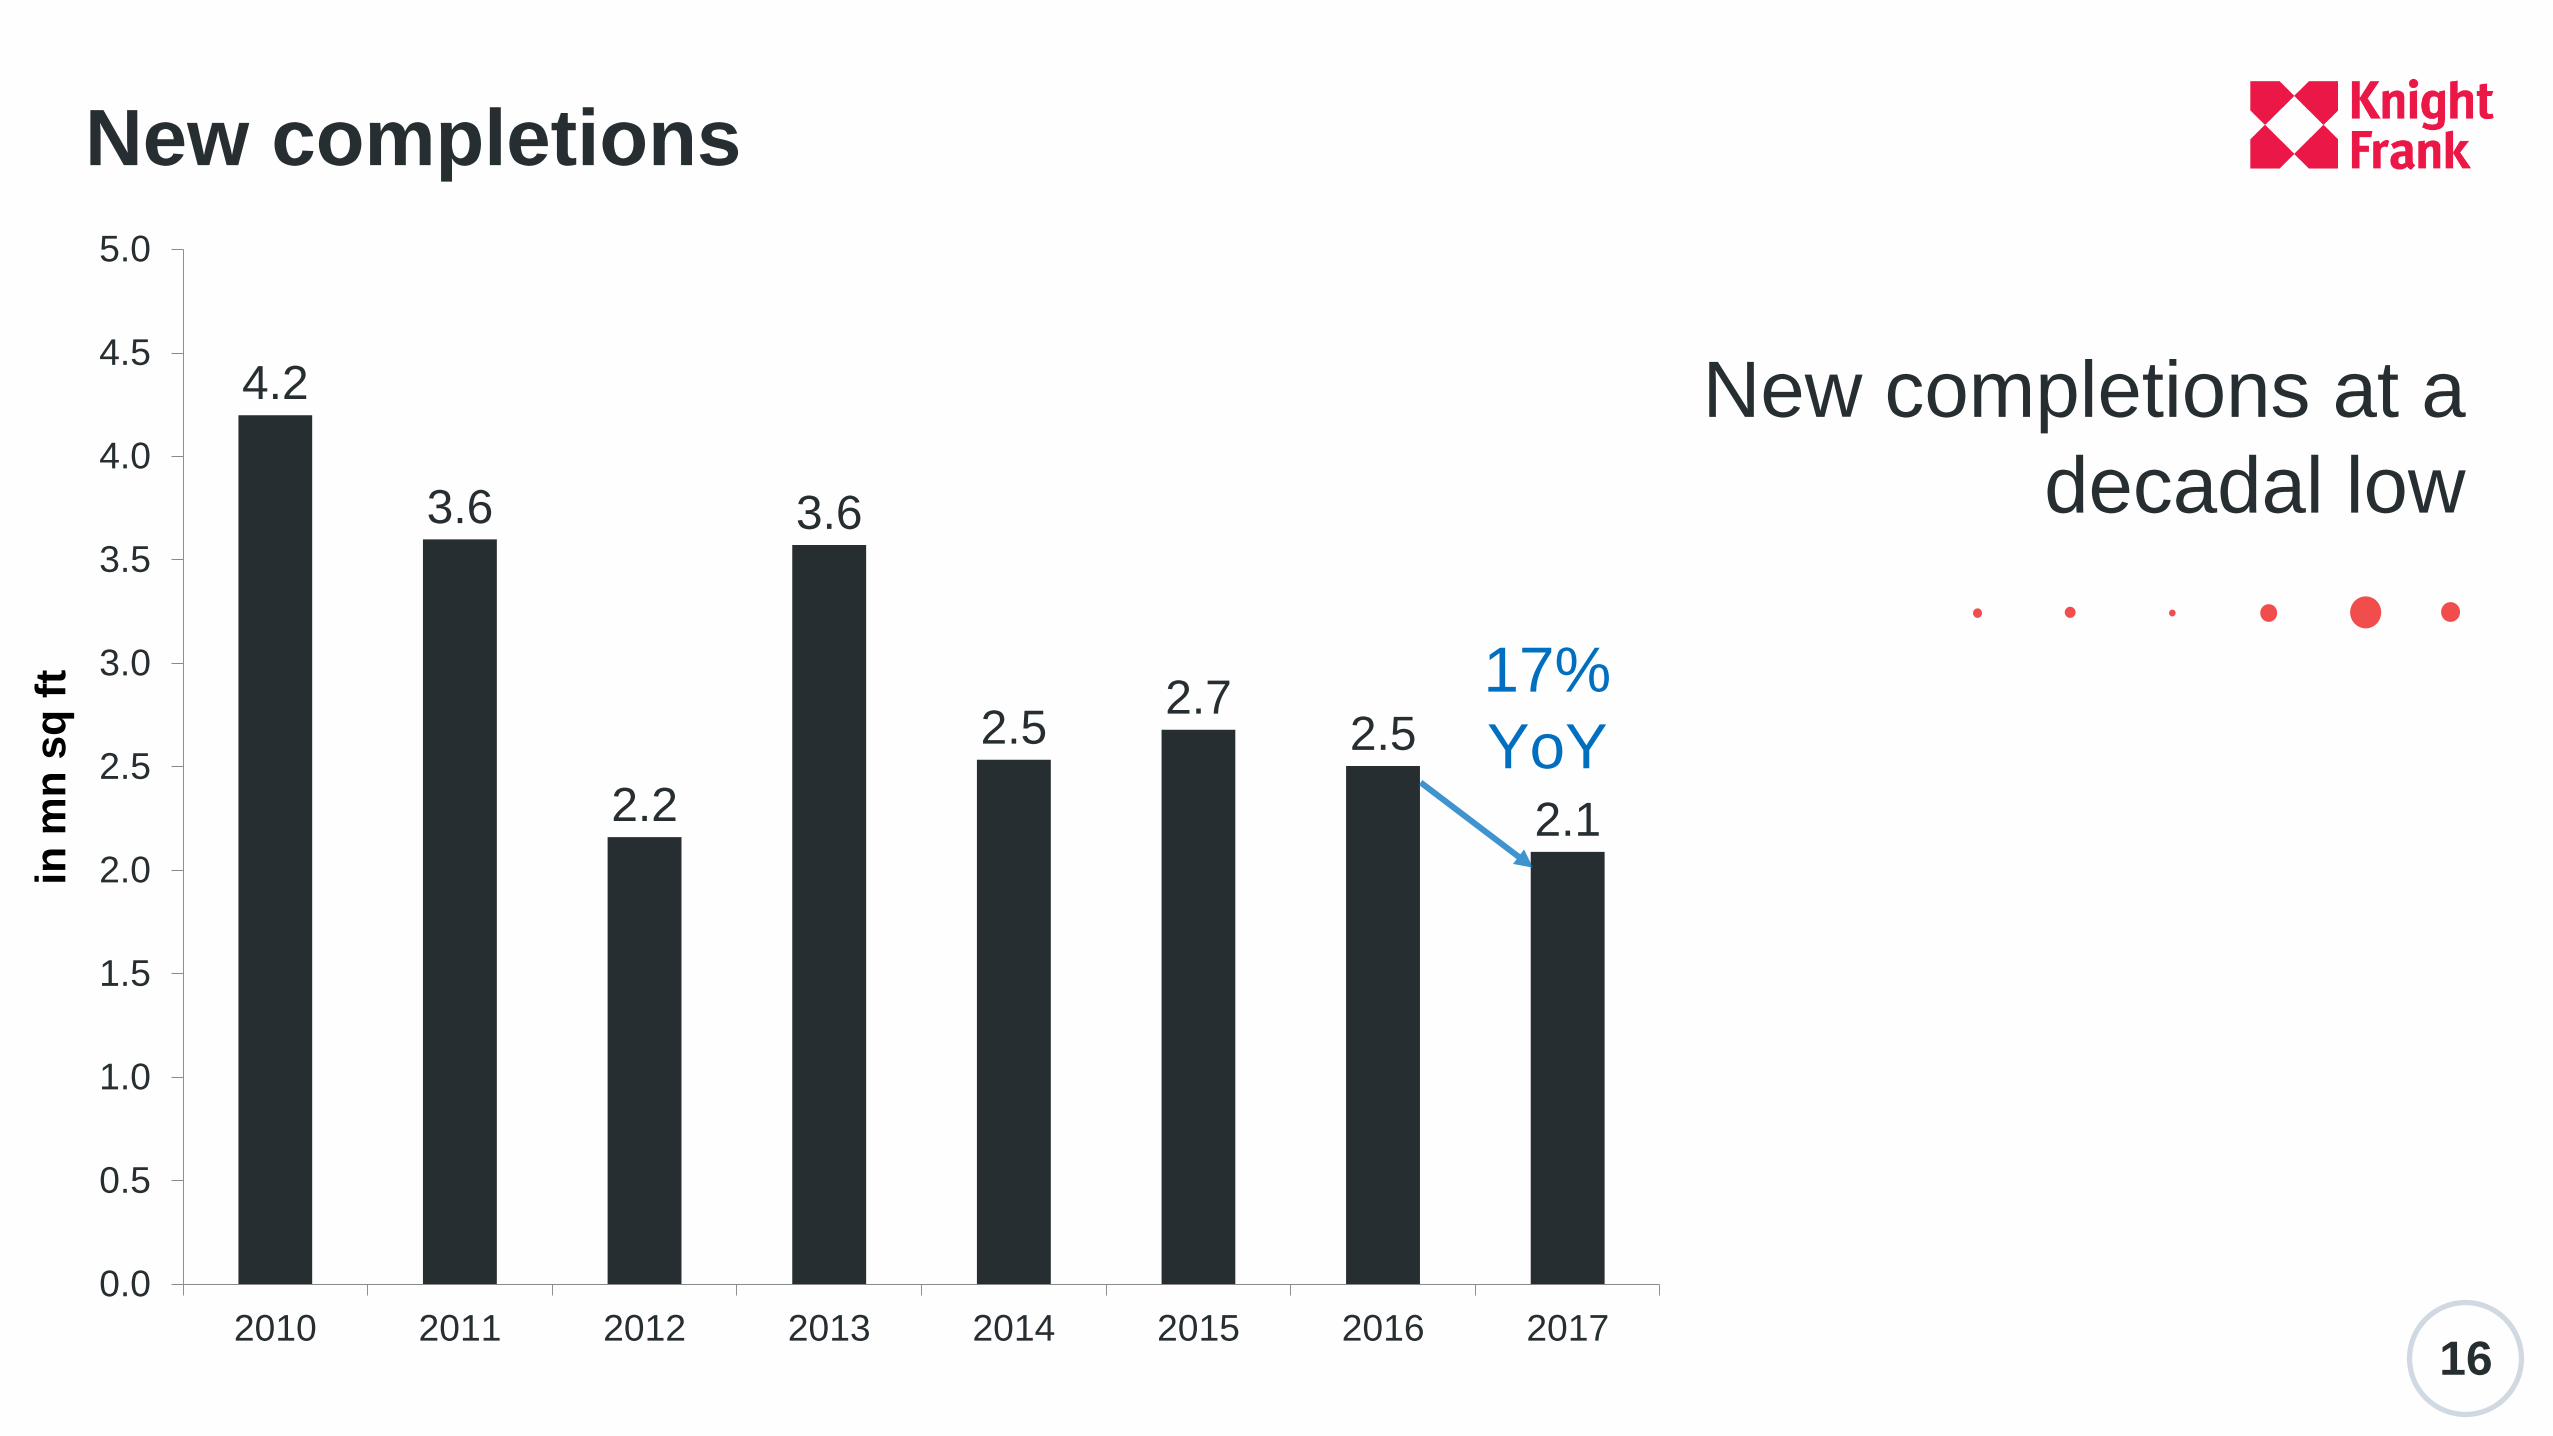
New completions
16
4.2
3.6
2.2
3.6
2.52.7
2.5
2.1
0.0
0.5
1.0
1.5
2.0
2.5
3.0
3.5
4.0
4.5
5.0
2010 2011 2012 2013 2014 2015 2016 2017
17%
YoY
in m
nsq
ft
New completions at a
decadal low
17
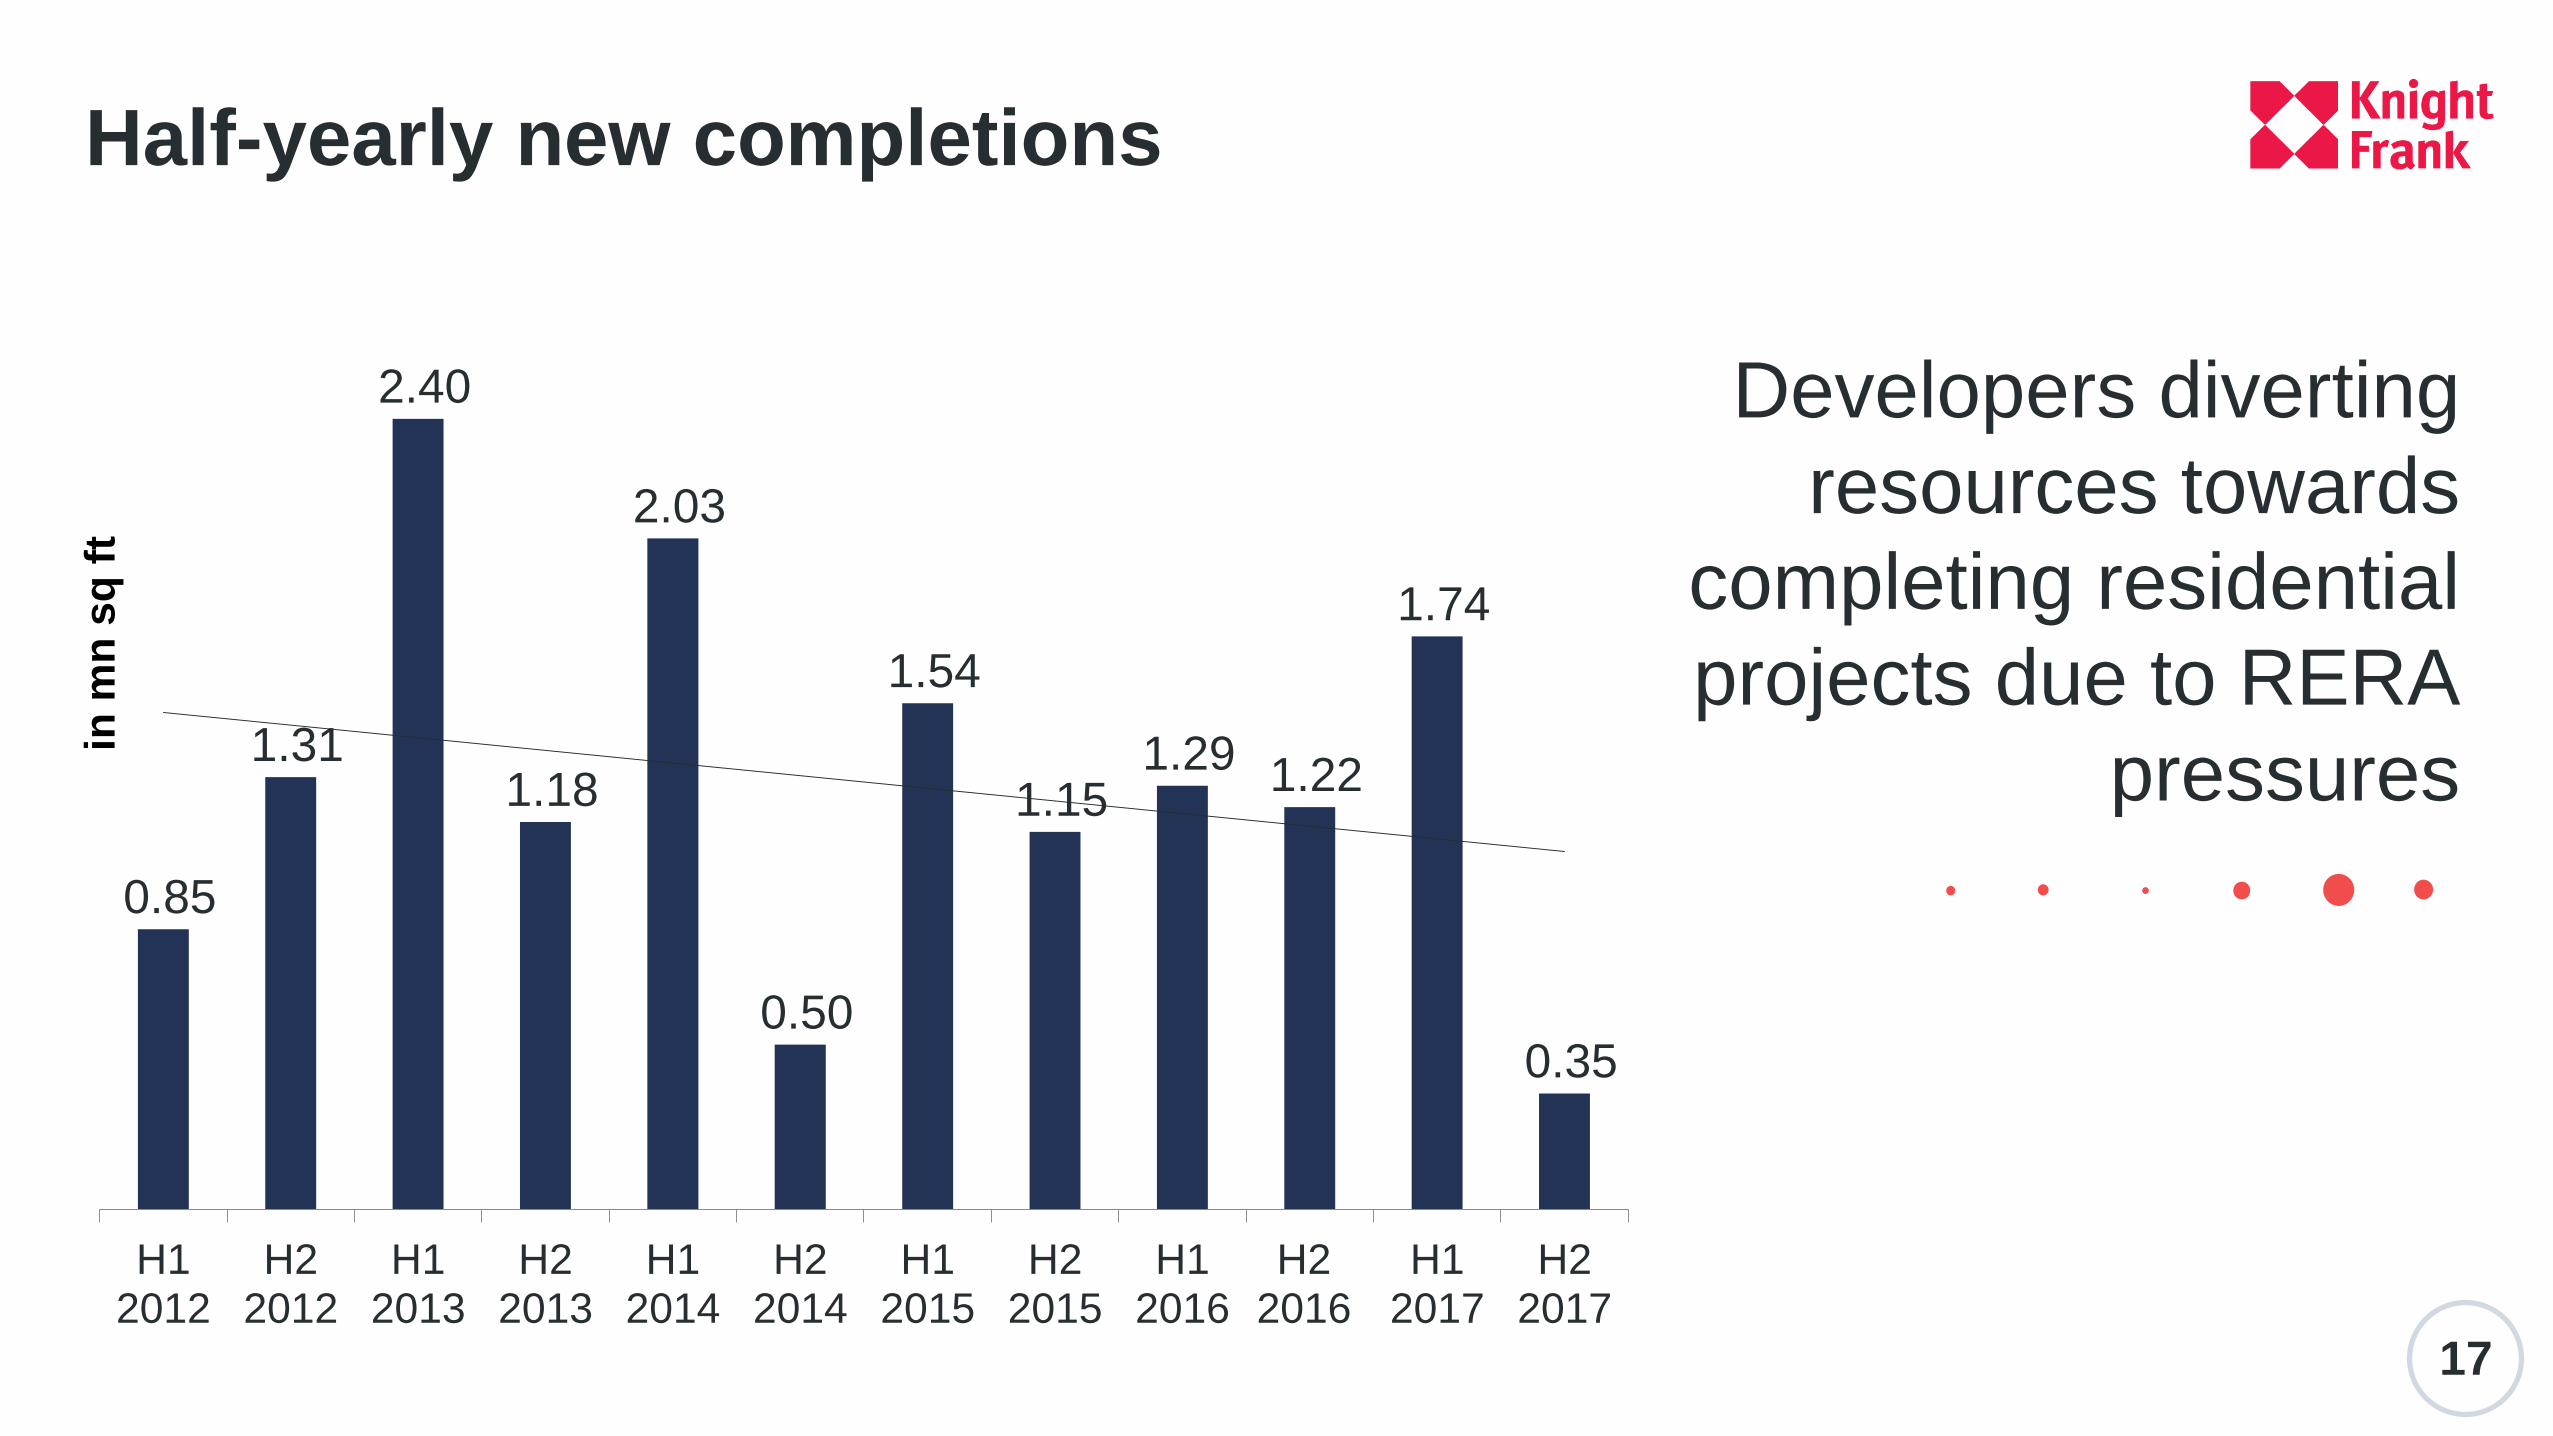
0.85
1.31
2.40
1.18
2.03
0.50
1.54
1.15 1.29 1.22
1.74
0.35
H12012
H22012
H12013
H22013
H12014
H22014
H12015
H22015
H12016
H22016
H12017
H22017
Half-yearly new completionsin
mn
sq
ft
Developers diverting
resources towards
completing residential
projects due to RERA
pressures
18
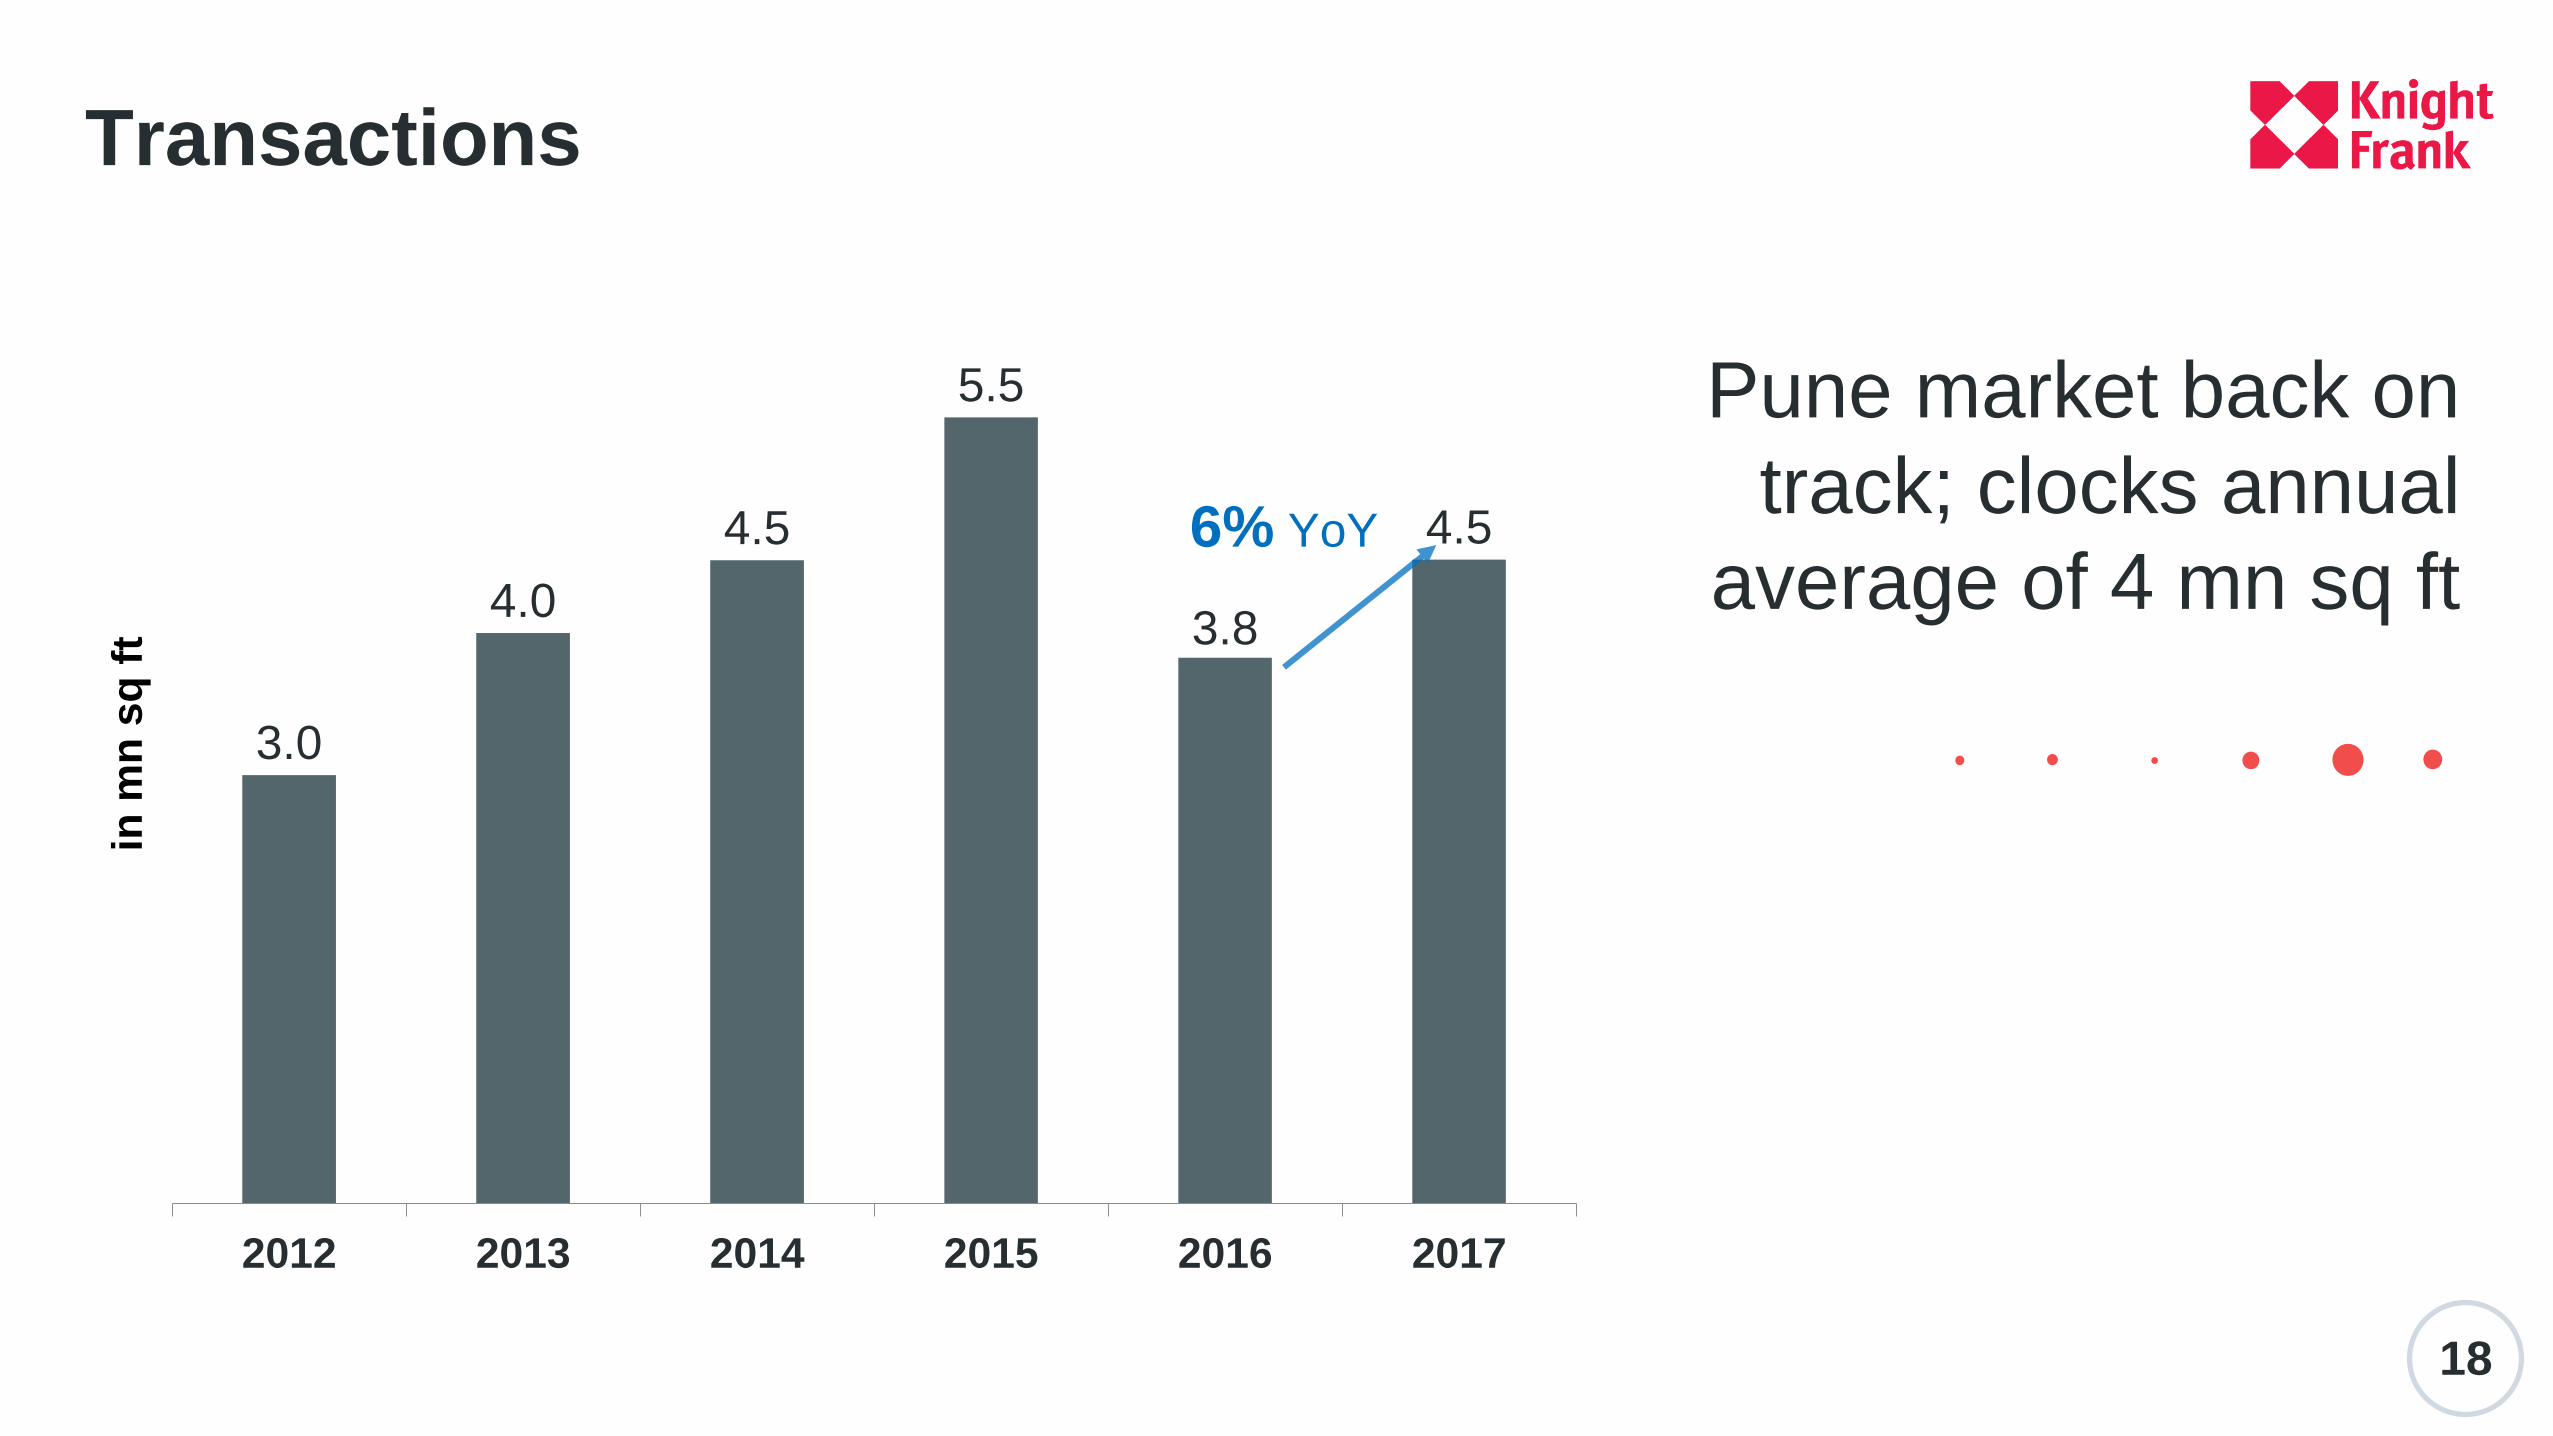
3.0
4.0
4.5
5.5
3.8
4.5
2012 2013 2014 2015 2016 2017
6% YoY
Transactions
Pune market back on
track; clocks annual
average of 4 mn sq ft
in m
nsq
ft
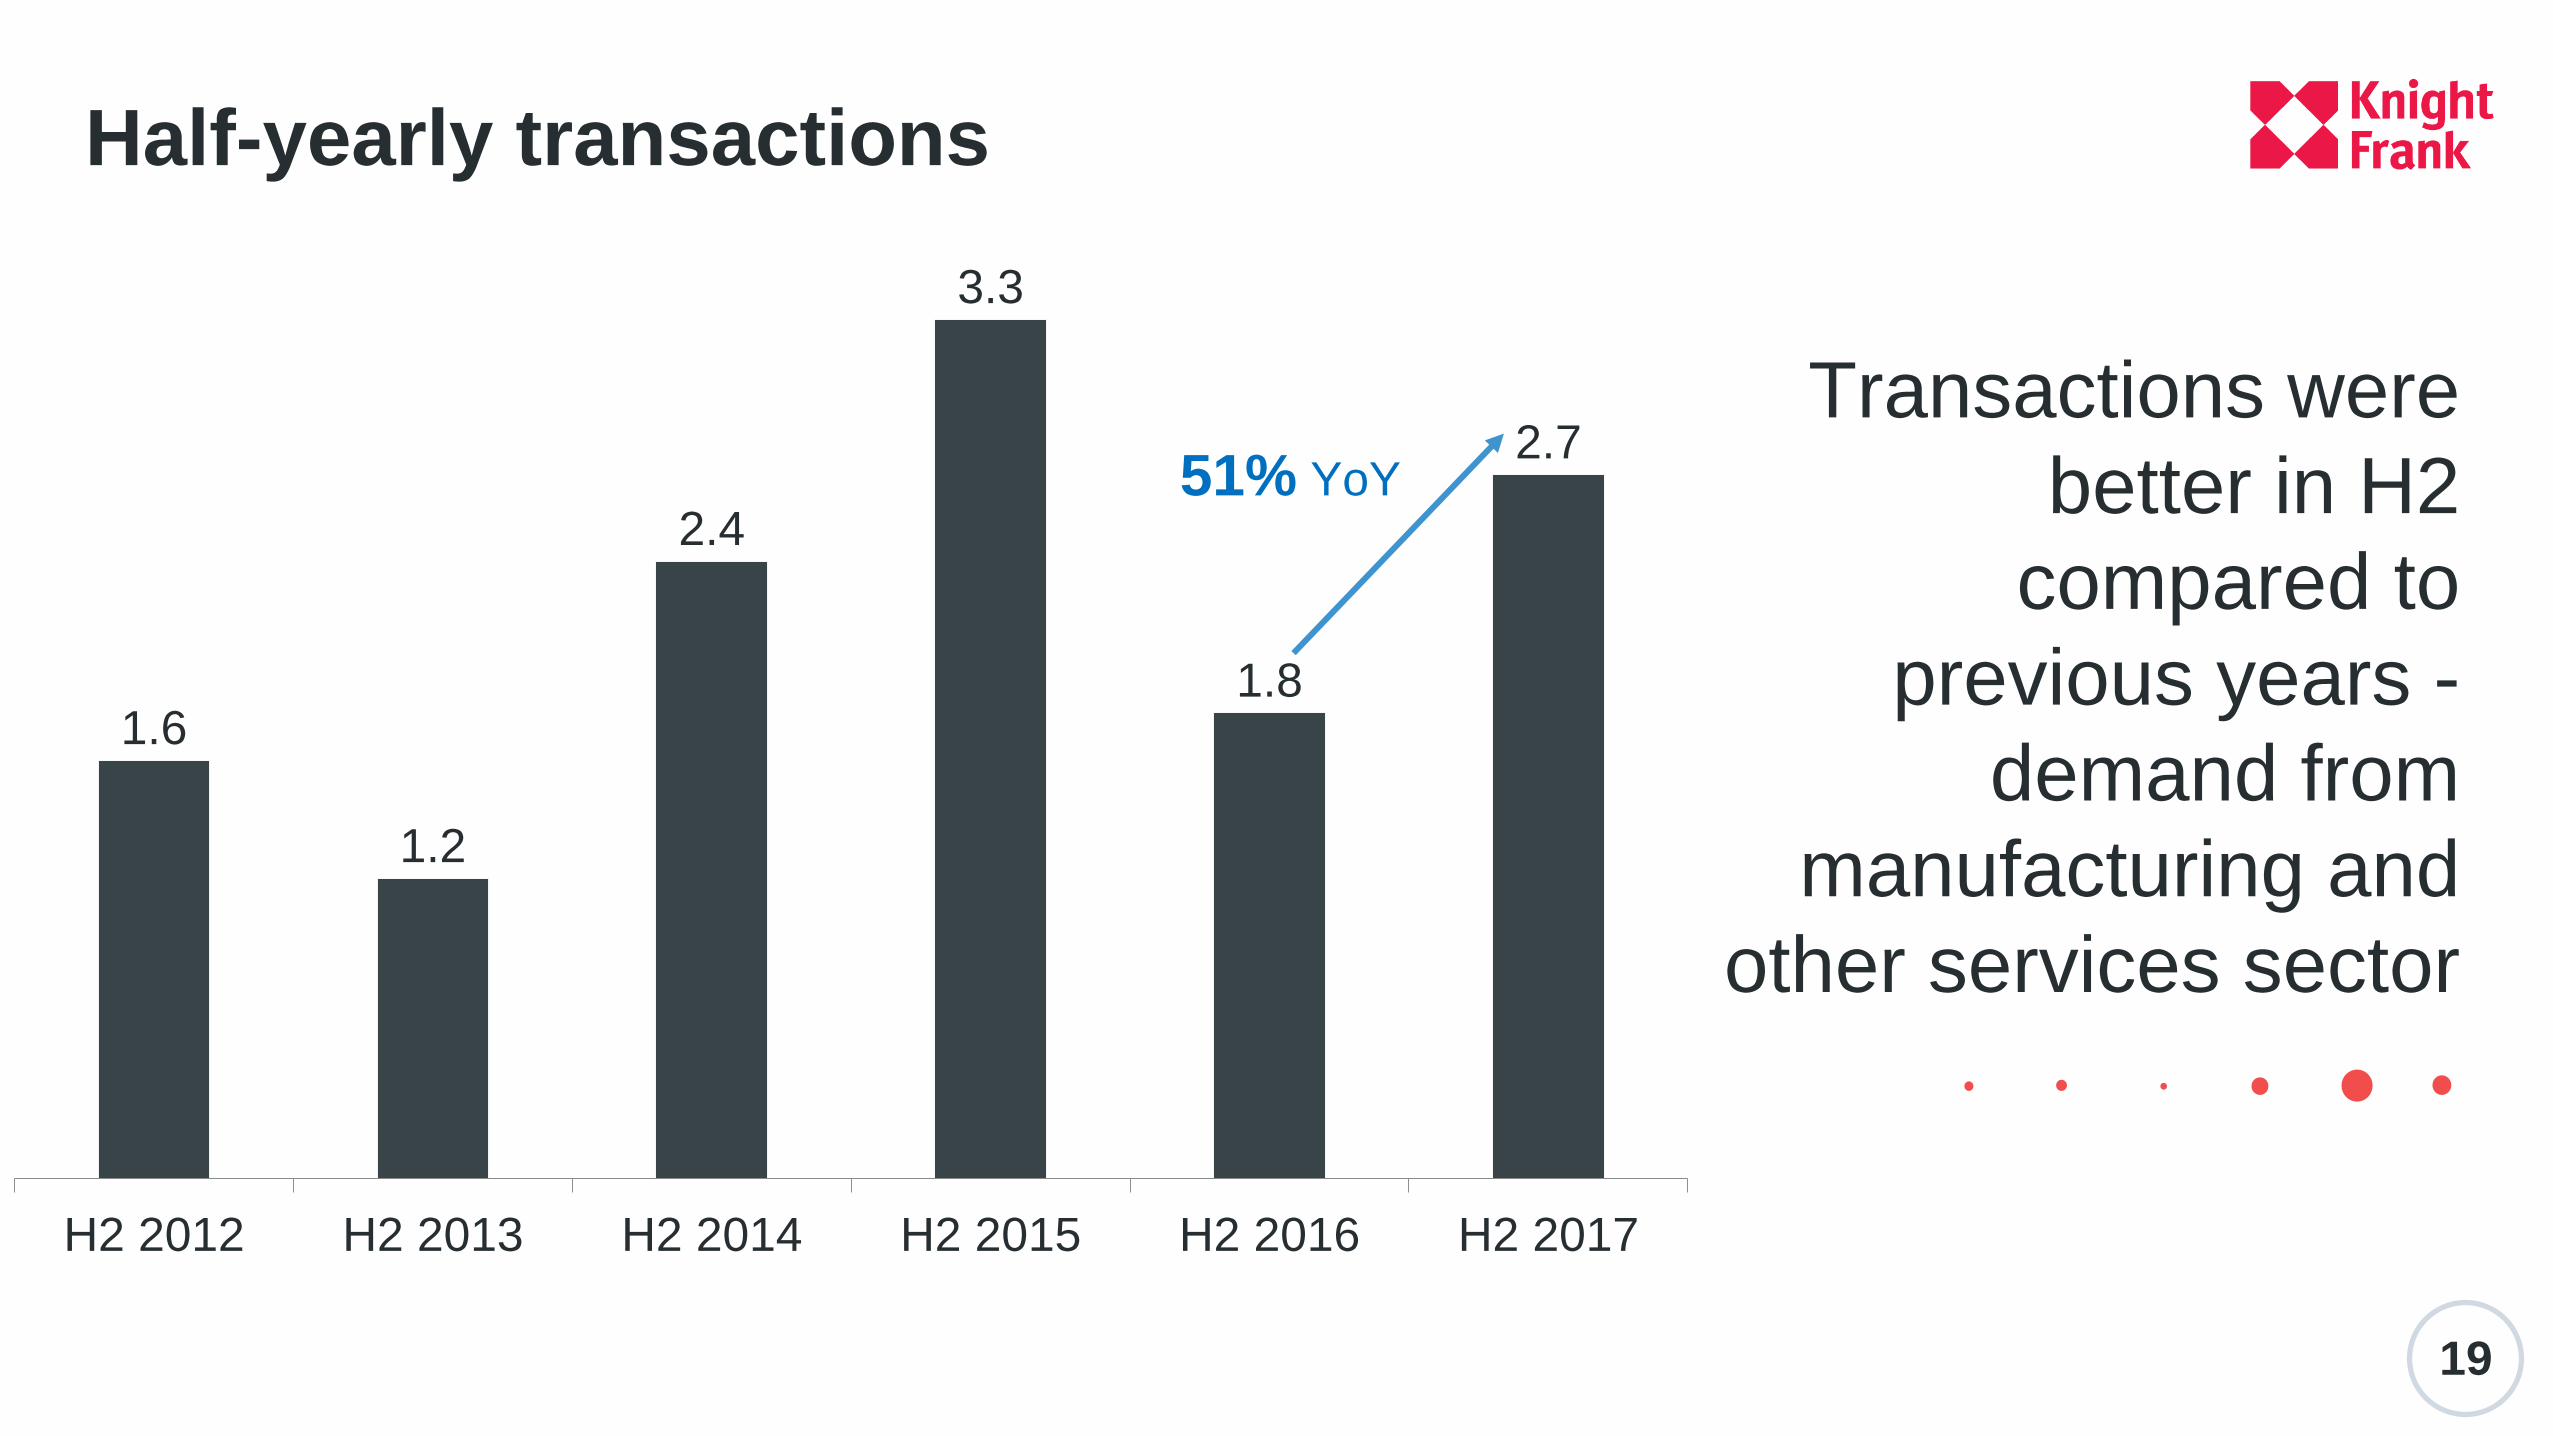
19
1.6
1.2
2.4
3.3
1.8
2.7
H2 2012 H2 2013 H2 2014 H2 2015 H2 2016 H2 2017
51% YoY
Half-yearly transactions
Transactions were
better in H2
compared to
previous years -
demand from
manufacturing and
other services sector
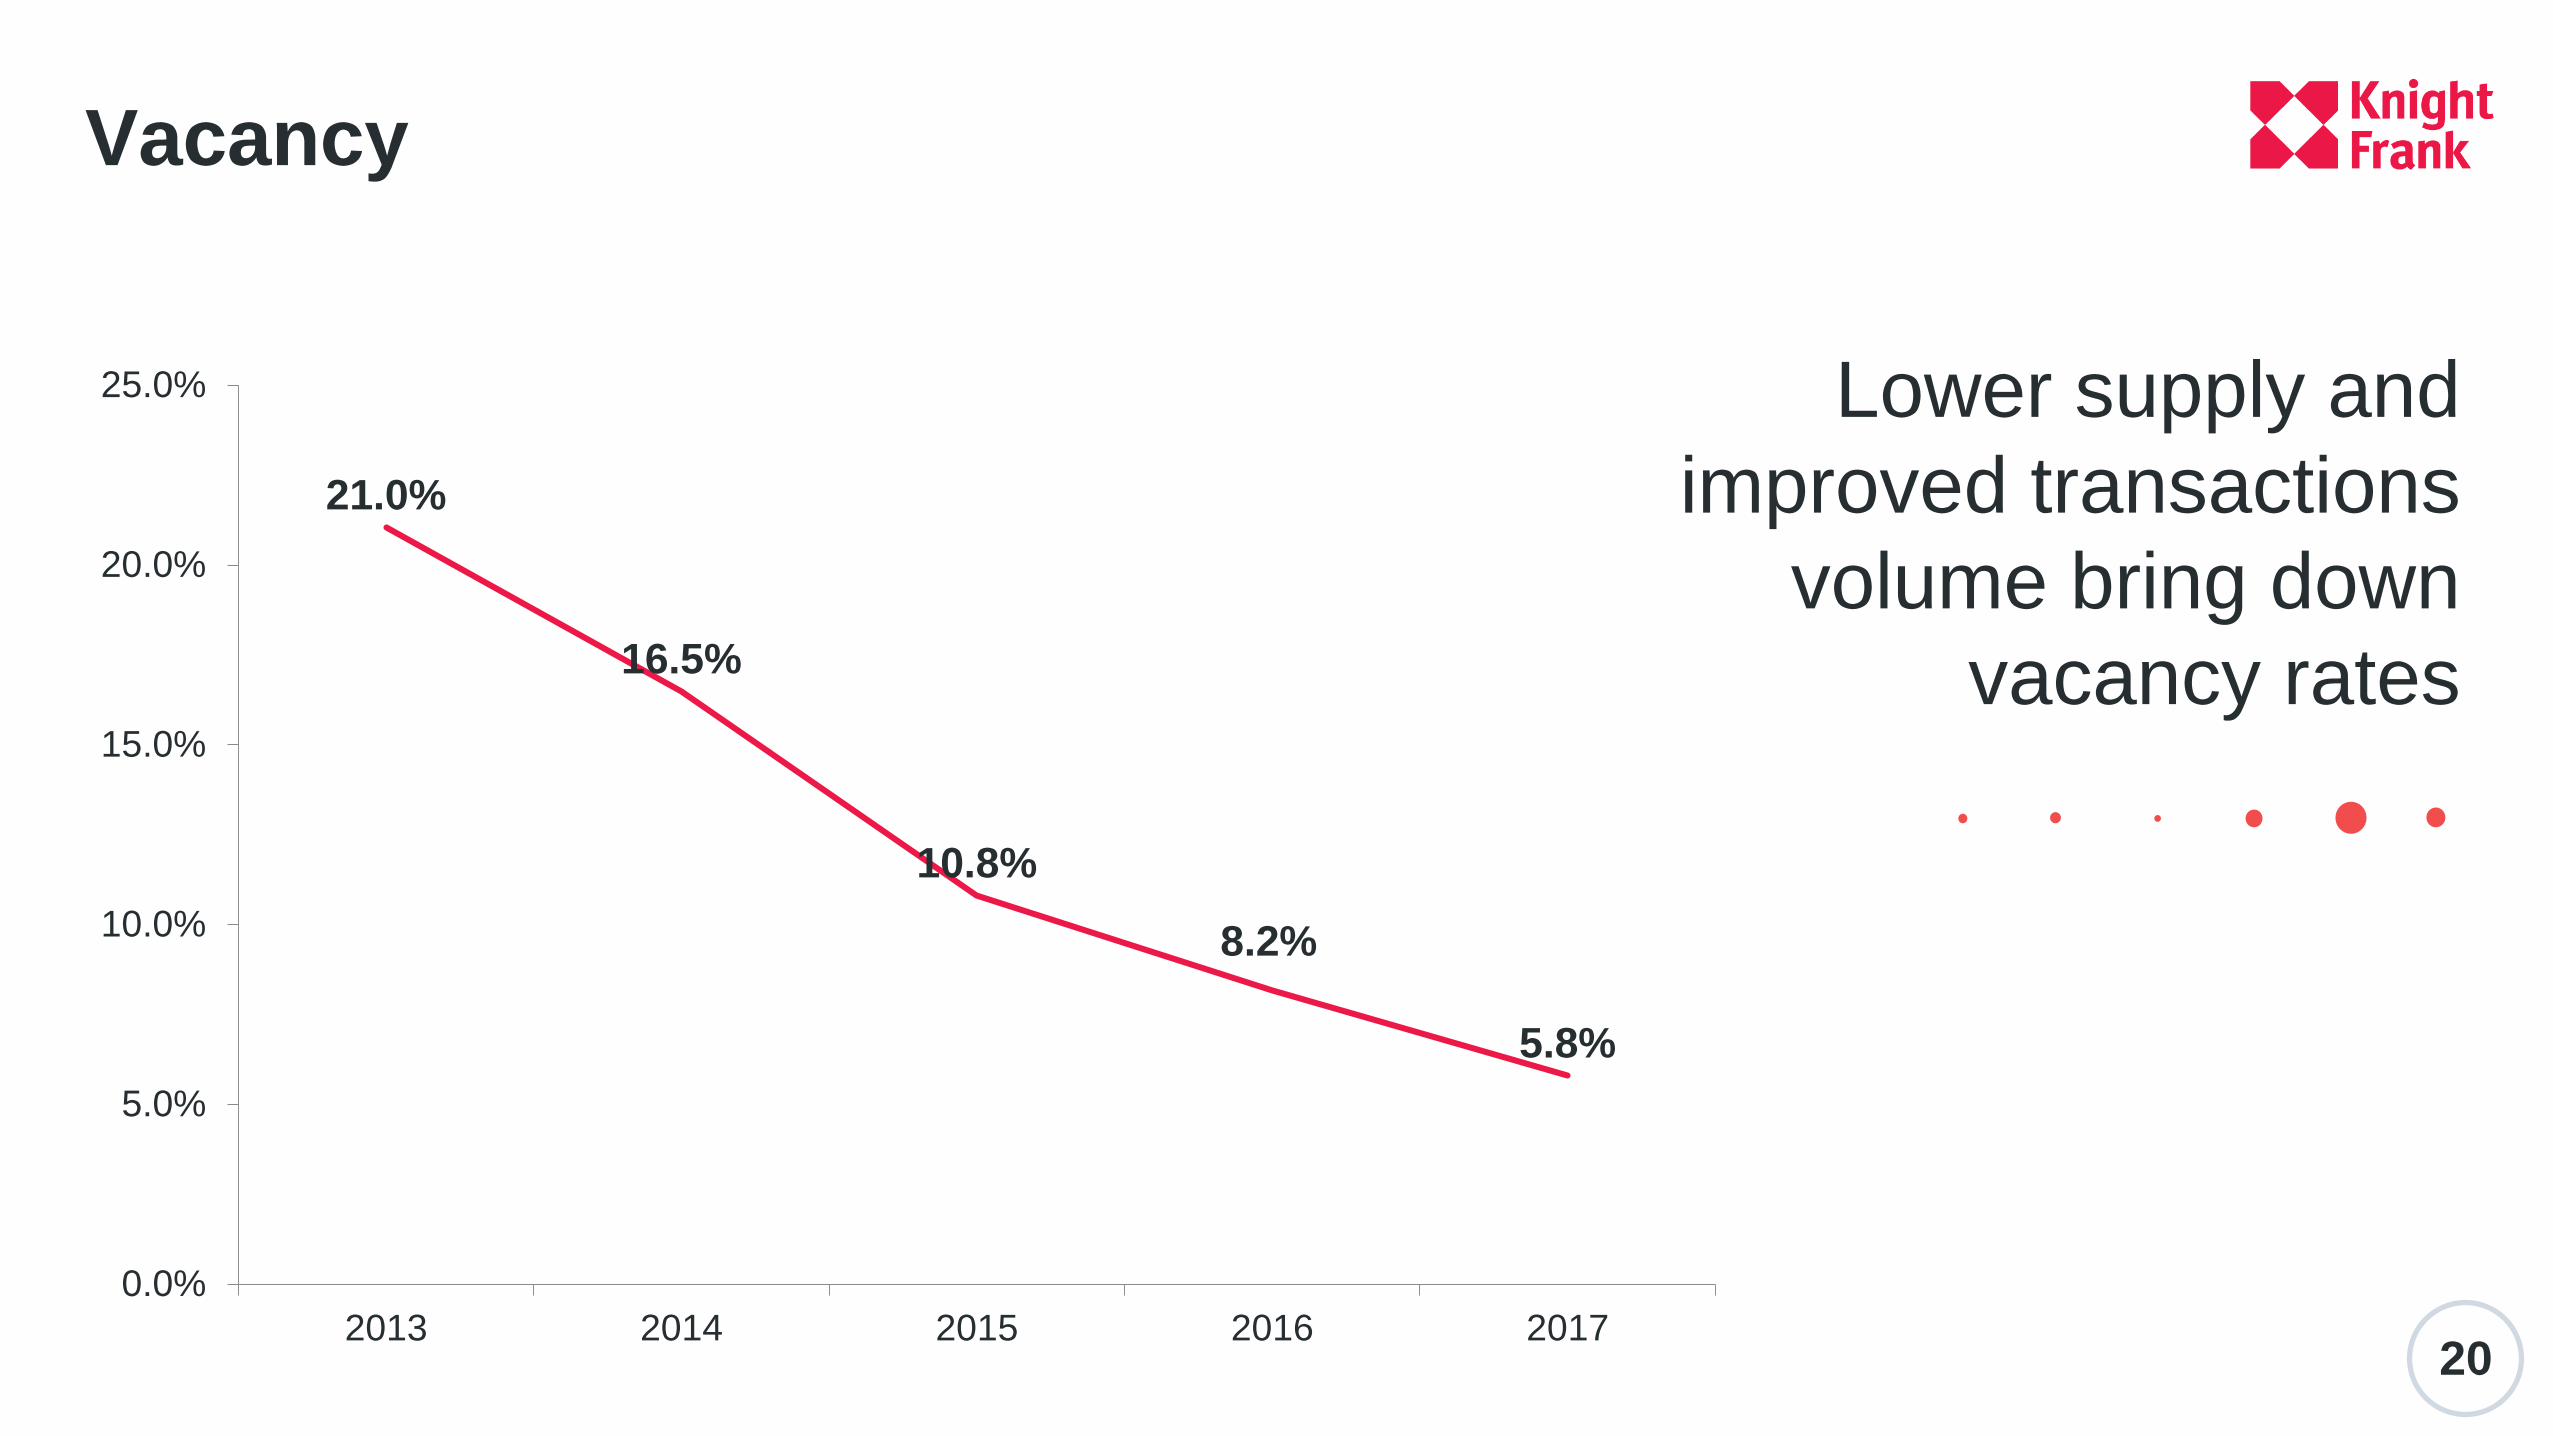
20
21.0%
16.5%
10.8%
8.2%
5.8%
0.0%
5.0%
10.0%
15.0%
20.0%
25.0%
2013 2014 2015 2016 2017
Vacancy
Lower supply and
improved transactions
volume bring down
vacancy rates
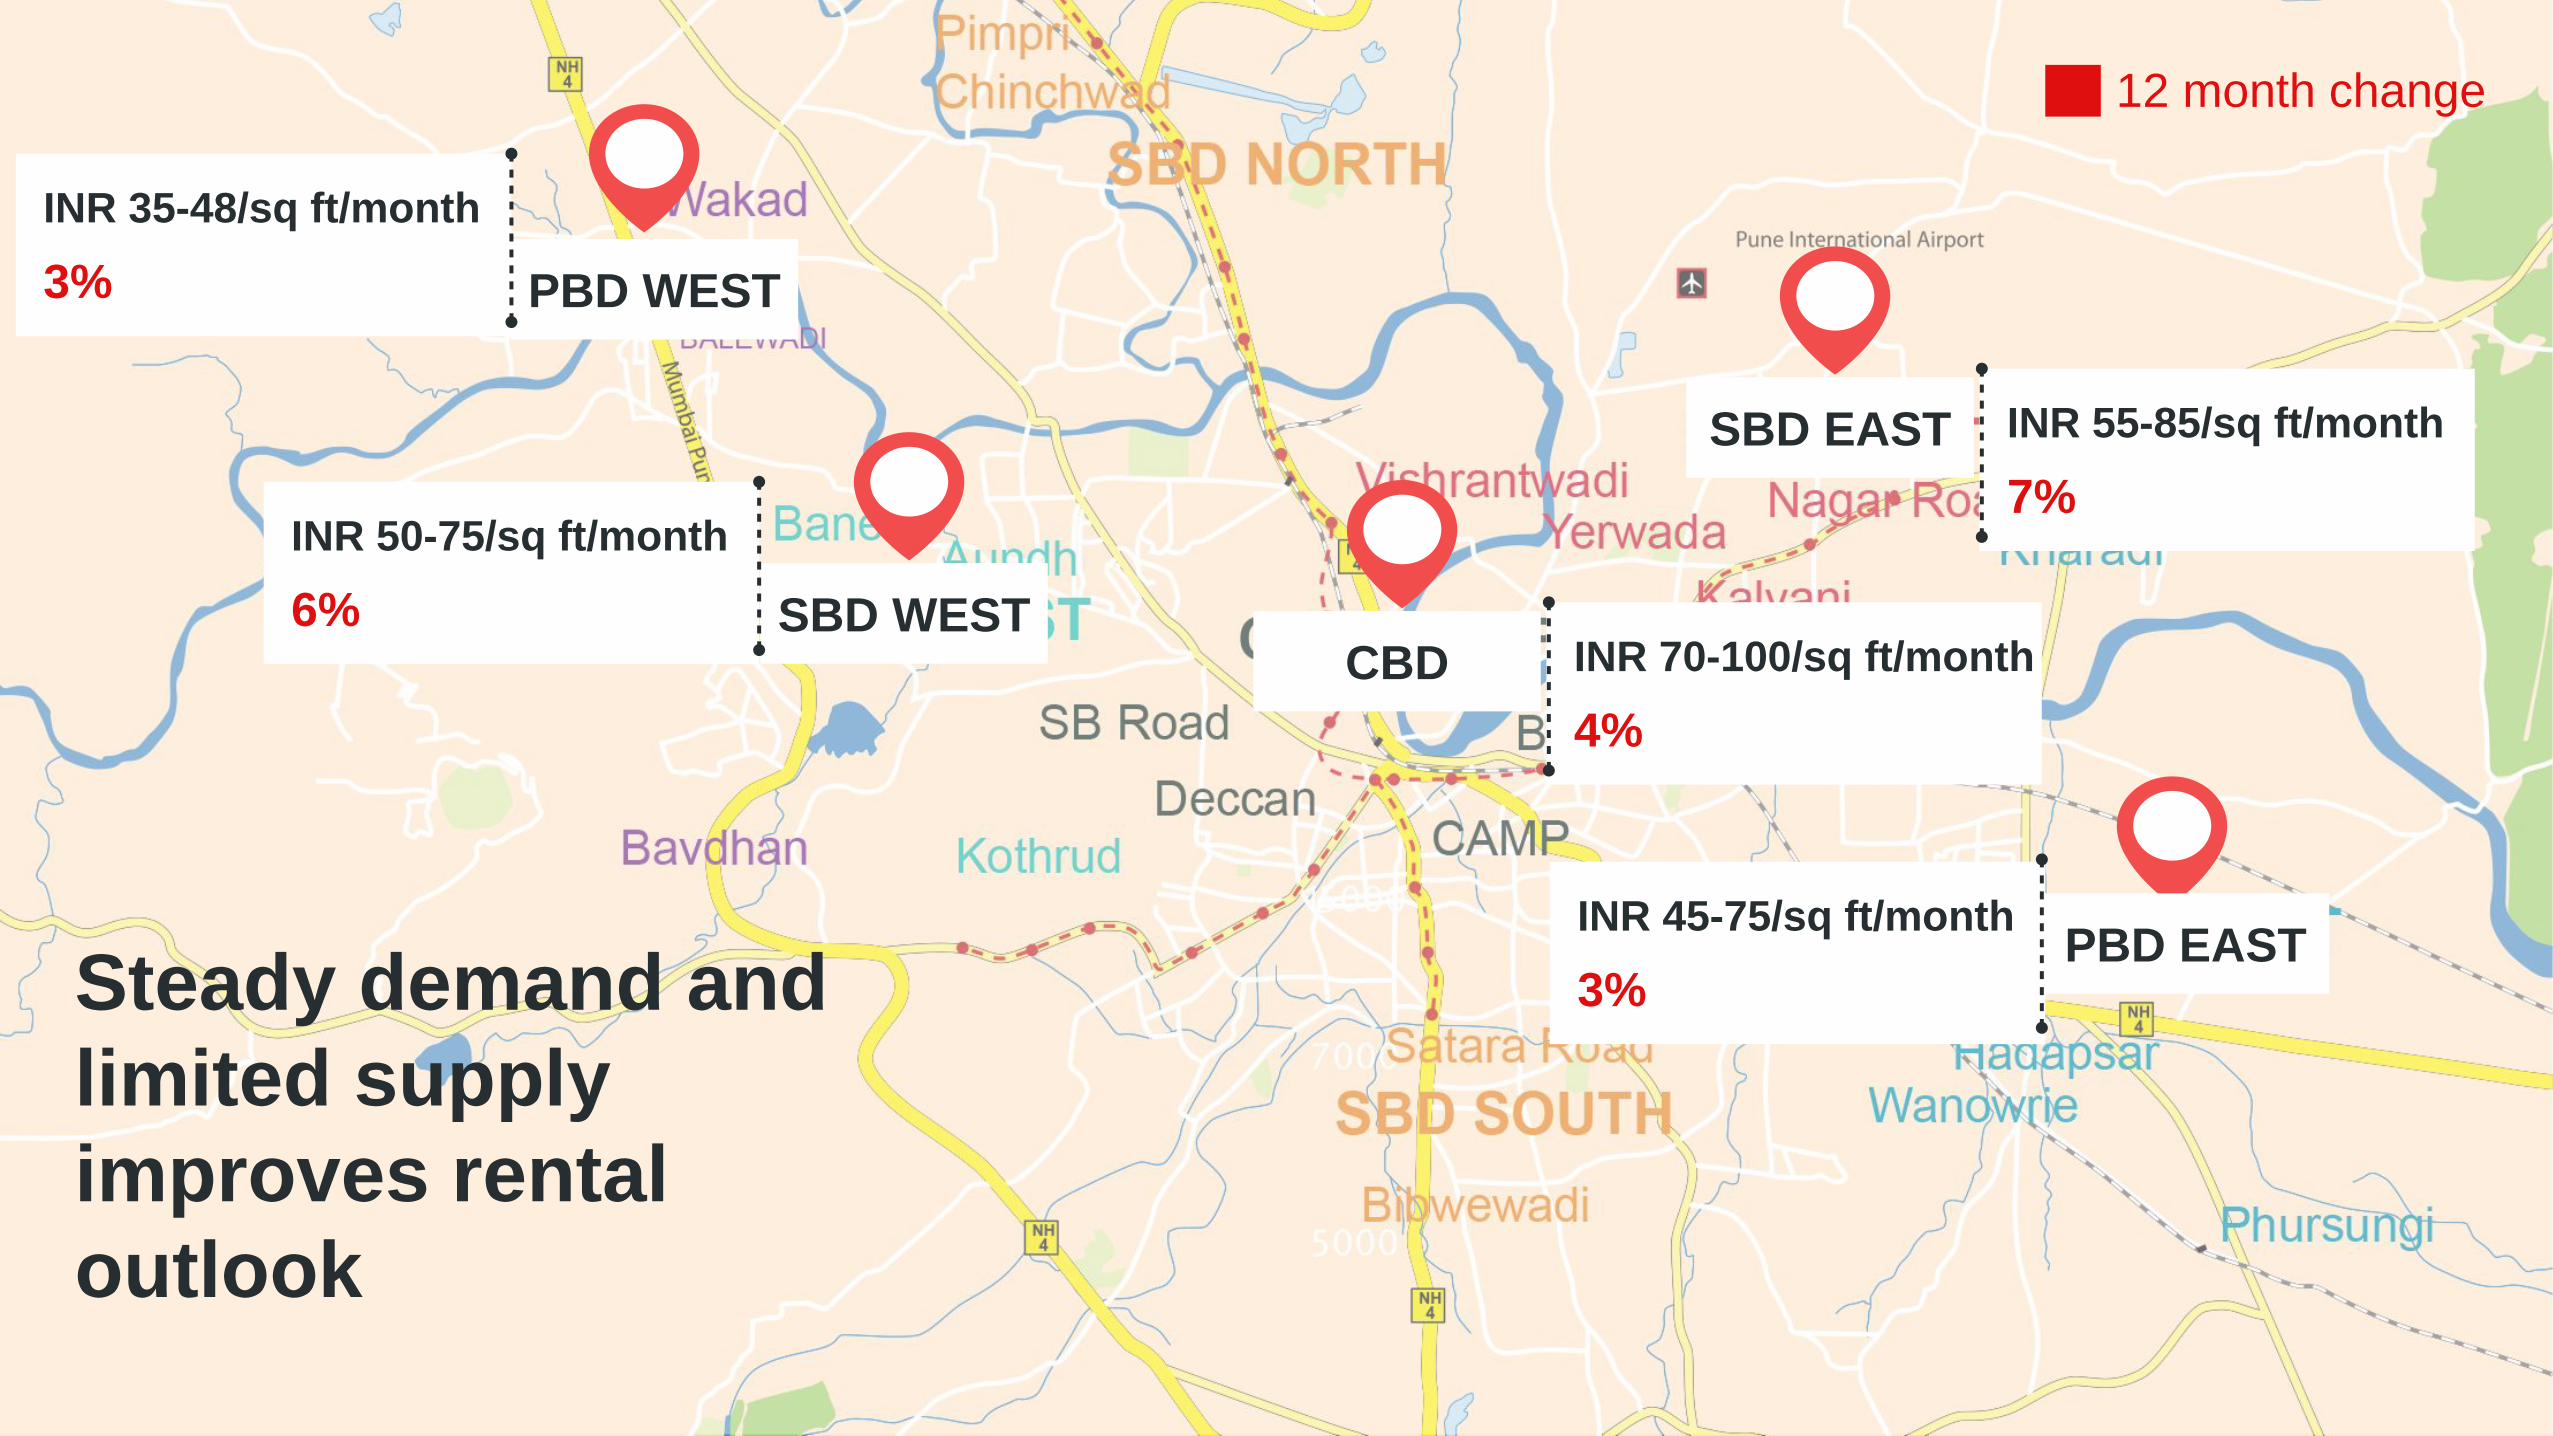
12 month change
CBD INR 70-100/sq ft/month
4%
Steady demand and
limited supply
improves rental
outlook
PBD EASTINR 45-75/sq ft/month
3%
SBD EAST INR 55-85/sq ft/month
7%
SBD WEST
INR 50-75/sq ft/month
6%
PBD WEST
INR 35-48/sq ft/month
3%
22
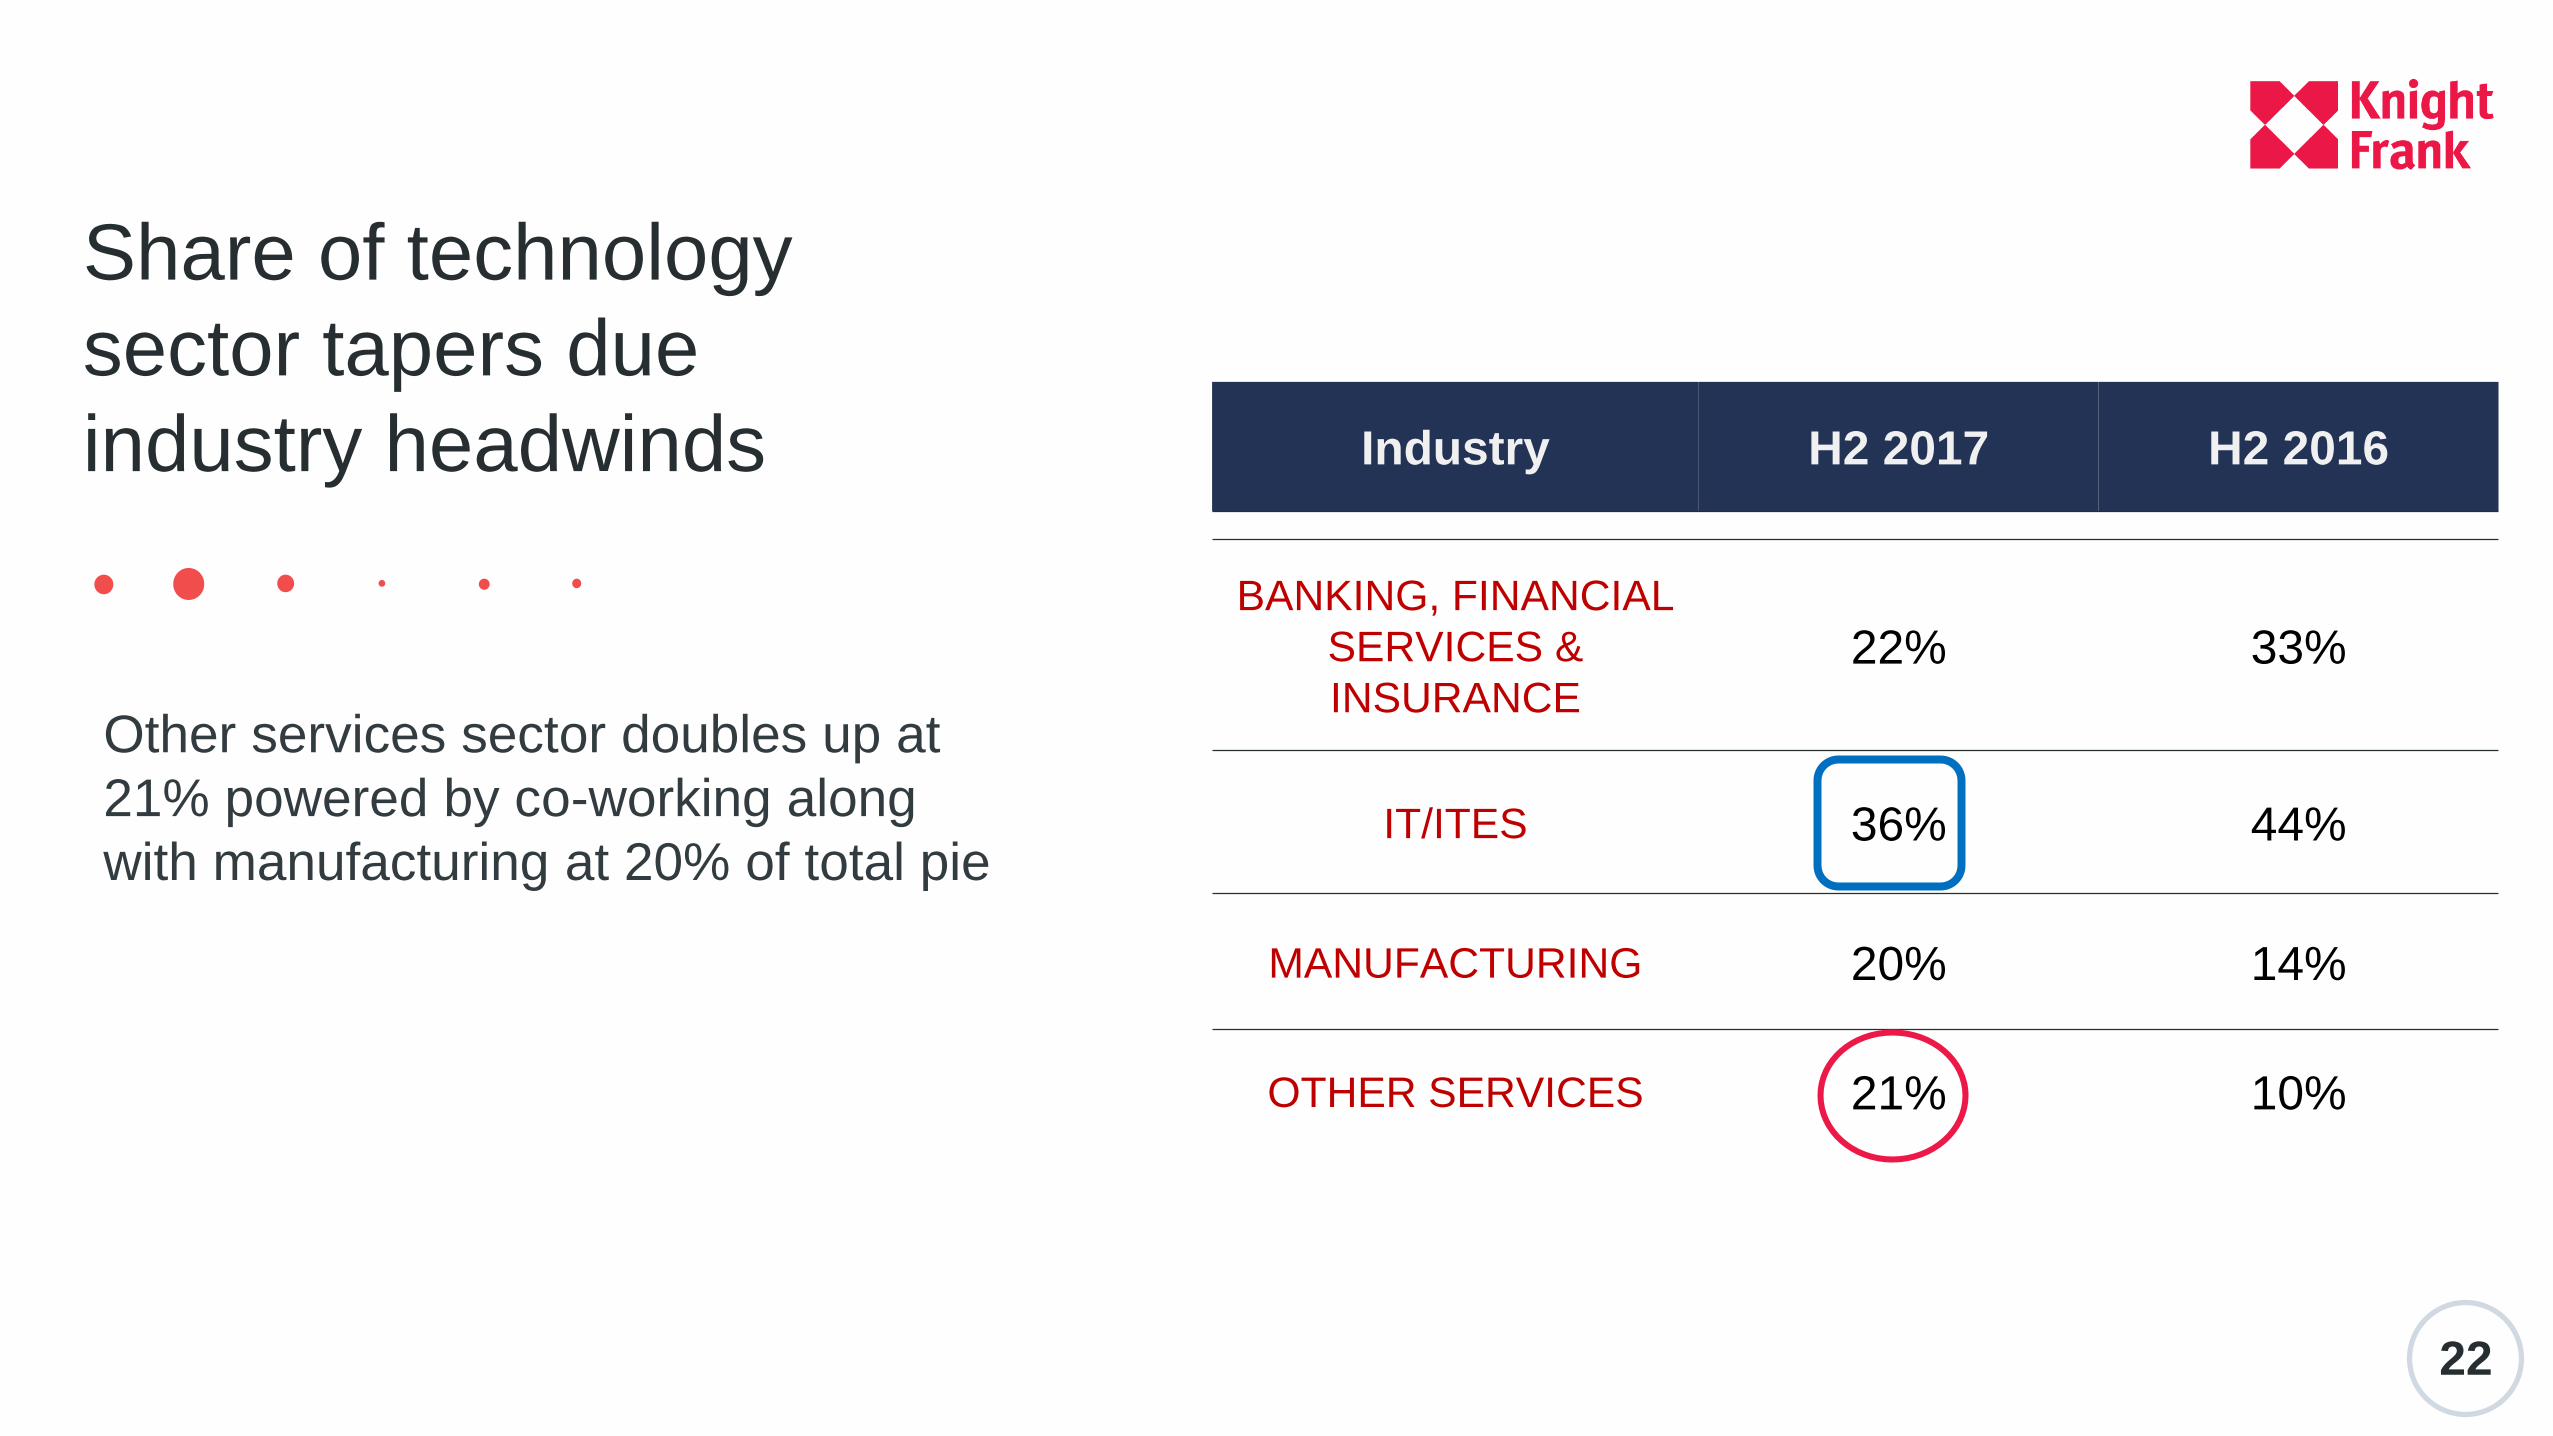
Industry H2 2017 H2 2016
BANKING, FINANCIAL
SERVICES &
INSURANCE22% 33%
IT/ITES 36% 44%
MANUFACTURING 20% 14%
OTHER SERVICES 21% 10%
Other services sector doubles up at
21% powered by co-working along
with manufacturing at 20% of total pie
Share of technology
sector tapers due
industry headwinds
KEY FINDINGS
01 03
02 04
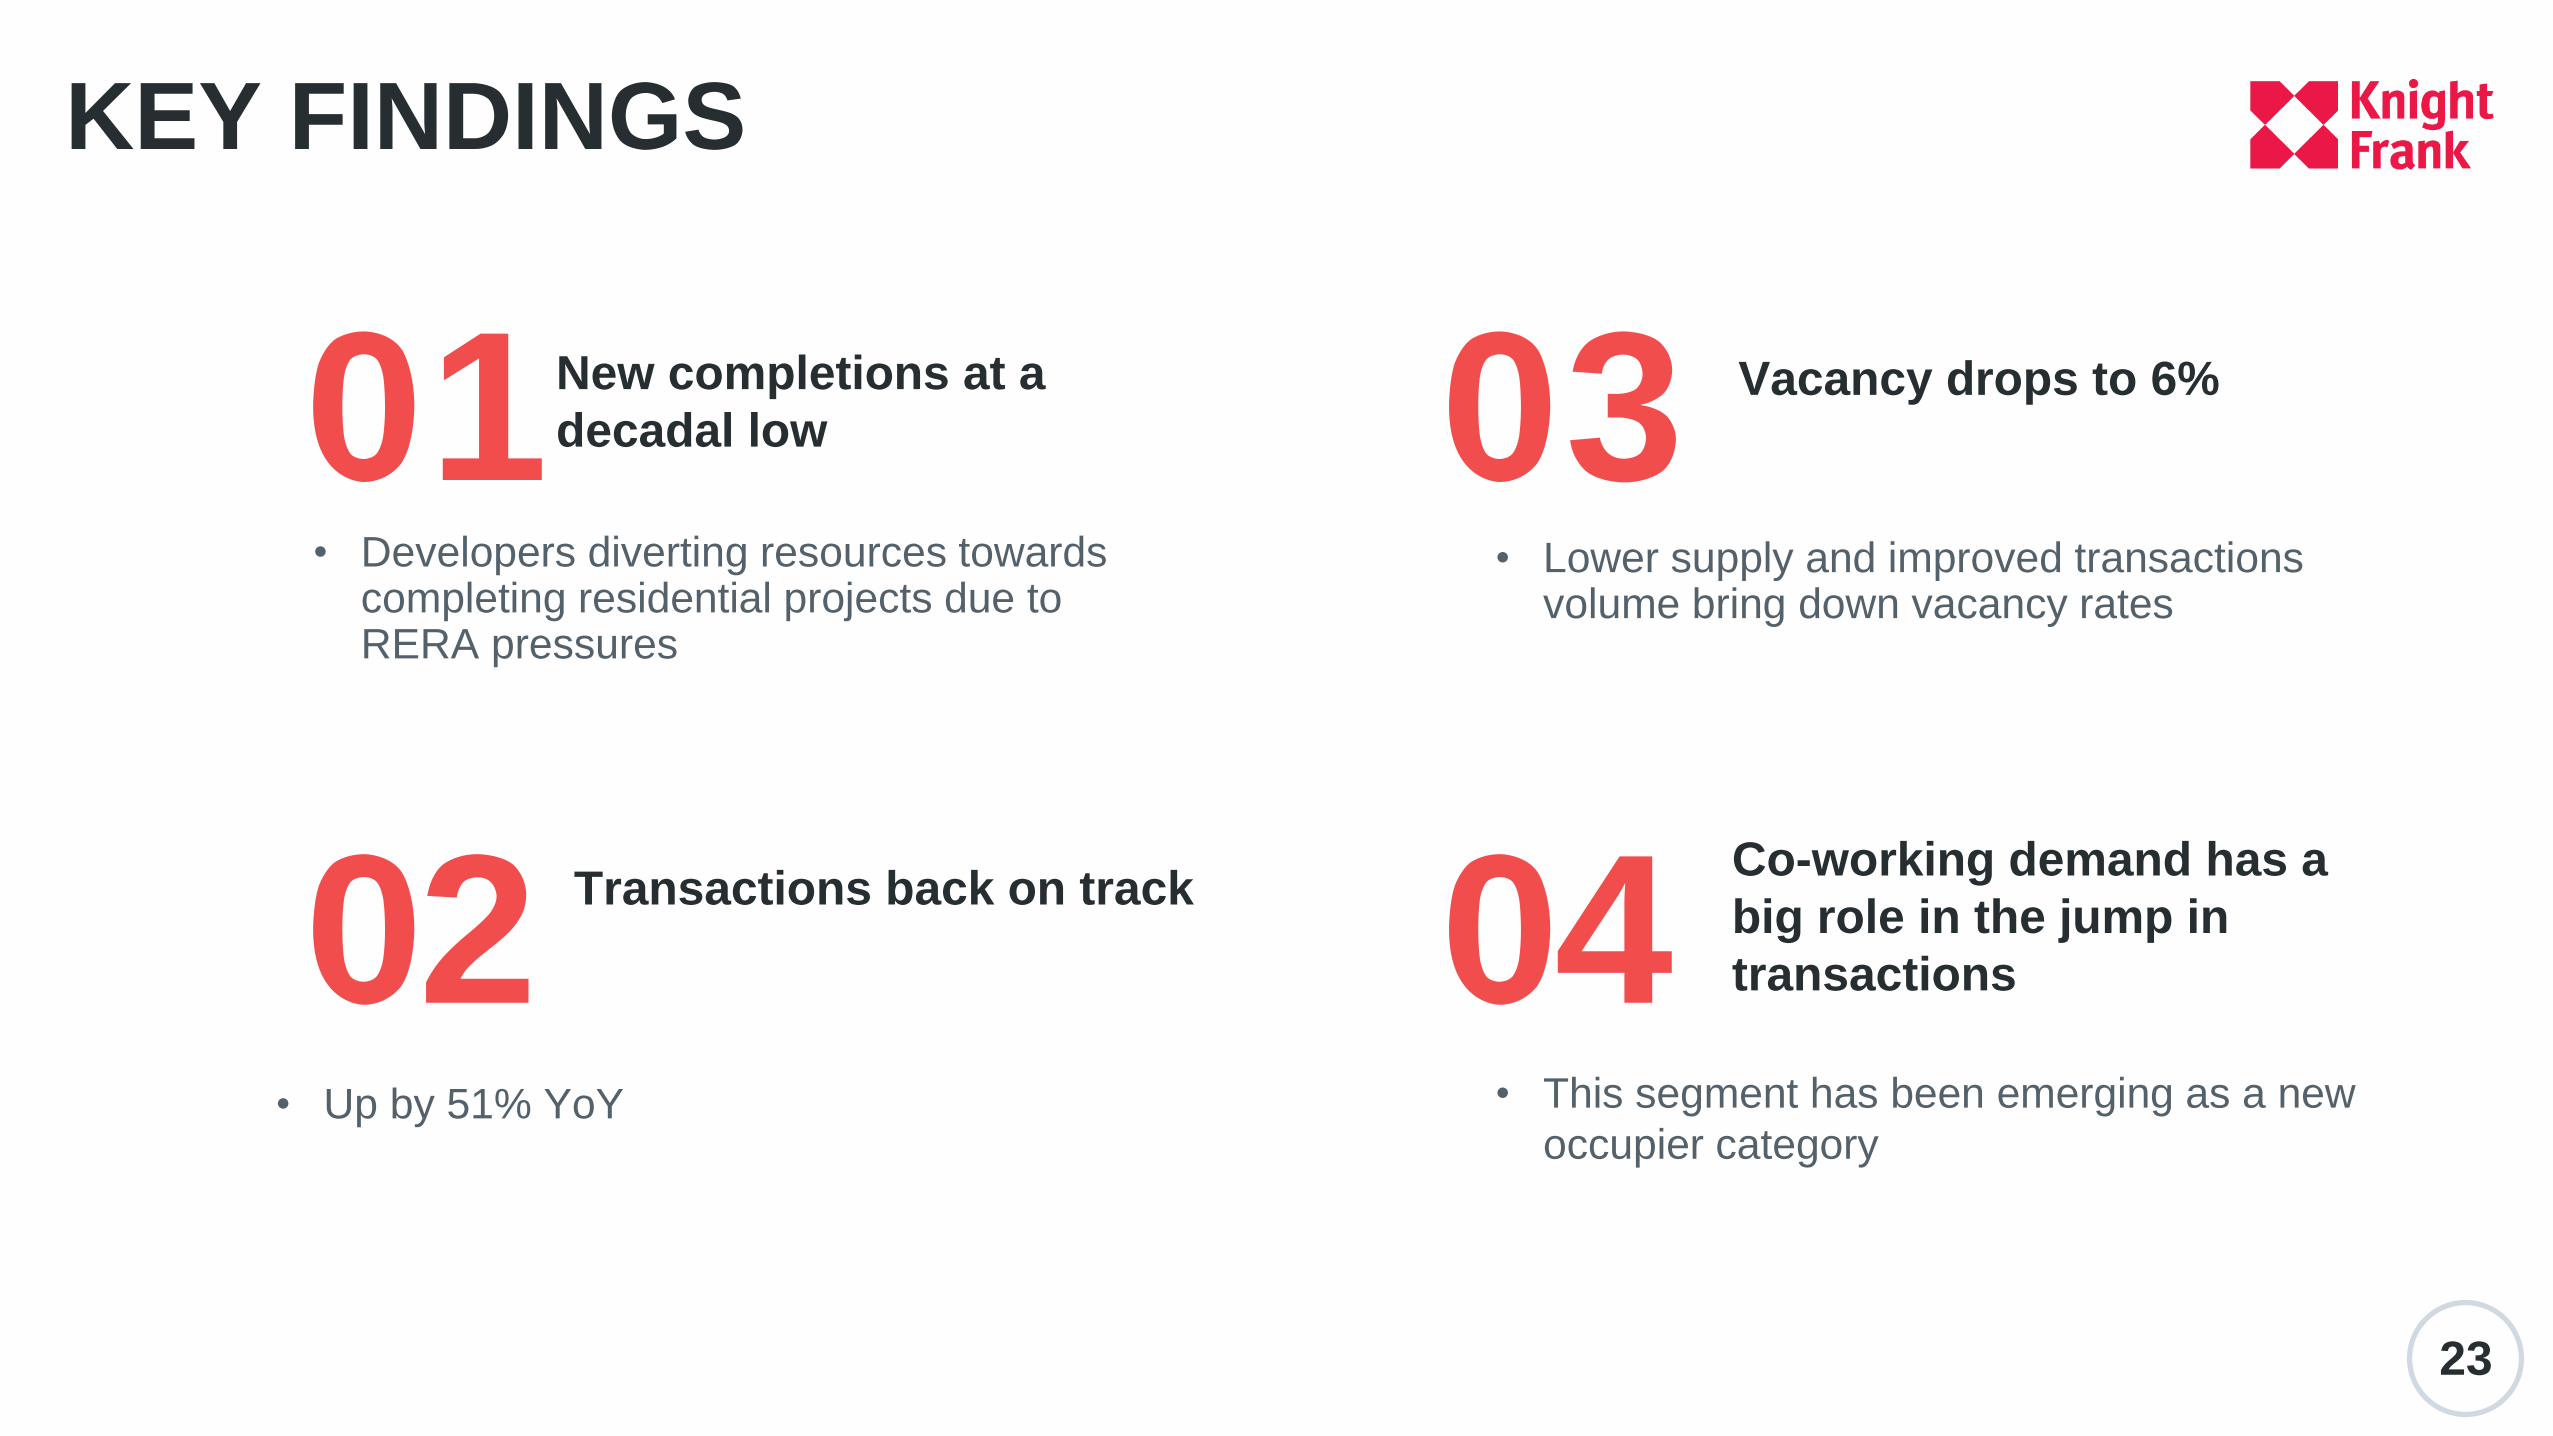
23
New completions at a
decadal low
• Developers diverting resources towards completing residential projects due to RERA pressures
Vacancy drops to 6%
• Lower supply and improved transactions volume bring down vacancy rates
Co-working demand has a
big role in the jump in
transactions
• This segment has been emerging as a new
occupier category
Transactions back on track
• Up by 51% YoY

PUNERESIDENTIAL & OFFICE
In residential segment, Pune sees a price
decline for the first time in this decade
In office market, co-working service providers
emerge as new potential occupiers