Embed Size (px)
Citation preview

� � � � � � � � � � � � � � � �
Kevin Tsun Licensed as Hon Sing Tsun Licensed Real Estate Salesperson T: + (212).685.7777 Ext. 293 M: + (516).316-1951 E: [email protected]

DESIGNED BY ROBERT A.M. STERN ARCHITECTS & DEVELOPED BY ZECKENDORF DEVELOPMENT
Do you want to own in Robert Stern & Zackenforf project? Last time they did this, the prices quadrupled
This is a rare opportunity to make money with the Stern & Zeckendorf
Contact us
Hon Sing Tsun
Licensed Real Estate Salesperson
CITI HABITATS
CORPORATE & HEADQUARTERS
250 PARK AVENUE SOUTH, 12TH
FLOOR
NEW YORK, NY 1003
TEL: + (212) - 685 - 7777 ext. 293
Cel: + (516)- 316 - 1951
Fax: + (917)-262 - 7274
E-mail: [email protected]

Manhattan Residential Sales Market Report
Third Quarter 2014
CITI HABITATS

citihabitats.com | 2
Manhattan Residential Sales Market Report
Third Quarter 2014
CITI HABITATS
West Side
Closings at One57 caused significantprice gains on the West Side. Resaleprice per square foot was up 15% and16% respectively for condos and co-ops.
Midtown
Median Midtown resale price was up just 1% versus last year for both condos and co-ops. Smaller units saw higher resale growth in Midtown this quarter; studiossaw the biggest gains by unit size in both submarkets. New developments south of 57th Street were very limited.
Financial District and Battery Park City
There were few new development sales inthe Financial District / Battery Park Citythis quarter. Resale condos showed strongannual growth with an 18% increase inaverage price per square foot and a 24%increase in median price.
Market Trends
The Manhattan market shows stability withoverall strong but steady price gains in allbedroom types and within most submarkets. New developments showed very significant price increases. Resale co-ops showed price gains in nearly all bedroom types and submarkets. Resale condo prices showed more volatility but overall exhibited positive year-over-year trends.
Downtown
The Downtown resale marketshowed strong growth in most unit types. Resale co-ops saw
an 8% gain in average price per square foot while resale condos saw a 10% gain. In both resale
submarkets one and two bedroom units saw the largest annual gains.
East Side
The East Side had another very strong quarter, doubling its median
new development price since last year. A higher proportion of three-plus bedrooms sold this
quarter versus last year, partially contributing to median price gains.
Uptown
Resale co-op price per squarefoot was up 11% versus last year
and resale condo price per squarefoot was up 21%. An increase in
closings of small units and units inWashington Heights brought down
the new development averages,however median prices withinbedroom categories increased.
Interactive map online at
propertyshark.com/maps
PropertyShark.com’s map of
Manhattan plots sales in the
Fourth Quarter according
to their numbers and their
prices per square foot.
Number of unit sales per building:
Above 20 Units
10 to 20 Units
3 to 9 Units
1 to 2 Units
Average unit sales per square foot (SF):
Above $2,500 SF
$2,000 - $2,500 SF
$1,500 - $2,000 SF
$1,250 - $1,500 SF
$1,000 - $1,250 SF
$750 - $1,000 SF
$500 - $750 SF
Below $500 SF
No SF Available
The Manhattan Residential Sales Market Report is based on data collected by The Corcoran Group from internal and external resources including the public records
of the City of New York. The Corcoran Group and Citi Habitats are a licensed real estate brokers owned and operated by NRT LLC. Equal Housing Opportunity. Real
estate agents afliated with Citi Habitats are independent contractor sales associates and are not employees of Citi Habitats. Citi Habitats is a licensed real estate
broker located at 250 Park Avenue South, NY, NY 10003.

citihabitats.com | 3
Manhattan Residential Sales Market Report
Third Quarter 2014
CITI HABITATS
5,000
4,000
3,000
2,000
1,000
0
Q4‘09
Q1‘10
Q2‘10
Q3‘10
Q4‘10
Q1‘11
Q2‘11
Q3‘11
Q4‘11
Q1‘12
Q2‘12
Q3‘12
Q4‘12
Q1‘13
Q2‘13
Q3‘13
Q4‘13
Q1‘14
Q2‘14
Q3’14
Closed Sales Average
MANHATTAN MARKET WIDESales - Closings
There were 4,293 closed sales during Third Quarter 2014, the second highest number of closings in over 5 years. This quarter saw 10% fewer sales year-over-year, but Third Quarter 2013 was the highest quarter for closings since before the downturn. Compared to last quarter sales are up 1%.
Sales - Contracts Signed
Contract signed figures are derived from the number of listings reported as in contract during the quarter. Most of these contracts
will close eight to twelve weeks later, often in the following quarter. However, with the return of a new development pre-sale market,
contracts may close as many as three years after signing. The number of contracts signed ogers a more immediate measure of the
market. With 2,961 contracts signed, Third Quarter was down 16% versus last year. Condo units made up 46% of signed contracts and
saw a 21% year-over-year decrease while co-ops saw a 12% decrease. Contracts signed were down 24% versus last quarter, but were
just at the average of the past five years.
* Current quarter sales figures are estimated based on the number of sales as of report preparation plus the typical number of sales reported after publication.
Number of Contracts Signed
5,000
4,000
3,000
2,000
1,000
0
Q4‘09
Q1‘10
Q2‘10
Q3‘10
Q4‘10
Q1‘11
Q2‘11
Q3‘11
Q4‘11
Q1‘12
Q2‘12
Q3‘12
Q4‘12
Q1‘13
Q2‘13
Q3‘13
Q4‘13
Q1‘14
Q2‘14
Q3’14
Condo Contracts Co-op Contracts Average
Number of Closed Sales
citihabitats.com | 4
Manhattan Residential Sales Market Report
Third Quarter 2014
CITI HABITATSNumber of Listings
Q4‘08 Q1‘09 Q2‘09 Q3‘09 Q4‘09 Q1‘10 Q2‘10 Q3‘10 Q4‘10 Q1‘11 Q2‘11 Q3‘11 Q4‘11 Q1‘12 Q2‘12 Q3‘12 Q4‘12 Q1‘13 Q2‘13 Q3‘13 Q4‘13 Q1‘14 Q2‘14 Q3’14
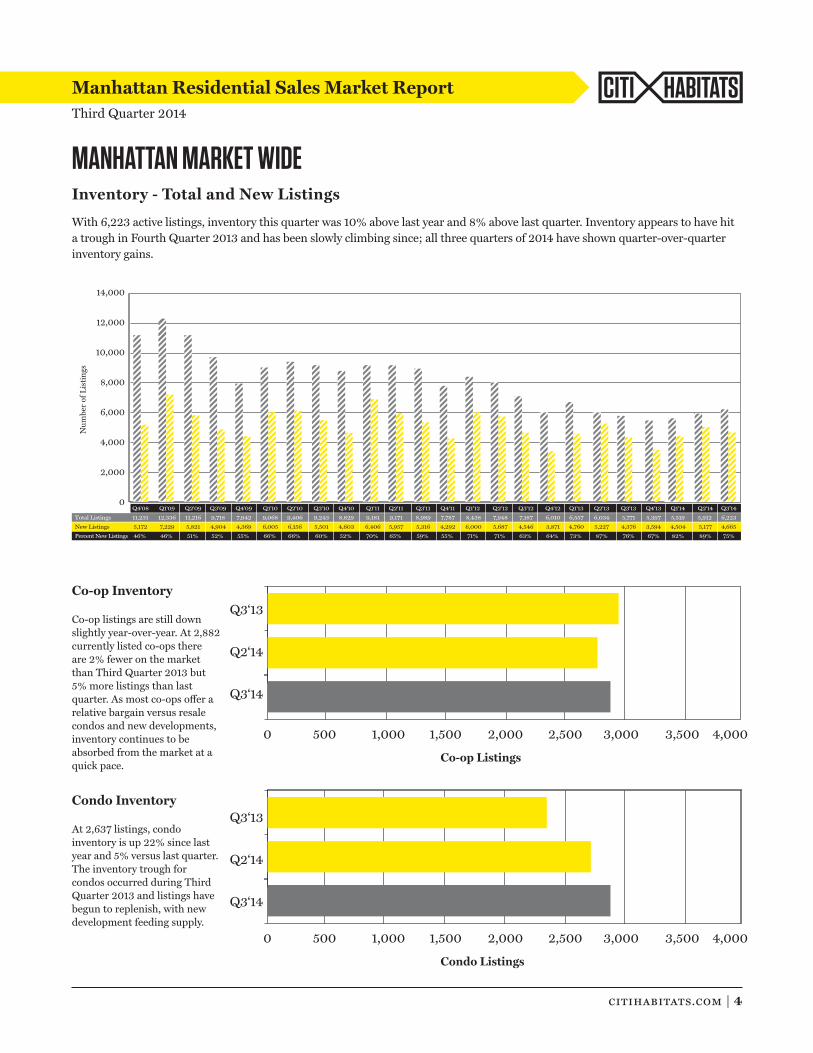
Total Listings 11,231 12,336 11,216 9,718 7,942 9,068 9,406 9,243 8,829 9,181 9,171 8,989 7,787 8,438 7,948 7,187 6,010 6,557 6,034 5,771 5,397 5,519 5,912 6,223
New Listings 5,172 7,229 5,821 4,904 4,369 6,005 6,156 5,501 4,603 6,406 5,957 5,316 4,292 6,000 5,687 4,546 3,871 4,760 5,227 4,376 3,594 4,504 5,177 4,665
Percent New Listings 46% 46% 51% 52% 55% 66% 66% 60% 52% 70% 65% 59% 55% 71% 71% 63% 64% 73% 87% 76% 67% 82% 89% 75%
Q3‘12Q3‘12
14,000
12,000
10,000
8,000
6,000
4,000
2,000
0
MANHATTAN MARKET WIDEInventory - Total and New Listings
With 6,223 active listings, inventory this quarter was 10% above last year and 8% above last quarter. Inventory appears to have hit
a trough in Fourth Quarter 2013 and has been slowly climbing since; all three quarters of 2014 have shown quarter-over-quarter
inventory gains.
Co-op Listings
Q3‘13
Q2‘14
Q3‘14
Co-op Inventory
Co-op listings are still down
slightly year-over-year. At 2,882
currently listed co-ops there
are 2% fewer on the market
than Third Quarter 2013 but
5% more listings than last
quarter. As most co-ops oger a
relative bargain versus resale
condos and new developments,
inventory continues to be
absorbed from the market at a
quick pace.
Condo Inventory
At 2,637 listings, condo
inventory is up 22% since last
year and 5% versus last quarter.
The inventory trough for
condos occurred during Third
Quarter 2013 and listings have
begun to replenish, with new
development feeding supply.
0 500 1,000 1,500 2,000 2,500 3,000 3,500 4,000
Condo Listings
0 500 1,000 1,500 2,000 2,500 3,000 3,500 4,000
Q3‘13
Q2‘14
Q3‘14

citihabitats.com | 5
Manhattan Residential Sales Market Report
Third Quarter 2014
CITI HABITATS
Neighborhood Sales Comparison Property Type Sales Comparison
Aside from a 2% market share decrease in the Financial District
and Battery Park City, all neighborhoods remained within 1% of
their market share a year ago.
Resale co-ops showed another quarter with year-over-year
growth in market-share, up from 57% in Third Quarter 2013 to
60% this quarter. New development market share shrank by 2%
while resale condo market share shrunk by 1%.
Downtown West Side East Side Midtown FD/BPC Uptown Resale Condo Resale Co-op New Development
Q3 2013 Q3 2014 Q3 2013 Q3 2014
Percent of Sales
Quarter
Q3‘14
Q2‘14
Q3‘13
*Percentages may not total 100 due to rounding.
MANHATTAN MARKET WIDE
57%
8%
35%
60%
6%
34%
8%
6%
17%
22%19%
28%
9%
4%
15%
24%19%
28%
* Percentages may not total 100 due to rounding.
19% 37% 24% 9% 6% 5%
20% 34% 24% 9% 7% 5%
20% 37% 24% 9% 6% 3%
0% 20% 40% 60% 80% 100%
15% 25% 22% 11% 11% 17%
16% 25% 21% 11% 10% 16%
19% 26% 20% 10% 9% 16%
0% 20% 40% 60% 80% 100%
Percent of Sales
Quarter
Q3‘14
Q2‘14
Q3‘13
$0-$500K $500K-$1MM $1MM-$2MM $2MM-$3MM $3MM-$5MM $5MM+
Inventory by Price Category
Inventory has shifted slightly toward
more expensive units. Units below
$1M decreased in market share
from 45% to 40% since last year.
The biggest year-over-year change
occurred in the under $500K
category, which lost 4% of market
share.
Sales by Price Category
There was slight growth in share of
sales over $5M, from 3% in Third
Quarter 2013 to 5% this quarter.
Otherwise sales this quarter have
remained similarly distributed over
the past year. Sales have skewed
toward higher prices but not to the
same extent as has inventory; 66%
of sales fell in the under $1M range,
while just 40% of inventory currently
does.

citihabitats.com | 6
Manhattan Residential Sales Market Report
Third Quarter 2014
CITI HABITATS
MANHATTAN MARKET WIDEPrices – Resale Co-ops, Resale Condos and New Developments
Market-wide average price increased 15%, year-over-year to $1.645M. Median price increased 3% to $900K, which is still below
the Second Quarter 2008 all-time high of $975K. Price per square foot continues to climb, up 12% to $1,305 market-wide.
Overall prices remained very stable since last quarter; all metrics are within 2%. Market-wide larger units are still seeing higher
price gains. Studio growth was 2% while three-plus bedrooms saw a 10% increase. The three-plus bedroom price growth is less
pronounced, however, than in past quarters and in several submarkets three+ bedroom median prices saw declines this quarter.
AverageSale Price
Median Price
Avg Priceper sf Studio 1 BR 2 BR 3+ BR
Q3 2014 1.645M 900K 1,305 444K 735K 1.427M 3.125M
Change -1% -2% 2% 2% 2% -2% 1%
Q2 2014 1.666M 919K 1,276 435K 723K 1.459M 3.100M
Q3 2014 1.645M 900K 1,305 444K 735K 1.427M 3.125M
Change 15% 3% 12% 2% 7% 6% 10%
Q3 2013 1.431M 875K 1,164 435K 685K 1.350M 2.850M
$1,200,000
$1,000,000
$800,000
$600,000
$400,000
$200,000
0
$1,300
$1,200
$1,100
$1,000
$900
$800
$700
Median Sale Price Average PPSF
Q3‘08
Q4‘08
Q1‘09
Q2‘09
Q3‘09
Q4‘09
Q1‘10
Q2‘10
Q3‘10
Q4‘10
Q1‘11
Q2‘11
Q3‘11
Q4‘11
Q1‘12
Q2‘12
Q3‘12
Q4‘12
Q1‘13
Q2‘13
Q3‘13
Q4‘13
Q1‘14
Q2‘14
Q3‘14
All Sales
Median Price
Market Wide Historical Sale Price
Median Price
Average Price Per Square Foot

citihabitats.com | 7
Manhattan Residential Sales Market Report
Third Quarter 2014
CITI HABITATS
RESALE CO-OPSResale co-ops saw another quarter with double digit gains in average
price as well as average price per square foot, up 13% and 12%
respectively, compared to last year. Median price was $715K, a 4%
gain over last year. By bedroom all unit sizes saw year-over-year
growth with one and two bedroom units both up 9%. Quarter-
over-quarter also saw positive growth in price per square foot and
average price, however median price on two and three bedrooms
fell, by 2% and 6% respectively.
Avg Sale Price
Median Price
Avg Priceper sf
Stu 1 BR 2 BR 3+ BR
Q3 2014 1.312M 715K 1,043 399K 635K 1.200M 2.498M
Change 5% -1% 5% 4% 2% -2% -6%
Q2 2014 1.244M 720K 994 385K 620K 1.225M 2.650M
Q3 2014 1.312M 715K 1,043 399K 635K 1.200M 2.498M
Change 13% 4% 12% 4% 9% 9% 6%
Q3 2013 1.158M 690K 935 385K 580K 1.100M 2.350M
$1,200
$1,100
$1,000
$900
$800
$700
$600
$500
Q3‘08
Q4‘08
Q1‘09
Q2‘09
Q3‘09
Q4‘09
Q1‘10
Q2‘10
Q3‘10
Q4‘10
Q1‘11
Q2‘11
Q3‘11
Q4‘11
Q1‘12
Q2‘12
Q3‘12
Q4‘12
Q1‘13
Q2‘13
Q3‘13
Q4‘13
Q1‘14
Q2‘14
Q3‘14
Median Sale Price Average PPSF
$900,000
$750,000
$600,000
$450,000
$300,000
$150,000
$0
Co-ops
Resale Condo Historical Sale Price
Resale Co-op Historical Sale Price
Avg Sale Price
Median Price
Avg Priceper sf
Stu 1 BR 2 BR 3+ BR
Q3 2014 1.895M 1.225M 1,464 626K 937K 1.767M 3.440M
Change -6% -6% 0% 4% 0% 0% -2%
Q2 2014 2.016M 1.300M 1,459 600K 941K 1.775M 3.495M
Q3 2014 1.895M 1.225M 1,464 626K 937K 1.767M 3.440M
Change 8% 4% 7% 8% 7% 5% 1%
Q3 2013 1.748M 1.175M 1,364 579K 875K 1.675M 3.409M
Condos
RESALE CONDOSResale condo price per square foot remained nearly unchanged
since last quarter at $1,464, which is 7% above last year’s figure.
Median price, this quarter at $1.225M, also showed an annual
gain but quarterly decline, of 4% and -6%, respectively. Smaller
units saw bigger gains in price; annually studios increased in
median price 8% while three-plus bedrooms grew by just 1%.
Versus last quarter only studios showed a median price increase.
Median Sale Price
Average Price Per Square Foot
Median Sale Price
Average Price Per Square Foot
$1,500
$1,400
$1,300
$1,200
$1,100
$1,000
$900
$800
$700
Q3‘08
Q4‘08
Q1‘09
Q2‘09
Q3‘09
Q4‘09
Q1‘10
Q2‘10
Q3‘10
Q4‘10
Q1‘11
Q2‘11
Q3‘11
Q4‘11
Q1‘12
Q2‘12
Q3‘12
Q4‘12
Q1‘13
Q2‘13
Q3‘13
Q4‘13
Q1‘14
Q2‘14
Q3‘14
Median Sale Price Average PPSF
$1,600,000
$1,400,000
$1,200,000
$1,000,000
$800,000
$600,000
$400,000
$200,000
$0
Median Price
Median Price

citihabitats.com | 8
Manhattan Residential Sales Market Report
Third Quarter 2014
CITI HABITATS
AverageSale Price
Median Price
Avg Priceper sf Studio 1 BR 2 BR 3+ BR
Q3 2014 3.652M 1.721M 1,847 825K 935K 2.037M 7.419M
Change 2% -7% 0% 55% -20% 2% 88%
Q2 2014 3.587M 1.847M 1,855 531K 1.173M 1.997M 3.948M
Q3 2014 3.652M 1.721M 1,847 825K 935K 2.037M 7.419M
Change 77% 26% 30% 27% 10% 3% 106%
Q3 2013 2.060M 1.367M 1,418 650K 850K 1.972M 3.600M
Market wide
Median Price
Demand for new development continues to support increasingly high quality product and the associated year-over-year price growth.
The new development market saw pricing remain nearly level since last quarter but versus last year average price increased 77%, price
per square foot increased 30%, and median price increased 26%, to $1.721M. Versus last quarter average price increased 2%, median
decreased 7% and price per square foot remained level. New developments skewed larger again this quarter; 25% of all new development
sales this quarter were in three-plus bedrooms compared to just 15% of the market overall. While all unit types showed annual median
price gains, again the largest growth among new development units occurred in one bedroom and three bedroom-plus units.
New Developments
$2,000,000
$1,800,000
$1,600,000
$1,400,000
$1,200,000
$1,000,000
$800,000
$600,000
$400,000
$200,000
$0
$2,000
$1,850
$1,700
$1,550
$1,400
$1,250
$1,100
$950
$800
$650
$500
Median Sale Price Average PPSF
Q3‘08
Q4‘08
Q1‘09
Q2‘09
Q3‘09
Q4‘09
Q1‘10
Q2‘10
Q3‘10
Q4‘10
Q1‘11
Q2‘11
Q3‘11
Q4‘11
Q1‘12
Q2‘12
Q3‘12
Q4‘12
Q1‘13
Q2‘13
Q3‘13
Q4‘13
Q1‘14
Q2‘14
Q3‘14
Historical New Development Sale Price
Sale Price
Price Per Square Foot
citihabitats.com | 9
Manhattan Residential Sales Market Report
Third Quarter 2014
CITI HABITATS
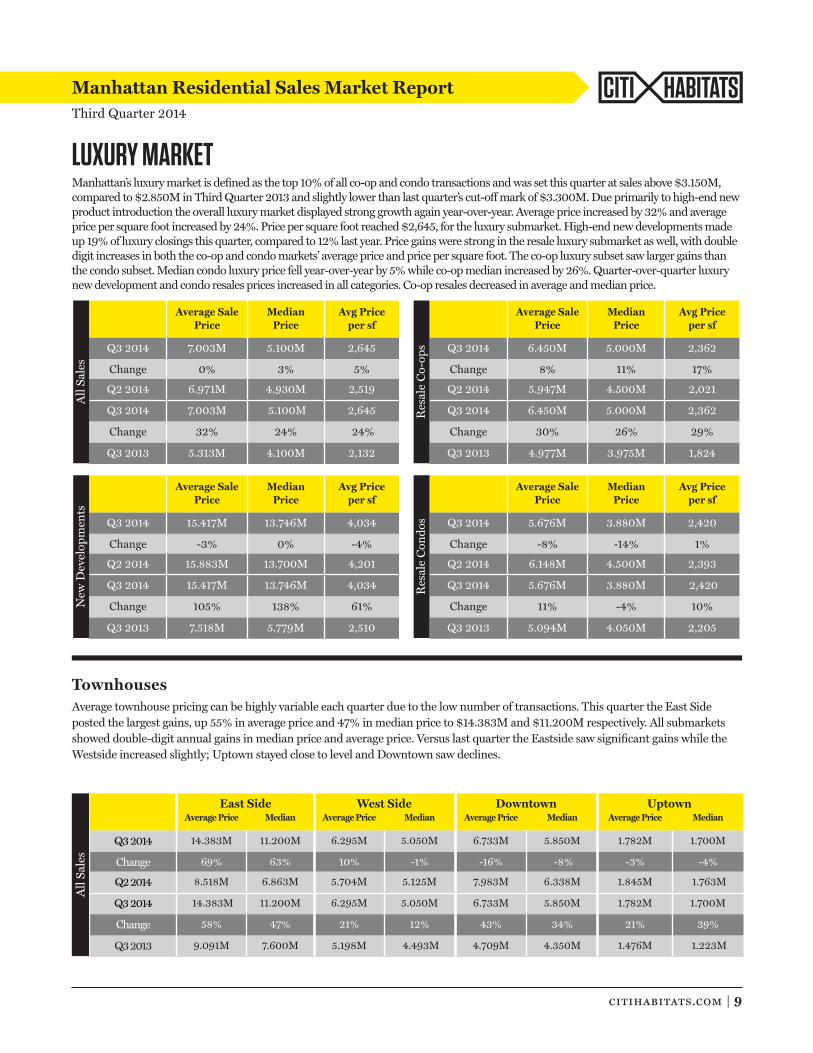
LUXURY MARKETManhattan’s luxury market is defined as the top 10% of all co-op and condo transactions and was set this quarter at sales above $3.150M, compared to $2.850M in Third Quarter 2013 and slightly lower than last quarter’s cut-og mark of $3.300M. Due primarily to high-end new product introduction the overall luxury market displayed strong growth again year-over-year. Average price increased by 32% and average price per square foot increased by 24%. Price per square foot reached $2,645, for the luxury submarket. High-end new developments made up 19% of luxury closings this quarter, compared to 12% last year. Price gains were strong in the resale luxury submarket as well, with double digit increases in both the co-op and condo markets’ average price and price per square foot. The co-op luxury subset saw larger gains than the condo subset. Median condo luxury price fell year-over-year by 5% while co-op median increased by 26%. Quarter-over-quarter luxury new development and condo resales prices increased in all categories. Co-op resales decreased in average and median price.
Average Sale
Price
Median
Price
Avg Price
per sf
Q3 2014 7.003M 5.100M 2,645
Change 0% 3% 5%
Q2 2014 6.971M 4.930M 2,519
Q3 2014 7.003M 5.100M 2,645
Change 32% 24% 24%
Q3 2013 5.313M 4.100M 2,132
All Sales
Average Sale
Price
Median
Price
Avg Price
per sf
Q3 2014 6.450M 5.000M 2,362
Change 8% 11% 17%
Q2 2014 5.947M 4.500M 2,021
Q3 2014 6.450M 5.000M 2,362
Change 30% 26% 29%
Q3 2013 4.977M 3.975M 1,824
Resale Co-ops
Average Sale
Price
Median
Price
Avg Price
per sf
Q3 2014 15.417M 13.746M 4,034
Change -3% 0% -4%
Q2 2014 15.883M 13.700M 4,201
Q3 2014 15.417M 13.746M 4,034
Change 105% 138% 61%
Q3 2013 7.518M 5.779M 2,510
New Developments
Average Sale
Price
Median
Price
Avg Price
per sf
Q3 2014 5.676M 3.880M 2,420
Change -8% -14% 1%
Q2 2014 6.148M 4.500M 2,393
Q3 2014 5.676M 3.880M 2,420
Change 11% -4% 10%
Q3 2013 5.094M 4.050M 2,205
Resale Condos
Townhouses
Average townhouse pricing can be highly variable each quarter due to the low number of transactions. This quarter the East Side
posted the largest gains, up 55% in average price and 47% in median price to $14.383M and $11.200M respectively. All submarkets
showed double-digit annual gains in median price and average price. Versus last quarter the Eastside saw significant gains while the
Westside increased slightly; Uptown stayed close to level and Downtown saw declines.
Average Price Median Average Price Median Average Price Median Average Price Median
Q3 2014 14.383M 11.200M 6.295M 5.050M 6.733M 5.850M 1.782M 1.700M
Change 69% 63% 10% -1% -16% -8% -3% -4%
Q2 2014 8.518M 6.863M 5.704M 5.125M 7.983M 6.338M 1.845M 1.763M
Q3 2014 14.383M 11.200M 6.295M 5.050M 6.733M 5.850M 1.782M 1.700M
Change 58% 47% 21% 12% 43% 34% 21% 39%
Q3 2013 9.091M 7.600M 5.198M 4.493M 4.709M 4.350M 1.476M 1.223M
All Sales
East Side West Side Downtown Uptown

citihabitats.com | 10
Manhattan Residential Sales Market Report
Third Quarter 2014
CITI HABITATS
EAST SIDEResale Co-ops
East Side co-op prices increased compared to last year and last quarter.
Median price was up 8% from Third Quarter 2013 and 3% from Second
Quarter 2014. All bedroom categories saw annual gains in median price,
except for three bedrooms. One and two bedroom units increased by 11%
and 13% respectively year-over-year while studios grew by 9%. Average
price per square foot of $1,096 was a 16% gain versus last year and up 8%
versus last quarter.
Median
Price
Avg Price
per sf Stu 1 BR 2 BR 3+ BR
Q3 2014 875K 1,096 360K 599K 1.345M 2.915M
Change 3% 8% 7% 0% 0% -4%
Q2 2014 849K 1,015 335K 600K 1.350M 3.025M
Q3 2014 875K 1,096 360K 599K 1.345M 2.915M
Change 8% 16% 9% 11% 13% -3%
Q3 2013 811K 944 330K 539K 1.195M 2.995M
Co-ops
Median Price
Median PriceMedian
Price
Avg Price
per sf Stu 1 BR 2 BR 3+ BR
Q3 2014 1.125M 1,392 481K 885K 1.589M 2.990M
Change -15% 0% -12% 18% -2% -13%
Q2 2014 1.323M 1,388 545K 750K 1.625M 3.450M
Q3 2014 1.125M 1,392 481K 885K 1.589M 2.990M
Change -8% 1% -12% 14% -2% -17%
Q3 2013 1.225M 1,376 548K 775K 1.560M 3.613M
Condos
Median Price
Above $2,500 SF
$2,000 - $2,500 SF
$1,500 - $2,000 SF
$1,250 - $1,500 SF
$1,000 - $1,250 SF
$750 - $1,000 SF
$500 - $750 SF
Below $500 SF
No SF Available
Average sales per square foot (SF):
Above 20 Units
10 to 20 Units
3 to 9 Units
1 to 2 Units
Number of sales per building:
Interactive map online at Property shark.com/maps
New Developments
Due to sales in several high-end buildings such as The Marquand,
the East Side saw very large median price and price per square
foot increases. Median price rose from $2.334M to $4.491M, a 112%
increase. Price per square foot reached $2,383, the second highest
new development price per square foot among the submarkets. One
and three-plus bedroom units saw gains of over 100% in median
and price per square foot versus last year.
Resale CondosResale condos showed a 1% increase year-over-year in price per square foot
but a 8% decline in median price. The decline is due to an increase in
market share of small unit sales this quarter. One bedrooms had the
only median price increase, up 14%. Three-plus bedroom units saw a
17% decline in median price. Compared to last quarter, the East Side
saw a 15% decline in median price but no change in average price per
square foot.
Median PriceMedian
Price
Avg Price
per sf Stu 1 BR 2 BR 3+ BR
Q3 2014 4.491M 2,383 N/A 1.769M 3.300M 9.000M
Change 21% 0% N/A 25% 3% 16%
Q2 2014 4.075M 2,376 N/A 1.420M 3.207M 7.751M
Q3 2014 4.491M 2,383 N/A 1.769M 3.300M 9.000M
Change 112% 47% N/A 113% 38% 121%
Q3 2013 2.334M 1,615 682K 832K 2.398M 4.068M
New Developments
Median Price

citihabitats.com | 11
Manhattan Residential Sales Market Report
Third Quarter 2014
CITI HABITATS
WEST SIDEResale Co-ops
Third Quarter 2014 median price was similar to the median a year ago
but average price per square foot grew 16%. Compared to last quarter,
median price was up 3% and price per foot gained 5%. Larger West
Side units had bigger year-over-year median price increases with the
three-plus bedroom median price up 29% to $2.875M. The trend is less
pronounced quarter-over-quarter.
Median
Price
Avg Price
per sf Stu 1 BR 2 BR 3+ BR
Q3 2014 901K 1,214 395K 682K 1.450M 2.875M
Change 3% 5% -1% 8% 6% 5%
Q2 2014 875K 1,153 400K 630K 1.368M 2.727M
Q3 2014 901K 1,214 395K 682K 1.450M 2.875M
Change 1% 16% 0% 10% 21% 29%
Q3 2013 895M 1,049 395K 620K 1.200M 2.225M
Co-ops
Median Price
Median PriceMedian
Price
Avg Price
per sf Stu 1 BR 2 BR 3+ BR
Q3 2014 1.446K 1,779 677K 933K 1.819M 3.593M
Change 11% 3% 8% -5% -5% -3%
Q2 2014 1.286M 1,688 630K 985K 1.925M 3.675M
Q3 2014 1.446K 1,779 677K 933K 1.819M 3.593M
Change 5% 15% 11% 1% 1% 6%
Q3 2013 1.382M 1,545 612K 921K 1.800M 3.375M
Condos
Median Price
Above $2,500 SF
$2,000 - $2,500 SF
$1,500 - $2,000 SF
$1,250 - $1,500 SF
$1,000 - $1,250 SF
$750 - $1,000 SF
$500 - $750 SF
Below $500 SF
No SF Available
Average sales per square foot (SF):
Above 20 Units
10 to 20 Units
3 to 9 Units
1 to 2 Units
Number of sales per building:
Interactive map online at Property shark.com/maps
New Developments
The majority of West Side new development closings this quarter
occurred at Mirabeau, a conversion at 165 West 91st Street, but the
prices of the relatively small number of sales were most agected
by closings at the super-luxury building One57, which drove large
average increases. Average price per square foot increased 46%
year-over-year, to $2,393, however this figure represents a 9%
decline from last quarter, when there were significantly more sales
at One57.
Resale Condos
Resale condos had significant year-over-year price growth. Median price
increased 5% to $1.446M and average price increased 15% to $1,779 per
square foot. Studios showed the largest price gains versus last year and
last quarter, increasing to $677K. Relative to last quarter, median price
increased 11% and average price per square foot increased 3%.
Median PriceMedian
Price
Avg Price
per sf Stu 1 BR 2 BR 3+ BR
Q3 2014 2.600M 2,393 N/A 1.125M 1.721M 7.764M
Change -11% -9% N/A -10% -58% 163%
Q2 2014 2.909M 2,644 N/A 1.246M 4.061M 2.953M
Q3 2014 2.600M 2,393 N/A 1.125M 1.721M 7.764M
Change -8% 46% N/A N/A -18% 142%
Q3 2013 2.838M 1,644 N/A N/A 2.100M 3.210M
New Developments
Median Price
2.600M
-11% -9%
2.909M
2.600M
-8% 46%
2.838M

citihabitats.com | 12
Manhattan Residential Sales Market Report
Third Quarter 2014
CITI HABITATS
MIDTOWN
Median
Price
Avg Price
per sf Stu 1 BR 2 BR 3+ BR
Q3 2014 595K 862 375K 586K 1.100M 2.000M
Change -4% 3% 4% 0% 5% 9%
Q2 2014 620K 839 360K 588K 1.050M 1.838M
Q32014 595K 862 375K 586K 1.100M 2.000M
Change 1% 7% 18% 9% 10% 6%
Q3 2013 588K 807 319K 540K 1.000M 1.895M
Co-ops
Median Price Median PriceMedian
Price
Avg Price
per sf Stu 1 BR 2 BR 3+ BR
Q3 2014 955K 1,302 605K 900K 1.643M 2.238M
Change -25% -11% 7% -18% -6% -40%
Q2 2014 1.273M 1,459 565K 1.098M 1.750M 3.740M
Q3 2014 955K 1,802 605K 900K 1.643M 2.238M
Change 1% 1% 13% 2% 9% -14%
Q3 2013 950K 1,291 535K 880K 1.503M 2.595M
Condos
Median Price
Above $2,500 SF
$2,000 - $2,500 SF
$1,500 - $2,000 SF
$1,250 - $1,500 SF
$1,000 - $1,250 SF
$750 - $1,000 SF
$500 - $750 SF
Below $500 SF
No SF Available
Average sales per square foot (SF):
Above 20 Units
10 to 20 Units
3 to 9 Units
1 to 2 Units
Number of sales per building:
Interactive map online at Property shark.com/maps
New Developments
There are very few new developments currently closing residencesin Midtown south of 57th Street. There were not enough closingsthis quarter to draw any meaningful conclusions.
Resale Condos
The Midtown resale condo market showed level prices with an annual
1% increase in both median price and average price per square foot.
Compared to last quarter median price was down 25% while average price
per square foot was down 11%. By unit size, studios saw the largest year-
over-year median price increase at 13% while three-plus bedroom units
declined by 14% versus last year.
Median PriceMedian
Price
Avg Price
per sf Stu 1 BR 2 BR 3+ BR
Q3 2014 N/A N/A N/A N/A N/A N/A
Change N/A N/A N/A N/A N/A N/A
Q2 2014 N/A 997 N/A 835K N/A N/A
Q3 2014 N/A N/A N/A N/A N/A N/A
Change N/A N/A N/A N/A N/A N/A
Q3 2013 2.668M 1,768 N/A 1.950M 2.927M 2.967M
New Developments
Median Price
Resale Co-ops
While strong overall, the resale co-op market in Midtown is one of the
submarkets that showed larger price gains among smaller units; studios
grew 18% in median price year-over-year while three-plus bedrooms
grew 6%. Versus last quarter median price decreased 4%, but average
price per square foot increased 3%. Annual gains were 1% in median and
7% in average price per square foot.

citihabitats.com | 13
Manhattan Residential Sales Market Report
Third Quarter 2014
CITI HABITATS
DOWNTOWNResale Co-ops
Downtown co-op resales showed consistent growth, with a 5% increase
in median price and an 8% increase in average price per square foot.
All unit types saw annual gains in median price but compared to last
quarter three-plus bedrooms saw an 8% decline and one bedrooms
saw a 1% decline.
Median Price
Above $2,500 SF
$2,000 - $2,500 SF
$1,500 - $2,000 SF
$1,250 - $1,500 SF
$1,000 - $1,250 SF
$750 - $1,000 SF
$500 - $750 SF
Below $500 SF
No SF Available
Average sales per square foot (SF):
Above 20 Units
10 to 20 Units
3 to 9 Units
1 to 2 Units
Number of sales per building:
Interactive map online at Property shark.com/maps
New Developments
The new development market Downtown saw some price declines
compared to last year as well as last quarter. Year-over-year median
price is down 28%, but average price per square foot is up 3% to
$1,829. Several high priced sales at One Madison and Walker Tower
helped buoy these figures but the majority of new development sales
downtown were in less expensive buildings. Versus last quarter,
median is down 22% and price per square foot declined 6%.
Resale Condos
Year-over-year average price of Downtown resale condos increased 10% to
$1,707 per square foot. The median price of $1.770M, up 2% since last
year, was again the highest median resale condo price in the city. One
and two bedroom units saw price gains, up 20% and 24% year-over-
year, while studio and three-plus bedroom units declined in median
price by 2% and 4% respectively.
Median PriceMedian
Price
Avg Price
per sf Stu 1 BR 2 BR 3+ BR
Q3 2014 1.450M 1,829 868K 1.153M 2.140M 7.419M
Change -22% -6% 10% -7% 0% -26%
Q2 2014 1.857M 1,951 789K 1.238M 2.151M 10.000M
Q3 2014 1.450M 1,829 868K 1.153M 2.140M 7.419M
Change -28% 3% 1% 2% -6% 61%
Q3 2013 2.000M 1,778 861K 1.130M 2.273M 4.622M
New Developments
Median Price
Median
Price
Avg Price
per sf Stu 1 BR 2 BR 3+ BR
Q3 2014 735K 1,143 466K 715K 1.525M 2.650M
Change 1% 6% 8% -1% 17% -8%
Q2 2014 730K 1,080 434K 720K 1.300M 2.878M
Q3 2014 735K 1,143 466K 715K 1.525M 2.650M
Change 5% 8% 3% 6% 5% 4%
Q3 2013 700K 1,060 453K 675K 1.448M 2.545M
Co-ops
Median Price
Median PriceMedian
Price
Avg Price
per sf Stu 1 BR 2 BR 3+ BR
Q3 2014 1.770M 1,707 689K 1.270M 2.1633M 4.065M
Change -4% 1% -5% -6% 13% -18%
Q2 2014 1.850M 1.692 734K 1.348M 2.325M 4.930M
Q3 2014 1.770M 1,707 689K 1.270M 2.1633M 4.065M
Change 2% 10% -2% 20% 24% -4%
Q3 2013 1.733M 1,549 705K 1.055M 2.126M 4.250M
Condos
Median Price
4.065M
-18%
4.930M
4.065M
-4%
4.250M

citihabitats.com | 14
Manhattan Residential Sales Market Report
Third Quarter 2014
CITI HABITATS
FINANCIAL DISTRICT AND BATTERY PARK CITYResale Condos
Resale condos in the Financial District and Battery Park City experienced strong year-over-year growth with a 24% and 18% increase in median price
and average price per square foot respectively. Versus last quarter, median price increased 14% to $1.070M. The submarket showed annual gains in all
unit sizes except two bedrooms.
Median PriceMedian
Price
Avg Price
per sf Stu 1 BR 2 BR 3+ BR
Q3 2014 1.070M 1,189 690K 910K 1.310M 2.668M
Change 14% 4% 17% 16% -10% 3%
Q2 2014 935K 1,139 592K 786K 1.450M 2.600M
Q3 2014 1.070M 1,189 690K 910K 1.310M 2.668M
Change 24% 18% 24% 18% -3% 27%
Q3 2013 865K 1,009 555K 770K 1.350M 2.100M
Condos
Median Price
Above $2,500 SF
$2,000 - $2,500 SF
$1,500 - $2,000 SF
$1,250 - $1,500 SF
$1,000 - $1,250 SF
$750 - $1,000 SF
$500 - $750 SF
Below $500 SF
No SF Available
Average sales per square foot (SF):
Above 20 Units
10 to 20 Units
3 to 9 Units
1 to 2 Units
Number of sales per building:
Interactive map online at Property shark.com/maps
New Developments
New Developments in the Financial District and Battery Park City
submarket were very limited this quarter, making it difcult to
draw market-wide conclusions. Median sale price increased by
16% compared to the sales during Third Quarter 2013 and was
down 5% versus last year. Price per square foot was level with last
year’s figure.
Resale Co-ops
There is very limited cooperative inventory in the Financial District
and Battery Park City, and as a result there was not a statistically
significant number of sales to draw any meaningful conclusions.
Median PriceMedian
Price
Avg Price
per sf Stu 1 BR 2 BR 3+ BR
Q3 2014 950K 1,170 N/A N/A N/A N/A
Change -5% -14% N/A N/A N/A N/A
Q2 2014 997K 1,357 667K 975K 1.998M N/A
Q3 2014 950K 1,170 N/A N/A N/A N/A
Change 16% 0% N/A N/A N/A N/A
Q3 2013 822K 1,169 596K 794K 1.436M 2.393M
New Developments
Median Price

citihabitats.com | 15
Manhattan Residential Sales Market Report
Third Quarter 2014
CITI HABITATS
UPTOWNResale Co-ops
Resale co-ops showed strong growth with a 21% increase in average price per square
foot versus last year. Larger units saw greater gains with a 17% rise in three+ bedroom
median price year-over-year.
Median
Price
Avg Price
per sf Stu 1 BR 2 BR 3+ BR
Q3 2014 396K 592 205K 330K 529K 780K
Change -2% 22% 3% 3% 11% 30%
Q2 2014 405K 487 200K 319K 475K 600K
Q3 2014 396K 592 205K 330K 529K 780K
Change 10% 21% -5% 11% 13% 17%
Q3 2013 360K 488 216K 299K 470K 665K
Co-ops
Median Price
Median Price
Median
Price
Avg Price
per sf Stu 1 BR 2 BR 3+ BR
Q3 2014 650K 717 N/A 459K 650K 1.548M
Change 11% 5% N/A 14% 0% 38%
Q2 2014 585K 683 315K 402K 652K 1.123M
Q3 2014 650K 717 N/A 459K 650K 1.548M
Change 17% 11% N/A -2% 5% 72%
Q3 2013 555K 647 425K 467K 618K 900K
Condos
Median Price
Above $2,500 SF
$2,000 - $2,500 SF
$1,500 - $2,000 SF
$1,250 - $1,500 SF
$1,000 - $1,250 SF
$750 - $1,000 SF
$500 - $750 SF
Below $500 SF
No SF Available
Average sales per square foot (SF):
Above 20 Units
10 to 20 Units
3 to 9 Units
1 to 2 Units
Number of sales per building:
Interactive map online at Property shark.com/maps
New Developments
The Uptown market has very diverse new development product that
can often skew comparisons. The proportion of all sales Uptown
that were new developments shrank since last year. This quarter
median price was $520K and average price per square foot was $725,
representing a decrease of 5% and 4% respectively from Third Quarter
2013. Nearly half of all Uptown new development closings this quarter
were at Edgecombe Parc, a condo in Washington Heights. Last
year there was a higher volume of closings in Southern Harlem and
Morningside Heights.
Resale Condos
Uptown resale condo price showed annual growth in two and three-plus bedroom units.
Three-plus bedrooms saw a 72% gain in median price, up to $1.548M. One bedroom
units saw a slight decline in median price versus last year but was up 14% versus last
quarter. Prices often show more volatility in this submarket as condo inventory Uptown
has historically been limited.
Median PriceMedian
Price
Avg Price
per sf Stu 1 BR 2 BR 3+ BR
Q3 2014 520K 725 N/A 418K 668K N/A
Change -27% -8% N/A -17% -13% N/A
Q2 2014 717K 785 207K 501K 771K 1.146M
Q3 2014 520K 725 N/A 418K 668K N/A
Change -5% -4% N/A 19% 6% N/A
Q3 2013 550K 753 422K 350K 633K 1.785M
New Developments
Median Price