Embed Size (px)
Citation preview
Relocation Information & Assistance 800.747.9962 cbsuccess.com/relocation
Home Sales Report March 2016
April 12, 2016
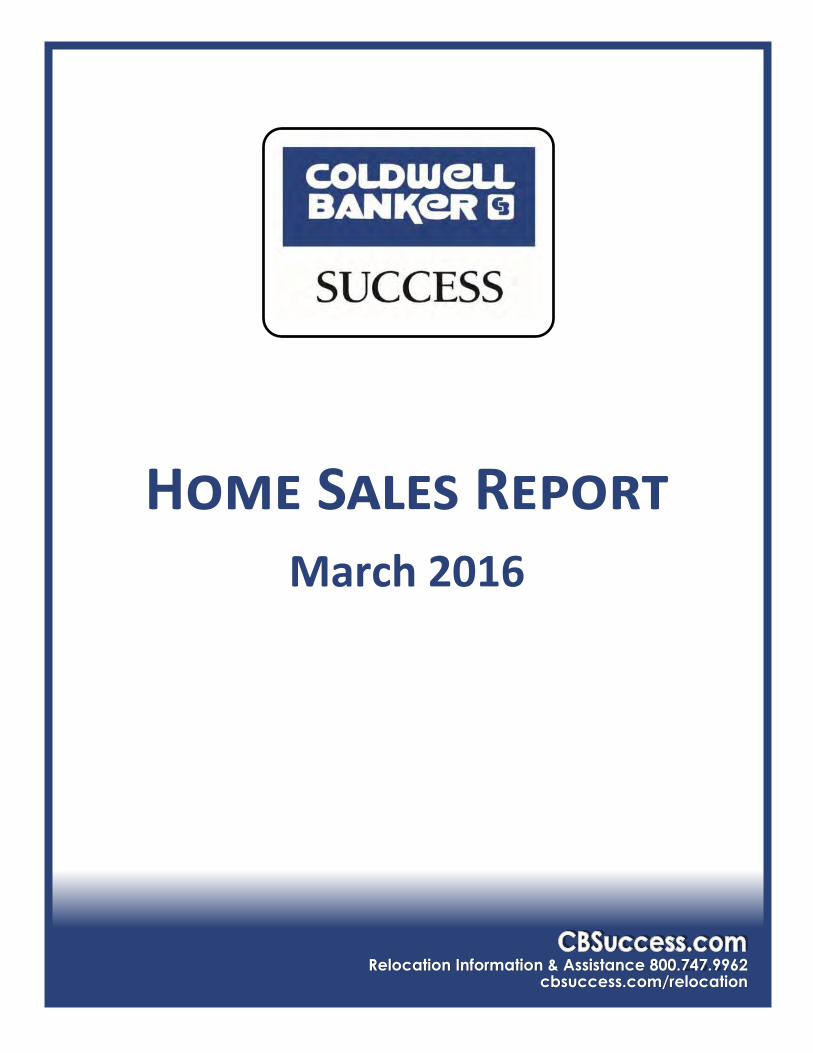
First Quarter Housing Market: Sales and Prices Up
The first quarter of 2016 finished with both home sales and median prices higher than one year ago. For Dane County, sales are 1.5% ahead of 2015 (which ended the year as the second best ever for home sales). For the balance of the SCWMLS Region* (excluding Dane County), sales increased 4.6%.
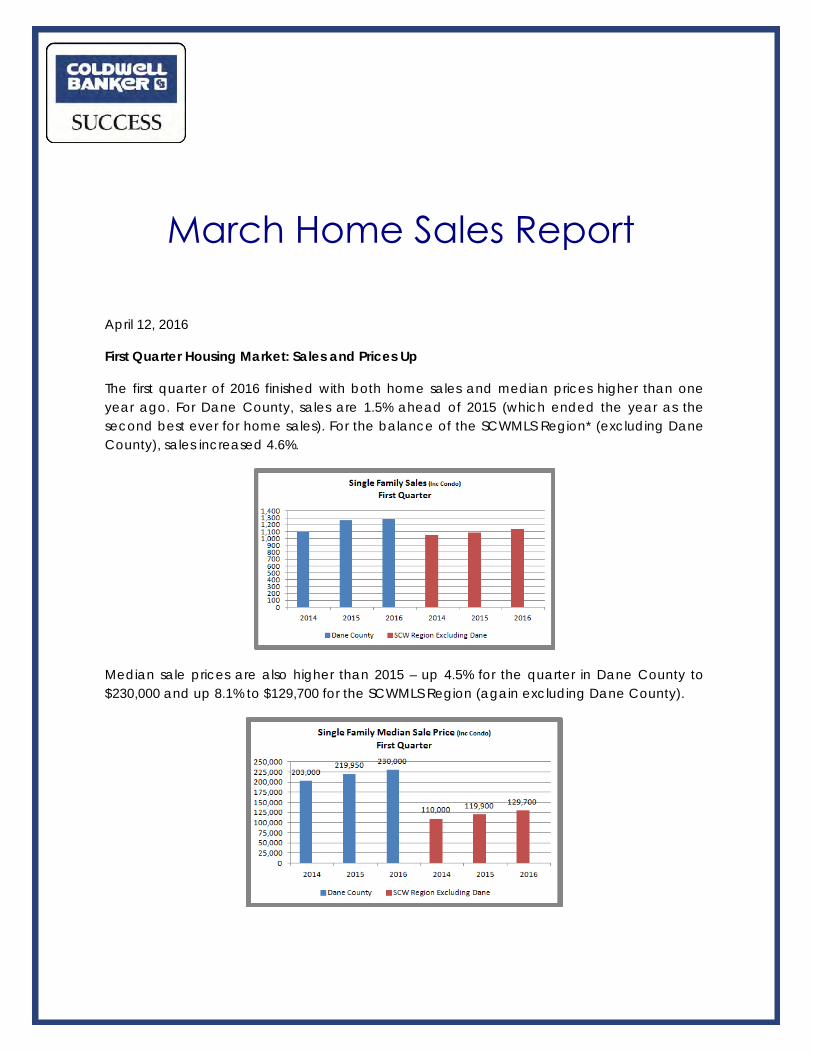
Median sale prices are also higher than 2015 – up 4.5% for the quarter in Dane County to $230,000 and up 8.1% to $129,700 for the SCWMLS Region (again excluding Dane County).
March Home Sales Report
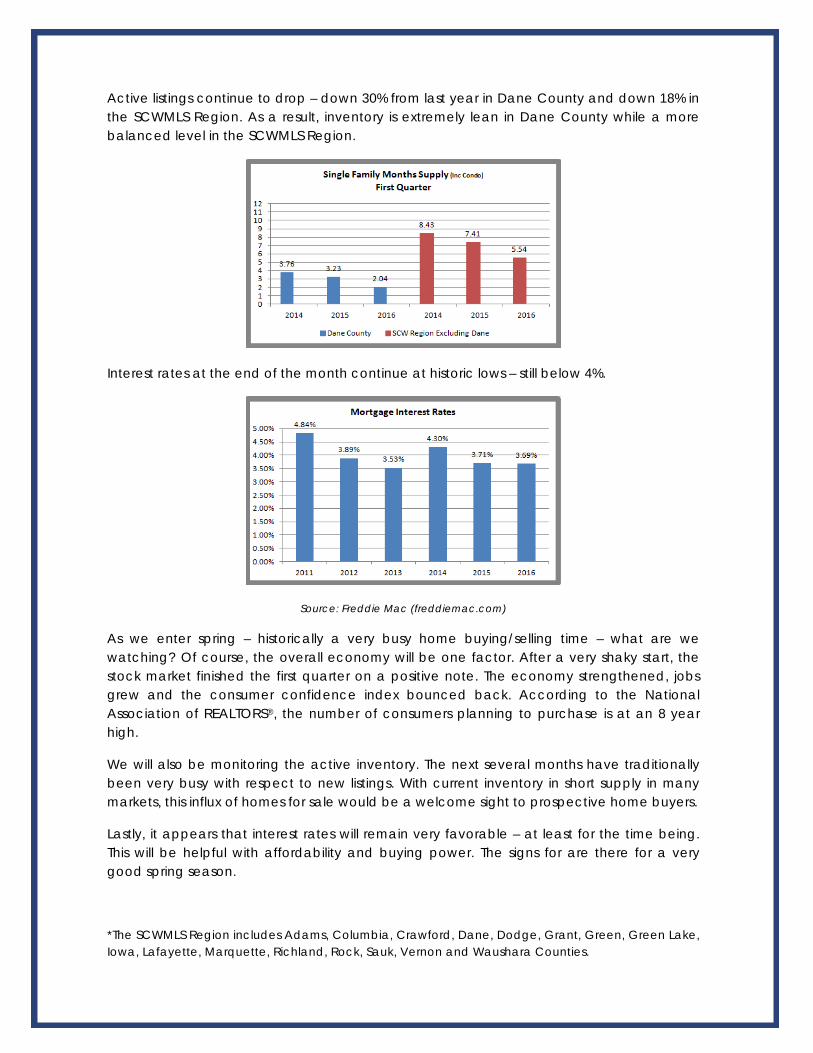
Active listings continue to drop – down 30% from last year in Dane County and down 18% in the SCWMLS Region. As a result, inventory is extremely lean in Dane County while a more balanced level in the SCWMLS Region.
Interest rates at the end of the month continue at historic lows – still below 4%.
Source: Freddie Mac (freddiemac.com)
As we enter spring – historically a very busy home buying/selling time – what are we watching? Of course, the overall economy will be one factor. After a very shaky start, the stock market finished the first quarter on a positive note. The economy strengthened, jobs grew and the consumer confidence index bounced back. According to the National Association of REALTORS®, the number of consumers planning to purchase is at an 8 year high.
We will also be monitoring the active inventory. The next several months have traditionally been very busy with respect to new listings. With current inventory in short supply in many markets, this influx of homes for sale would be a welcome sight to prospective home buyers.
Lastly, it appears that interest rates will remain very favorable – at least for the time being. This will be helpful with affordability and buying power. The signs for are there for a very good spring season.
*The SCWMLS Region includes Adams, Columbia, Crawford, Dane, Dodge, Grant, Green, Green Lake,Iowa, Lafayette, Marquette, Richland, Rock, Sauk, Vernon and Waushara Counties.
2016 2015 2014 2016 2014 2013138 140 113 270 287 26365 57 46 135 123 120
181,777 153,365 173,207 177,925 160,488 150,567170,000 124,700 134,450 163,000 139,900 127,250
331 402 469 331 402 469
2016 2015 2014 2016 2015 2014997 1,096 965 2,416 2,454 2,314598 591 488 1,284 1,264 1,099
260,299 255,100 233,683 263,686 250,877 232,158230,000 222,000 207,000 230,000 219,950 203,000
1,354 1,927 2,304 1,354 1,927 2,304
2016 2015 2014 2016 2015 2014298 285 249 617 650 594141 182 147 356 373 342
135,060 133,917 109,208 132,305 124,531 112,237124,000 124,000 105,000 124,250 115,000 100,000
545 714 854 545 714 854 Total # Active Residential Listings at end of Period
ROCK COUNTY # New Listings # Sales Average Sale Price Median Sale Price
DANE COUNTY
Total # Active Residential Listings at end of Period
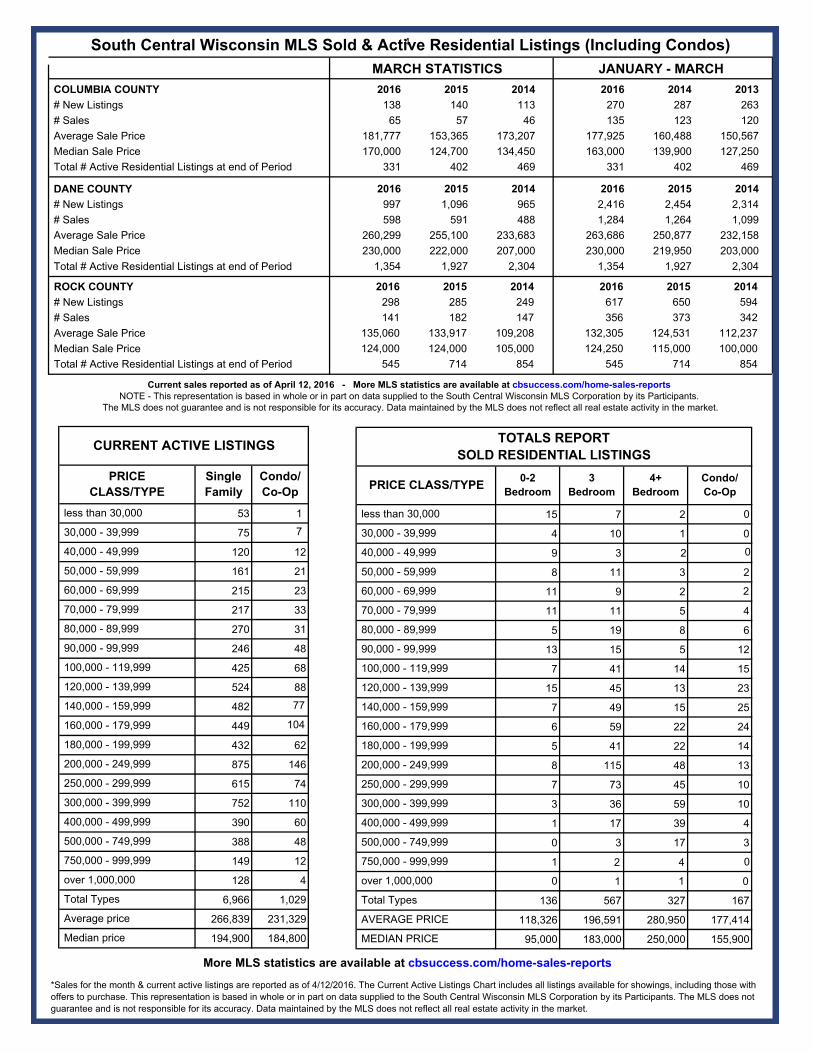
Current sales reported as of April 12, 2016 - More MLS statistics are available at cbsuccess.com/home-sales-reportsNOTE - This representation is based in whole or in part on data supplied to the South Central Wisconsin MLS Corporation by its Participants.
The MLS does not guarantee and is not responsible for its accuracy. Data maintained by the MLS does not reflect all real estate activity in the market.
Total # Active Residential Listings at end of Period
MARCH STATISTICS JANUARY - MARCH COLUMBIA COUNTY # New Listings # Sales Average Sale Price Median Sale Price
# New Listings # Sales
South Central Wisconsin MLS Sold & Active Residential Listings (Including Condos)
Average Sale Price Median Sale Price
4
53 1
75 7
120 12
161 21
215 23
217 33
270 31
246 48
425 68
524 88
482 77
449 104
432 62
875 146
615 74
752 110
390 60
388 48
149 12
128 4
6,966 1,029
266,839 231,329
194,900 184,800 Median price
Single Family
CURRENT ACTIVE LISTINGS
30,000 - 39,999
40,000 - 49,999
50,000 - 59,999
60,000 - 69,999
70,000 - 79,999
80,000 - 89,999
90,000 - 99,999
100,000 - 119,999
300,000 - 399,999
400,000 - 499,999
120,000 - 139,999
140,000 - 159,999
160,000 - 179,999
180,000 - 199,999
Average price
less than 30,000
Condo/Co-Op
PRICECLASS/TYPE
500,000 - 749,999
750,000 - 999,999
over 1,000,000
Total Types
200,000 - 249,999
250,000 - 299,999
*Sales for the month & current active listings are reported as of 4/12/2016. The Current Active Listings Chart includes all listings available for showings, including those with offers to purchase. This representation is based in whole or in part on data supplied to the South Central Wisconsin MLS Corporation by its Participants. The MLS does not guarantee and is not responsible for its accuracy. Data maintained by the MLS does not reflect all real estate activity in the market.
More MLS statistics are available at cbsuccess.com/home-sales-reports
15 7 2
4 10 1 0
39
2
8 11 3 2
11 29
2
11 11 5 4
5 19 8 6
13 15 5 12
7 41 14 15
51 54 31 23
7 49 15 25
6 59 22 24
5 41 22 14
8 115 48 13
7 73 45 10
3 36 59 10
1 17 39 4
0 3 17 3
41 02
0 1 01
136 567 327 167
118,326 196,591 280,950 177,414
95,000 183,000 250,000 155,900 MEDIAN PRICE
4+Bedroom
Condo/Co-Op
AVERAGE PRICE
180,000 - 199,999
200,000 - 249,999
250,000 - 299,999
100,000 - 119,999
over 1,000,000
Total Types
0-2Bedroom
3Bedroom
300,000 - 399,999
500,000 - 749,999
750,000 - 999,999
160,000 - 179,999
400,000 - 499,999
60,000 - 69,999
70,000 - 79,999
80,000 - 89,999
90,000 - 99,999
120,000 - 139,999
140,000 - 159,999
TOTALS REPORTSOLD RESIDENTIAL LISTINGS
PRICE CLASS/TYPE
less than 30,000
30,000 - 39,999
40,000 - 49,999
50,000 - 59,999
0
0
0
100
200
300
400
500
600
700
800
900
1000
1100
1200
1300
1400
1500
1600
1700
1800
1900
2000Num
ber o
f Hom
es Sold
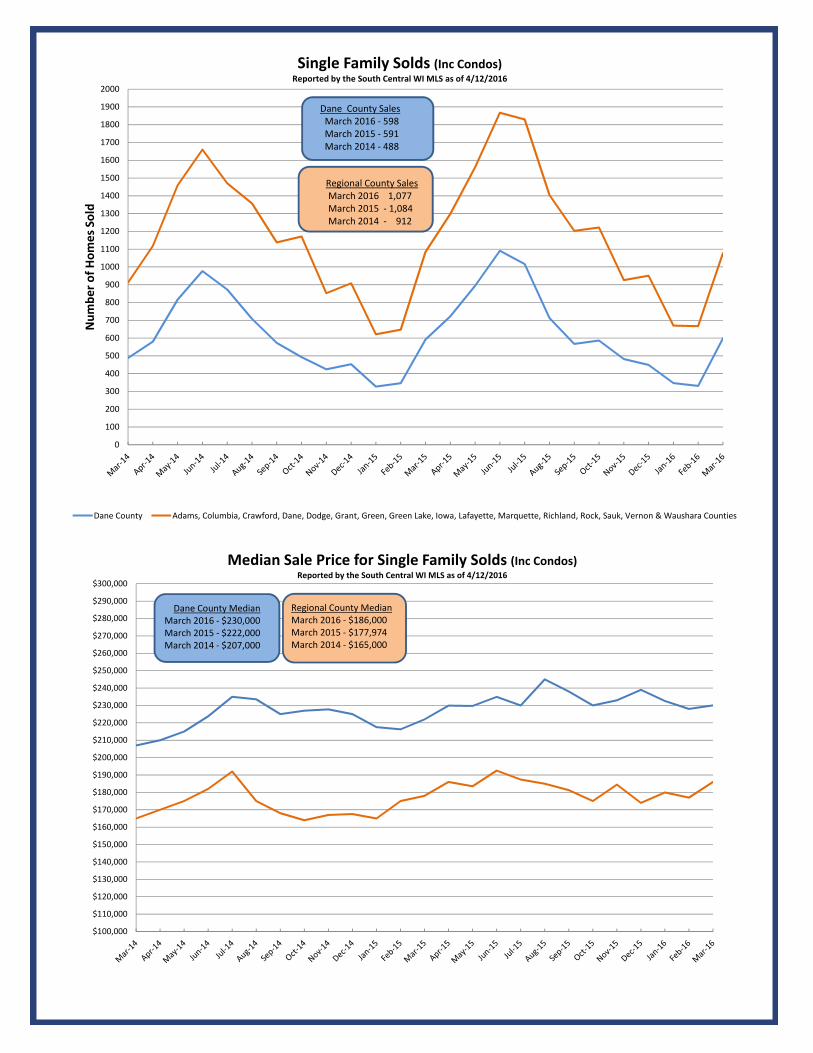
Single Family Solds (Inc Condos)Reported by the South Central WI MLS as of 4/12/2016
Dane County Adams, Columbia, Crawford, Dane, Dodge, Grant, Green, Green Lake, Iowa, Lafayette, Marquette, Richland, Rock, Sauk, Vernon & Waushara Counties
Dane County SalesMarch 2016 ‐ 598March 2015 ‐ 591 March 2014 ‐ 488
Regional County SalesMarch 2016 1,077March 2015 ‐ 1,084March 2014 ‐ 912
$100,000
$110,000
$120,000
$130,000
$140,000
$150,000
$160,000
$170,000
$180,000
$190,000
$200,000
$210,000
$220,000
$230,000
$240,000
$250,000
$260,000
$270,000
$280,000
$290,000
$300,000
Median Sale Price for Single Family Solds (Inc Condos)Reported by the South Central WI MLS as of 4/12/2016
Dane County MedianMarch 2016 ‐ $230,000March 2015 ‐ $222,000March 2014 ‐ $207,000
Regional County MedianMarch 2016 ‐ $186,000March 2015 ‐ $177,974March 2014 ‐ $165,000
1,000
1,500
2,000
2,500
3,000
3,500
4,000
4,500
5,000
5,500
6,000
6,500
7,000
7,500
8,000
8,500
9,000
9,500
10,000Num
ber o
f Active Listings
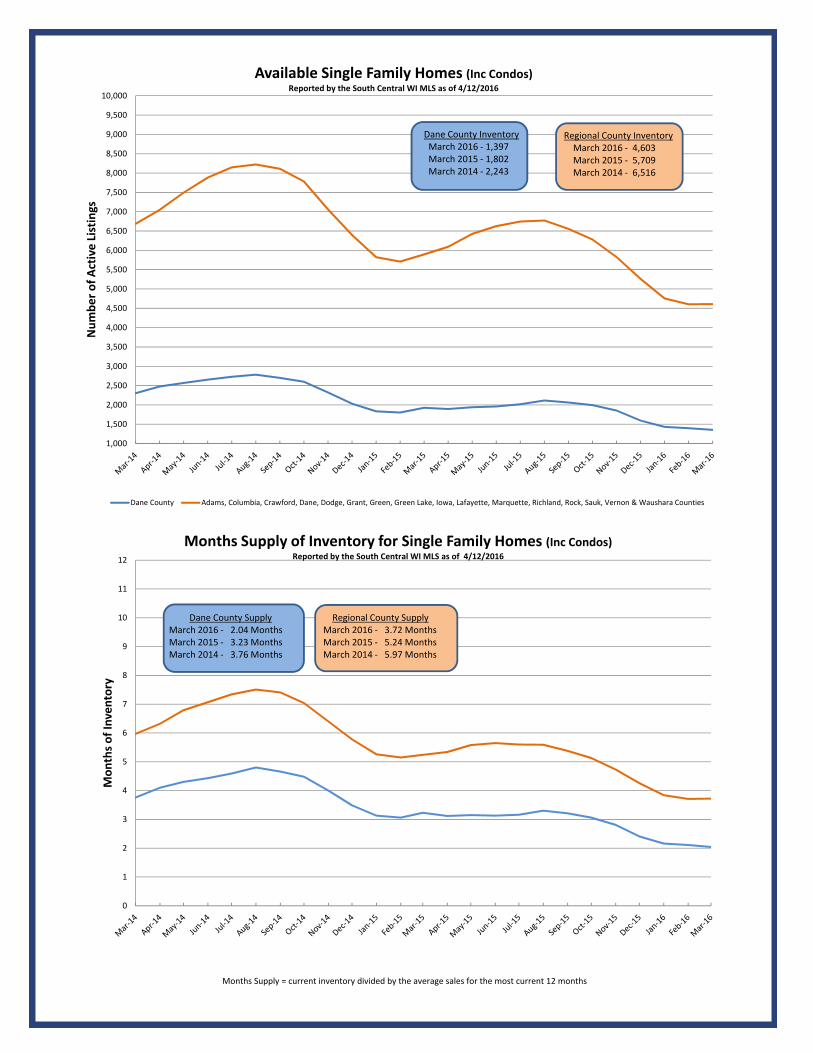
Available Single Family Homes (Inc Condos)Reported by the South Central WI MLS as of 4/12/2016
Dane County Adams, Columbia, Crawford, Dane, Dodge, Grant, Green, Green Lake, Iowa, Lafayette, Marquette, Richland, Rock, Sauk, Vernon & Waushara Counties
Dane County InventoryMarch 2016 ‐ 1,397March 2015 ‐ 1,802March 2014 ‐ 2,243
Regional County InventoryMarch 2016 ‐ 4,603March 2015 ‐ 5,709March 2014 ‐ 6,516
0
1
2
3
4
5
6
7
8
9
10
11
12
Mon
ths o
f Inven
tory
Months Supply of Inventory for Single Family Homes (Inc Condos)Reported by the South Central WI MLS as of 4/12/2016
Dane County SupplyMarch 2016 ‐ 2.04 Months March 2015 ‐ 3.23 MonthsMarch 2014 ‐ 3.76 Months
Regional County SupplyMarch 2016 ‐ 3.72 MonthsMarch 2015 ‐ 5.24 MonthsMarch 2014 ‐ 5.97 Months
Months Supply = current inventory divided by the average sales for the most current 12 months
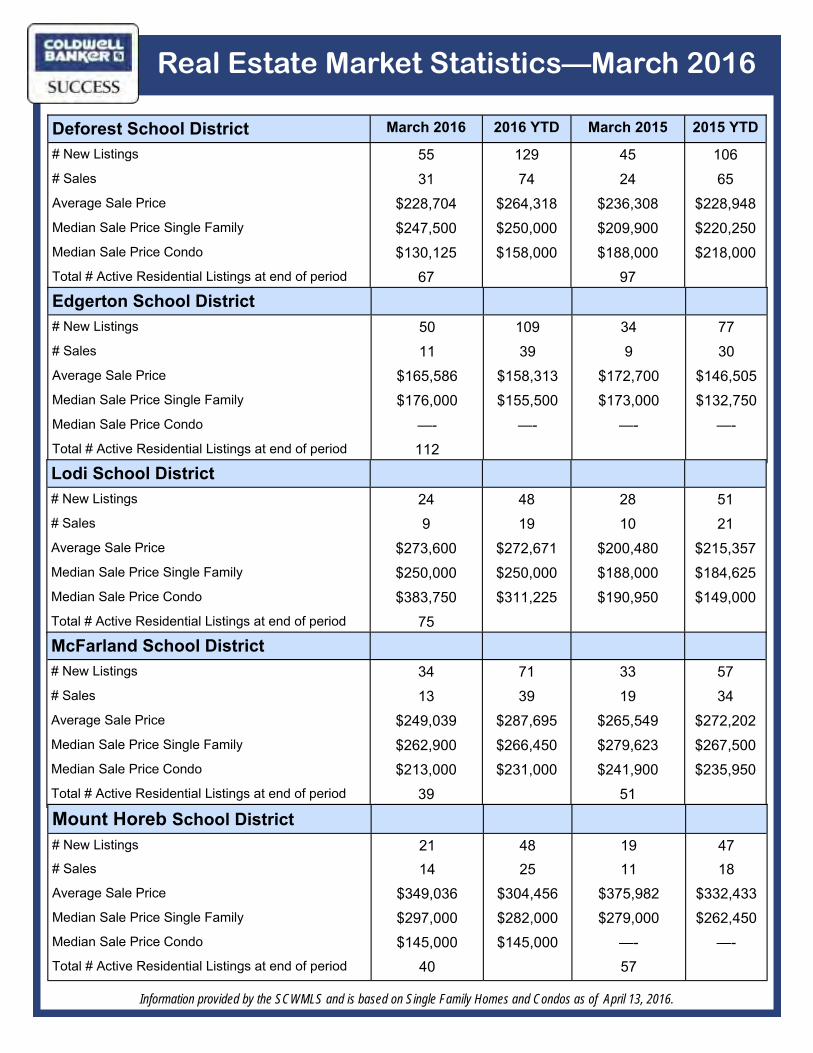
Real Estate Market Statistics—March 2016
Information provided by the SCWMLS and is based on Single Family Homes and Condos as of April 13, 2016.
Deforest School District March 2016 2016 YTD March 2015 2015 YTD
# New Listings 55 129 45 106# Sales 31 74 24 65Average Sale Price $228,704 $264,318 $236,308 $228,948Median Sale Price Single Family $247,500 $250,000 $209,900 $220,250Median Sale Price Condo $130,125 $158,000 $188,000 $218,000Total # Active Residential Listings at end of period 67 97Edgerton School District# New Listings 50 109 34 77# Sales 11 39 9 30Average Sale Price $165,586 $158,313 $172,700 $146,505Median Sale Price Single Family $176,000 $155,500 $173,000 $132,750Median Sale Price Condo —- —- —- —-Total # Active Residential Listings at end of period 112Lodi School District# New Listings 24 48 28 51# Sales 9 19 10 21Average Sale Price $273,600 $272,671 $200,480 $215,357Median Sale Price Single Family $250,000 $250,000 $188,000 $184,625Median Sale Price Condo $383,750 $311,225 $190,950 $149,000Total # Active Residential Listings at end of period 75McFarland School District# New Listings 34 71 33 57# Sales 13 39 19 34Average Sale Price $249,039 $287,695 $265,549 $272,202Median Sale Price Single Family $262,900 $266,450 $279,623 $267,500Median Sale Price Condo $213,000 $231,000 $241,900 $235,950Total # Active Residential Listings at end of period 39 51
Mount Horeb School District# New Listings 21 48 19 47# Sales 14 25 11 18Average Sale Price $349,036 $304,456 $375,982 $332,433Median Sale Price Single Family $297,000 $282,000 $279,000 $262,450Median Sale Price Condo $145,000 $145,000 —- —-Total # Active Residential Listings at end of period 40 57
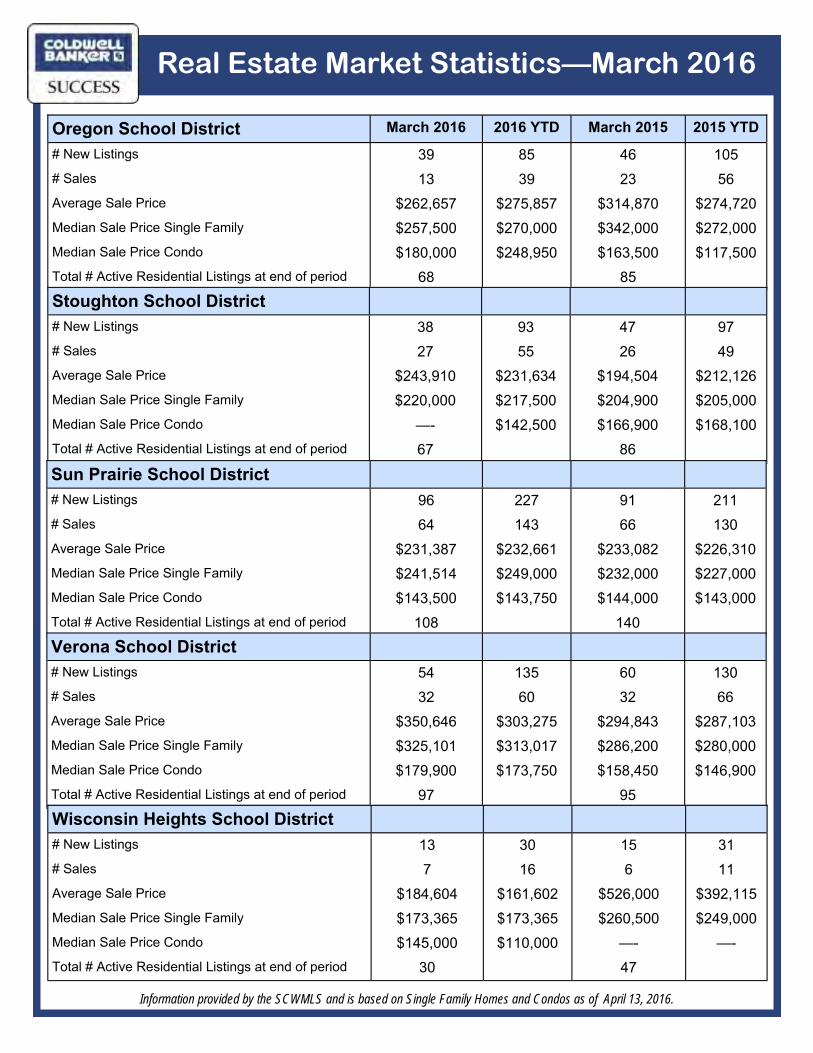
Real Estate Market Statistics—March 2016
Information provided by the SCWMLS and is based on Single Family Homes and Condos as of April 13, 2016.
Oregon School District March 2016 2016 YTD March 2015 2015 YTD
# New Listings 39 85 46 105# Sales 13 39 23 56Average Sale Price $262,657 $275,857 $314,870 $274,720Median Sale Price Single Family $257,500 $270,000 $342,000 $272,000Median Sale Price Condo $180,000 $248,950 $163,500 $117,500Total # Active Residential Listings at end of period 68 85Stoughton School District# New Listings 38 93 47 97# Sales 27 55 26 49Average Sale Price $243,910 $231,634 $194,504 $212,126Median Sale Price Single Family $220,000 $217,500 $204,900 $205,000Median Sale Price Condo —- $142,500 $166,900 $168,100Total # Active Residential Listings at end of period 67 86
Sun Prairie School District# New Listings 96 227 91 211# Sales 64 143 66 130Average Sale Price $231,387 $232,661 $233,082 $226,310Median Sale Price Single Family $241,514 $249,000 $232,000 $227,000Median Sale Price Condo $143,500 $143,750 $144,000 $143,000Total # Active Residential Listings at end of period 108 140Verona School District# New Listings 54 135 60 130# Sales 32 60 32 66Average Sale Price $350,646 $303,275 $294,843 $287,103Median Sale Price Single Family $325,101 $313,017 $286,200 $280,000Median Sale Price Condo $179,900 $173,750 $158,450 $146,900Total # Active Residential Listings at end of period 97 95Wisconsin Heights School District# New Listings 13 30 15 31# Sales 7 16 6 11Average Sale Price $184,604 $161,602 $526,000 $392,115Median Sale Price Single Family $173,365 $173,365 $260,500 $249,000Median Sale Price Condo $145,000 $110,000 —- —-Total # Active Residential Listings at end of period 30 47
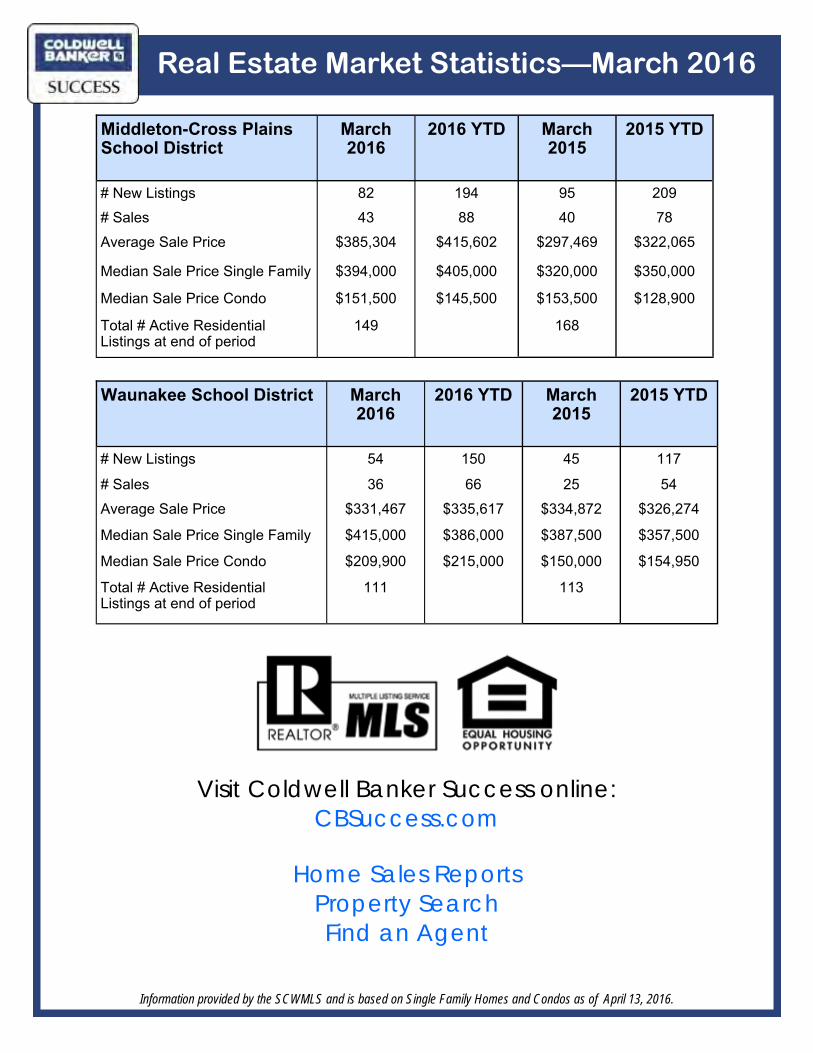
Real Estate Market Statistics—March 2016
Information provided by the SCWMLS and is based on Single Family Homes and Condos as of April 13, 2016.
Visit Coldwell Banker Success online:CBSuccess.com
Home Sales ReportsProperty SearchFind an Agent
Middleton-Cross PlainsSchool District
March 2016
2016 YTD March 2015
2015 YTD
# New Listings 82 194 95 209# Sales 43 88 40 78Average Sale Price $385,304 $415,602 $297,469 $322,065
Median Sale Price Single Family $394,000 $405,000 $320,000 $350,000
Median Sale Price Condo $151,500 $145,500 $153,500 $128,900
Total # Active Residential Listings at end of period
149 168
Waunakee School District March 2016
2016 YTD March 2015
2015 YTD
# New Listings 54 150 45 117
# Sales 36 66 25 54Average Sale Price $331,467 $335,617 $334,872 $326,274
Median Sale Price Single Family $415,000 $386,000 $387,500 $357,500
Median Sale Price Condo $209,900 $215,000 $150,000 $154,950
Total # Active Residential Listings at end of period
111 113
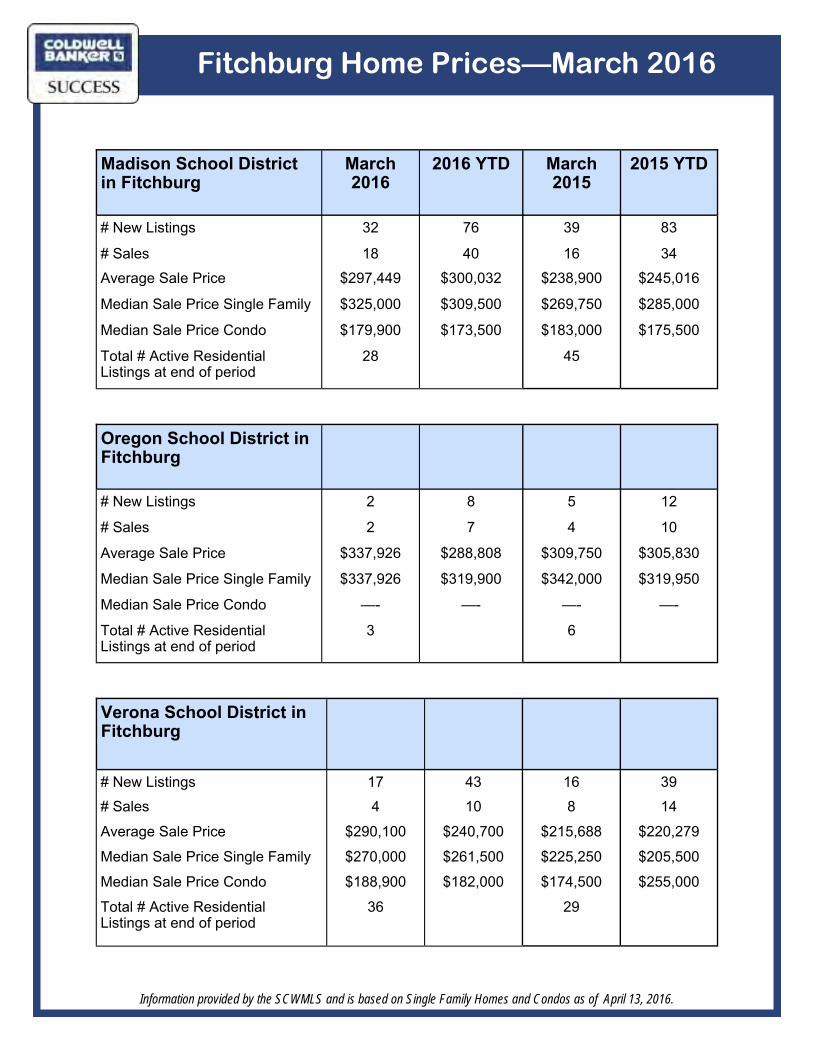
Fitchburg Home Prices—March 2016
Information provided by the SCWMLS and is based on Single Family Homes and Condos as of April 13, 2016.
Madison School District in Fitchburg
March 2016
2016 YTD March 2015
2015 YTD
# New Listings 32 76 39 83
# Sales 18 40 16 34Average Sale Price $297,449 $300,032 $238,900 $245,016
Median Sale Price Single Family $325,000 $309,500 $269,750 $285,000
Median Sale Price Condo $179,900 $173,500 $183,000 $175,500
Total # Active Residential Listings at end of period
28 45
Verona School District inFitchburg
# New Listings 17 43 16 39# Sales 4 10 8 14
Average Sale Price $290,100 $240,700 $215,688 $220,279
Median Sale Price Single Family $270,000 $261,500 $225,250 $205,500
Median Sale Price Condo $188,900 $182,000 $174,500 $255,000
Total # Active Residential Listings at end of period
36 29
Oregon School District inFitchburg
# New Listings 2 8 5 12
# Sales 2 7 4 10
Average Sale Price $337,926 $288,808 $309,750 $305,830
Median Sale Price Single Family $337,926 $319,900 $342,000 $319,950
Median Sale Price Condo —- —- —- —-
Total # Active Residential Listings at end of period
3 6
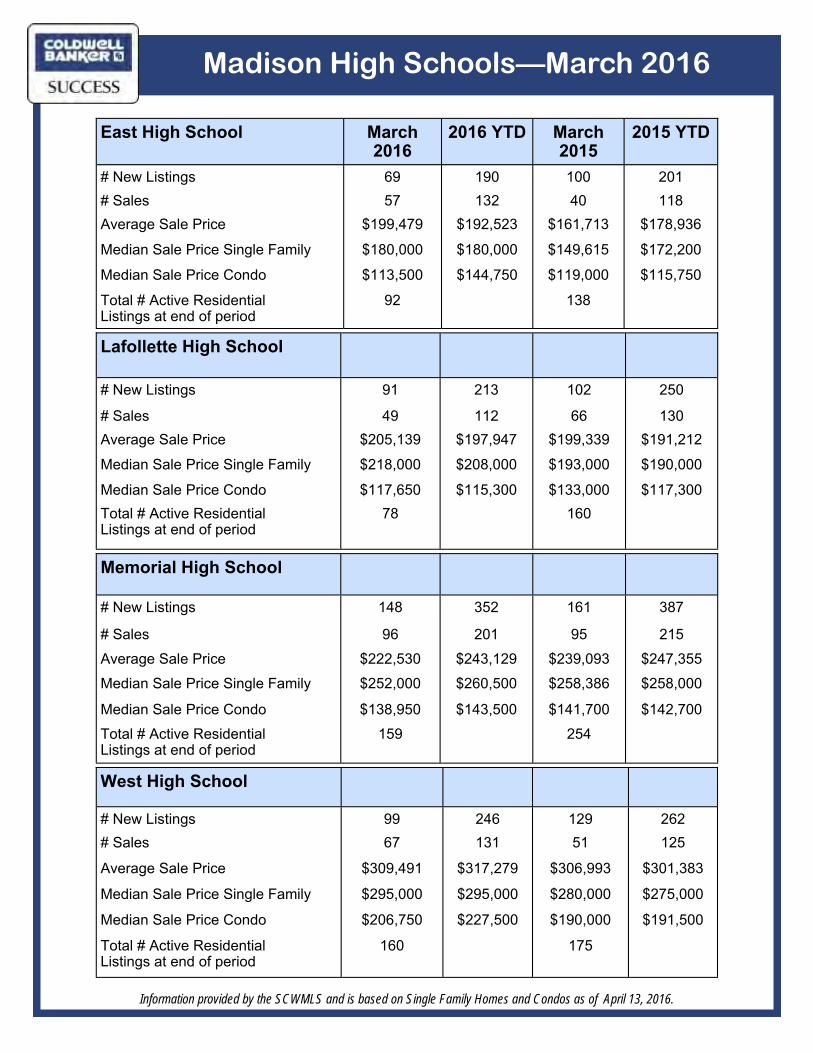
Madison High Schools—March 2016
Information provided by the SCWMLS and is based on Single Family Homes and Condos as of April 13, 2016.
Lafollette High School
# New Listings 91 213 102 250
# Sales 49 112 66 130Average Sale Price $205,139 $197,947 $199,339 $191,212
Median Sale Price Single Family $218,000 $208,000 $193,000 $190,000
Median Sale Price Condo $117,650 $115,300 $133,000 $117,300Total # Active Residential Listings at end of period
78 160
West High School
# New Listings 99 246 129 262# Sales 67 131 51 125
Average Sale Price $309,491 $317,279 $306,993 $301,383
Median Sale Price Single Family $295,000 $295,000 $280,000 $275,000
Median Sale Price Condo $206,750 $227,500 $190,000 $191,500
Total # Active Residential Listings at end of period
160 175
Memorial High School
# New Listings 148 352 161 387
# Sales 96 201 95 215Average Sale Price $222,530 $243,129 $239,093 $247,355Median Sale Price Single Family $252,000 $260,500 $258,386 $258,000
Median Sale Price Condo $138,950 $143,500 $141,700 $142,700Total # Active Residential Listings at end of period
159 254
East High School March2016
2016 YTD March2015
2015 YTD
# New Listings 69 190 100 201# Sales 57 132 40 118Average Sale Price $199,479 $192,523 $161,713 $178,936
Median Sale Price Single Family $180,000 $180,000 $149,615 $172,200
Median Sale Price Condo $113,500 $144,750 $119,000 $115,750
Total # Active Residential Listings at end of period
92 138