Embed Size (px)
Citation preview
CALGARY REGIONALHOUSING MARKET STATISTICS
CREB® Calgary Regional Housing Market Statistics Page 1
Housing sales slower than typical February
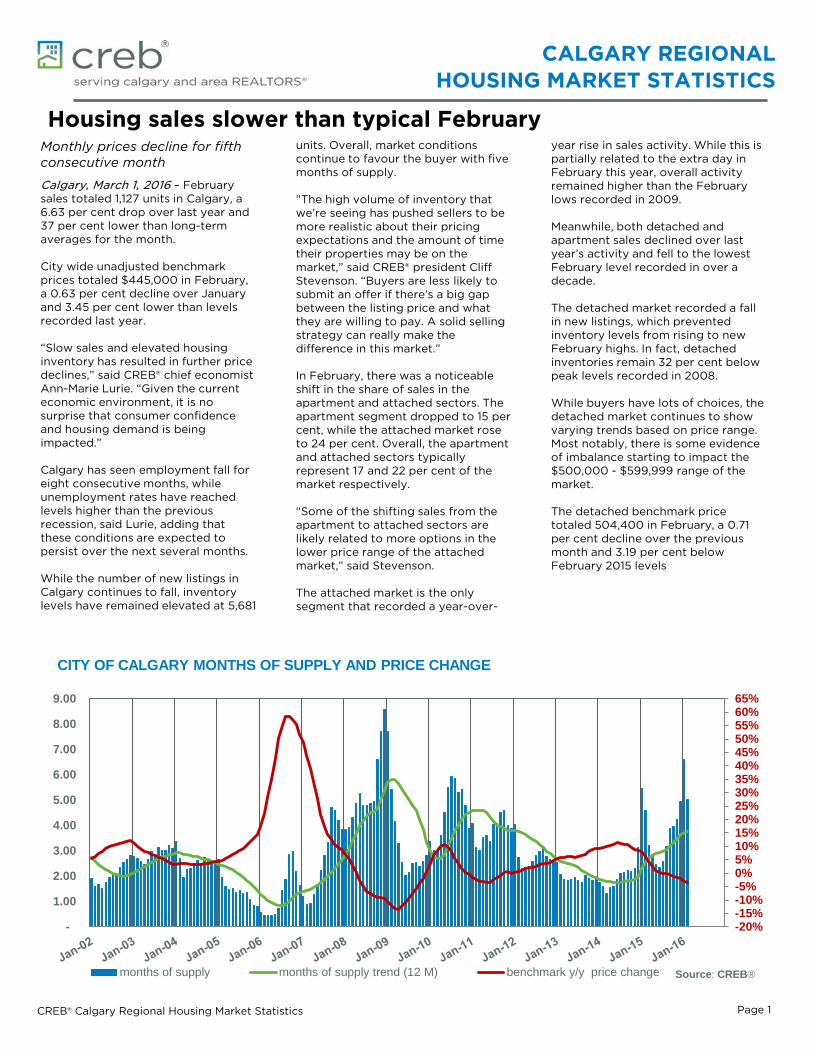
CITY OF CALGARY MONTHS OF SUPPLY AND PRICE CHANGE
-20%-15%-10%-5%0%5%10%15%20%25%30%35%40%45%50%55%60%65%
-
1.00
2.00
3.00
4.00
5.00
6.00
7.00
8.00
9.00
months of supply months of supply trend (12 M) benchmark y/y price change Source: CREB®
Monthly prices decline for fifth consecutive month
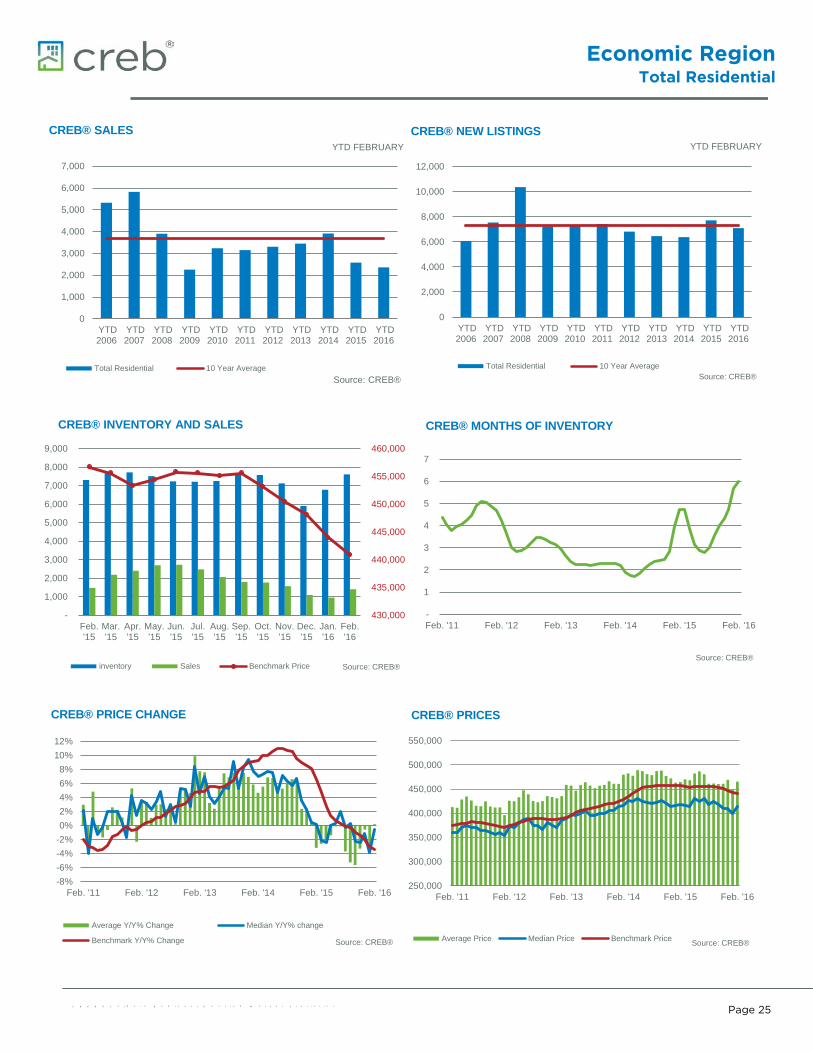
Calgary, March 1, 2016 – February sales totaled 1,127 units in Calgary, a 6.63 per cent drop over last year and 37 per cent lower than long-term averages for the month. City wide unadjusted benchmark prices totaled $445,000 in February, a 0.63 per cent decline over January and 3.45 per cent lower than levels recorded last year. “Slow sales and elevated housing inventory has resulted in further price declines,” said CREB® chief economist Ann-Marie Lurie. “Given the current economic environment, it is no surprise that consumer confidence and housing demand is being impacted.” Calgary has seen employment fall for eight consecutive months, while unemployment rates have reached levels higher than the previous recession, said Lurie, adding that these conditions are expected to persist over the next several months. While the number of new listings in Calgary continues to fall, inventory levels have remained elevated at 5,681
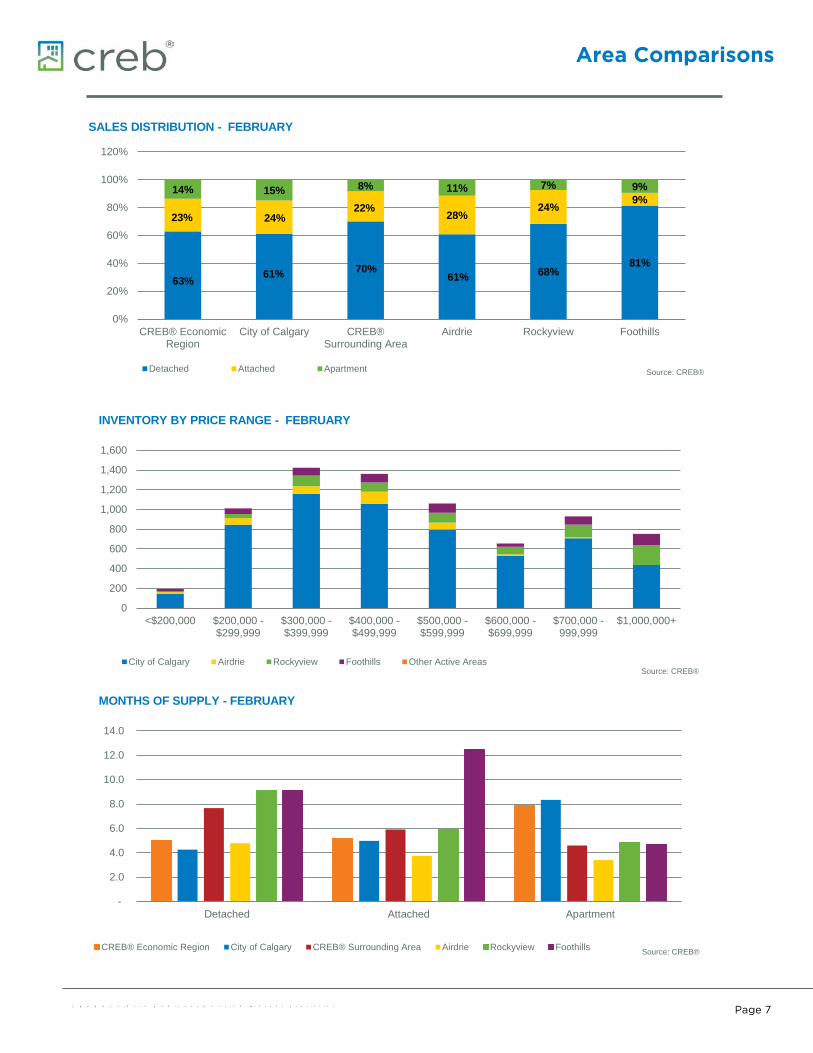
units. Overall, market conditions continue to favour the buyer with five months of supply. “The high volume of inventory that we’re seeing has pushed sellers to be more realistic about their pricing expectations and the amount of time their properties may be on the market,” said CREB® president Cliff Stevenson. “Buyers are less likely to submit an offer if there’s a big gap between the listing price and what they are willing to pay. A solid selling strategy can really make the difference in this market.” In February, there was a noticeable shift in the share of sales in the apartment and attached sectors. The apartment segment dropped to 15 per cent, while the attached market rose to 24 per cent. Overall, the apartment and attached sectors typically represent 17 and 22 per cent of the market respectively. “Some of the shifting sales from the apartment to attached sectors are likely related to more options in the lower price range of the attached market,” said Stevenson. The attached market is the only segment that recorded a year-over-
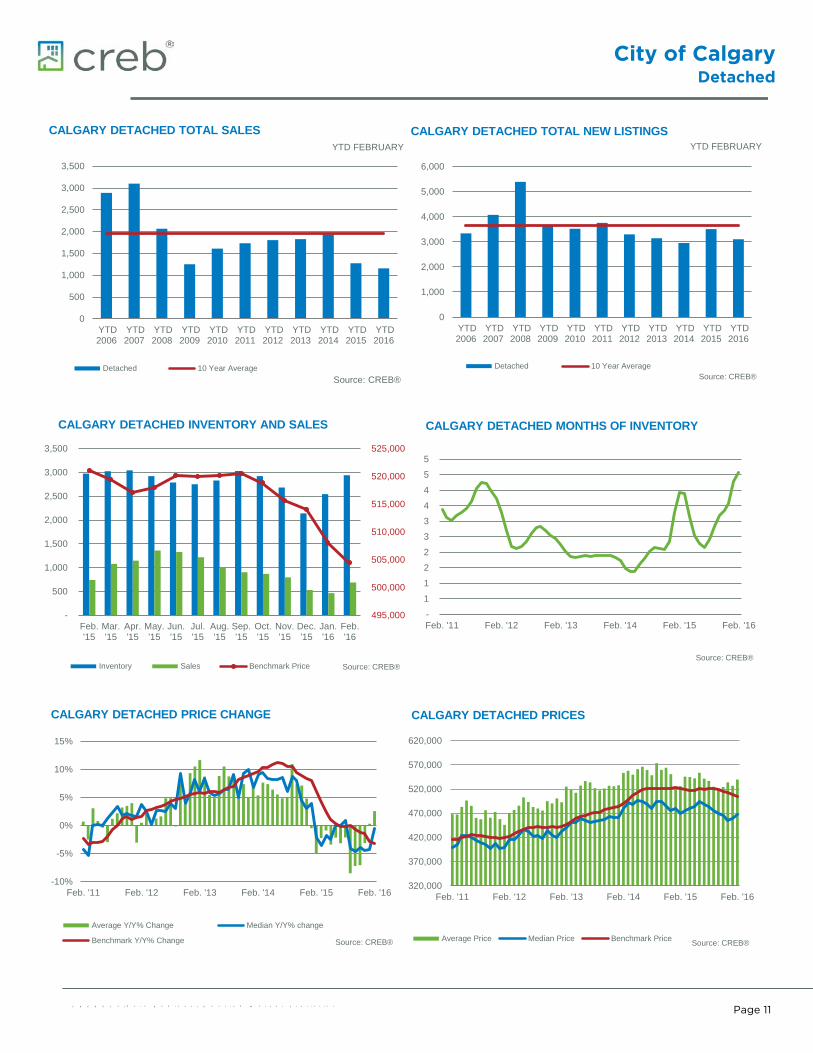
year rise in sales activity. While this is partially related to the extra day in February this year, overall activity remained higher than the February lows recorded in 2009. Meanwhile, both detached and apartment sales declined over last year’s activity and fell to the lowest February level recorded in over a decade. The detached market recorded a fall in new listings, which prevented inventory levels from rising to new February highs. In fact, detached inventories remain 32 per cent below peak levels recorded in 2008. While buyers have lots of choices, the detached market continues to show varying trends based on price range. Most notably, there is some evidence of imbalance starting to impact the $500,000 - $599,999 range of the market. The detached benchmark price totaled 504,400 in February, a 0.71 per cent decline over the previous month and 3.19 per cent below February 2015 levels
Summary Stats Economic RegionTotal Residential
C R E B ® C a l g a r y R e g i o n a l H o u s i n g M a r k e t S t a t i s t i c s
Page 2
Feb-15 Feb-16 Y/Y % Change
2015 YTD 2016 YTD Y/Y % Change
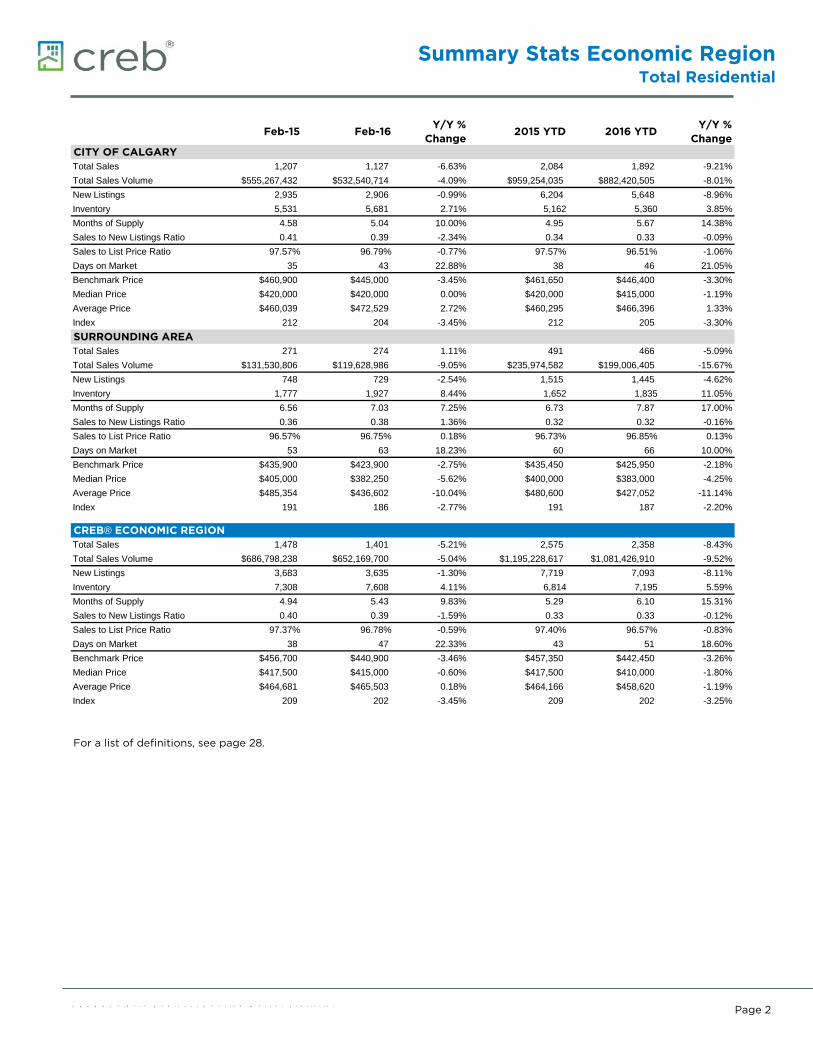
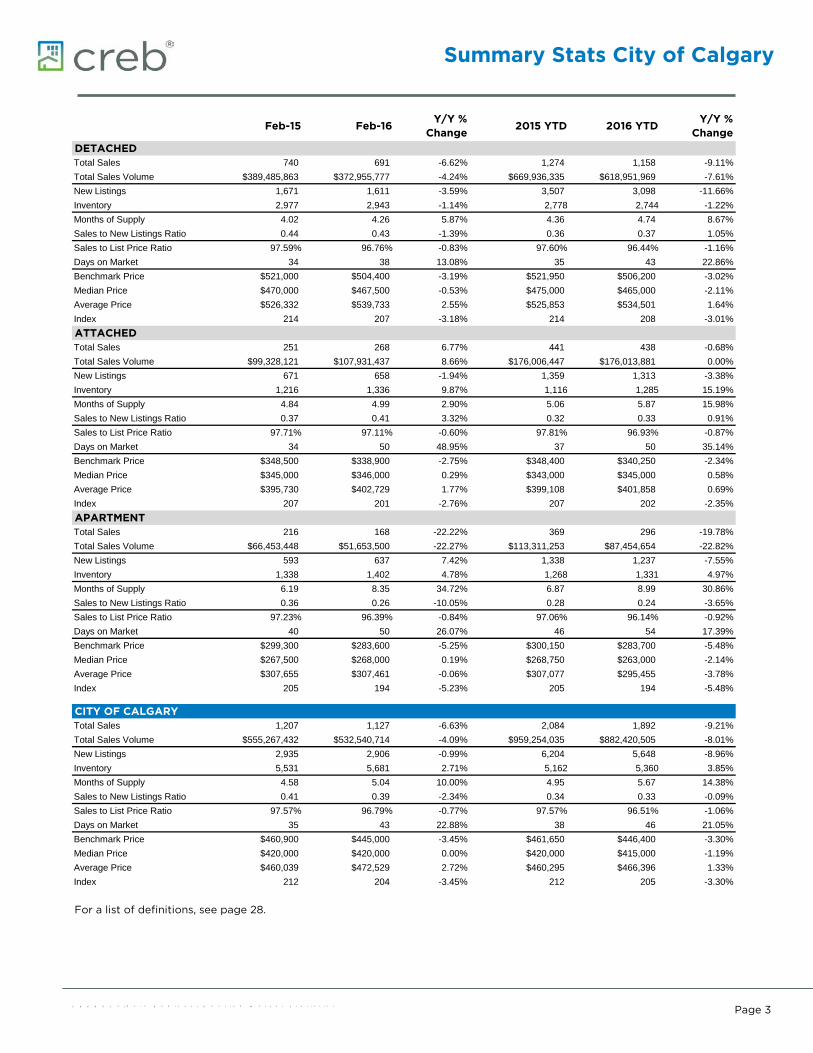
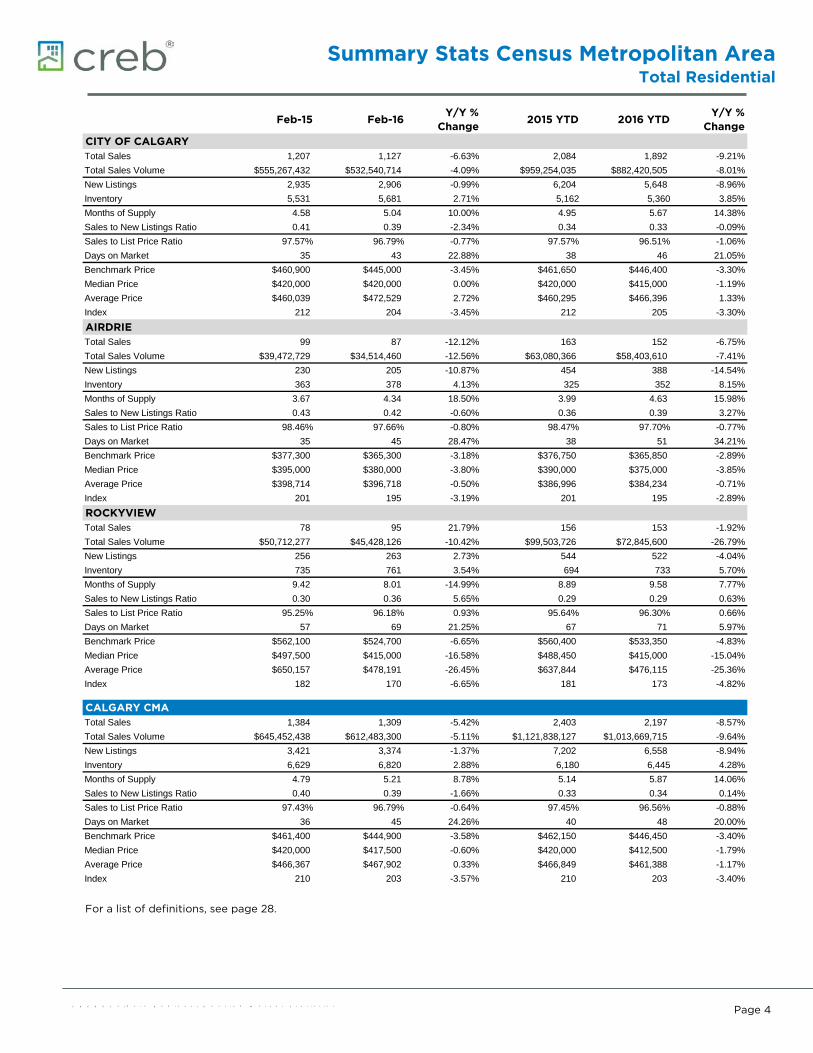
CITY OF CALGARYm_ YTTotal Sales 1,207 1,127 -6.63% 2,084 1,892 -9.21%m_ YTTotal Sales Volume $555,267,432 $532,540,714 -4.09% $959,254,035 $882,420,505 -8.01%m_ YTNew Listings 2,935 2,906 -0.99% 6,204 5,648 -8.96%m_ YTInventory 5,531 5,681 2.71% 5,162 5,360 3.85%
Months of Supply 4.58 5.04 10.00% 4.95 5.67 14.38%Sales to New Listings Ratio 0.41 0.39 -2.34% 0.34 0.33 -0.09%
m_YTSales to List Price Ratio 97.57% 96.79% -0.77% 97.57% 96.51% -1.06%m_YTDays on Market 35 43 22.88% 38 46 21.05%m_YTBenchmark Price $460,900 $445,000 -3.45% $461,650 $446,400 -3.30%m_YTMedian Price $420,000 $420,000 0.00% $420,000 $415,000 -1.19%m_YTAverage Price $460,039 $472,529 2.72% $460,295 $466,396 1.33%m_YTIndex 212 204 -3.45% 212 205 -3.30%
SURROUNDING AREAm_ YTTotal Sales 271 274 1.11% 491 466 -5.09%m_ YTTotal Sales Volume $131,530,806 $119,628,986 -9.05% $235,974,582 $199,006,405 -15.67%m_ YTNew Listings 748 729 -2.54% 1,515 1,445 -4.62%m_ YTInventory 1,777 1,927 8.44% 1,652 1,835 11.05%
Months of Supply 6.56 7.03 7.25% 6.73 7.87 17.00%Sales to New Listings Ratio 0.36 0.38 1.36% 0.32 0.32 -0.16%
m_YTSales to List Price Ratio 96.57% 96.75% 0.18% 96.73% 96.85% 0.13%m_YTDays on Market 53 63 18.23% 60 66 10.00%m_YTBenchmark Price $435,900 $423,900 -2.75% $435,450 $425,950 -2.18%m_YTMedian Price $405,000 $382,250 -5.62% $400,000 $383,000 -4.25%m_YTAverage Price $485,354 $436,602 -10.04% $480,600 $427,052 -11.14%m_YTIndex 191 186 -2.77% 191 187 -2.20%
CREB® ECONOMIC REGIONm_ YTTotal Sales 1,478 1,401 -5.21% 2,575 2,358 -8.43%m_ YTTotal Sales Volume $686,798,238 $652,169,700 -5.04% $1,195,228,617 $1,081,426,910 -9.52%m_ YTNew Listings 3,683 3,635 -1.30% 7,719 7,093 -8.11%m_ YTInventory 7,308 7,608 4.11% 6,814 7,195 5.59%
Months of Supply 4.94 5.43 9.83% 5.29 6.10 15.31%Sales to New Listings Ratio 0.40 0.39 -1.59% 0.33 0.33 -0.12%
m_YTSales to List Price Ratio 97.37% 96.78% -0.59% 97.40% 96.57% -0.83%m_YTDays on Market 38 47 22.33% 43 51 18.60%m_YTBenchmark Price $456,700 $440,900 -3.46% $457,350 $442,450 -3.26%m_YTMedian Price $417,500 $415,000 -0.60% $417,500 $410,000 -1.80%m_YTAverage Price $464,681 $465,503 0.18% $464,166 $458,620 -1.19%m_YTIndex 209 202 -3.45% 209 202 -3.25%
For a list of definitions, see page 28.
Summary Stats City of Calgary
C R E B ® C a l g a r y R e g i o n a l H o u s i n g M a r k e t S t a t i s t i c s
Page 3
Feb-15 Feb-16 Y/Y % Change 2015 YTD 2016 YTD Y/Y %
ChangeDETACHED
m_CYTTotal Sales 740 691 -6.62% 1,274 1,158 -9.11%m_CYTTotal Sales Volume $389,485,863 $372,955,777 -4.24% $669,936,335 $618,951,969 -7.61%m_CYTNew Listings 1,671 1,611 -3.59% 3,507 3,098 -11.66%m_CYTInventory 2,977 2,943 -1.14% 2,778 2,744 -1.22%
Months of Supply 4.02 4.26 5.87% 4.36 4.74 8.67%Sales to New Listings Ratio 0.44 0.43 -1.39% 0.36 0.37 1.05%
m_YTSales to List Price Ratio 97.59% 96.76% -0.83% 97.60% 96.44% -1.16%m_YTDays on Market 34 38 13.08% 35 43 22.86%m_YTBenchmark Price $521,000 $504,400 -3.19% $521,950 $506,200 -3.02%m_YTMedian Price $470,000 $467,500 -0.53% $475,000 $465,000 -2.11%m_YTAverage Price $526,332 $539,733 2.55% $525,853 $534,501 1.64%m_YTIndex 214 207 -3.18% 214 208 -3.01%
ATTACHEDm_CYTTotal Sales 251 268 6.77% 441 438 -0.68%m_CYTTotal Sales Volume $99,328,121 $107,931,437 8.66% $176,006,447 $176,013,881 0.00%m_CYTNew Listings 671 658 -1.94% 1,359 1,313 -3.38%m_CYTInventory 1,216 1,336 9.87% 1,116 1,285 15.19%
Months of Supply 4.84 4.99 2.90% 5.06 5.87 15.98%Sales to New Listings Ratio 0.37 0.41 3.32% 0.32 0.33 0.91%
m_YTSales to List Price Ratio 97.71% 97.11% -0.60% 97.81% 96.93% -0.87%m_YTDays on Market 34 50 48.95% 37 50 35.14%m_YTBenchmark Price $348,500 $338,900 -2.75% $348,400 $340,250 -2.34%m_YTMedian Price $345,000 $346,000 0.29% $343,000 $345,000 0.58%m_YTAverage Price $395,730 $402,729 1.77% $399,108 $401,858 0.69%m_YTIndex 207 201 -2.76% 207 202 -2.35%
APARTMENTm_CYTTotal Sales 216 168 -22.22% 369 296 -19.78%m_CYTTotal Sales Volume $66,453,448 $51,653,500 -22.27% $113,311,253 $87,454,654 -22.82%m_CYTNew Listings 593 637 7.42% 1,338 1,237 -7.55%m_CYTInventory 1,338 1,402 4.78% 1,268 1,331 4.97%
Months of Supply 6.19 8.35 34.72% 6.87 8.99 30.86%Sales to New Listings Ratio 0.36 0.26 -10.05% 0.28 0.24 -3.65%
m_YTSales to List Price Ratio 97.23% 96.39% -0.84% 97.06% 96.14% -0.92%m_YTDays on Market 40 50 26.07% 46 54 17.39%m_YTBenchmark Price $299,300 $283,600 -5.25% $300,150 $283,700 -5.48%m_YTMedian Price $267,500 $268,000 0.19% $268,750 $263,000 -2.14%m_YTAverage Price $307,655 $307,461 -0.06% $307,077 $295,455 -3.78%m_YTIndex 205 194 -5.23% 205 194 -5.48%
CITY OF CALGARYm_CYTTotal Sales 1,207 1,127 -6.63% 2,084 1,892 -9.21%m_CYTTotal Sales Volume $555,267,432 $532,540,714 -4.09% $959,254,035 $882,420,505 -8.01%m_CYTNew Listings 2,935 2,906 -0.99% 6,204 5,648 -8.96%m_CYTInventory 5,531 5,681 2.71% 5,162 5,360 3.85%
Months of Supply 4.58 5.04 10.00% 4.95 5.67 14.38%Sales to New Listings Ratio 0.41 0.39 -2.34% 0.34 0.33 -0.09%
m_YTSales to List Price Ratio 97.57% 96.79% -0.77% 97.57% 96.51% -1.06%m_YTDays on Market 35 43 22.88% 38 46 21.05%m_YTBenchmark Price $460,900 $445,000 -3.45% $461,650 $446,400 -3.30%m_YTMedian Price $420,000 $420,000 0.00% $420,000 $415,000 -1.19%m_YTAverage Price $460,039 $472,529 2.72% $460,295 $466,396 1.33%m_YTIndex 212 204 -3.45% 212 205 -3.30%
For a list of definitions, see page 28.
Summary Stats Census Metropolitan AreaTotal Residential
C R E B ® C a l g a r y R e g i o n a l H o u s i n g M a r k e t S t a t i s t i c s
Page 4
Feb-15 Feb-16 Y/Y % Change 2015 YTD 2016 YTD Y/Y %
ChangeCITY OF CALGARY
m_CYTDTotal Sales 1,207 1,127 -6.63% 2,084 1,892 -9.21%m_CYTDTotal Sales Volume $555,267,432 $532,540,714 -4.09% $959,254,035 $882,420,505 -8.01%m_CYTDNew Listings 2,935 2,906 -0.99% 6,204 5,648 -8.96%m_CYTDInventory 5,531 5,681 2.71% 5,162 5,360 3.85%
Months of Supply 4.58 5.04 10.00% 4.95 5.67 14.38%Sales to New Listings Ratio 0.41 0.39 -2.34% 0.34 0.33 -0.09%
m_cYTDSales to List Price Ratio 97.57% 96.79% -0.77% 97.57% 96.51% -1.06%m_cYTDDays on Market 35 43 22.88% 38 46 21.05%m_cYTDBenchmark Price $460,900 $445,000 -3.45% $461,650 $446,400 -3.30%m_cYTDMedian Price $420,000 $420,000 0.00% $420,000 $415,000 -1.19%m_cYTDAverage Price $460,039 $472,529 2.72% $460,295 $466,396 1.33%m_cYTDIndex 212 204 -3.45% 212 205 -3.30%
AIRDRIEm_a YTDTotal Sales 99 87 -12.12% 163 152 -6.75%m_a YTDTotal Sales Volume $39,472,729 $34,514,460 -12.56% $63,080,366 $58,403,610 -7.41%m_a YTDNew Listings 230 205 -10.87% 454 388 -14.54%m_a YTDInventory 363 378 4.13% 325 352 8.15%
Months of Supply 3.67 4.34 18.50% 3.99 4.63 15.98%Sales to New Listings Ratio 0.43 0.42 -0.60% 0.36 0.39 3.27%
m_aYTDSales to List Price Ratio 98.46% 97.66% -0.80% 98.47% 97.70% -0.77%m_aYTDDays on Market 35 45 28.47% 38 51 34.21%m_aYTDBenchmark Price $377,300 $365,300 -3.18% $376,750 $365,850 -2.89%m_aYTDMedian Price $395,000 $380,000 -3.80% $390,000 $375,000 -3.85%m_aYTDAverage Price $398,714 $396,718 -0.50% $386,996 $384,234 -0.71%m_aYTDIndex 201 195 -3.19% 201 195 -2.89%
ROCKYVIEWm_MYTDTotal Sales 78 95 21.79% 156 153 -1.92%m_MYTDTotal Sales Volume $50,712,277 $45,428,126 -10.42% $99,503,726 $72,845,600 -26.79%m_MYTDNew Listings 256 263 2.73% 544 522 -4.04%m_MYTDInventory 735 761 3.54% 694 733 5.70%
Months of Supply 9.42 8.01 -14.99% 8.89 9.58 7.77%Sales to New Listings Ratio 0.30 0.36 5.65% 0.29 0.29 0.63%
m_ YTDSales to List Price Ratio 95.25% 96.18% 0.93% 95.64% 96.30% 0.66%m_ YTDDays on Market 57 69 21.25% 67 71 5.97%m_ YTDBenchmark Price $562,100 $524,700 -6.65% $560,400 $533,350 -4.83%m_ YTDMedian Price $497,500 $415,000 -16.58% $488,450 $415,000 -15.04%m_ YTDAverage Price $650,157 $478,191 -26.45% $637,844 $476,115 -25.36%m_ YTDIndex 182 170 -6.65% 181 173 -4.82%
CALGARY CMAm_CYTDTotal Sales 1,384 1,309 -5.42% 2,403 2,197 -8.57%m_CYTDTotal Sales Volume $645,452,438 $612,483,300 -5.11% $1,121,838,127 $1,013,669,715 -9.64%m_CYTDNew Listings 3,421 3,374 -1.37% 7,202 6,558 -8.94%m_CYTDInventory 6,629 6,820 2.88% 6,180 6,445 4.28%
Months of Supply 4.79 5.21 8.78% 5.14 5.87 14.06%Sales to New Listings Ratio 0.40 0.39 -1.66% 0.33 0.34 0.14%
m_CYTDSales to List Price Ratio 97.43% 96.79% -0.64% 97.45% 96.56% -0.88%m_CYTDDays on Market 36 45 24.26% 40 48 20.00%m_CYTDBenchmark Price $461,400 $444,900 -3.58% $462,150 $446,450 -3.40%m_CYTDMedian Price $420,000 $417,500 -0.60% $420,000 $412,500 -1.79%m_CYTDAverage Price $466,367 $467,902 0.33% $466,849 $461,388 -1.17%m_CYTDIndex 210 203 -3.57% 210 203 -3.40%
For a list of definitions, see page 28.
Summary Stats Surrounding AreaTotal Residential
C R E B ® C a l g a r y R e g i o n a l H o u s i n g M a r k e t S t a t i s t i c s
Page 5
Feb-15 Feb-16 Y/Y % Change 2015 YTD 2016 YTD Y/Y % Change
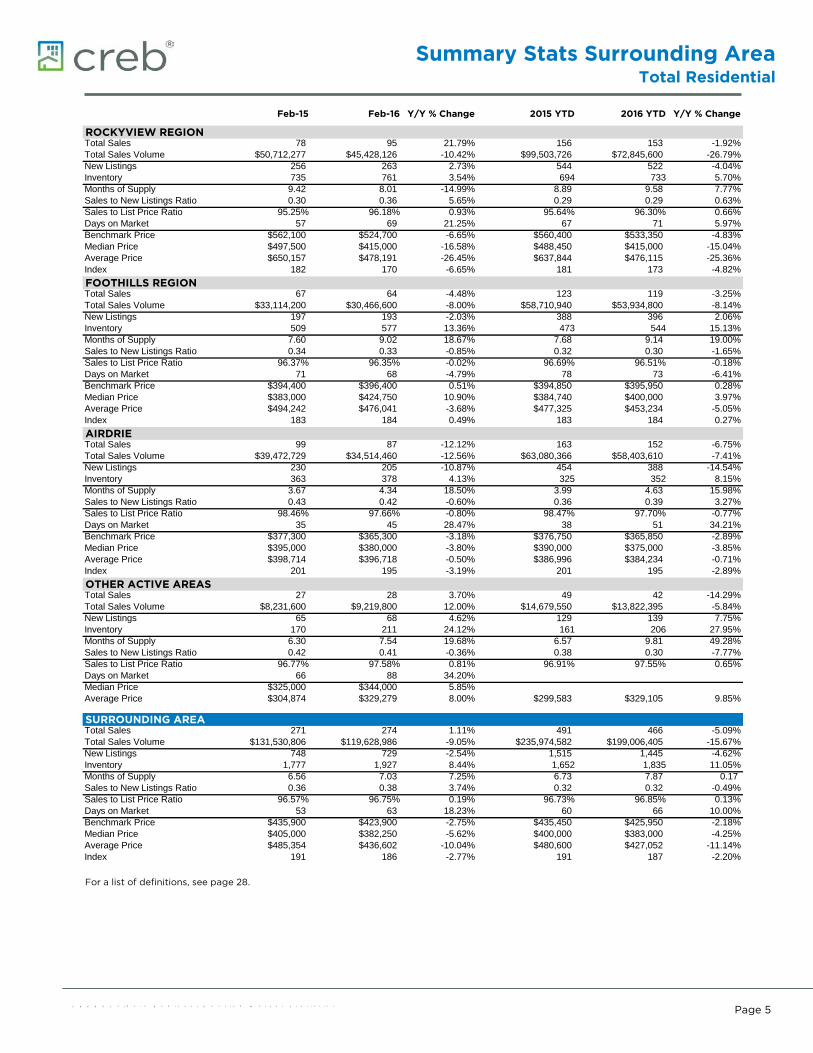
ROCKYVIEW REGIONm_mYTDTotal Sales 78 95 21.79% 156 153 -1.92%m_mYTDTotal Sales Volume $50,712,277 $45,428,126 -10.42% $99,503,726 $72,845,600 -26.79%m_mYTDNew Listings 256 263 2.73% 544 522 -4.04%m_mYTDInventory 735 761 3.54% 694 733 5.70%
Months of Supply 9.42 8.01 -14.99% 8.89 9.58 7.77%Sales to New Listings Ratio 0.30 0.36 5.65% 0.29 0.29 0.63%
m_ YTDSales to List Price Ratio 95.25% 96.18% 0.93% 95.64% 96.30% 0.66%m_ YTDDays on Market 57 69 21.25% 67 71 5.97%m_ YTDBenchmark Price $562,100 $524,700 -6.65% $560,400 $533,350 -4.83%m_ YTDMedian Price $497,500 $415,000 -16.58% $488,450 $415,000 -15.04%m_ YTDAverage Price $650,157 $478,191 -26.45% $637,844 $476,115 -25.36%m_ YTDIndex 182 170 -6.65% 181 173 -4.82%
FOOTHILLS REGIONm_mYTDTotal Sales 67 64 -4.48% 123 119 -3.25%m_mYTDTotal Sales Volume $33,114,200 $30,466,600 -8.00% $58,710,940 $53,934,800 -8.14%m_mYTDNew Listings 197 193 -2.03% 388 396 2.06%m_mYTDInventory 509 577 13.36% 473 544 15.13%
Months of Supply 7.60 9.02 18.67% 7.68 9.14 19.00%Sales to New Listings Ratio 0.34 0.33 -0.85% 0.32 0.30 -1.65%
m_ YTDSales to List Price Ratio 96.37% 96.35% -0.02% 96.69% 96.51% -0.18%m_ YTDDays on Market 71 68 -4.79% 78 73 -6.41%m_ YTDBenchmark Price $394,400 $396,400 0.51% $394,850 $395,950 0.28%m_ YTDMedian Price $383,000 $424,750 10.90% $384,740 $400,000 3.97%m_ YTDAverage Price $494,242 $476,041 -3.68% $477,325 $453,234 -5.05%m_ YTDIndex 183 184 0.49% 183 184 0.27%
AIRDRIEm_a YTDTotal Sales 99 87 -12.12% 163 152 -6.75%m_a YTDTotal Sales Volume $39,472,729 $34,514,460 -12.56% $63,080,366 $58,403,610 -7.41%m_a YTDNew Listings 230 205 -10.87% 454 388 -14.54%m_a YTDInventory 363 378 4.13% 325 352 8.15%
Months of Supply 3.67 4.34 18.50% 3.99 4.63 15.98%Sales to New Listings Ratio 0.43 0.42 -0.60% 0.36 0.39 3.27%
m_aYTDSales to List Price Ratio 98.46% 97.66% -0.80% 98.47% 97.70% -0.77%m_aYTDDays on Market 35 45 28.47% 38 51 34.21%m_aYTDBenchmark Price $377,300 $365,300 -3.18% $376,750 $365,850 -2.89%m_aYTDMedian Price $395,000 $380,000 -3.80% $390,000 $375,000 -3.85%m_aYTDAverage Price $398,714 $396,718 -0.50% $386,996 $384,234 -0.71%m_aYTDIndex 201 195 -3.19% 201 195 -2.89%
OTHER ACTIVE AREASm_OYTDTotal Sales 27 28 3.70% 49 42 -14.29%m_OYTDTotal Sales Volume $8,231,600 $9,219,800 12.00% $14,679,550 $13,822,395 -5.84%m_OYTDNew Listings 65 68 4.62% 129 139 7.75%m_OYTDInventory 170 211 24.12% 161 206 27.95%
Months of Supply 6.30 7.54 19.68% 6.57 9.81 49.28%Sales to New Listings Ratio 0.42 0.41 -0.36% 0.38 0.30 -7.77%
m_OYTDSales to List Price Ratio 96.77% 97.58% 0.81% 96.91% 97.55% 0.65%m_OYTDDays on Market 66 88 34.20% #DIV/0!m_OYTDMedian Price $325,000 $344,000 5.85% #N/A #N/A #N/Am_OYTDAverage Price $304,874 $329,279 8.00% $299,583 $329,105 9.85%
SURROUNDING AREAm_SYTDTotal Sales 271 274 1.11% 491 466 -5.09%m_SYTDTotal Sales Volume $131,530,806 $119,628,986 -9.05% $235,974,582 $199,006,405 -15.67%m_SYTDNew Listings 748 729 -2.54% 1,515 1,445 -4.62%m_SYTDInventory 1,777 1,927 8.44% 1,652 1,835 11.05%
Months of Supply 6.56 7.03 7.25% 6.73 7.87 0.17 Sales to New Listings Ratio 0.36 0.38 3.74% 0.32 0.32 -0.49%
m_SYTDSales to List Price Ratio 96.57% 96.75% 0.19% 96.73% 96.85% 0.13%m_SYTDDays on Market 53 63 18.23% 60 66 10.00%m_SYTDBenchmark Price $435,900 $423,900 -2.75% $435,450 $425,950 -2.18%m_SYTDMedian Price $405,000 $382,250 -5.62% $400,000 $383,000 -4.25%m_SYTDAverage Price $485,354 $436,602 -10.04% $480,600 $427,052 -11.14%m_SYTDIndex 191 186 -2.77% 191 187 -2.20%
For a list of definitions, see page 28.
Price Comparisons
C R E B ® C a l g a r y R e g i o n a l H o u s i n g M a r k e t S t a t i s t i c s
Page 6
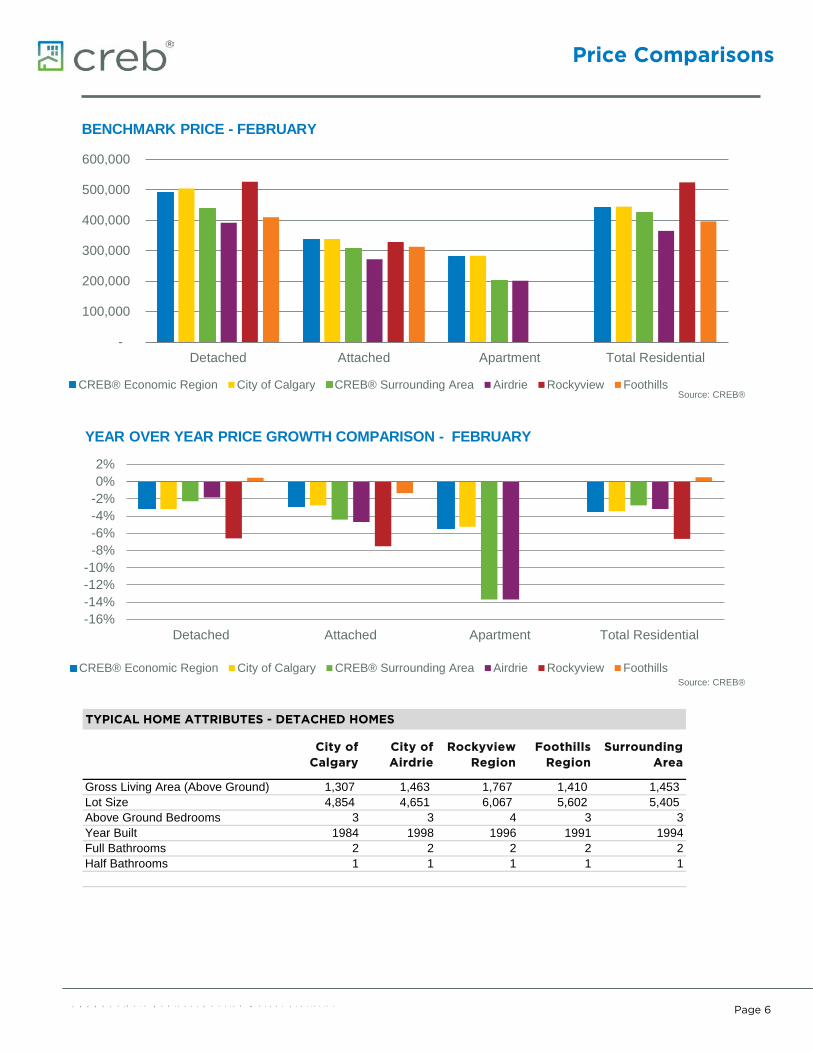
TYPICAL HOME ATTRIBUTES - DETACHED HOMES
City of Calgary
City of Airdrie
Rockyview Region
Foothills Region
Surrounding Area
Gross Living Area (Above Ground) 1,307 1,463 1,767 1,410 1,453 Lot Size 4,854 4,651 6,067 5,602 5,405 Above Ground Bedrooms 3 3 4 3 3Year Built 1984 1998 1996 1991 1994Full Bathrooms 2 2 2 2 2Half Bathrooms 1 1 1 1 1
-
100,000
200,000
300,000
400,000
500,000
600,000
Detached Attached Apartment Total Residential
BENCHMARK PRICE - FEBRUARY
CREB® Economic Region City of Calgary CREB® Surrounding Area Airdrie Rockyview FoothillsSource: CREB®
-16%-14%-12%-10%
-8%-6%-4%-2%0%2%
Detached Attached Apartment Total Residential
YEAR OVER YEAR PRICE GROWTH COMPARISON - FEBRUARY
CREB® Economic Region City of Calgary CREB® Surrounding Area Airdrie Rockyview FoothillsSource: CREB®
Area Comparisons
C R E B ® C a l g a r y R e g i o n a l H o u s i n g M a r k e t S t a t i s t i c s
Page 7
-
2.0
4.0
6.0
8.0
10.0
12.0
14.0
Detached Attached Apartment
MONTHS OF SUPPLY - FEBRUARY
CREB® Economic Region City of Calgary CREB® Surrounding Area Airdrie Rockyview Foothills Source: CREB®
63% 61% 70% 61% 68%
81%
23% 24% 22% 28%
24% 9%
14% 15% 8% 11% 7% 9%
0%
20%
40%
60%
80%
100%
120%
CREB® EconomicRegion
City of Calgary CREB®Surrounding Area
Airdrie Rockyview Foothills
SALES DISTRIBUTION - FEBRUARY
Detached Attached Apartment Source: CREB®
0
200
400
600
800
1,000
1,200
1,400
1,600
<$200,000 $200,000 -$299,999
$300,000 -$399,999
$400,000 -$499,999
$500,000 -$599,999
$600,000 -$699,999
$700,000 -999,999
$1,000,000+
INVENTORY BY PRICE RANGE - FEBRUARY
City of Calgary Airdrie Rockyview Foothills Other Active AreasSource: CREB®
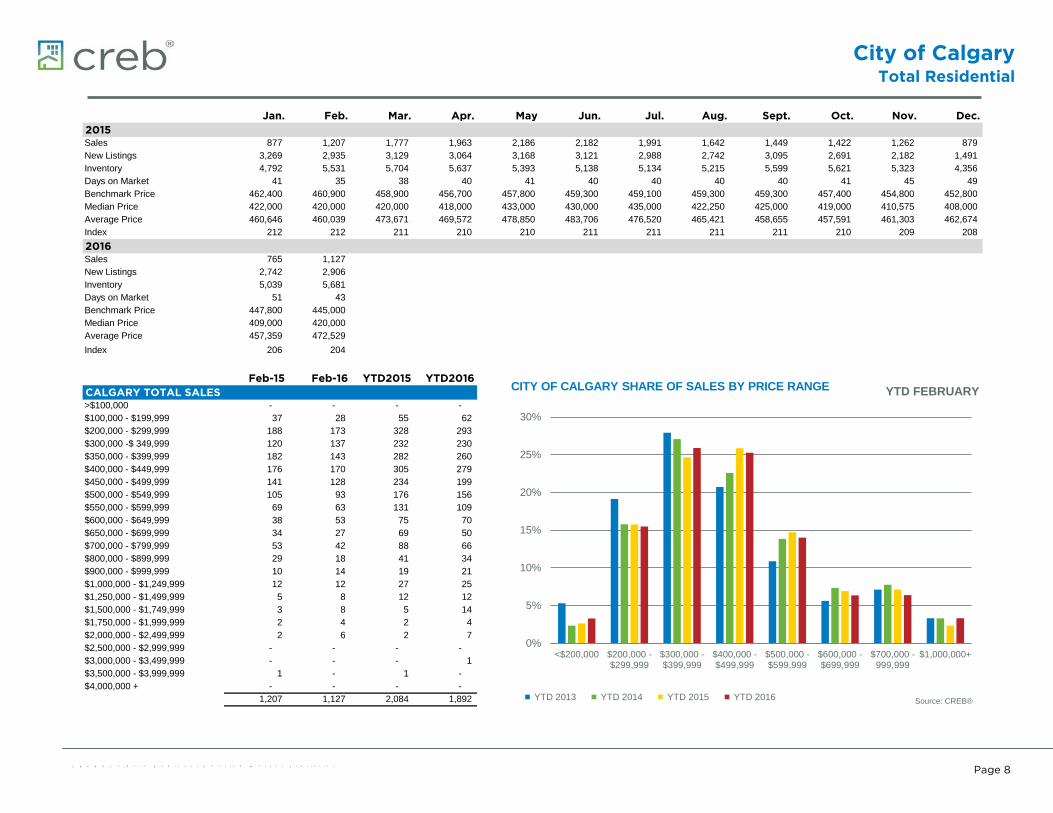
City of CalgaryTotal Residential
C R E B ® C a l g a r y R e g i o n a l H o u s i n g M a r k e t S t a t i s t i c s
Page 8
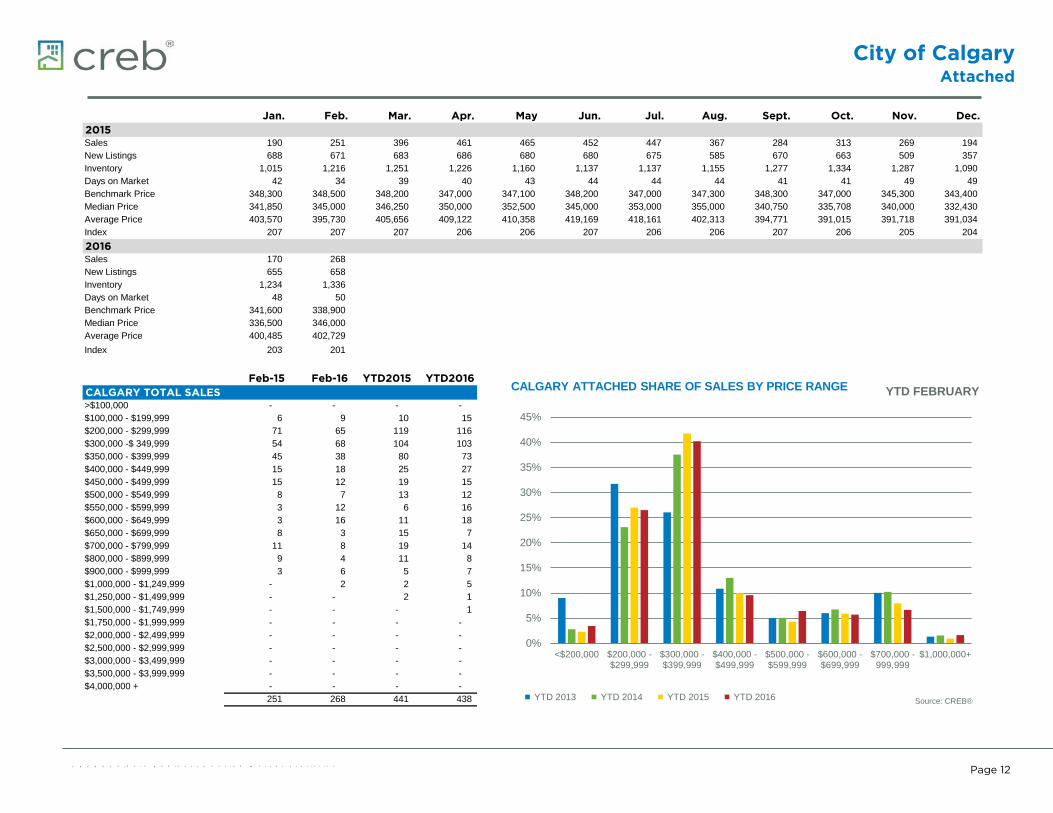
Jan. Feb. Mar. Apr. May Jun. Jul. Aug. Sept. Oct. Nov. Dec.2015 01/01/15 02/01/15 03/01/15 04/01/15 05/01/15 06/01/15 07/01/15 08/01/15 09/01/15 10/01/15 11/01/15 12/01/15
m_CM_RSales 877 1,207 1,777 1,963 2,186 2,182 1,991 1,642 1,449 1,422 1,262 879 m_CM_RNew Listings 3,269 2,935 3,129 3,064 3,168 3,121 2,988 2,742 3,095 2,691 2,182 1,491 m_CM_RInventory 4,792 5,531 5,704 5,637 5,393 5,138 5,134 5,215 5,599 5,621 5,323 4,356 m_cm_Days on Market 41 35 38 40 41 40 40 40 40 41 45 49 m_cm_Benchmark Price 462,400 460,900 458,900 456,700 457,800 459,300 459,100 459,300 459,300 457,400 454,800 452,800 m_cm_Median Price 422,000 420,000 420,000 418,000 433,000 430,000 435,000 422,250 425,000 419,000 410,575 408,000 m_cm_Average Price 460,646 460,039 473,671 469,572 478,850 483,706 476,520 465,421 458,655 457,591 461,303 462,674 m_cm_Index 212 212 211 210 210 211 211 211 211 210 209 208
2016 01/01/16 02/01/16 03/01/16 04/01/16 05/01/16 06/01/16 07/01/16 08/01/16 09/01/16 10/01/16 11/01/16 12/01/16m_CM_RSales 765 1,127 m_CM_RNew Listings 2,742 2,906 m_CM_RInventory 5,039 5,681 m_cm_Days on Market 51 43 m_cm_Benchmark Price 447,800 445,000 m_cm_Median Price 409,000 420,000 m_cm_Average Price 457,359 472,529 m_cm_Index 206 204
Feb-15 Feb-16 YTD2015 YTD2016CALGARY TOTAL SALES 02/01/15 02/01/16 02/01/15 02/01/16
m_Cytd_ >$100,000 - - - - m_Cytd_ $100,000 - $199,999 37 28 55 62 m_Cytd_ $200,000 - $299,999 188 173 328 293 m_Cytd_ $300,000 -$ 349,999 120 137 232 230 m_Cytd_ $350,000 - $399,999 182 143 282 260 m_Cytd_ $400,000 - $449,999 176 170 305 279 m_Cytd_ $450,000 - $499,999 141 128 234 199 m_Cytd_ $500,000 - $549,999 105 93 176 156 m_Cytd_ $550,000 - $599,999 69 63 131 109 m_Cytd_ $600,000 - $649,999 38 53 75 70 m_Cytd_ $650,000 - $699,999 34 27 69 50 m_Cytd_ $700,000 - $799,999 53 42 88 66 m_Cytd_ $800,000 - $899,999 29 18 41 34 m_Cytd_ $900,000 - $999,999 10 14 19 21 m_Cytd_ $1,000,000 - $1,249,999 12 12 27 25 m_Cytd_ $1,250,000 - $1,499,999 5 8 12 12 m_Cytd_ $1,500,000 - $1,749,999 3 8 5 14 m_Cytd_ $1,750,000 - $1,999,999 2 4 2 4 m_Cytd_ $2,000,000 - $2,499,999 2 6 2 7 m_Cytd_ $2,500,000 - $2,999,999 - - - - m_Cytd_ $3,000,000 - $3,499,999 - - - 1 m_Cytd_ $3,500,000 - $3,999,999 1 - 1 - m_Cytd_ $4,000,000 + - - - -
1,207 1,127 2,084 1,892
0%
5%
10%
15%
20%
25%
30%
<$200,000 $200,000 -$299,999
$300,000 -$399,999
$400,000 -$499,999
$500,000 -$599,999
$600,000 -$699,999
$700,000 -999,999
$1,000,000+
YTD FEBRUARY CITY OF CALGARY SHARE OF SALES BY PRICE RANGE
YTD 2013 YTD 2014 YTD 2015 YTD 2016 Source: CREB®
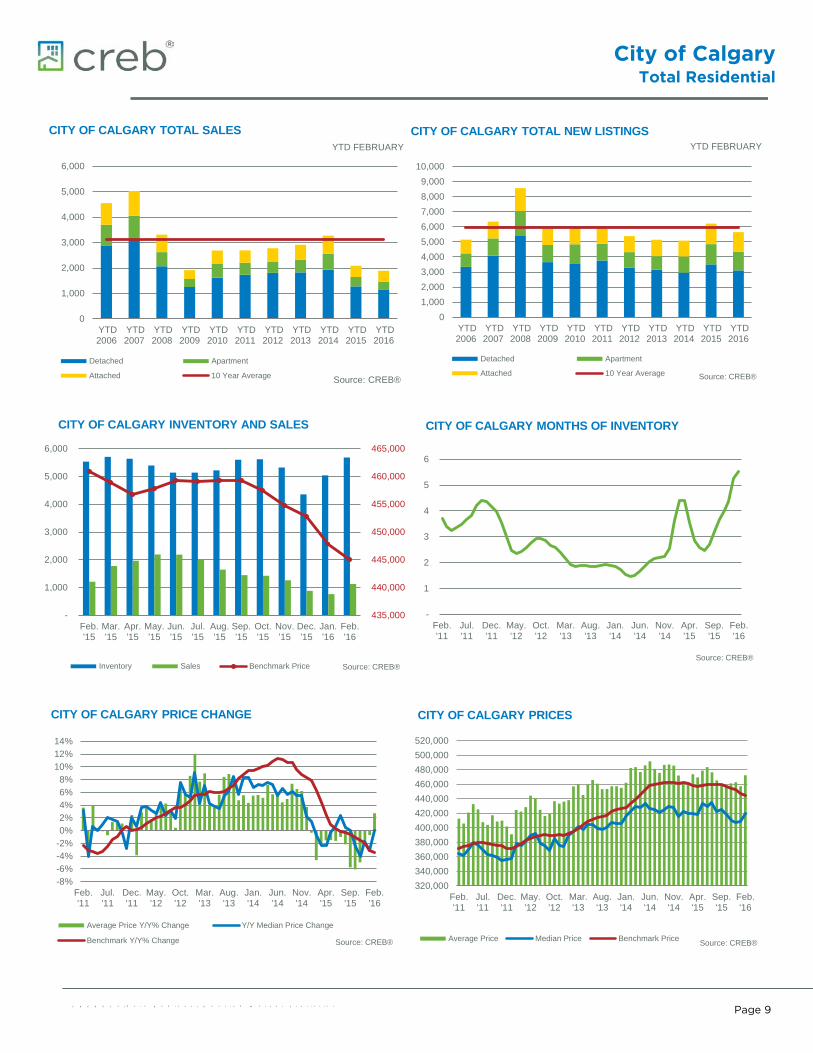
City of CalgaryTotal Residential
C R E B ® C a l g a r y R e g i o n a l H o u s i n g M a r k e t S t a t i s t i c s
Page 9
0
1,000
2,000
3,000
4,000
5,000
6,000
YTD2006
YTD2007
YTD2008
YTD2009
YTD2010
YTD2011
YTD2012
YTD2013
YTD2014
YTD2015
YTD2016
YTD FEBRUARY
CITY OF CALGARY TOTAL SALES
Detached Apartment
Attached 10 Year Average Source: CREB®
01,0002,0003,0004,0005,0006,0007,0008,0009,000
10,000
YTD2006
YTD2007
YTD2008
YTD2009
YTD2010
YTD2011
YTD2012
YTD2013
YTD2014
YTD2015
YTD2016
YTD FEBRUARY CITY OF CALGARY TOTAL NEW LISTINGS
Detached Apartment
Attached 10 Year Average Source: CREB®
435,000
440,000
445,000
450,000
455,000
460,000
465,000
-
1,000
2,000
3,000
4,000
5,000
6,000
Feb.'15
Mar.'15
Apr.'15
May.'15
Jun.'15
Jul.'15
Aug.'15
Sep.'15
Oct.'15
Nov.'15
Dec.'15
Jan.'16
Feb.'16
CITY OF CALGARY INVENTORY AND SALES
Inventory Sales Benchmark Price Source: CREB®
-
1
2
3
4
5
6
Feb.'11
Jul.'11
Dec.'11
May.'12
Oct.'12
Mar.'13
Aug.'13
Jan.'14
Jun.'14
Nov.'14
Apr.'15
Sep.'15
Feb.'16
CITY OF CALGARY MONTHS OF INVENTORY
Source: CREB®
-8%-6%-4%-2%0%2%4%6%8%
10%12%14%
Feb.'11
Jul.'11
Dec.'11
May.'12
Oct.'12
Mar.'13
Aug.'13
Jan.'14
Jun.'14
Nov.'14
Apr.'15
Sep.'15
Feb.'16
CITY OF CALGARY PRICE CHANGE
Average Price Y/Y% Change Y/Y Median Price Change
Benchmark Y/Y% Change Source: CREB®
320,000340,000360,000380,000400,000420,000440,000460,000480,000500,000520,000
Feb.'11
Jul.'11
Dec.'11
May.'12
Oct.'12
Mar.'13
Aug.'13
Jan.'14
Jun.'14
Nov.'14
Apr.'15
Sep.'15
Feb.'16
CITY OF CALGARY PRICES
Average Price Median Price Benchmark Price Source: CREB®

City of CalgaryDetached
C R E B ® C a l g a r y R e g i o n a l H o u s i n g M a r k e t S t a t i s t i c s
Page 10
Jan. Feb. Mar. Apr. May Jun. Jul. Aug. Sept. Oct. Nov. Dec.2015 01/01/15 02/01/15 03/01/15 04/01/15 05/01/15 06/01/15 07/01/15 08/01/15 09/01/15 10/01/15 11/01/15 12/01/15
m_CM_d Sales 534 740 1,079 1,150 1,362 1,331 1,220 994 906 872 798 533 m_CM_d New Listings 1,836 1,671 1,774 1,770 1,875 1,830 1,731 1,643 1,768 1,441 1,184 791 m_CM_d Inventory 2,579 2,977 3,027 3,044 2,923 2,789 2,752 2,833 3,029 2,921 2,683 2,142 m_cm_Days on Market 37 34 37 38 38 37 37 37 37 38 43 47 m_cm_Benchmark Price 522,900 521,000 519,500 517,100 518,000 520,200 520,000 520,200 520,500 518,800 515,600 514,100 m_cm_Median Price 480,500 470,000 475,000 479,200 485,000 493,400 489,000 484,000 475,000 470,250 465,000 455,000 m_cm_Average Price 525,188 526,332 545,575 545,043 541,937 554,022 541,693 536,722 524,987 519,371 524,211 533,704 m_cm_Index 214 214 213 212 212 213 213 213 213 213 211 211
2016 01/01/16 02/01/16 03/01/16 04/01/16 05/01/16 06/01/16 07/01/16 08/01/16 09/01/16 10/01/16 11/01/16 12/01/16m_CM_d Sales 467 691 m_CM_d New Listings 1,487 1,611 m_CM_d Inventory 2,545 2,943 m_cm_Days on Market 49 38 m_cm_Benchmark Price 508,000 504,400 m_cm_Median Price 460,000 467,500 m_cm_Average Price 526,758 539,733 m_cm_Index 208 207
Feb-15 Feb-16 YTD2015 YTD2016CALGARY TOTAL SALES 02/01/15 02/01/16 02/01/15 02/01/16
m_Cytd_ >$100,000 - - - - m_Cytd_ $100,000 - $199,999 1 - 2 - m_Cytd_ $200,000 - $299,999 14 21 23 32 m_Cytd_ $300,000 -$ 349,999 40 44 80 83 m_Cytd_ $350,000 - $399,999 114 92 168 162 m_Cytd_ $400,000 - $449,999 145 144 255 241 m_Cytd_ $450,000 - $499,999 122 110 205 176 m_Cytd_ $500,000 - $549,999 92 85 155 140 m_Cytd_ $550,000 - $599,999 65 49 123 90 m_Cytd_ $600,000 - $649,999 32 32 61 47 m_Cytd_ $650,000 - $699,999 24 24 52 42 m_Cytd_ $700,000 - $799,999 41 33 65 51 m_Cytd_ $800,000 - $899,999 20 14 28 25 m_Cytd_ $900,000 - $999,999 7 8 14 14 m_Cytd_ $1,000,000 - $1,249,999 12 10 25 20 m_Cytd_ $1,250,000 - $1,499,999 4 8 9 11 m_Cytd_ $1,500,000 - $1,749,999 3 8 5 13 m_Cytd_ $1,750,000 - $1,999,999 1 4 1 4 m_Cytd_ $2,000,000 - $2,499,999 2 5 2 6 m_Cytd_ $2,500,000 - $2,999,999 - - - - m_Cytd_ $3,000,000 - $3,499,999 - - - 1 m_Cytd_ $3,500,000 - $3,999,999 1 - 1 - m_Cytd_ $4,000,000 + - - - -
740 691 1,274 1,158
0%
5%
10%
15%
20%
25%
30%
35%
40%
<$200,000 $200,000 -$299,999
$300,000 -$399,999
$400,000 -$499,999
$500,000 -$599,999
$600,000 -$699,999
$700,000 -999,999
$1,000,000+
YTD FEBRUARY CALGARY DETACHED SHARE OF SALES BY PRICE RANGE
YTD 2013 YTD 2014 YTD 2015 YTD 2016 Source: CREB®
City of CalgaryDetached
C R E B ® C a l g a r y R e g i o n a l H o u s i n g M a r k e t S t a t i s t i c s
Page 11
0
500
1,000
1,500
2,000
2,500
3,000
3,500
YTD2006
YTD2007
YTD2008
YTD2009
YTD2010
YTD2011
YTD2012
YTD2013
YTD2014
YTD2015
YTD2016
YTD FEBRUARY
CALGARY DETACHED TOTAL SALES
Detached 10 Year AverageSource: CREB®
0
1,000
2,000
3,000
4,000
5,000
6,000
YTD2006
YTD2007
YTD2008
YTD2009
YTD2010
YTD2011
YTD2012
YTD2013
YTD2014
YTD2015
YTD2016
YTD FEBRUARY CALGARY DETACHED TOTAL NEW LISTINGS
Detached 10 Year AverageSource: CREB®
495,000
500,000
505,000
510,000
515,000
520,000
525,000
-
500
1,000
1,500
2,000
2,500
3,000
3,500
Feb.'15
Mar.'15
Apr.'15
May.'15
Jun.'15
Jul.'15
Aug.'15
Sep.'15
Oct.'15
Nov.'15
Dec.'15
Jan.'16
Feb.'16
CALGARY DETACHED INVENTORY AND SALES
Inventory Sales Benchmark Price Source: CREB®
-
1
1
2
2
3
3
4
4
5
5
Feb. '11 Feb. '12 Feb. '13 Feb. '14 Feb. '15 Feb. '16
CALGARY DETACHED MONTHS OF INVENTORY
Source: CREB®
-10%
-5%
0%
5%
10%
15%
Feb. '11 Feb. '12 Feb. '13 Feb. '14 Feb. '15 Feb. '16
CALGARY DETACHED PRICE CHANGE
Average Y/Y% Change Median Y/Y% change
Benchmark Y/Y% Change Source: CREB®
320,000
370,000
420,000
470,000
520,000
570,000
620,000
Feb. '11 Feb. '12 Feb. '13 Feb. '14 Feb. '15 Feb. '16
CALGARY DETACHED PRICES
Average Price Median Price Benchmark Price Source: CREB®
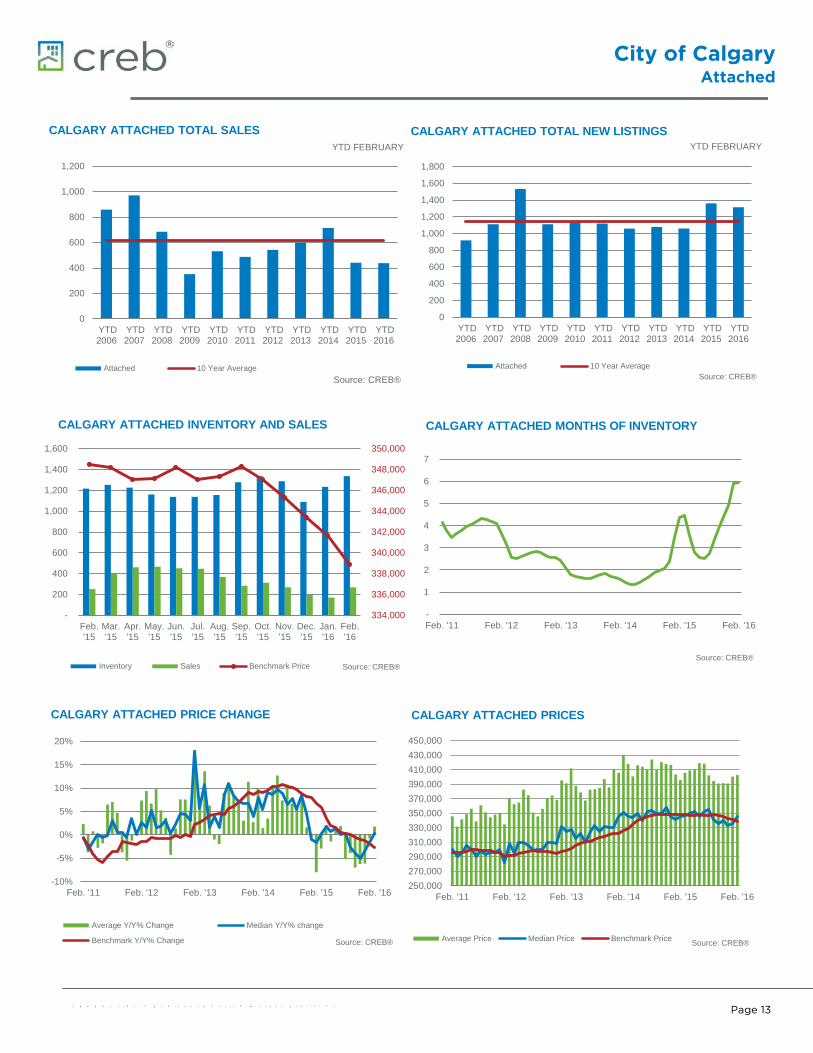
City of CalgaryAttached
C R E B ® C a l g a r y R e g i o n a l H o u s i n g M a r k e t S t a t i s t i c s
Page 12
Jan. Feb. Mar. Apr. May Jun. Jul. Aug. Sept. Oct. Nov. Dec.2015 01/01/15 02/01/15 03/01/15 04/01/15 05/01/15 06/01/15 07/01/15 08/01/15 09/01/15 10/01/15 11/01/15 12/01/15
m_CM_ASales 190 251 396 461 465 452 447 367 284 313 269 194 m_CM_ANew Listings 688 671 683 686 680 680 675 585 670 663 509 357 m_CM_AInventory 1,015 1,216 1,251 1,226 1,160 1,137 1,137 1,155 1,277 1,334 1,287 1,090 m_cm_Days on Market 42 34 39 40 43 44 44 44 41 41 49 49 m_cm_Benchmark Price 348,300 348,500 348,200 347,000 347,100 348,200 347,000 347,300 348,300 347,000 345,300 343,400 m_cm_Median Price 341,850 345,000 346,250 350,000 352,500 345,000 353,000 355,000 340,750 335,708 340,000 332,430 m_cm_Average Price 403,570 395,730 405,656 409,122 410,358 419,169 418,161 402,313 394,771 391,015 391,718 391,034 m_cm_Index 207 207 207 206 206 207 206 206 207 206 205 204
2016 01/01/16 02/01/16 03/01/16 04/01/16 05/01/16 06/01/16 07/01/16 08/01/16 09/01/16 10/01/16 11/01/16 12/01/16m_CM_ASales 170 268 m_CM_ANew Listings 655 658 m_CM_AInventory 1,234 1,336 m_cm_Days on Market 48 50 m_cm_Benchmark Price 341,600 338,900 m_cm_Median Price 336,500 346,000 m_cm_Average Price 400,485 402,729 m_cm_Index 203 201
Feb-15 Feb-16 YTD2015 YTD2016CALGARY TOTAL SALES 02/01/15 02/01/16 02/01/15 02/01/16
m_Cytd_ >$100,000 - - - - m_Cytd_ $100,000 - $199,999 6 9 10 15 m_Cytd_ $200,000 - $299,999 71 65 119 116 m_Cytd_ $300,000 -$ 349,999 54 68 104 103 m_Cytd_ $350,000 - $399,999 45 38 80 73 m_Cytd_ $400,000 - $449,999 15 18 25 27 m_Cytd_ $450,000 - $499,999 15 12 19 15 m_Cytd_ $500,000 - $549,999 8 7 13 12 m_Cytd_ $550,000 - $599,999 3 12 6 16 m_Cytd_ $600,000 - $649,999 3 16 11 18 m_Cytd_ $650,000 - $699,999 8 3 15 7 m_Cytd_ $700,000 - $799,999 11 8 19 14 m_Cytd_ $800,000 - $899,999 9 4 11 8 m_Cytd_ $900,000 - $999,999 3 6 5 7 m_Cytd_ $1,000,000 - $1,249,999 - 2 2 5 m_Cytd_ $1,250,000 - $1,499,999 - - 2 1 m_Cytd_ $1,500,000 - $1,749,999 - - - 1 m_Cytd_ $1,750,000 - $1,999,999 - - - - m_Cytd_ $2,000,000 - $2,499,999 - - - - m_Cytd_ $2,500,000 - $2,999,999 - - - - m_Cytd_ $3,000,000 - $3,499,999 - - - - m_Cytd_ $3,500,000 - $3,999,999 - - - - m_Cytd_ $4,000,000 + - - - -
251 268 441 438
0%
5%
10%
15%
20%
25%
30%
35%
40%
45%
<$200,000 $200,000 -$299,999
$300,000 -$399,999
$400,000 -$499,999
$500,000 -$599,999
$600,000 -$699,999
$700,000 -999,999
$1,000,000+
YTD FEBRUARY CALGARY ATTACHED SHARE OF SALES BY PRICE RANGE
YTD 2013 YTD 2014 YTD 2015 YTD 2016 Source: CREB®
City of CalgaryAttached
C R E B ® C a l g a r y R e g i o n a l H o u s i n g M a r k e t S t a t i s t i c s
Page 13
0
200
400
600
800
1,000
1,200
YTD2006
YTD2007
YTD2008
YTD2009
YTD2010
YTD2011
YTD2012
YTD2013
YTD2014
YTD2015
YTD2016
YTD FEBRUARY
CALGARY ATTACHED TOTAL SALES
Attached 10 Year AverageSource: CREB®
0
200
400
600
800
1,000
1,200
1,400
1,600
1,800
YTD2006
YTD2007
YTD2008
YTD2009
YTD2010
YTD2011
YTD2012
YTD2013
YTD2014
YTD2015
YTD2016
YTD FEBRUARY CALGARY ATTACHED TOTAL NEW LISTINGS
Attached 10 Year AverageSource: CREB®
334,000
336,000
338,000
340,000
342,000
344,000
346,000
348,000
350,000
-
200
400
600
800
1,000
1,200
1,400
1,600
Feb.'15
Mar.'15
Apr.'15
May.'15
Jun.'15
Jul.'15
Aug.'15
Sep.'15
Oct.'15
Nov.'15
Dec.'15
Jan.'16
Feb.'16
CALGARY ATTACHED INVENTORY AND SALES
Inventory Sales Benchmark Price Source: CREB®
-
1
2
3
4
5
6
7
Feb. '11 Feb. '12 Feb. '13 Feb. '14 Feb. '15 Feb. '16
CALGARY ATTACHED MONTHS OF INVENTORY
Source: CREB®
-10%
-5%
0%
5%
10%
15%
20%
Feb. '11 Feb. '12 Feb. '13 Feb. '14 Feb. '15 Feb. '16
CALGARY ATTACHED PRICE CHANGE
Average Y/Y% Change Median Y/Y% change
Benchmark Y/Y% Change Source: CREB®
250,000270,000290,000310,000330,000350,000370,000390,000410,000430,000450,000
Feb. '11 Feb. '12 Feb. '13 Feb. '14 Feb. '15 Feb. '16
CALGARY ATTACHED PRICES
Average Price Median Price Benchmark Price Source: CREB®

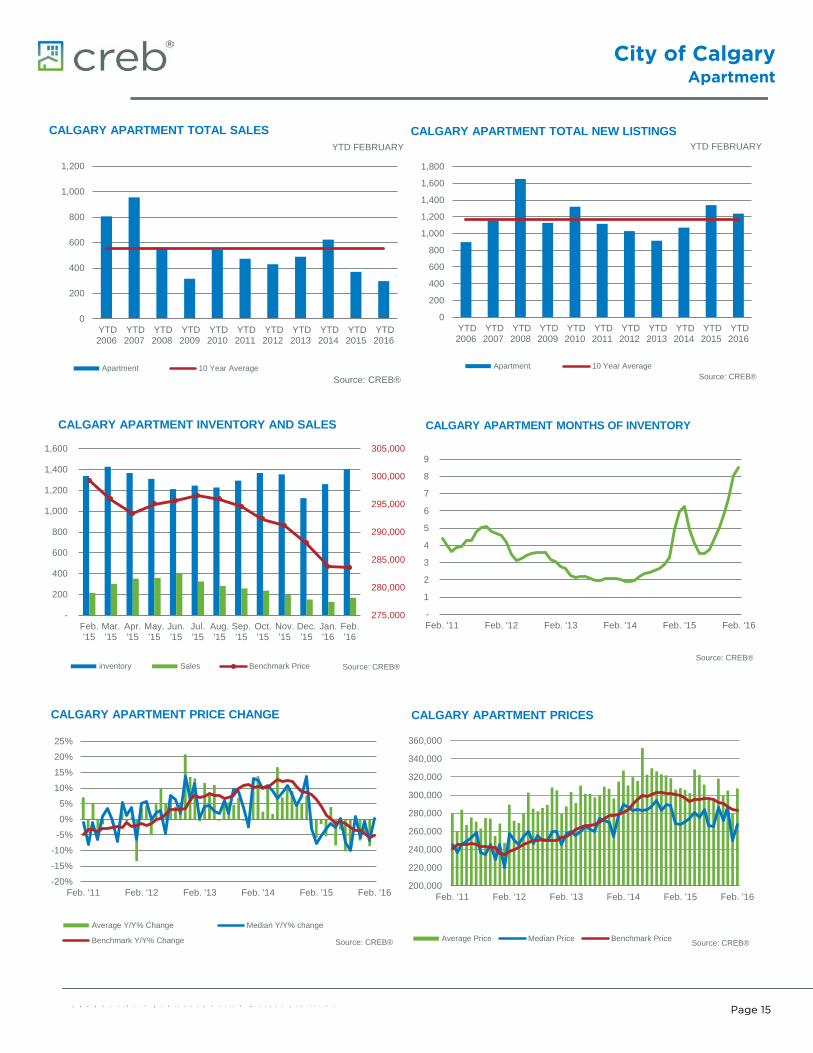
City of CalgaryApartment
C R E B ® C a l g a r y R e g i o n a l H o u s i n g M a r k e t S t a t i s t i c s
Page 14
Jan. Feb. Mar. Apr. May Jun. Jul. Aug. Sept. Oct. Nov. Dec.2015 01/01/15 02/01/15 03/01/15 04/01/15 05/01/15 06/01/15 07/01/15 08/01/15 09/01/15 10/01/15 11/01/15 12/01/15
m_CM_a Sales 153 216 302 352 359 399 324 281 259 237 195 152 m_CM_a New Listings 745 593 672 608 613 611 582 514 657 587 489 343 m_CM_a Inventory 1,198 1,338 1,426 1,367 1,310 1,212 1,245 1,227 1,293 1,366 1,353 1,124 m_cm_Days on Market 55 40 43 45 48 48 47 47 49 50 50 56 m_cm_Benchmark Price 301,000 299,300 295,900 293,300 295,000 295,600 296,500 295,900 294,600 292,300 291,100 288,000 m_cm_Median Price 269,000 267,500 271,500 274,750 280,500 275,000 284,500 266,000 265,000 286,000 272,500 287,000 m_cm_Average Price 306,260 307,655 305,957 302,175 328,222 322,251 311,631 295,627 296,671 318,210 299,858 305,041 m_cm_Index 206 205 202 201 202 202 203 202 202 200 199 197
2016 01/01/16 02/01/16 03/01/16 04/01/16 05/01/16 06/01/16 07/01/16 08/01/16 09/01/16 10/01/16 11/01/16 12/01/16m_CM_a Sales 128 168 m_CM_a New Listings 600 637 m_CM_a Inventory 1,260 1,402 m_cm_Days on Market 59 50 m_cm_Benchmark Price 283,800 283,600 m_cm_Median Price 250,500 268,000 m_cm_Average Price 279,697 307,461 m_cm_Index 194 194
Feb-15 Feb-16 YTD2015 YTD2016CALGARY TOTAL SALES 02/01/15 02/01/16 02/01/15 02/01/16
m_Cytd_ >$100,000 - - - - m_Cytd_ $100,000 - $199,999 30 19 43 47 m_Cytd_ $200,000 - $299,999 103 87 186 145 m_Cytd_ $300,000 -$ 349,999 26 25 48 44 m_Cytd_ $350,000 - $399,999 23 13 34 25 m_Cytd_ $400,000 - $449,999 16 8 25 11 m_Cytd_ $450,000 - $499,999 4 6 10 8 m_Cytd_ $500,000 - $549,999 5 1 8 4 m_Cytd_ $550,000 - $599,999 1 2 2 3 m_Cytd_ $600,000 - $649,999 3 5 3 5 m_Cytd_ $650,000 - $699,999 2 - 2 1 m_Cytd_ $700,000 - $799,999 1 1 4 1 m_Cytd_ $800,000 - $899,999 - - 2 1 m_Cytd_ $900,000 - $999,999 - - - - m_Cytd_ $1,000,000 - $1,249,999 - - - - m_Cytd_ $1,250,000 - $1,499,999 1 - 1 - m_Cytd_ $1,500,000 - $1,749,999 - - - - m_Cytd_ $1,750,000 - $1,999,999 1 - 1 - m_Cytd_ $2,000,000 - $2,499,999 - 1 - 1 m_Cytd_ $2,500,000 - $2,999,999 - - - - m_Cytd_ $3,000,000 - $3,499,999 - - - - m_Cytd_ $3,500,000 - $3,999,999 - - - - m_Cytd_ $4,000,000 + - - - -
216 168 369 296
0%
10%
20%
30%
40%
50%
60%
<$200,000 $200,000 -$299,999
$300,000 -$399,999
$400,000 -$499,999
$500,000 -$599,999
$600,000 -$699,999
$700,000 -999,999
$1,000,000+
YTD FEBRUARY CALGARY SHARE OF APPARTMENT SALES BY PRICE RANGE
YTD 2013 YTD 2014 YTD 2015 YTD 2016 Source: CREB®
City of CalgaryApartment
C R E B ® C a l g a r y R e g i o n a l H o u s i n g M a r k e t S t a t i s t i c s
Page 15
0
200
400
600
800
1,000
1,200
YTD2006
YTD2007
YTD2008
YTD2009
YTD2010
YTD2011
YTD2012
YTD2013
YTD2014
YTD2015
YTD2016
YTD FEBRUARY
CALGARY APARTMENT TOTAL SALES
Apartment 10 Year AverageSource: CREB®
0
200
400
600
800
1,000
1,200
1,400
1,600
1,800
YTD2006
YTD2007
YTD2008
YTD2009
YTD2010
YTD2011
YTD2012
YTD2013
YTD2014
YTD2015
YTD2016
YTD FEBRUARY CALGARY APARTMENT TOTAL NEW LISTINGS
Apartment 10 Year AverageSource: CREB®
275,000
280,000
285,000
290,000
295,000
300,000
305,000
-
200
400
600
800
1,000
1,200
1,400
1,600
Feb.'15
Mar.'15
Apr.'15
May.'15
Jun.'15
Jul.'15
Aug.'15
Sep.'15
Oct.'15
Nov.'15
Dec.'15
Jan.'16
Feb.'16
CALGARY APARTMENT INVENTORY AND SALES
inventory Sales Benchmark Price Source: CREB®
-
1
2
3
4
5
6
7
8
9
Feb. '11 Feb. '12 Feb. '13 Feb. '14 Feb. '15 Feb. '16
CALGARY APARTMENT MONTHS OF INVENTORY
Source: CREB®
-20%
-15%
-10%
-5%
0%
5%
10%
15%
20%
25%
Feb. '11 Feb. '12 Feb. '13 Feb. '14 Feb. '15 Feb. '16
CALGARY APARTMENT PRICE CHANGE
Average Y/Y% Change Median Y/Y% change
Benchmark Y/Y% Change Source: CREB®
200,000
220,000
240,000
260,000
280,000
300,000
320,000
340,000
360,000
Feb. '11 Feb. '12 Feb. '13 Feb. '14 Feb. '15 Feb. '16
CALGARY APARTMENT PRICES
Average Price Median Price Benchmark Price Source: CREB®

AirdrieTotal Residential
C R E B ® C a l g a r y R e g i o n a l H o u s i n g M a r k e t S t a t i s t i c s
Page 16
Jan. Feb. Mar. Apr. May Jun. Jul. Aug. Sept. Oct. Nov. Dec.2015 01/01/15 02/01/15 03/01/15 04/01/15 05/01/15 06/01/15 07/01/15 08/01/15 09/01/15 10/01/15 11/01/15 12/01/15
m_AIR_RSales 64 99 137 138 152 166 163 135 118 95 89 66 m_AIR_RNew Listings 224 230 194 214 223 243 197 184 179 184 129 88 m_AIR_RInventory 287 363 359 372 367 384 364 346 346 358 331 290 m_AIR_Days on Market 41 35 39 40 38 47 41 42 50 51 47 58 m_AIR_Benchmark Price 376,200 377,300 375,000 374,100 373,900 373,900 372,400 370,200 370,700 369,000 367,000 367,100 m_AIR_Median Price 376,491 395,000 385,000 396,500 392,500 387,400 382,500 375,000 410,750 386,500 360,000 365,450 m_AIR_Average Price 368,869 398,714 379,798 394,555 395,152 394,320 394,454 380,909 416,978 392,074 378,645 369,606 m_AIR_Index 200 201 200 199 199 199 198 197 197 197 195 196
2016 01/01/16 02/01/16 03/01/16 04/01/16 05/01/16 06/01/16 07/01/16 08/01/16 09/01/16 10/01/16 11/01/16 12/01/16m_AIR_RSales 65 87 m_AIR_RNew Listings 183 205 m_AIR_RInventory 325 378 m_AIR_Days on Market 59 45 m_AIR_Benchmark Price 366,400 365,300 m_AIR_Median Price 367,900 380,000 m_AIR_Average Price 367,525 396,718 m_AIR_Index 195 195
Feb-15 Feb-16 YTD2015 YTD2016AIRDRIE TOTAL SALES 02/01/15 02/01/16 02/01/15 02/01/16
m_Aytd_ >$100,000 - - - - m_Aytd_ $100,000 - $199,999 4 4 6 7 m_Aytd_ $200,000 - $299,999 17 18 37 31 m_Aytd_ $300,000 -$ 349,999 7 13 15 25 m_Aytd_ $350,000 - $399,999 22 16 30 28 m_Aytd_ $400,000 - $449,999 18 11 30 26 m_Aytd_ $450,000 - $499,999 15 10 24 17 m_Aytd_ $500,000 - $549,999 7 5 9 5 m_Aytd_ $550,000 - $599,999 6 4 7 5 m_Aytd_ $600,000 - $649,999 3 1 5 2 m_Aytd_ $650,000 - $699,999 - 1 - 1 m_Aytd_ $700,000 - $799,999 - 1 - 1 m_Aytd_ $800,000 - $899,999 - 2 - 3 m_Aytd_ $900,000 - $999,999 - 1 - 1 m_Aytd_ $1,000,000 - $1,249,999 - - - - m_Aytd_ $1,250,000 - $1,499,999 - - - - m_Aytd_ $1,500,000 - $1,749,999 - - - - m_Aytd_ $1,750,000 - $1,999,999 - - - - m_Aytd_ $2,000,000 - $2,499,999 - - - - m_Aytd_ $2,500,000 - $2,999,999 - - - - m_Aytd_ $3,000,000 - $3,499,999 - - - - m_Aytd_ $3,500,000 - $3,999,999 - - - - m_Aytd_ $4,000,000 + - - - -
99 87 163 152
0%
5%
10%
15%
20%
25%
30%
35%
40%
45%
<$200,000 $200,000 -$299,999
$300,000 -$399,999
$400,000 -$499,999
$500,000 -$599,999
$600,000 -$699,999
$700,000 -999,999
$1,000,000+
YTD FEBRUARY AIRDRIE SHARE OF SALES BY PRICE RANGE
YTD 2013 YTD 2014 YTD 2015 YTD 2016 Source: CREB®

AirdrieTotal Residential
C R E B ® C a l g a r y R e g i o n a l H o u s i n g M a r k e t S t a t i s t i c s
Page 17
0
50
100
150
200
250
300
YTD2006
YTD2007
YTD2008
YTD2009
YTD2010
YTD2011
YTD2012
YTD2013
YTD2014
YTD2015
YTD2016
YTD FEBRUARY
AIRDRIE TOTAL SALES
Total Residential 10 Year AverageSource: CREB®
050
100150200250300350400450500
YTD2006
YTD2007
YTD2008
YTD2009
YTD2010
YTD2011
YTD2012
YTD2013
YTD2014
YTD2015
YTD2016
YTD FEBRUARY AIRDRIE TOTAL NEW LISTINGS
Total Residential 10 Year AverageSource: CREB®
358,000 360,000 362,000 364,000 366,000 368,000 370,000 372,000 374,000 376,000 378,000 380,000
-
50
100
150
200
250
300
350
400
450
Feb.'15
Mar.'15
Apr.'15
May.'15
Jun.'15
Jul.'15
Aug.'15
Sep.'15
Oct.'15
Nov.'15
Dec.'15
Jan.'16
Feb.'16
AIRDRIE INVENTORY AND SALES
inventory Sales Benchmark Price Source: CREB®
-
1
2
3
4
5
6
7
Feb. '11 Feb. '12 Feb. '13 Feb. '14 Feb. '15 Feb. '16
AIRDRIE MONTHS OF INVENTORY
Source: CREB®
-15%
-10%
-5%
0%
5%
10%
15%
20%
Feb. '11 Feb. '12 Feb. '13 Feb. '14 Feb. '15 Feb. '16
AIRDRIE PRICE CHANGE
Average Y/Y% Change Median Y/Y% change
Benchmark Y/Y% Change Source: CREB®
250,000
270,000
290,000
310,000
330,000
350,000
370,000
390,000
410,000
430,000
Feb. '11 Feb. '12 Feb. '13 Feb. '14 Feb. '15 Feb. '16
AIRDRIE PRICES
Average Price Median Price Benchmark Price Source: CREB®

Region of RockyviewTotal Residential
C R E B ® C a l g a r y R e g i o n a l H o u s i n g M a r k e t S t a t i s t i c s
Page 18
Jan. Feb. Mar. Apr. May Jun. Jul. Aug. Sept. Oct. Nov. Dec.2015 01/01/15 02/01/15 03/01/15 04/01/15 05/01/15 06/01/15 07/01/15 08/01/15 09/01/15 10/01/15 11/01/15 12/01/15
m_mdrv_Sales 78 78 118 141 174 198 153 129 94 129 104 76 m_mdrv_New Listings 288 256 317 311 298 311 294 281 283 238 201 146 m_mdrv_Inventory 652 735 808 848 874 837 837 834 865 812 751 632 m_mdrvDays on Market 76 57 60 60 54 68 66 53 68 58 78 77 m_mdrvBenchmark Price 558,700 562,100 575,700 570,700 564,200 565,200 563,300 557,700 567,300 552,500 554,300 548,200 m_mdrvMedian Price 478,750 497,500 486,000 465,000 500,000 515,000 495,500 485,000 445,000 462,500 514,850 472,500 m_mdrvAverage Price 625,531 650,157 601,304 569,824 610,111 645,612 584,906 554,722 548,404 563,345 600,602 598,074 m_mdrvIndex 181 182 186 185 183 183 182 181 184 179 179 177
2016 01/01/16 02/01/16 03/01/16 04/01/16 05/01/16 06/01/16 07/01/16 08/01/16 09/01/16 10/01/16 11/01/16 12/01/16m_mdrv_Sales 58 95 m_mdrv_New Listings 259 263 m_mdrv_Inventory 705 761 m_mdrvDays on Market 73 69 m_mdrvBenchmark Price 542,000 524,700 m_mdrvMedian Price 427,500 415,000 m_mdrvAverage Price 472,715 478,191 m_mdrvIndex 175 170
Feb-15 Feb-16 YTD2015 YTD2016ROCKYVIEW TOTAL SALE 02/01/15 02/01/16 02/01/15 02/01/16
m_mytd_ >$100,000 - - - 1 m_mytd_ $100,000 - $199,999 - 5 1 6 m_mytd_ $200,000 - $299,999 11 9 22 14 m_mytd_ $300,000 -$ 349,999 5 20 7 27 m_mytd_ $350,000 - $399,999 7 11 15 22 m_mytd_ $400,000 - $449,999 7 10 19 18 m_mytd_ $450,000 - $499,999 9 6 20 13 m_mytd_ $500,000 - $549,999 7 5 11 8 m_mytd_ $550,000 - $599,999 4 7 10 13 m_mytd_ $600,000 - $649,999 4 3 6 4 m_mytd_ $650,000 - $699,999 4 6 6 9 m_mytd_ $700,000 - $799,999 3 2 6 2 m_mytd_ $800,000 - $899,999 4 3 11 6 m_mytd_ $900,000 - $999,999 2 5 3 5 m_mytd_ $1,000,000 - $1,249,999 5 2 9 2 m_mytd_ $1,250,000 - $1,499,999 2 1 3 3 m_mytd_ $1,500,000 - $1,749,999 1 - 1 - m_mytd_ $1,750,000 - $1,999,999 - - - - m_mytd_ $2,000,000 - $2,499,999 2 - 3 - m_mytd_ $2,500,000 - $2,999,999 - - - - m_mytd_ $3,000,000 - $3,499,999 1 - 3 - m_mytd_ $3,500,000 - $3,999,999 - - - - m_mytd_ $4,000,000 + - - - -
78 95 156 153
0%
5%
10%
15%
20%
25%
30%
35%
<$200,000 $200,000 -$299,999
$300,000 -$399,999
$400,000 -$499,999
$500,000 -$599,999
$600,000 -$699,999
$700,000 -999,999
$1,000,000+
YTD FEBRUARY ROCKYVIEW SHARE OF SALES BY PRICE RANGE
YTD 2013 YTD 2014 YTD 2015 YTD 2016 Source: CREB®

Region of RockyviewTotal Residential
C R E B ® C a l g a r y R e g i o n a l H o u s i n g M a r k e t S t a t i s t i c s
Page 19
0
50
100
150
200
250
300
YTD2006
YTD2007
YTD2008
YTD2009
YTD2010
YTD2011
YTD2012
YTD2013
YTD2014
YTD2015
YTD2016
YTD FEBRUARY
ROCKYVIEW TOTAL SALES
Total Residential 10 Year AverageSource: CREB®
0
100
200
300
400
500
600
YTD2006
YTD2007
YTD2008
YTD2009
YTD2010
YTD2011
YTD2012
YTD2013
YTD2014
YTD2015
YTD2016
YTD FEBRUARY ROCKYVIEW TOTAL NEW LISTINGS
Total Residential 10 Year AverageSource: CREB®
490,000
500,000
510,000
520,000
530,000
540,000
550,000
560,000
570,000
580,000
-
100
200
300
400
500
600
700
800
900
1,000
Feb.'15
Mar.'15
Apr.'15
May.'15
Jun.'15
Jul.'15
Aug.'15
Sep.'15
Oct.'15
Nov.'15
Dec.'15
Jan.'16
Feb.'16
ROCKYVIEW INVENTORY AND SALES
inventory Sales Benchmark Price Source: CREB®
-
2
4
6
8
10
12
Feb. '11 Feb. '12 Feb. '13 Feb. '14 Feb. '15 Feb. '16
ROCKYVIEW MONTHS OF INVENTORY
Source: CREB®
-30%
-20%
-10%
0%
10%
20%
30%
40%
Feb. '11 Feb. '12 Feb. '13 Feb. '14 Feb. '15 Feb. '16
ROCKYVIEW PRICE CHANGE
Average Y/Y% Change Median Y/Y% change
Benchmark Y/Y% Change Source: CREB®
250,000
300,000
350,000
400,000
450,000
500,000
550,000
600,000
650,000
700,000
Feb. '11 Feb. '12 Feb. '13 Feb. '14 Feb. '15 Feb. '16
ROCKYVIEW PRICES
Average Price Median Price Benchmark Price Source: CREB®
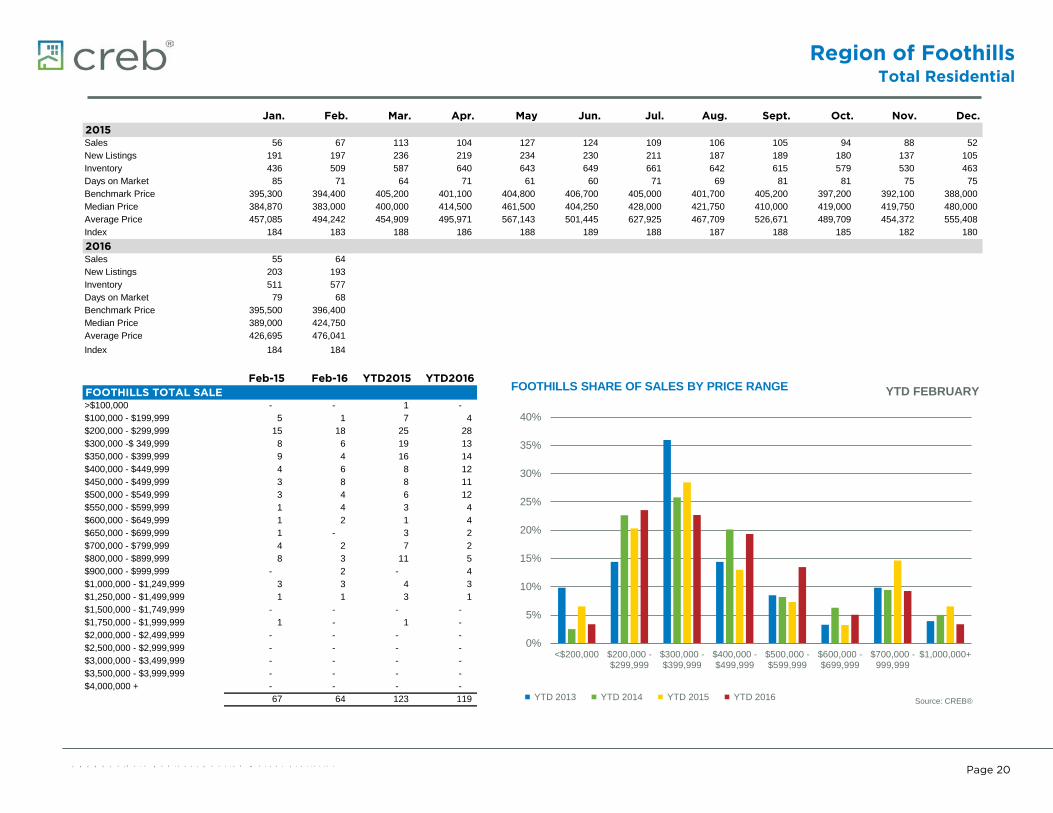
Region of FoothillsTotal Residential
C R E B ® C a l g a r y R e g i o n a l H o u s i n g M a r k e t S t a t i s t i c s
Page 20
Jan. Feb. Mar. Apr. May Jun. Jul. Aug. Sept. Oct. Nov. Dec.2015 01/01/15 02/01/15 03/01/15 04/01/15 05/01/15 06/01/15 07/01/15 08/01/15 09/01/15 10/01/15 11/01/15 12/01/15
m_mdFHSales 56 67 113 104 127 124 109 106 105 94 88 52 m_mdFHNew Listings 191 197 236 219 234 230 211 187 189 180 137 105 m_mdFHInventory 436 509 587 640 643 649 661 642 615 579 530 463 m_mdFDays on Market 85 71 64 71 61 60 71 69 81 81 75 75 m_mdFBenchmark Price 395,300 394,400 405,200 401,100 404,800 406,700 405,000 401,700 405,200 397,200 392,100 388,000 m_mdFMedian Price 384,870 383,000 400,000 414,500 461,500 404,250 428,000 421,750 410,000 419,000 419,750 480,000 m_mdFAverage Price 457,085 494,242 454,909 495,971 567,143 501,445 627,925 467,709 526,671 489,709 454,372 555,408 m_mdFIndex 184 183 188 186 188 189 188 187 188 185 182 180
2016 01/01/16 02/01/16 03/01/16 04/01/16 05/01/16 06/01/16 07/01/16 08/01/16 09/01/16 10/01/16 11/01/16 12/01/16m_mdFHSales 55 64 m_mdFHNew Listings 203 193 m_mdFHInventory 511 577 m_mdFDays on Market 79 68 m_mdFBenchmark Price 395,500 396,400 m_mdFMedian Price 389,000 424,750 m_mdFAverage Price 426,695 476,041 m_mdFIndex 184 184
Feb-15 Feb-16 YTD2015 YTD2016FOOTHILLS TOTAL SALES 02/01/15 02/01/16 02/01/15 02/01/16
m_mytd_ >$100,000 - - 1 - m_mytd_ $100,000 - $199,999 5 1 7 4 m_mytd_ $200,000 - $299,999 15 18 25 28 m_mytd_ $300,000 -$ 349,999 8 6 19 13 m_mytd_ $350,000 - $399,999 9 4 16 14 m_mytd_ $400,000 - $449,999 4 6 8 12 m_mytd_ $450,000 - $499,999 3 8 8 11 m_mytd_ $500,000 - $549,999 3 4 6 12 m_mytd_ $550,000 - $599,999 1 4 3 4 m_mytd_ $600,000 - $649,999 1 2 1 4 m_mytd_ $650,000 - $699,999 1 - 3 2 m_mytd_ $700,000 - $799,999 4 2 7 2 m_mytd_ $800,000 - $899,999 8 3 11 5 m_mytd_ $900,000 - $999,999 - 2 - 4 m_mytd_ $1,000,000 - $1,249,999 3 3 4 3 m_mytd_ $1,250,000 - $1,499,999 1 1 3 1 m_mytd_ $1,500,000 - $1,749,999 - - - - m_mytd_ $1,750,000 - $1,999,999 1 - 1 - m_mytd_ $2,000,000 - $2,499,999 - - - - m_mytd_ $2,500,000 - $2,999,999 - - - - m_mytd_ $3,000,000 - $3,499,999 - - - - m_mytd_ $3,500,000 - $3,999,999 - - - - m_mytd_ $4,000,000 + - - - -
67 64 123 119
0%
5%
10%
15%
20%
25%
30%
35%
40%
<$200,000 $200,000 -$299,999
$300,000 -$399,999
$400,000 -$499,999
$500,000 -$599,999
$600,000 -$699,999
$700,000 -999,999
$1,000,000+
YTD FEBRUARY FOOTHILLS SHARE OF SALES BY PRICE RANGE
YTD 2013 YTD 2014 YTD 2015 YTD 2016 Source: CREB®

Region of FoothillsTotal Residential
C R E B ® C a l g a r y R e g i o n a l H o u s i n g M a r k e t S t a t i s t i c s
Page 21
0
50
100
150
200
250
300
YTD2006
YTD2007
YTD2008
YTD2009
YTD2010
YTD2011
YTD2012
YTD2013
YTD2014
YTD2015
YTD2016
YTD FEBRUARY
FOOTHILLS TOTAL SALES
Total Residential 10 Year AverageSource: CREB®
0
100
200
300
400
500
600
700
YTD2006
YTD2007
YTD2008
YTD2009
YTD2010
YTD2011
YTD2012
YTD2013
YTD2014
YTD2015
YTD2016
YTD FEBRUARY FOOTHILLS TOTAL NEW LISTINGS
Total Residential 10 Year AverageSource: CREB®
375,000
380,000
385,000
390,000
395,000
400,000
405,000
410,000
-
100
200
300
400
500
600
700
Feb.'15
Mar.'15
Apr.'15
May.'15
Jun.'15
Jul.'15
Aug.'15
Sep.'15
Oct.'15
Nov.'15
Dec.'15
Jan.'16
Feb.'16
FOOTHILLS INVENTORY AND SALES
inventory Sales Benchmark Price Source: CREB®
-
1
2
3
4
5
6
7
8
9
10
Feb. '11 Feb. '12 Feb. '13 Feb. '14 Feb. '15 Feb. '16
FOOTHILLS MONTHS OF INVENTORY
Source: CREB®
-30%
-20%
-10%
0%
10%
20%
30%
40%
Feb. '11 Feb. '12 Feb. '13 Feb. '14 Feb. '15 Feb. '16
FOOTHILLS PRICE CHANGE
Average Y/Y% Change Median Y/Y% change
Benchmark Y/Y% Change Source: CREB®
250,000
300,000
350,000
400,000
450,000
500,000
550,000
600,000
650,000
Feb. '11 Feb. '12 Feb. '13 Feb. '14 Feb. '15 Feb. '16
FOOTHILLS PRICES
Average Price Median Price Benchmark Price Source: CREB®
Surrounding AreaTotal Residential
C R E B ® C a l g a r y R e g i o n a l H o u s i n g M a r k e t S t a t i s t i c s
Page 22
Jan. Feb. Mar. Apr. May Jun. Jul. Aug. Sept. Oct. Nov. Dec.2015 01/01/15 02/01/15 03/01/15 04/01/15 05/01/15 06/01/15 07/01/15 08/01/15 09/01/15 10/01/15 11/01/15 12/01/15
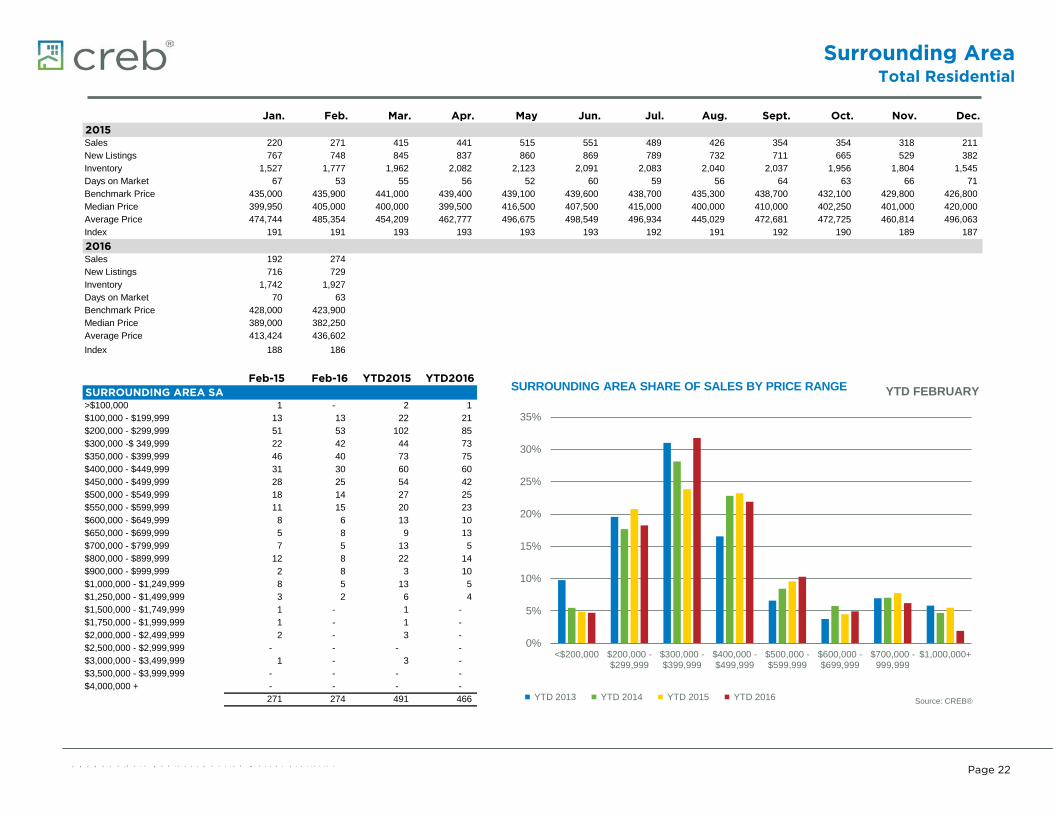
m_SA_R Sales 220 271 415 441 515 551 489 426 354 354 318 211 m_SA_R New Listings 767 748 845 837 860 869 789 732 711 665 529 382 m_SA_R Inventory 1,527 1,777 1,962 2,082 2,123 2,091 2,083 2,040 2,037 1,956 1,804 1,545 m_SA_Days on Market 67 53 55 56 52 60 59 56 64 63 66 71 m_SA_Benchmark Price 435,000 435,900 441,000 439,400 439,100 439,600 438,700 435,300 438,700 432,100 429,800 426,800 m_SA_Median Price 399,950 405,000 400,000 399,500 416,500 407,500 415,000 400,000 410,000 402,250 401,000 420,000 m_SA_Average Price 474,744 485,354 454,209 462,777 496,675 498,549 496,934 445,029 472,681 472,725 460,814 496,063 m_SA_Index 191 191 193 193 193 193 192 191 192 190 189 187
2016 01/01/16 02/01/16 03/01/16 04/01/16 05/01/16 06/01/16 07/01/16 08/01/16 09/01/16 10/01/16 11/01/16 12/01/16m_SA_R Sales 192 274 m_SA_R New Listings 716 729 m_SA_R Inventory 1,742 1,927 m_SA_Days on Market 70 63 m_SA_Benchmark Price 428,000 423,900 m_SA_Median Price 389,000 382,250 m_SA_Average Price 413,424 436,602 m_SA_Index 188 186
Feb-15 Feb-16 YTD2015 YTD2016SURROUNDING AREA SA 02/01/15 02/01/16 02/01/15 02/01/16
m_Sytd_ >$100,000 1 - 2 1 m_Sytd_ $100,000 - $199,999 13 13 22 21 m_Sytd_ $200,000 - $299,999 51 53 102 85 m_Sytd_ $300,000 -$ 349,999 22 42 44 73 m_Sytd_ $350,000 - $399,999 46 40 73 75 m_Sytd_ $400,000 - $449,999 31 30 60 60 m_Sytd_ $450,000 - $499,999 28 25 54 42 m_Sytd_ $500,000 - $549,999 18 14 27 25 m_Sytd_ $550,000 - $599,999 11 15 20 23 m_Sytd_ $600,000 - $649,999 8 6 13 10 m_Sytd_ $650,000 - $699,999 5 8 9 13 m_Sytd_ $700,000 - $799,999 7 5 13 5 m_Sytd_ $800,000 - $899,999 12 8 22 14 m_Sytd_ $900,000 - $999,999 2 8 3 10 m_Sytd_ $1,000,000 - $1,249,999 8 5 13 5 m_Sytd_ $1,250,000 - $1,499,999 3 2 6 4 m_Sytd_ $1,500,000 - $1,749,999 1 - 1 - m_Sytd_ $1,750,000 - $1,999,999 1 - 1 - m_Sytd_ $2,000,000 - $2,499,999 2 - 3 - m_Sytd_ $2,500,000 - $2,999,999 - - - - m_Sytd_ $3,000,000 - $3,499,999 1 - 3 - m_Sytd_ $3,500,000 - $3,999,999 - - - - m_Sytd_ $4,000,000 + - - - -
271 274 491 466
0%
5%
10%
15%
20%
25%
30%
35%
<$200,000 $200,000 -$299,999
$300,000 -$399,999
$400,000 -$499,999
$500,000 -$599,999
$600,000 -$699,999
$700,000 -999,999
$1,000,000+
YTD FEBRUARY SURROUNDING AREA SHARE OF SALES BY PRICE RANGE
YTD 2013 YTD 2014 YTD 2015 YTD 2016 Source: CREB®

Surrounding AreaTotal Residential
C R E B ® C a l g a r y R e g i o n a l H o u s i n g M a r k e t S t a t i s t i c s
Page 23
0
100
200
300
400
500
600
700
800
900
YTD2006
YTD2007
YTD2008
YTD2009
YTD2010
YTD2011
YTD2012
YTD2013
YTD2014
YTD2015
YTD2016
YTD FEBRUARY
SURROUNDING AREA SALES
Total Residential 10 Year AverageSource: CREB®
0200400600800
1,0001,2001,4001,6001,8002,000
YTD2006
YTD2007
YTD2008
YTD2009
YTD2010
YTD2011
YTD2012
YTD2013
YTD2014
YTD2015
YTD2016
YTD FEBRUARY SURROUNDING AREA NEW LISTINGS
Total Residential 10 Year AverageSource: CREB®
415,000
420,000
425,000
430,000
435,000
440,000
445,000
-
500
1,000
1,500
2,000
2,500
Feb.'15
Mar.'15
Apr.'15
May.'15
Jun.'15
Jul.'15
Aug.'15
Sep.'15
Oct.'15
Nov.'15
Dec.'15
Jan.'16
Feb.'16
SURROUNDING AREA INVENTORY AND SALES
inventory Sales Benchmark Price Source: CREB®
-
1
2
3
4
5
6
7
8
9
10
Feb. '11 Feb. '12 Feb. '13 Feb. '14 Feb. '15 Feb. '16
SURROUNDING AREA MONTHS OF INVENTORY
Source: CREB®
-20%
-15%
-10%
-5%
0%
5%
10%
15%
20%
25%
Feb. '11 Feb. '12 Feb. '13 Feb. '14 Feb. '15 Feb. '16
SURROUNDING AREA PRICE CHANGE
Average Y/Y% Change Median Y/Y% change
Benchmark Y/Y% Change Source: CREB®
250,000
300,000
350,000
400,000
450,000
500,000
550,000
Feb. '11 Feb. '12 Feb. '13 Feb. '14 Feb. '15 Feb. '16
SURROUNDING AREA PRICES
Average Price Median Price Benchmark Price Source: CREB®
Economic RegionTotal Residential
C R E B ® C a l g a r y R e g i o n a l H o u s i n g M a r k e t S t a t i s t i c s
Page 24
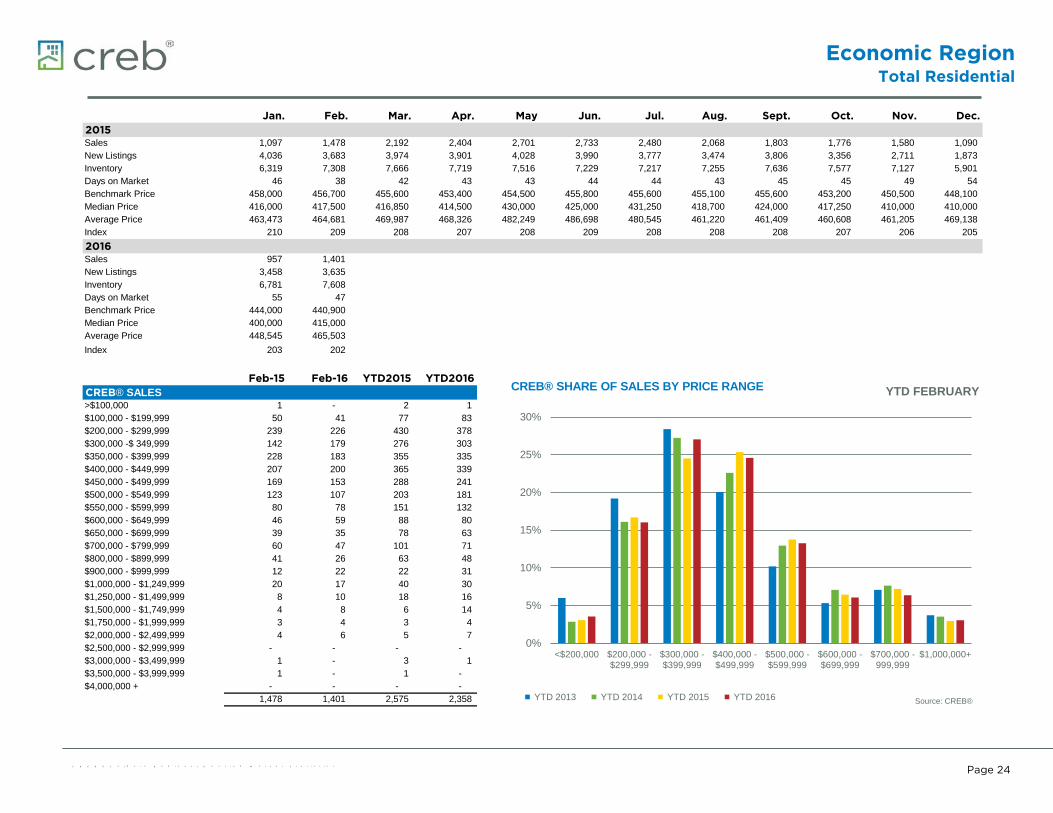
Jan. Feb. Mar. Apr. May Jun. Jul. Aug. Sept. Oct. Nov. Dec.2015 01/01/15 02/01/15 03/01/15 04/01/15 05/01/15 06/01/15 07/01/15 08/01/15 09/01/15 10/01/15 11/01/15 12/01/15
m_CREBSales 1,097 1,478 2,192 2,404 2,701 2,733 2,480 2,068 1,803 1,776 1,580 1,090 m_CREBNew Listings 4,036 3,683 3,974 3,901 4,028 3,990 3,777 3,474 3,806 3,356 2,711 1,873 m_CREBInventory 6,319 7,308 7,666 7,719 7,516 7,229 7,217 7,255 7,636 7,577 7,127 5,901 m_CREDays on Market 46 38 42 43 43 44 44 43 45 45 49 54 m_CREBenchmark Price 458,000 456,700 455,600 453,400 454,500 455,800 455,600 455,100 455,600 453,200 450,500 448,100 m_CREMedian Price 416,000 417,500 416,850 414,500 430,000 425,000 431,250 418,700 424,000 417,250 410,000 410,000 m_CREAverage Price 463,473 464,681 469,987 468,326 482,249 486,698 480,545 461,220 461,409 460,608 461,205 469,138 m_CREIndex 210 209 208 207 208 209 208 208 208 207 206 205
2016 01/01/16 02/01/16 03/01/16 04/01/16 05/01/16 06/01/16 07/01/16 08/01/16 09/01/16 10/01/16 11/01/16 12/01/16m_CREBSales 957 1,401 m_CREBNew Listings 3,458 3,635 m_CREBInventory 6,781 7,608 m_CREDays on Market 55 47 m_CREBenchmark Price 444,000 440,900 m_CREMedian Price 400,000 415,000 m_CREAverage Price 448,545 465,503 m_CREIndex 203 202
Feb-15 Feb-16 YTD2015 YTD2016CREB® SALES 02/01/15 02/01/16 02/01/15 02/01/16
m_Cytd_ >$100,000 1 - 2 1 m_Cytd_ $100,000 - $199,999 50 41 77 83 m_Cytd_ $200,000 - $299,999 239 226 430 378 m_Cytd_ $300,000 -$ 349,999 142 179 276 303 m_Cytd_ $350,000 - $399,999 228 183 355 335 m_Cytd_ $400,000 - $449,999 207 200 365 339 m_Cytd_ $450,000 - $499,999 169 153 288 241 m_Cytd_ $500,000 - $549,999 123 107 203 181 m_Cytd_ $550,000 - $599,999 80 78 151 132 m_Cytd_ $600,000 - $649,999 46 59 88 80 m_Cytd_ $650,000 - $699,999 39 35 78 63 m_Cytd_ $700,000 - $799,999 60 47 101 71 m_Cytd_ $800,000 - $899,999 41 26 63 48 m_Cytd_ $900,000 - $999,999 12 22 22 31 m_Cytd_ $1,000,000 - $1,249,999 20 17 40 30 m_Cytd_ $1,250,000 - $1,499,999 8 10 18 16 m_Cytd_ $1,500,000 - $1,749,999 4 8 6 14 m_Cytd_ $1,750,000 - $1,999,999 3 4 3 4 m_Cytd_ $2,000,000 - $2,499,999 4 6 5 7 m_Cytd_ $2,500,000 - $2,999,999 - - - - m_Cytd_ $3,000,000 - $3,499,999 1 - 3 1 m_Cytd_ $3,500,000 - $3,999,999 1 - 1 - m_Cytd_ $4,000,000 + - - - -
1,478 1,401 2,575 2,358
0%
5%
10%
15%
20%
25%
30%
<$200,000 $200,000 -$299,999
$300,000 -$399,999
$400,000 -$499,999
$500,000 -$599,999
$600,000 -$699,999
$700,000 -999,999
$1,000,000+
YTD FEBRUARY CREB® SHARE OF SALES BY PRICE RANGE
YTD 2013 YTD 2014 YTD 2015 YTD 2016 Source: CREB®
Economic RegionTotal Residential
C R E B ® C a l g a r y R e g i o n a l H o u s i n g M a r k e t S t a t i s t i c s
Page 25
0
1,000
2,000
3,000
4,000
5,000
6,000
7,000
YTD2006
YTD2007
YTD2008
YTD2009
YTD2010
YTD2011
YTD2012
YTD2013
YTD2014
YTD2015
YTD2016
YTD FEBRUARY
CREB® SALES
Total Residential 10 Year AverageSource: CREB®
0
2,000
4,000
6,000
8,000
10,000
12,000
YTD2006
YTD2007
YTD2008
YTD2009
YTD2010
YTD2011
YTD2012
YTD2013
YTD2014
YTD2015
YTD2016
YTD FEBRUARY CREB® NEW LISTINGS
Total Residential 10 Year AverageSource: CREB®
430,000
435,000
440,000
445,000
450,000
455,000
460,000
-
1,000
2,000
3,000
4,000
5,000
6,000
7,000
8,000
9,000
Feb.'15
Mar.'15
Apr.'15
May.'15
Jun.'15
Jul.'15
Aug.'15
Sep.'15
Oct.'15
Nov.'15
Dec.'15
Jan.'16
Feb.'16
CREB® INVENTORY AND SALES
inventory Sales Benchmark Price Source: CREB®
-
1
2
3
4
5
6
7
Feb. '11 Feb. '12 Feb. '13 Feb. '14 Feb. '15 Feb. '16
CREB® MONTHS OF INVENTORY
Source: CREB®
-8%-6%-4%-2%0%2%4%6%8%
10%12%
Feb. '11 Feb. '12 Feb. '13 Feb. '14 Feb. '15 Feb. '16
CREB® PRICE CHANGE
Average Y/Y% Change Median Y/Y% change
Benchmark Y/Y% Change Source: CREB®
250,000
300,000
350,000
400,000
450,000
500,000
550,000
Feb. '11 Feb. '12 Feb. '13 Feb. '14 Feb. '15 Feb. '16
CREB® PRICES
Average Price Median Price Benchmark Price Source: CREB®
Caglary CMATotal Residential
C R E B ® C a l g a r y R e g i o n a l H o u s i n g M a r k e t S t a t i s t i c s
Page 26
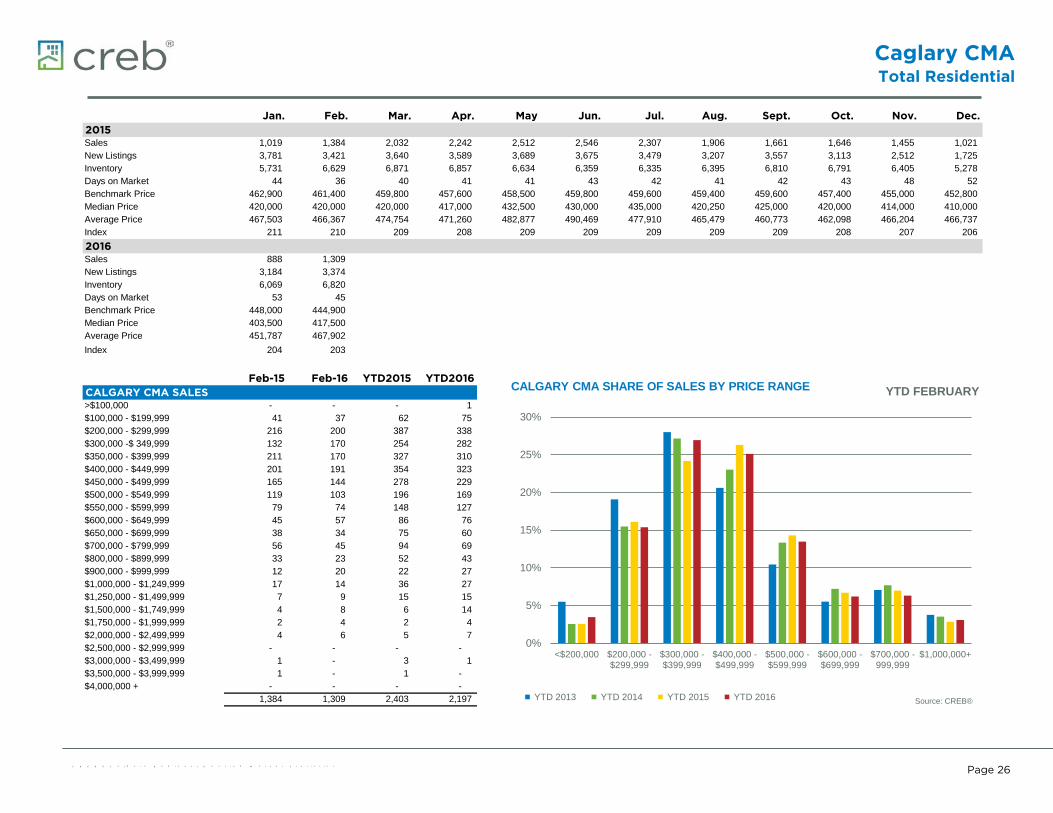
Jan. Feb. Mar. Apr. May Jun. Jul. Aug. Sept. Oct. Nov. Dec.2015 01/01/15 02/01/15 03/01/15 04/01/15 05/01/15 06/01/15 07/01/15 08/01/15 09/01/15 10/01/15 11/01/15 12/01/15
m_Cma_Sales 1,019 1,384 2,032 2,242 2,512 2,546 2,307 1,906 1,661 1,646 1,455 1,021 m_Cma_New Listings 3,781 3,421 3,640 3,589 3,689 3,675 3,479 3,207 3,557 3,113 2,512 1,725 m_Cma_Inventory 5,731 6,629 6,871 6,857 6,634 6,359 6,335 6,395 6,810 6,791 6,405 5,278 m_CmaDays on Market 44 36 40 41 41 43 42 41 42 43 48 52 m_CmaBenchmark Price 462,900 461,400 459,800 457,600 458,500 459,800 459,600 459,400 459,600 457,400 455,000 452,800 m_CmaMedian Price 420,000 420,000 420,000 417,000 432,500 430,000 435,000 420,250 425,000 420,000 414,000 410,000 m_CmaAverage Price 467,503 466,367 474,754 471,260 482,877 490,469 477,910 465,479 460,773 462,098 466,204 466,737 m_CmaIndex 211 210 209 208 209 209 209 209 209 208 207 206
2016 01/01/16 02/01/16 03/01/16 04/01/16 05/01/16 06/01/16 07/01/16 08/01/16 09/01/16 10/01/16 11/01/16 12/01/16m_Cma_Sales 888 1,309 m_Cma_New Listings 3,184 3,374 m_Cma_Inventory 6,069 6,820 m_CmaDays on Market 53 45 m_CmaBenchmark Price 448,000 444,900 m_CmaMedian Price 403,500 417,500 m_CmaAverage Price 451,787 467,902 m_CmaIndex 204 203
Feb-15 Feb-16 YTD2015 YTD2016CALGARY CMA SALES 02/01/15 02/01/16 02/01/15 02/01/16
m_Cytd_ >$100,000 - - - 1 m_Cytd_ $100,000 - $199,999 41 37 62 75 m_Cytd_ $200,000 - $299,999 216 200 387 338 m_Cytd_ $300,000 -$ 349,999 132 170 254 282 m_Cytd_ $350,000 - $399,999 211 170 327 310 m_Cytd_ $400,000 - $449,999 201 191 354 323 m_Cytd_ $450,000 - $499,999 165 144 278 229 m_Cytd_ $500,000 - $549,999 119 103 196 169 m_Cytd_ $550,000 - $599,999 79 74 148 127 m_Cytd_ $600,000 - $649,999 45 57 86 76 m_Cytd_ $650,000 - $699,999 38 34 75 60 m_Cytd_ $700,000 - $799,999 56 45 94 69 m_Cytd_ $800,000 - $899,999 33 23 52 43 m_Cytd_ $900,000 - $999,999 12 20 22 27 m_Cytd_ $1,000,000 - $1,249,999 17 14 36 27 m_Cytd_ $1,250,000 - $1,499,999 7 9 15 15 m_Cytd_ $1,500,000 - $1,749,999 4 8 6 14 m_Cytd_ $1,750,000 - $1,999,999 2 4 2 4 m_Cytd_ $2,000,000 - $2,499,999 4 6 5 7 m_Cytd_ $2,500,000 - $2,999,999 - - - - m_Cytd_ $3,000,000 - $3,499,999 1 - 3 1 m_Cytd_ $3,500,000 - $3,999,999 1 - 1 - m_Cytd_ $4,000,000 + - - - -
1,384 1,309 2,403 2,197
0%
5%
10%
15%
20%
25%
30%
<$200,000 $200,000 -$299,999
$300,000 -$399,999
$400,000 -$499,999
$500,000 -$599,999
$600,000 -$699,999
$700,000 -999,999
$1,000,000+
YTD FEBRUARY CALGARY CMA SHARE OF SALES BY PRICE RANGE
YTD 2013 YTD 2014 YTD 2015 YTD 2016 Source: CREB®

Calgary CMATotal Residential
C R E B ® C a l g a r y R e g i o n a l H o u s i n g M a r k e t S t a t i s t i c s
Page 27
0
1,000
2,000
3,000
4,000
5,000
6,000
YTD2006
YTD2007
YTD2008
YTD2009
YTD2010
YTD2011
YTD2012
YTD2013
YTD2014
YTD2015
YTD2016
YTD FEBRUARY
CALGARY CMA SALES
Total Residential 10 Year AverageSource: CREB®
01,0002,0003,0004,0005,0006,0007,0008,0009,000
10,000
YTD2006
YTD2007
YTD2008
YTD2009
YTD2010
YTD2011
YTD2012
YTD2013
YTD2014
YTD2015
YTD2016
YTD FEBRUARY CALGARY CMA NEW LISTINGS
Total Residential 10 Year AverageSource: CREB®
435,000
440,000
445,000
450,000
455,000
460,000
465,000
-
1,000
2,000
3,000
4,000
5,000
6,000
7,000
8,000
Feb.'15
Mar.'15
Apr.'15
May.'15
Jun.'15
Jul.'15
Aug.'15
Sep.'15
Oct.'15
Nov.'15
Dec.'15
Jan.'16
Feb.'16
CALGARY CMA INVENTORY AND SALES
inventory Sales Benchmark Price Source: CREB®
-
1
2
3
4
5
6
7
Feb. '11 Feb. '12 Feb. '13 Feb. '14 Feb. '15 Feb. '16
CALGARY CMA MONTHS OF INVENTORY
Source: CREB®
-8%-6%-4%-2%0%2%4%6%8%
10%12%14%
Feb. '11 Feb. '12 Feb. '13 Feb. '14 Feb. '15 Feb. '16
CALGARY CMA PRICE CHANGE
Average Y/Y% Change Median Y/Y% change
Benchmark Y/Y% Change Source: CREB®
250,000
300,000
350,000
400,000
450,000
500,000
550,000
Feb. '11 Feb. '12 Feb. '13 Feb. '14 Feb. '15 Feb. '16
CALGARY CMA PRICES
Average Price Median Price Benchmark Price Source: CREB®

C R E B ® C a l g a r y R e g i o n a l H o u s i n g M a r k e t S t a t i s t i c s
Page 28
DEFINITIONS
Total Residential - includes detached, attached and apartment style properties.Active Listings - Actual figures were used as of January 2015, previous figures represent estimated figures.Benchmark Price - Represent the monthly price of the typical home based on it's attributes, providing the best measure of price trends.MLS® Home Price Index – changes in home prices by comparing current price levels relative to January 2005 price level. Exclusions – Data included in this package do not include activity related to rental, land or leased properties.Absorption Rate – refers to the ratio between the amounts of sales occurring in the market relative to the amount of listings. For example a ratio of 60 per cent indicates for every 10 listings 6 are being sold. This is useful in determining market tightness.Detached - A unit that is not attached to any other unit.Attached - A unit that is attached to another unit by at least one common wall.Apartment - An attached unit that has connecting enclosed hallways.
ABOUT CREB®
CREB® is a professional body of more than 5,100 licensed brokers and registered associates, representing 245 member offices. CREB® is dedicated to enhancing the value, integrity and expertise of its REALTOR® members. Our REALTORS® are committed to a high standard of professional conduct, ongoing education, and a strict Code of Ethics and standards of business practice. For Calgary Metro, CREB® statistics include only Zone A, B, C and D for properties located in Calgary. Furthermore, all historical data has been adjusted to the most current information. Any use or reference to CREB® data and statistics must acknowledge CREB® as the source. The board does not generate statistics or analysis of any individual member or company’s market share. All MLS® active listings for Calgary and area may be found on the board’s website at www.creb.com. CREB® is a registered trademark of the Calgary Real Estate Board Cooperative. The trademarks MLS® and Multiple Listing
Calgary CMA - includes City of Calgary, Airdrie and the Region of Rockyview Rockyview - includes all activity in the geographical area excluding Airdire City of Calgary - includes all residential activity within city limits Foothills - includes all residential activity within the Foothills area border Other Active Areas - includes Didsbury, Cremona, Carstairs, Strathmore, Vulcan