Embed Size (px)
Citation preview

CHENNAIRESIDENTIAL & OFFICEJULY TO DECEMBER 2017

2
RESIDENTIAL RECAP H1 2017
Low sales velocity
High unsold inventory
Expectation of further price
reductions and inadequate
RERA implementation keep
buyers away
3
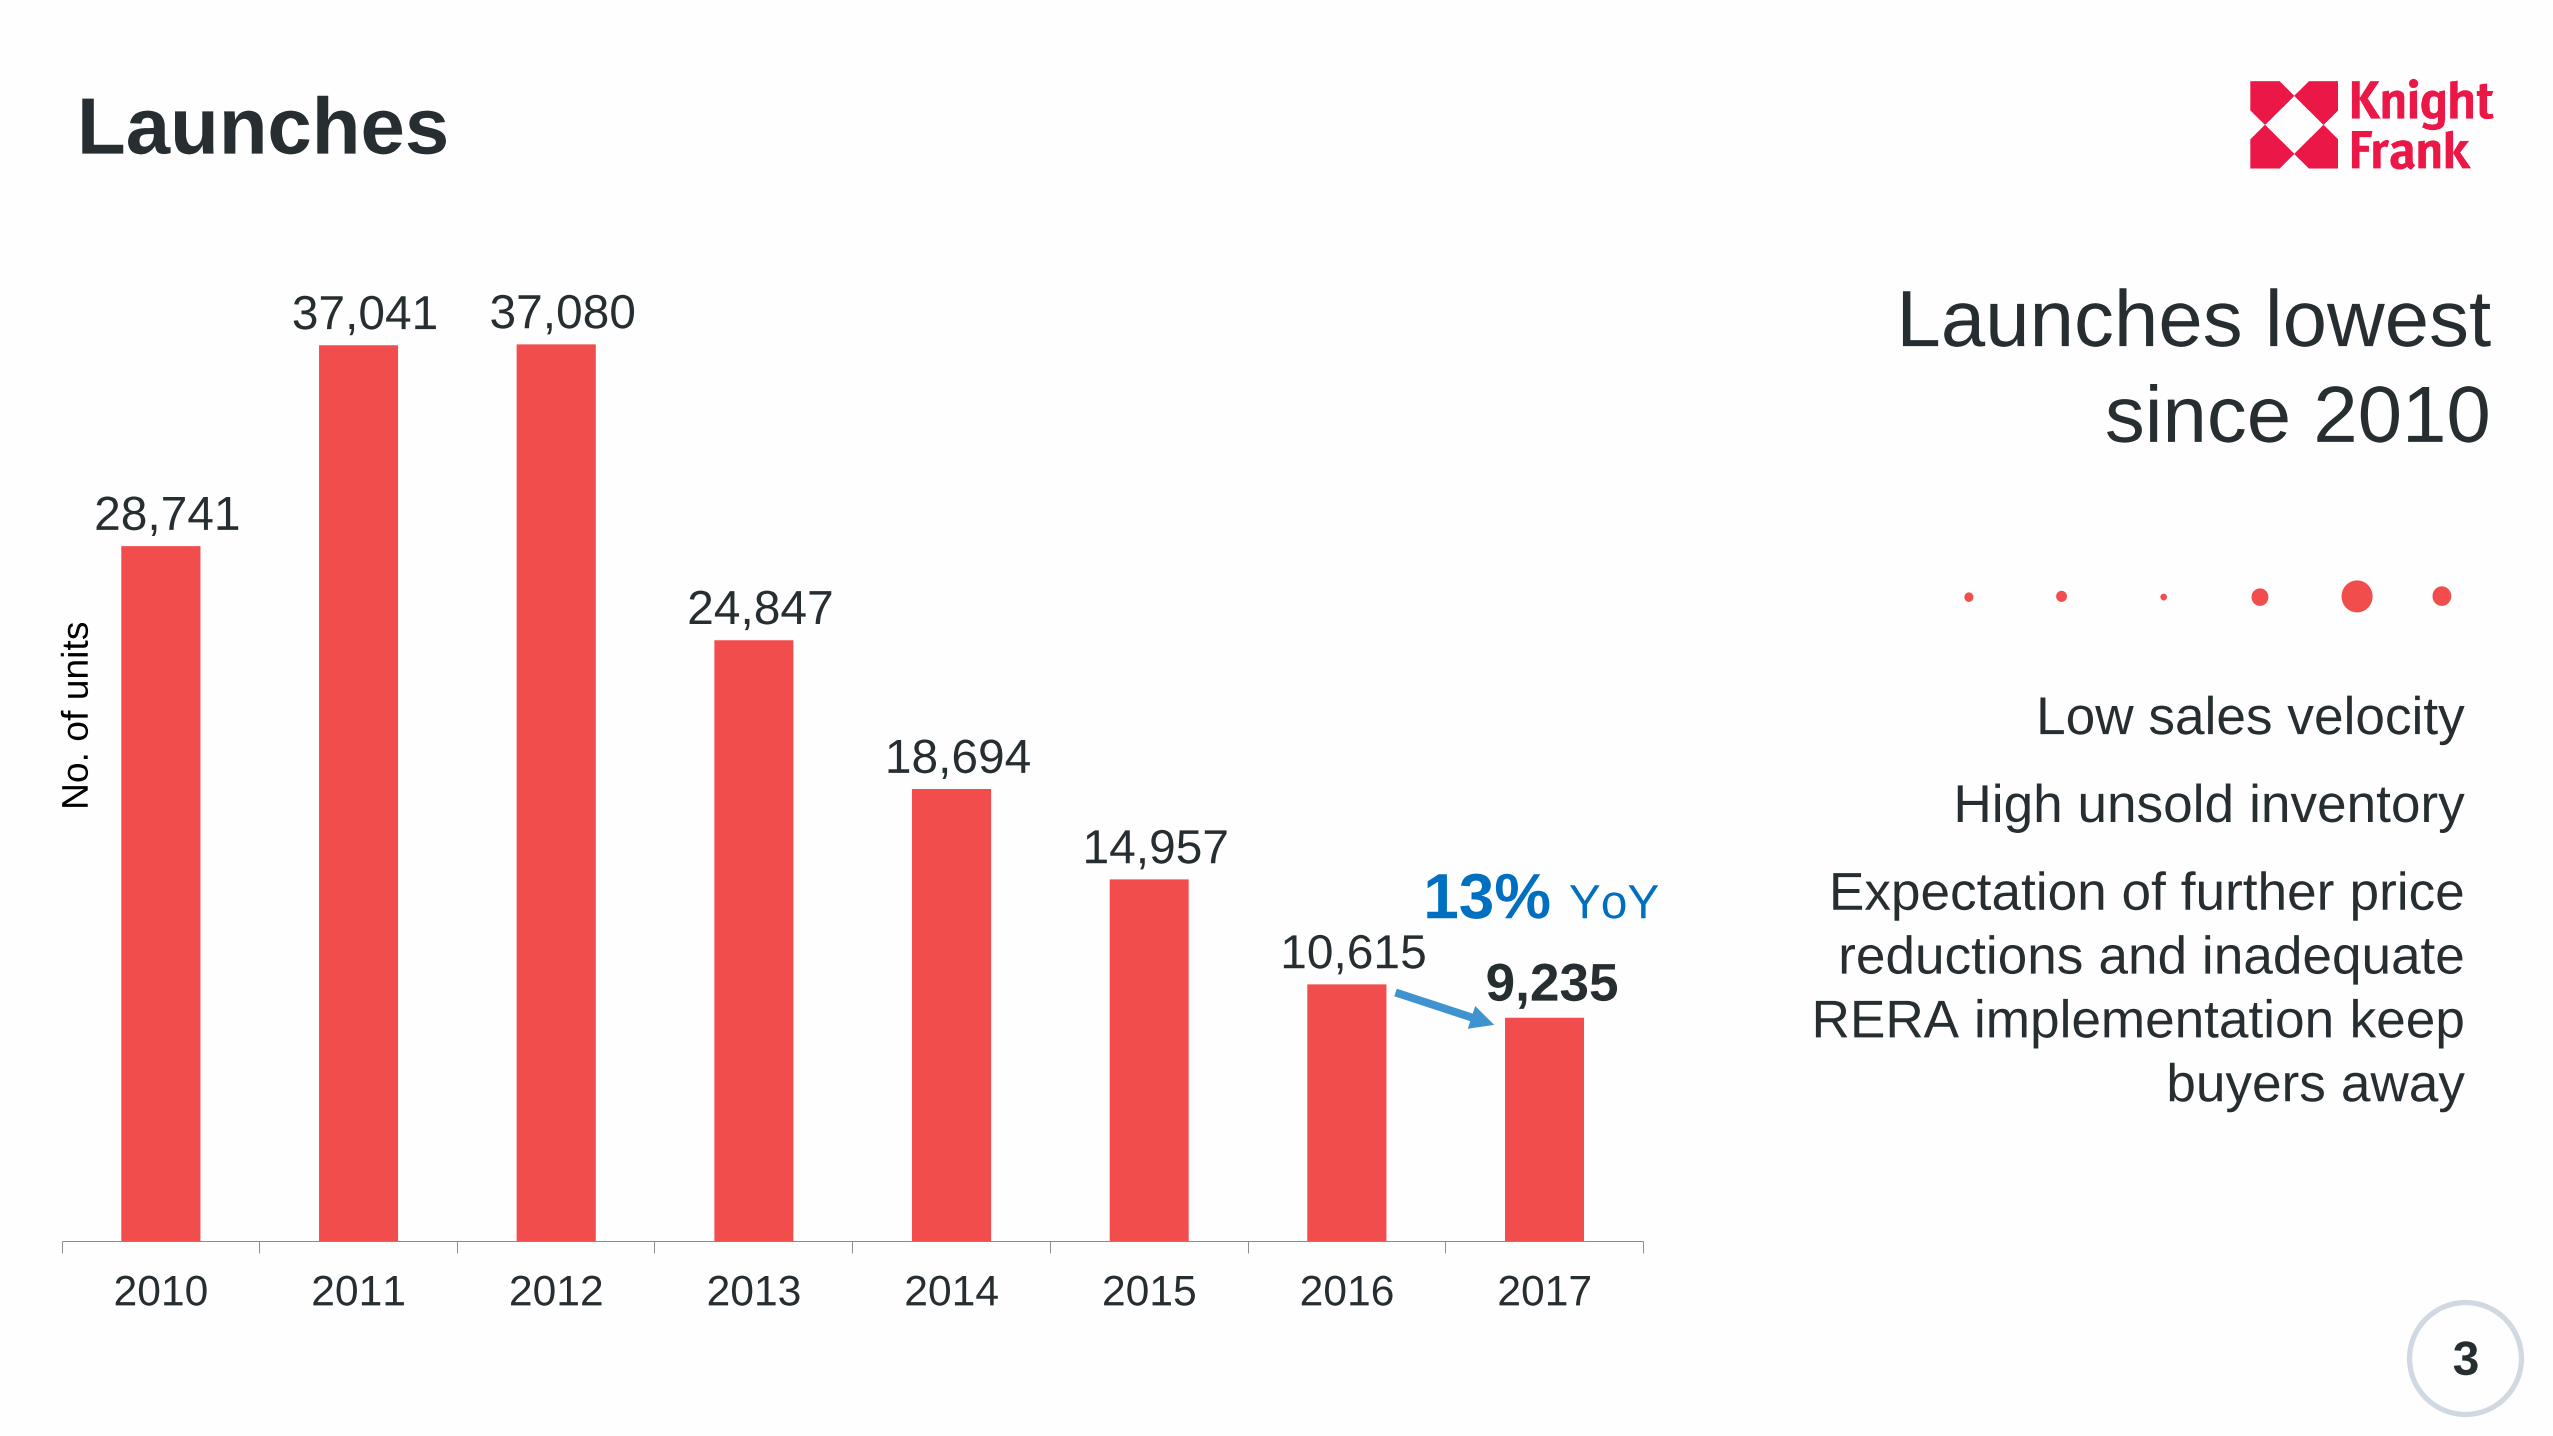
28,741
37,041 37,080
24,847
18,694
14,957
10,615 9,235
2010 2011 2012 2013 2014 2015 2016 2017
13% YoY
Launches
Launches lowest
since 2010
No. o
f units
4
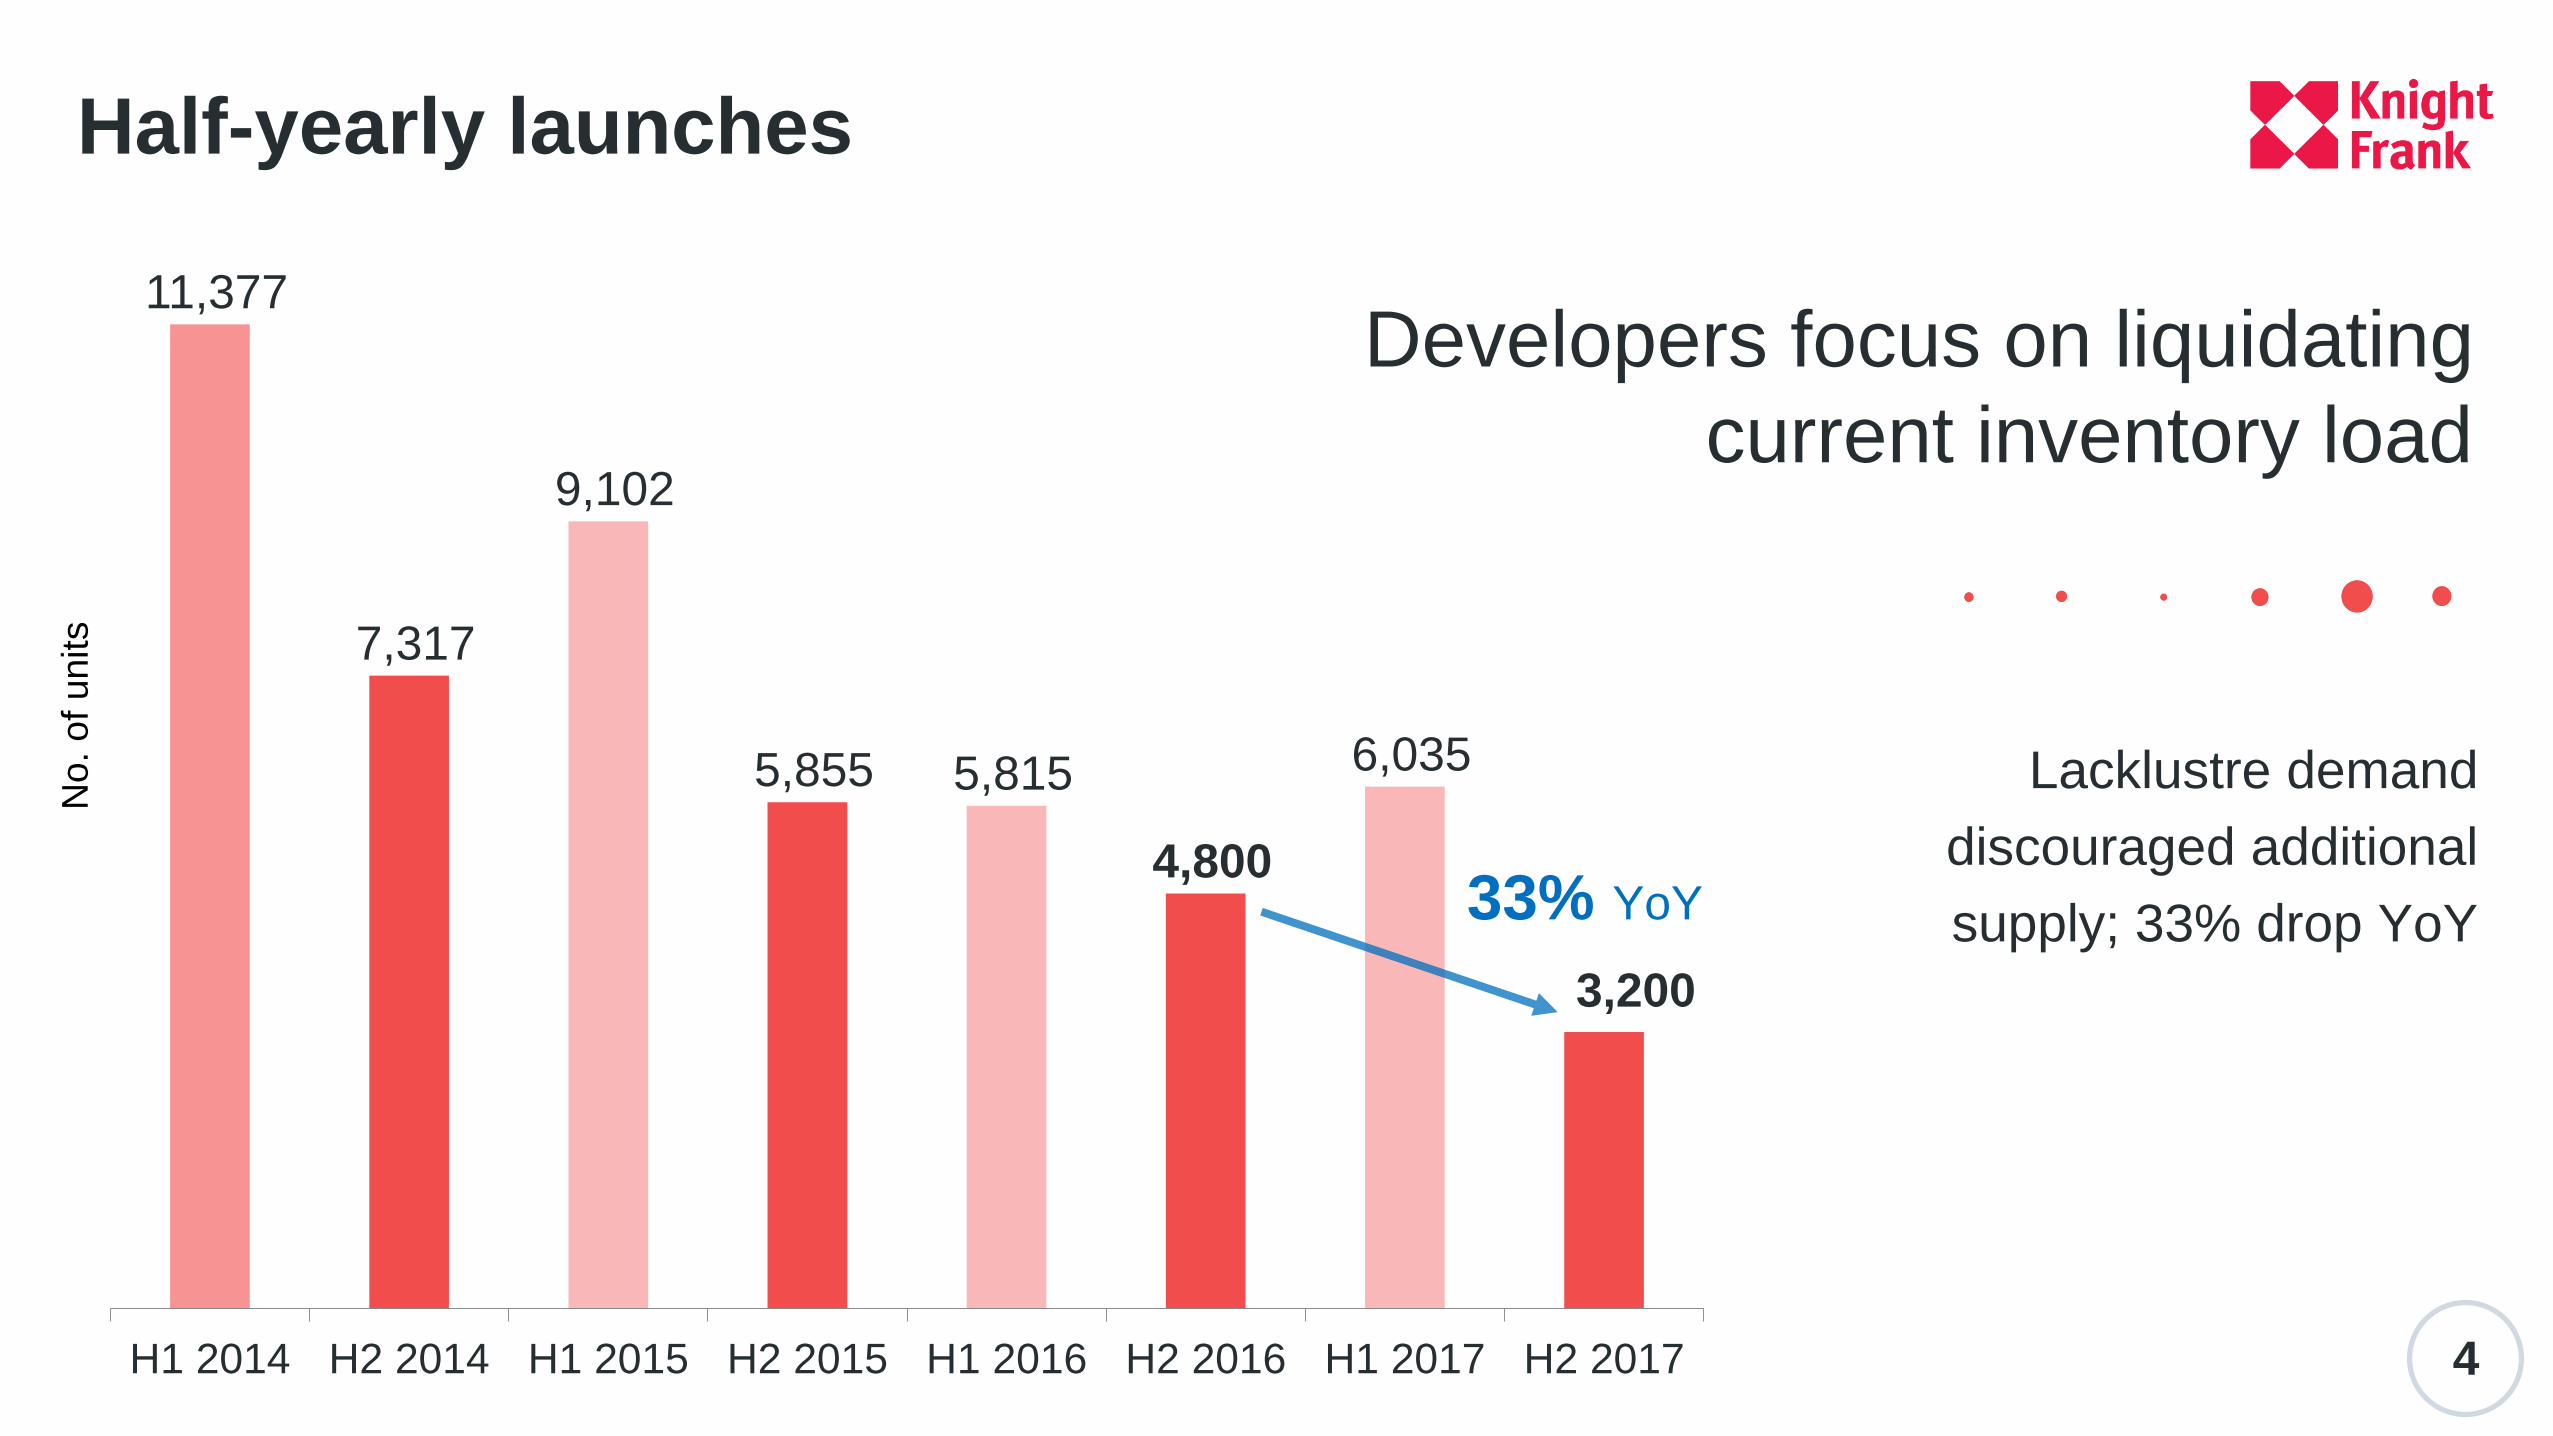
11,377
7,317
9,102
5,855 5,815
4,800
6,035
3,200
H1 2014 H2 2014 H1 2015 H2 2015 H1 2016 H2 2016 H1 2017 H2 2017
33% YoY
Lacklustre demand
discouraged additional
supply; 33% drop YoY
Half-yearly launches
Developers focus on liquidating
current inventory load
No. o
f units
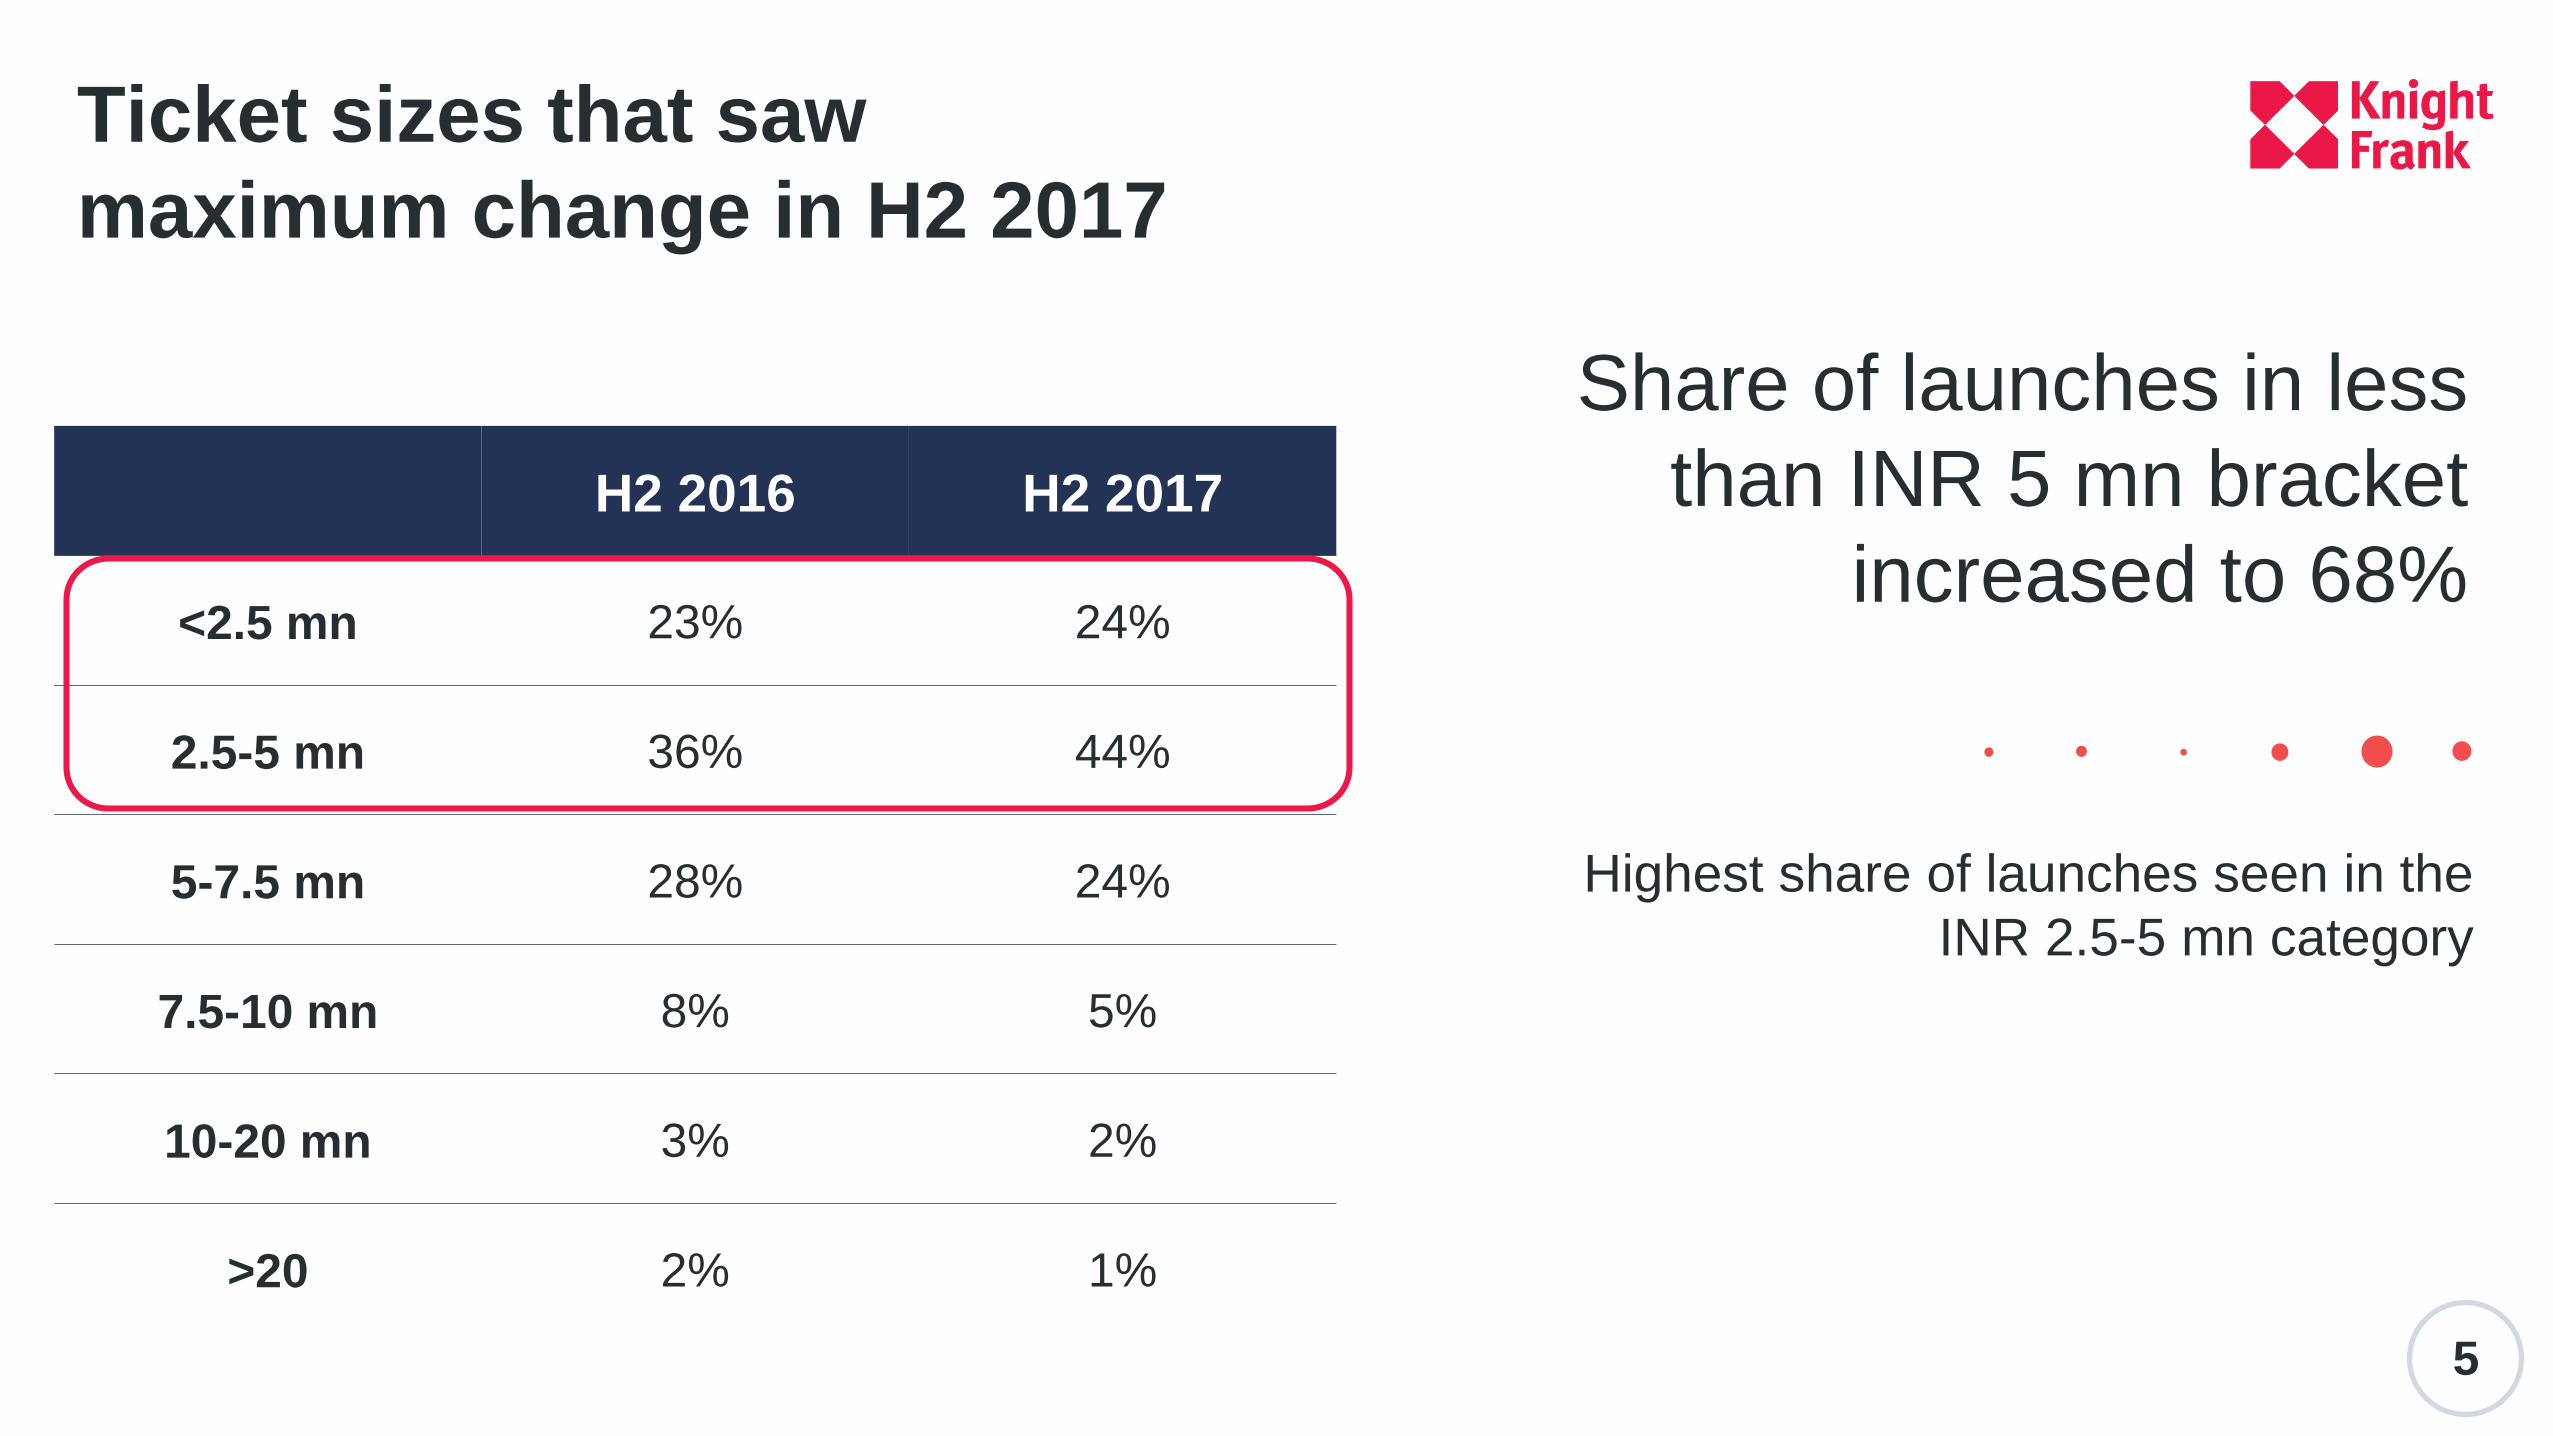
Highest share of launches seen in the
INR 2.5-5 mn category
5
H2 2016 H2 2017
<2.5 mn 23% 24%
2.5-5 mn 36% 44%
5-7.5 mn 28% 24%
7.5-10 mn 8% 5%
10-20 mn 3% 2%
>20 2% 1%
Ticket sizes that saw
maximum change in H2 2017
Share of launches in less
than INR 5 mn bracket
increased to 68%
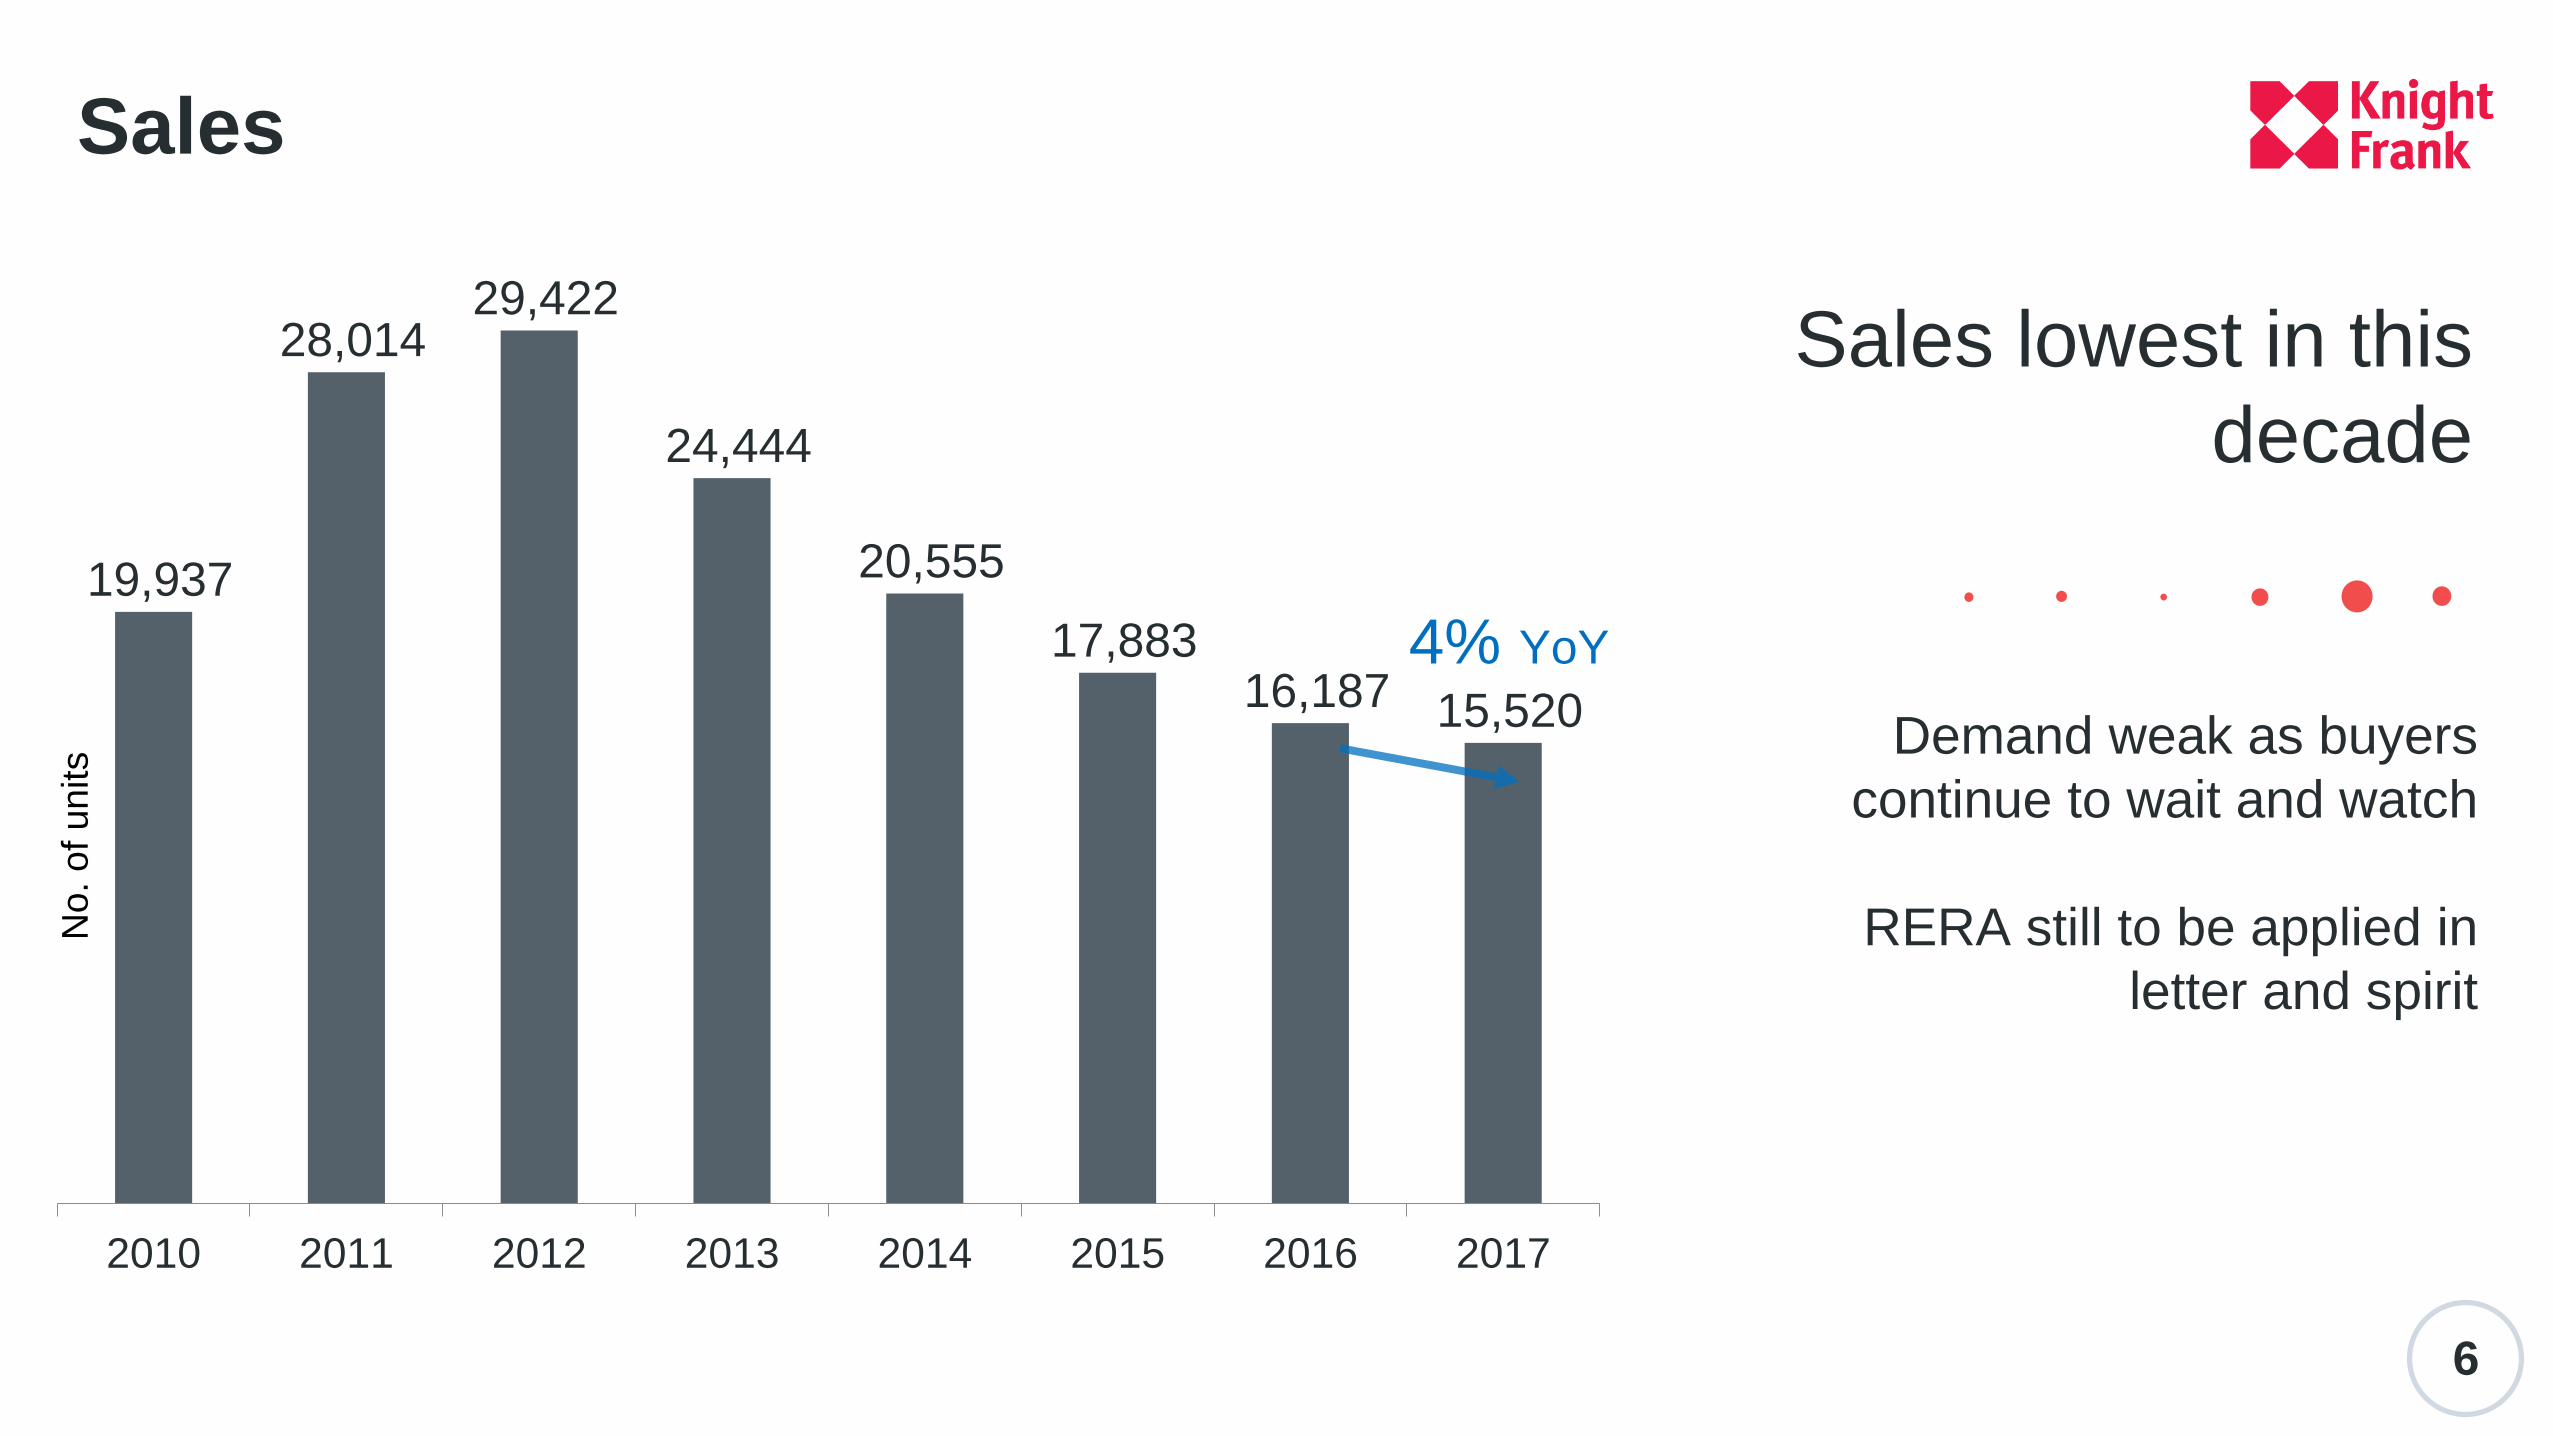
Demand weak as buyers
continue to wait and watch
RERA still to be applied in
letter and spirit
6
19,937
28,014 29,422
24,444
20,555
17,883 16,187 15,520
2010 2011 2012 2013 2014 2015 2016 2017
4% YoY
Sales
Sales lowest in this
decade
No. o
f units
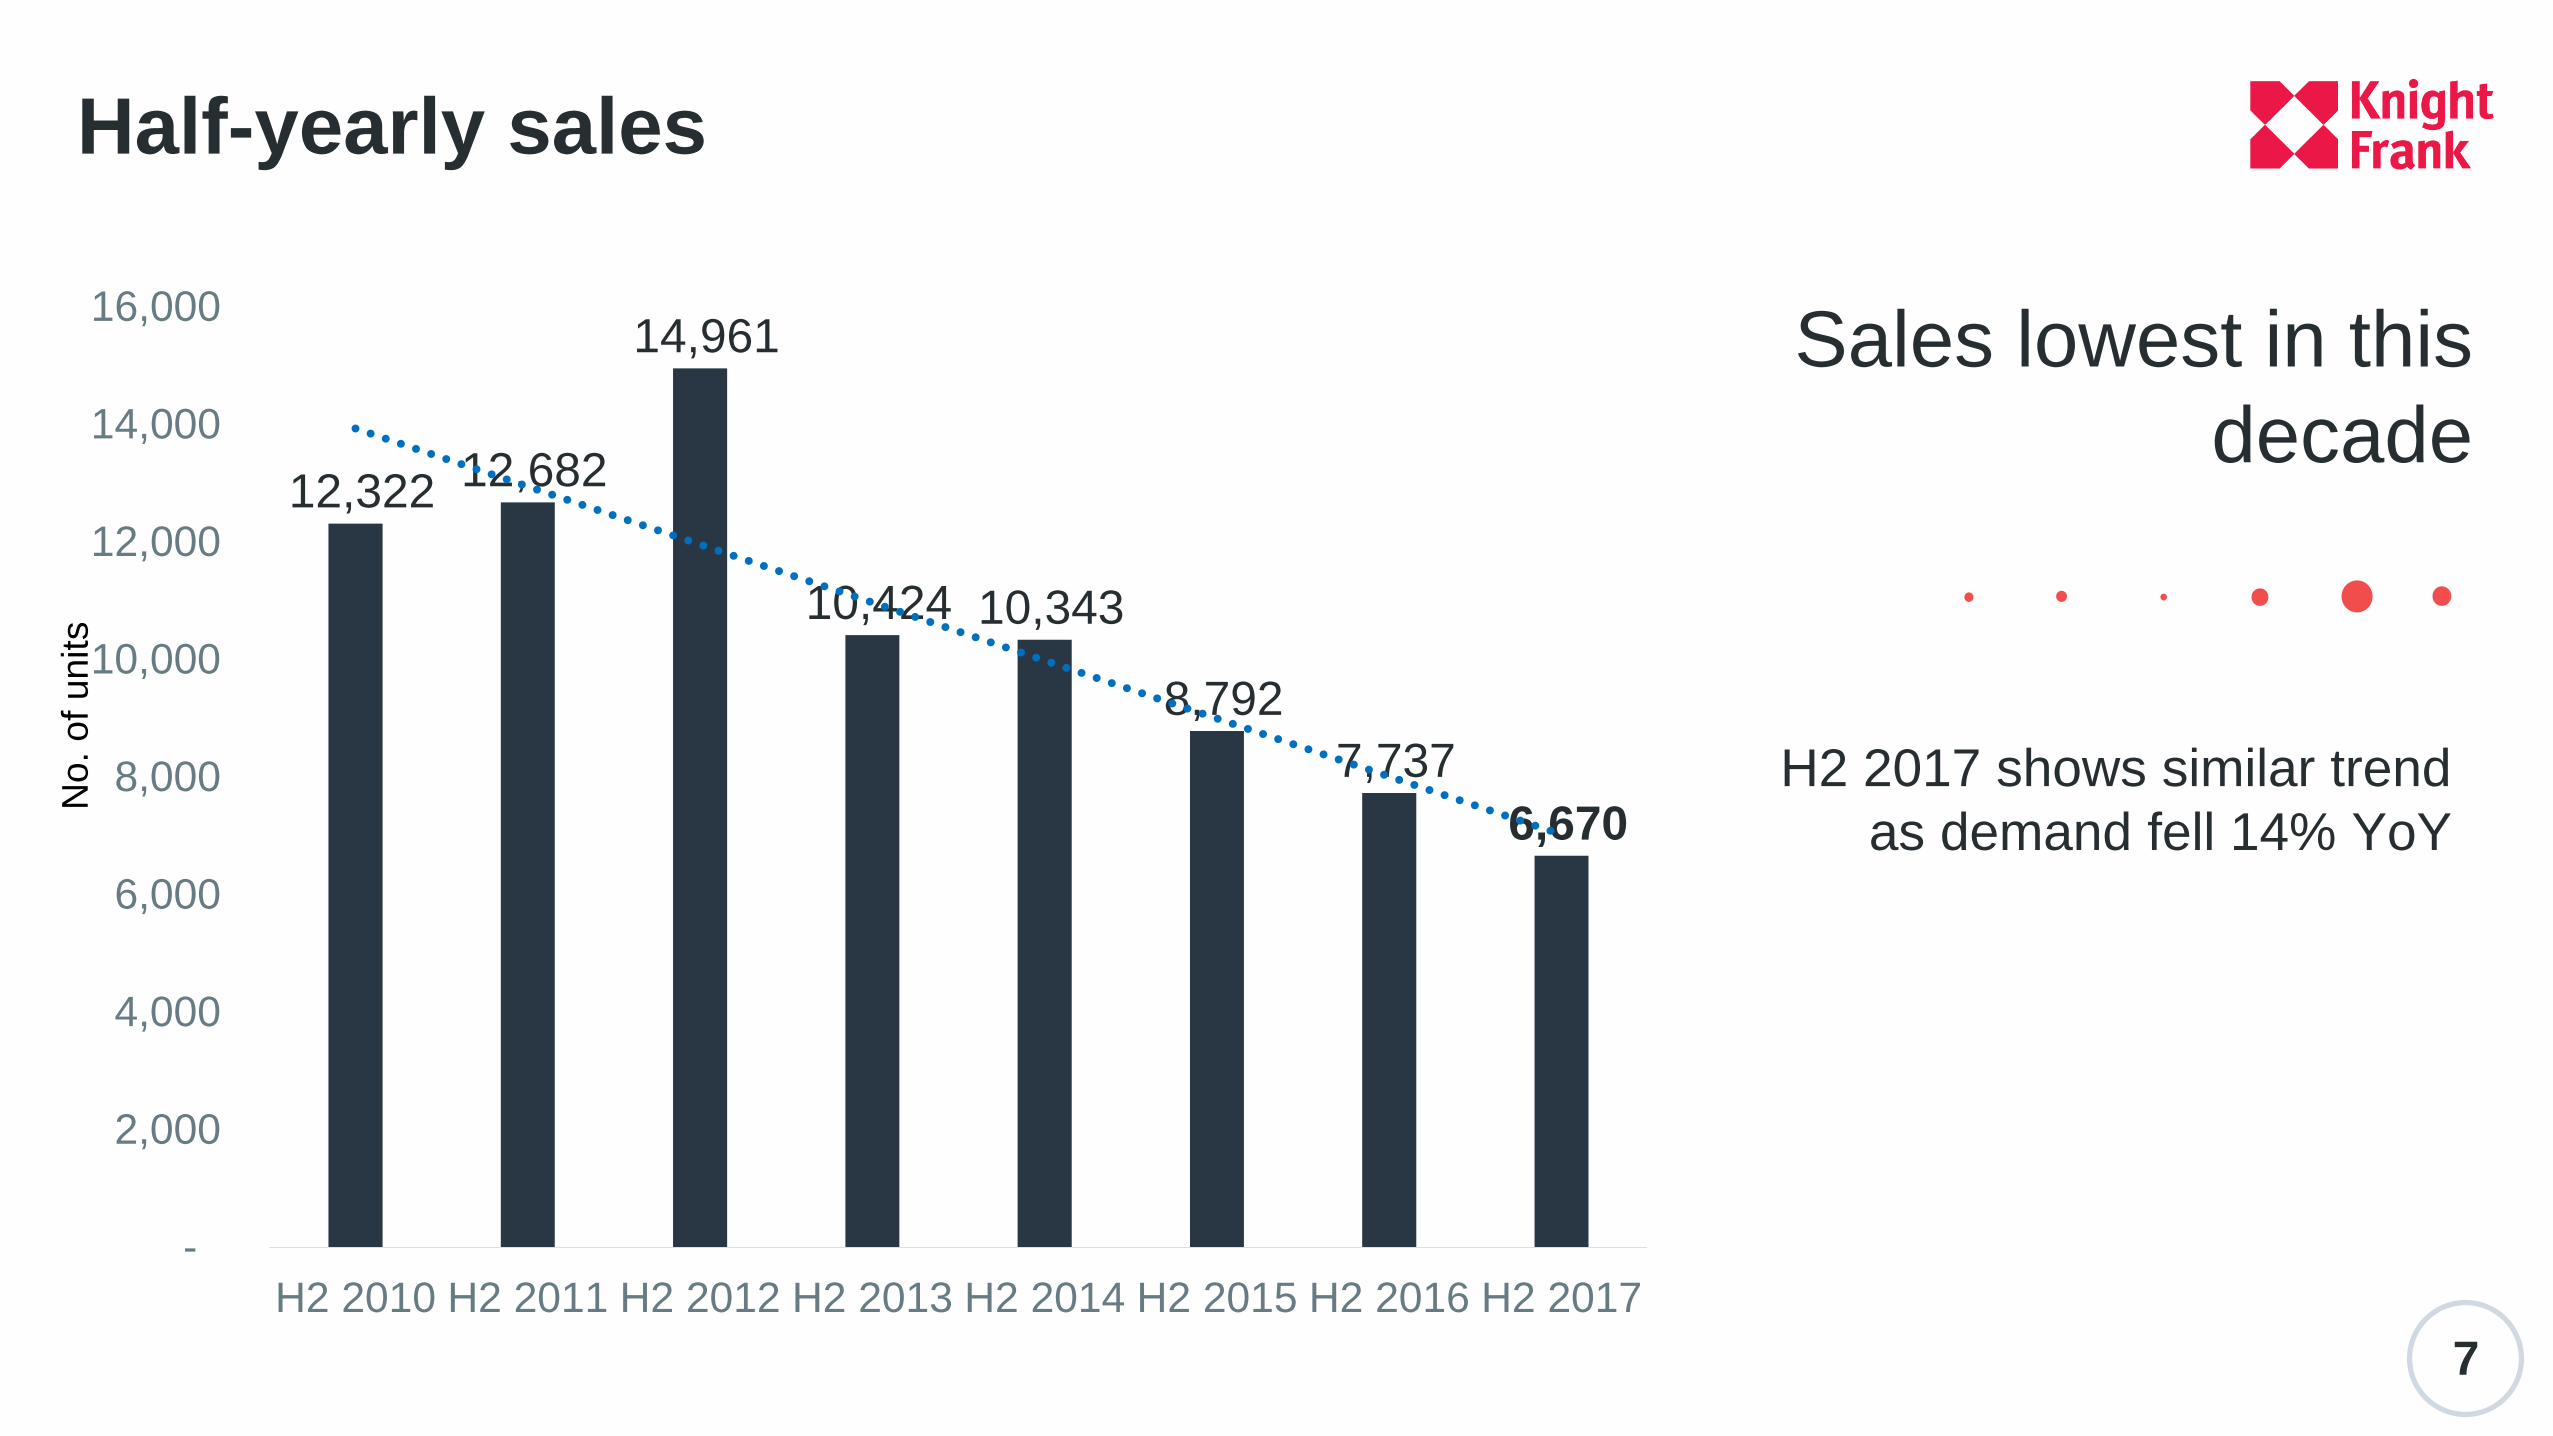
H2 2017 shows similar trend
as demand fell 14% YoY
7
Half-yearly sales
Sales lowest in this
decade12,322 12,682
14,961
10,424 10,343
8,792
7,737
6,670
-
2,000
4,000
6,000
8,000
10,000
12,000
14,000
16,000
H2 2010 H2 2011 H2 2012 H2 2013 H2 2014 H2 2015 H2 2016 H2 2017
No. o
f units
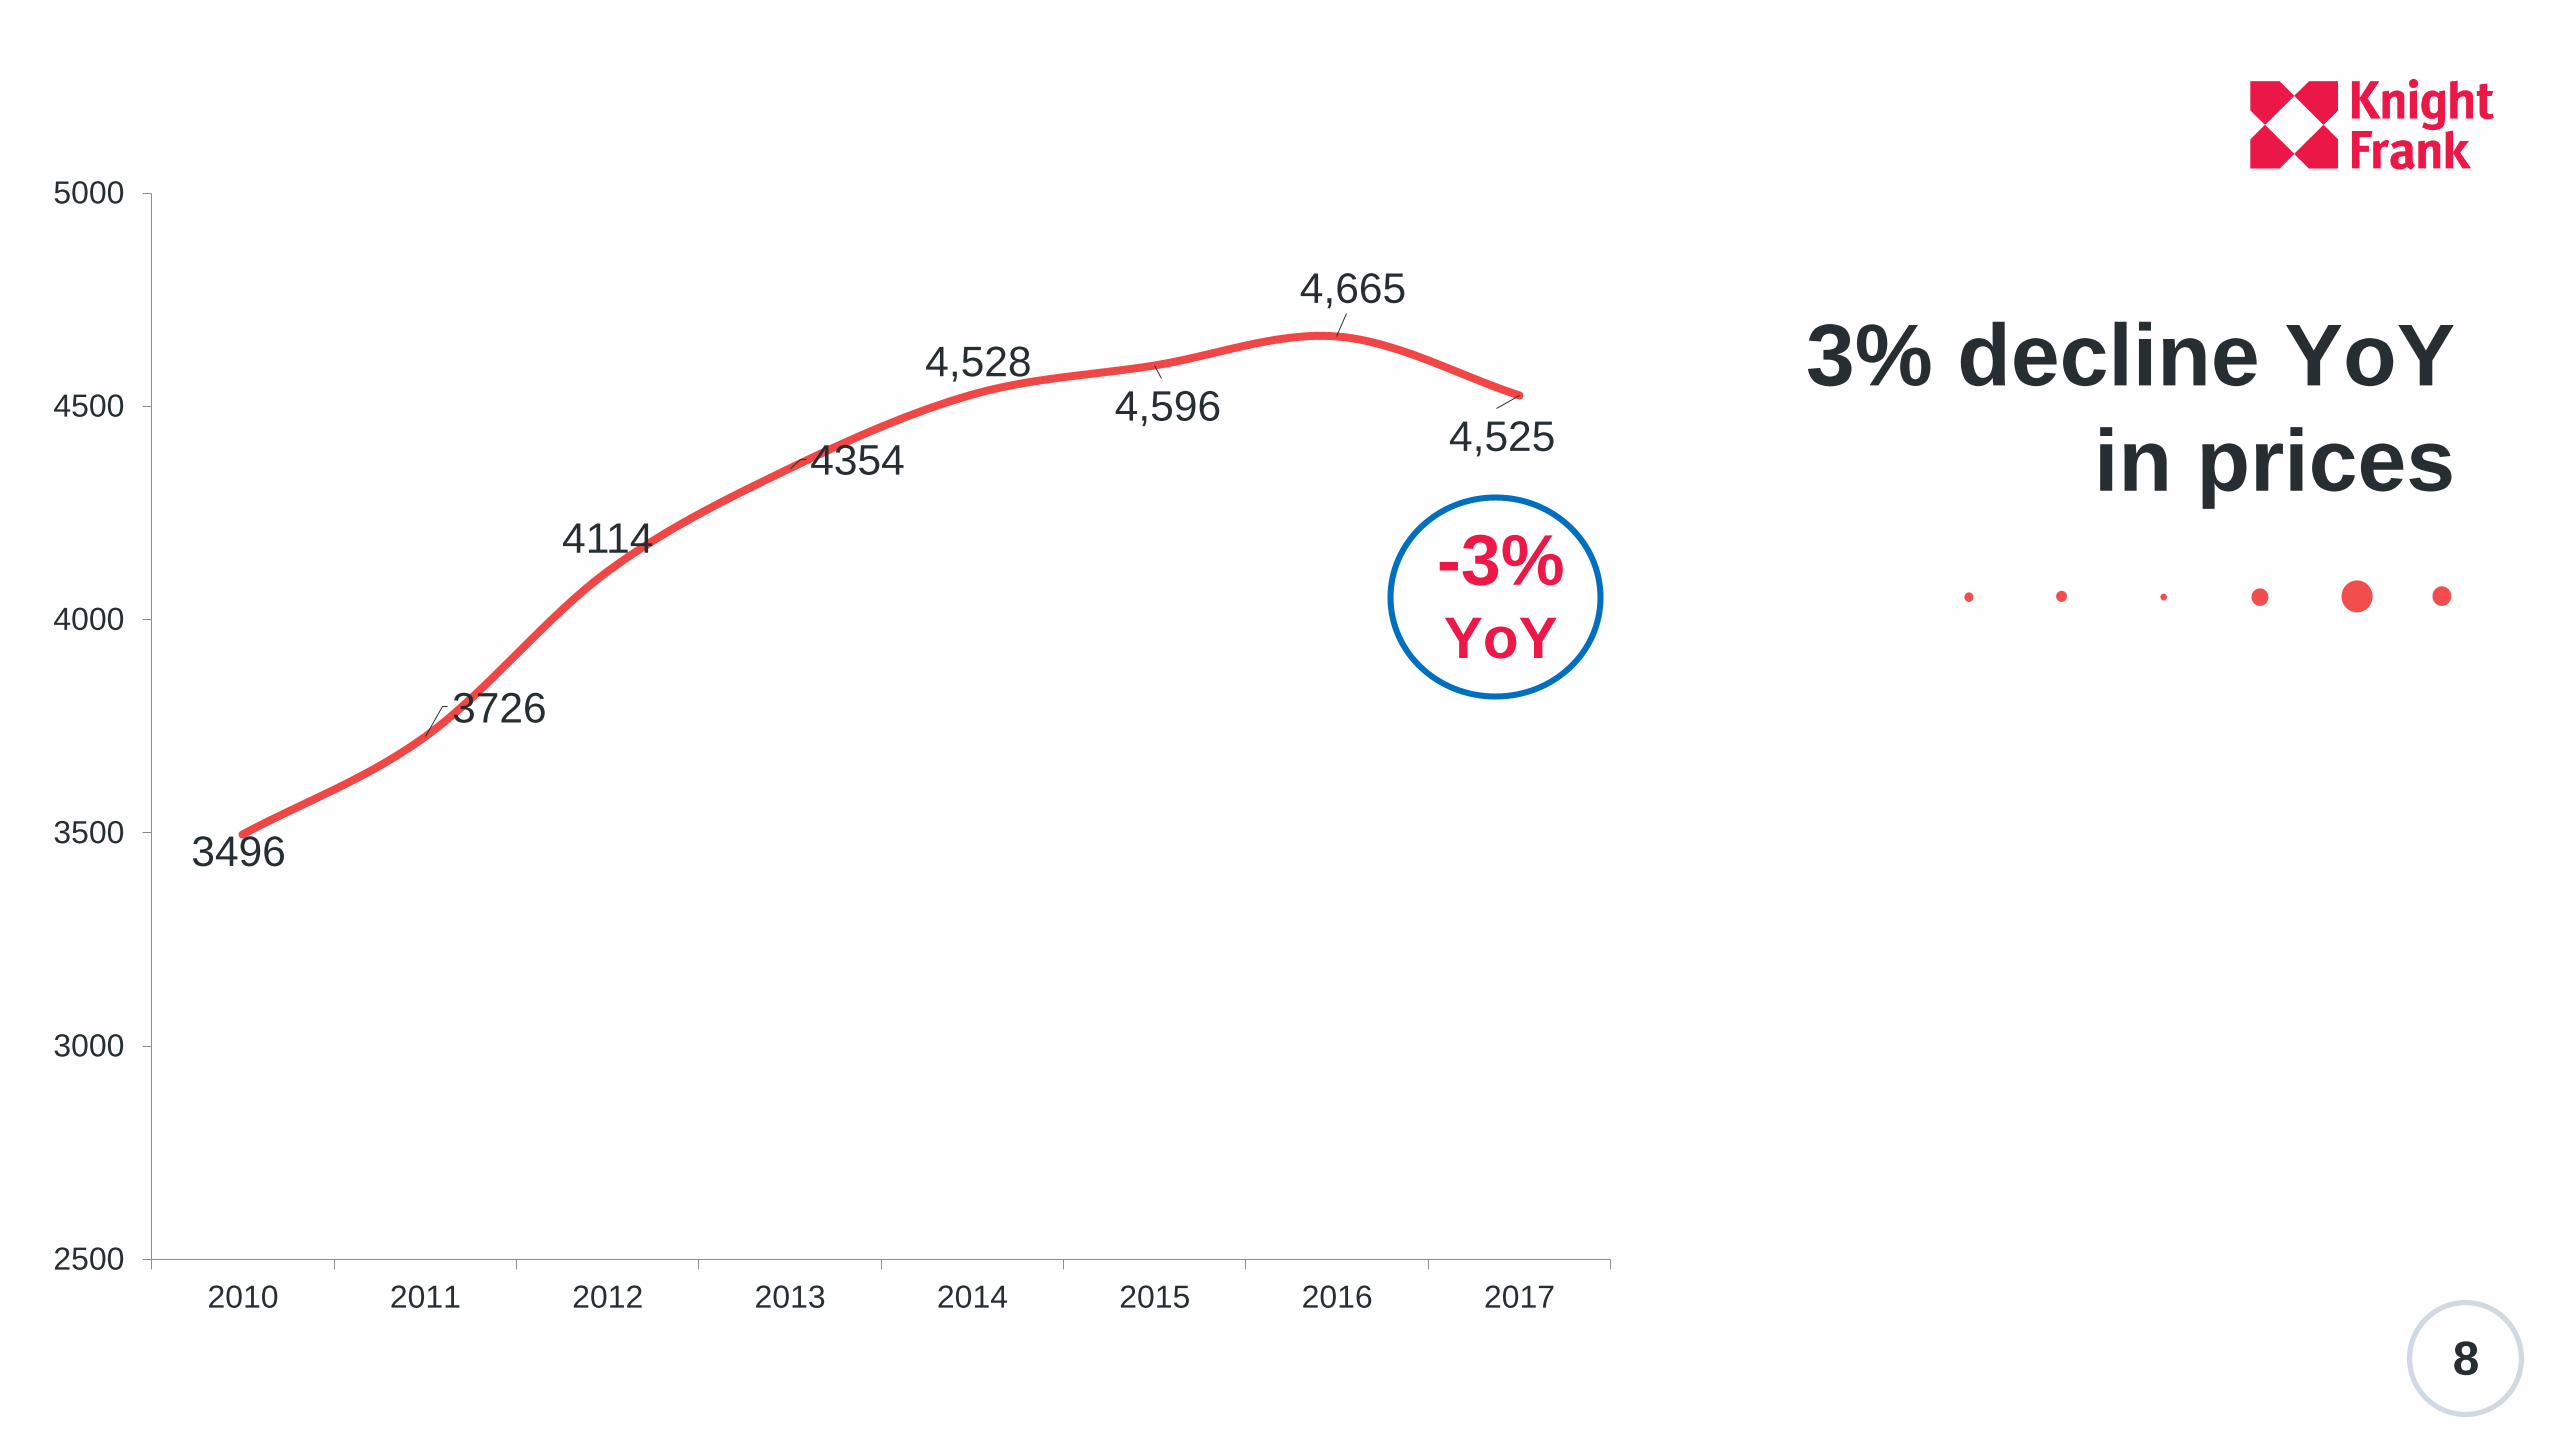
3% decline YoY
in prices
8
3496
3726
4114
4354
4,528 4,596
4,665
4,525
2500
3000
3500
4000
4500
5000
2010 2011 2012 2013 2014 2015 2016 2017
-3%YoY
70
80
90
100
110
120
130
140
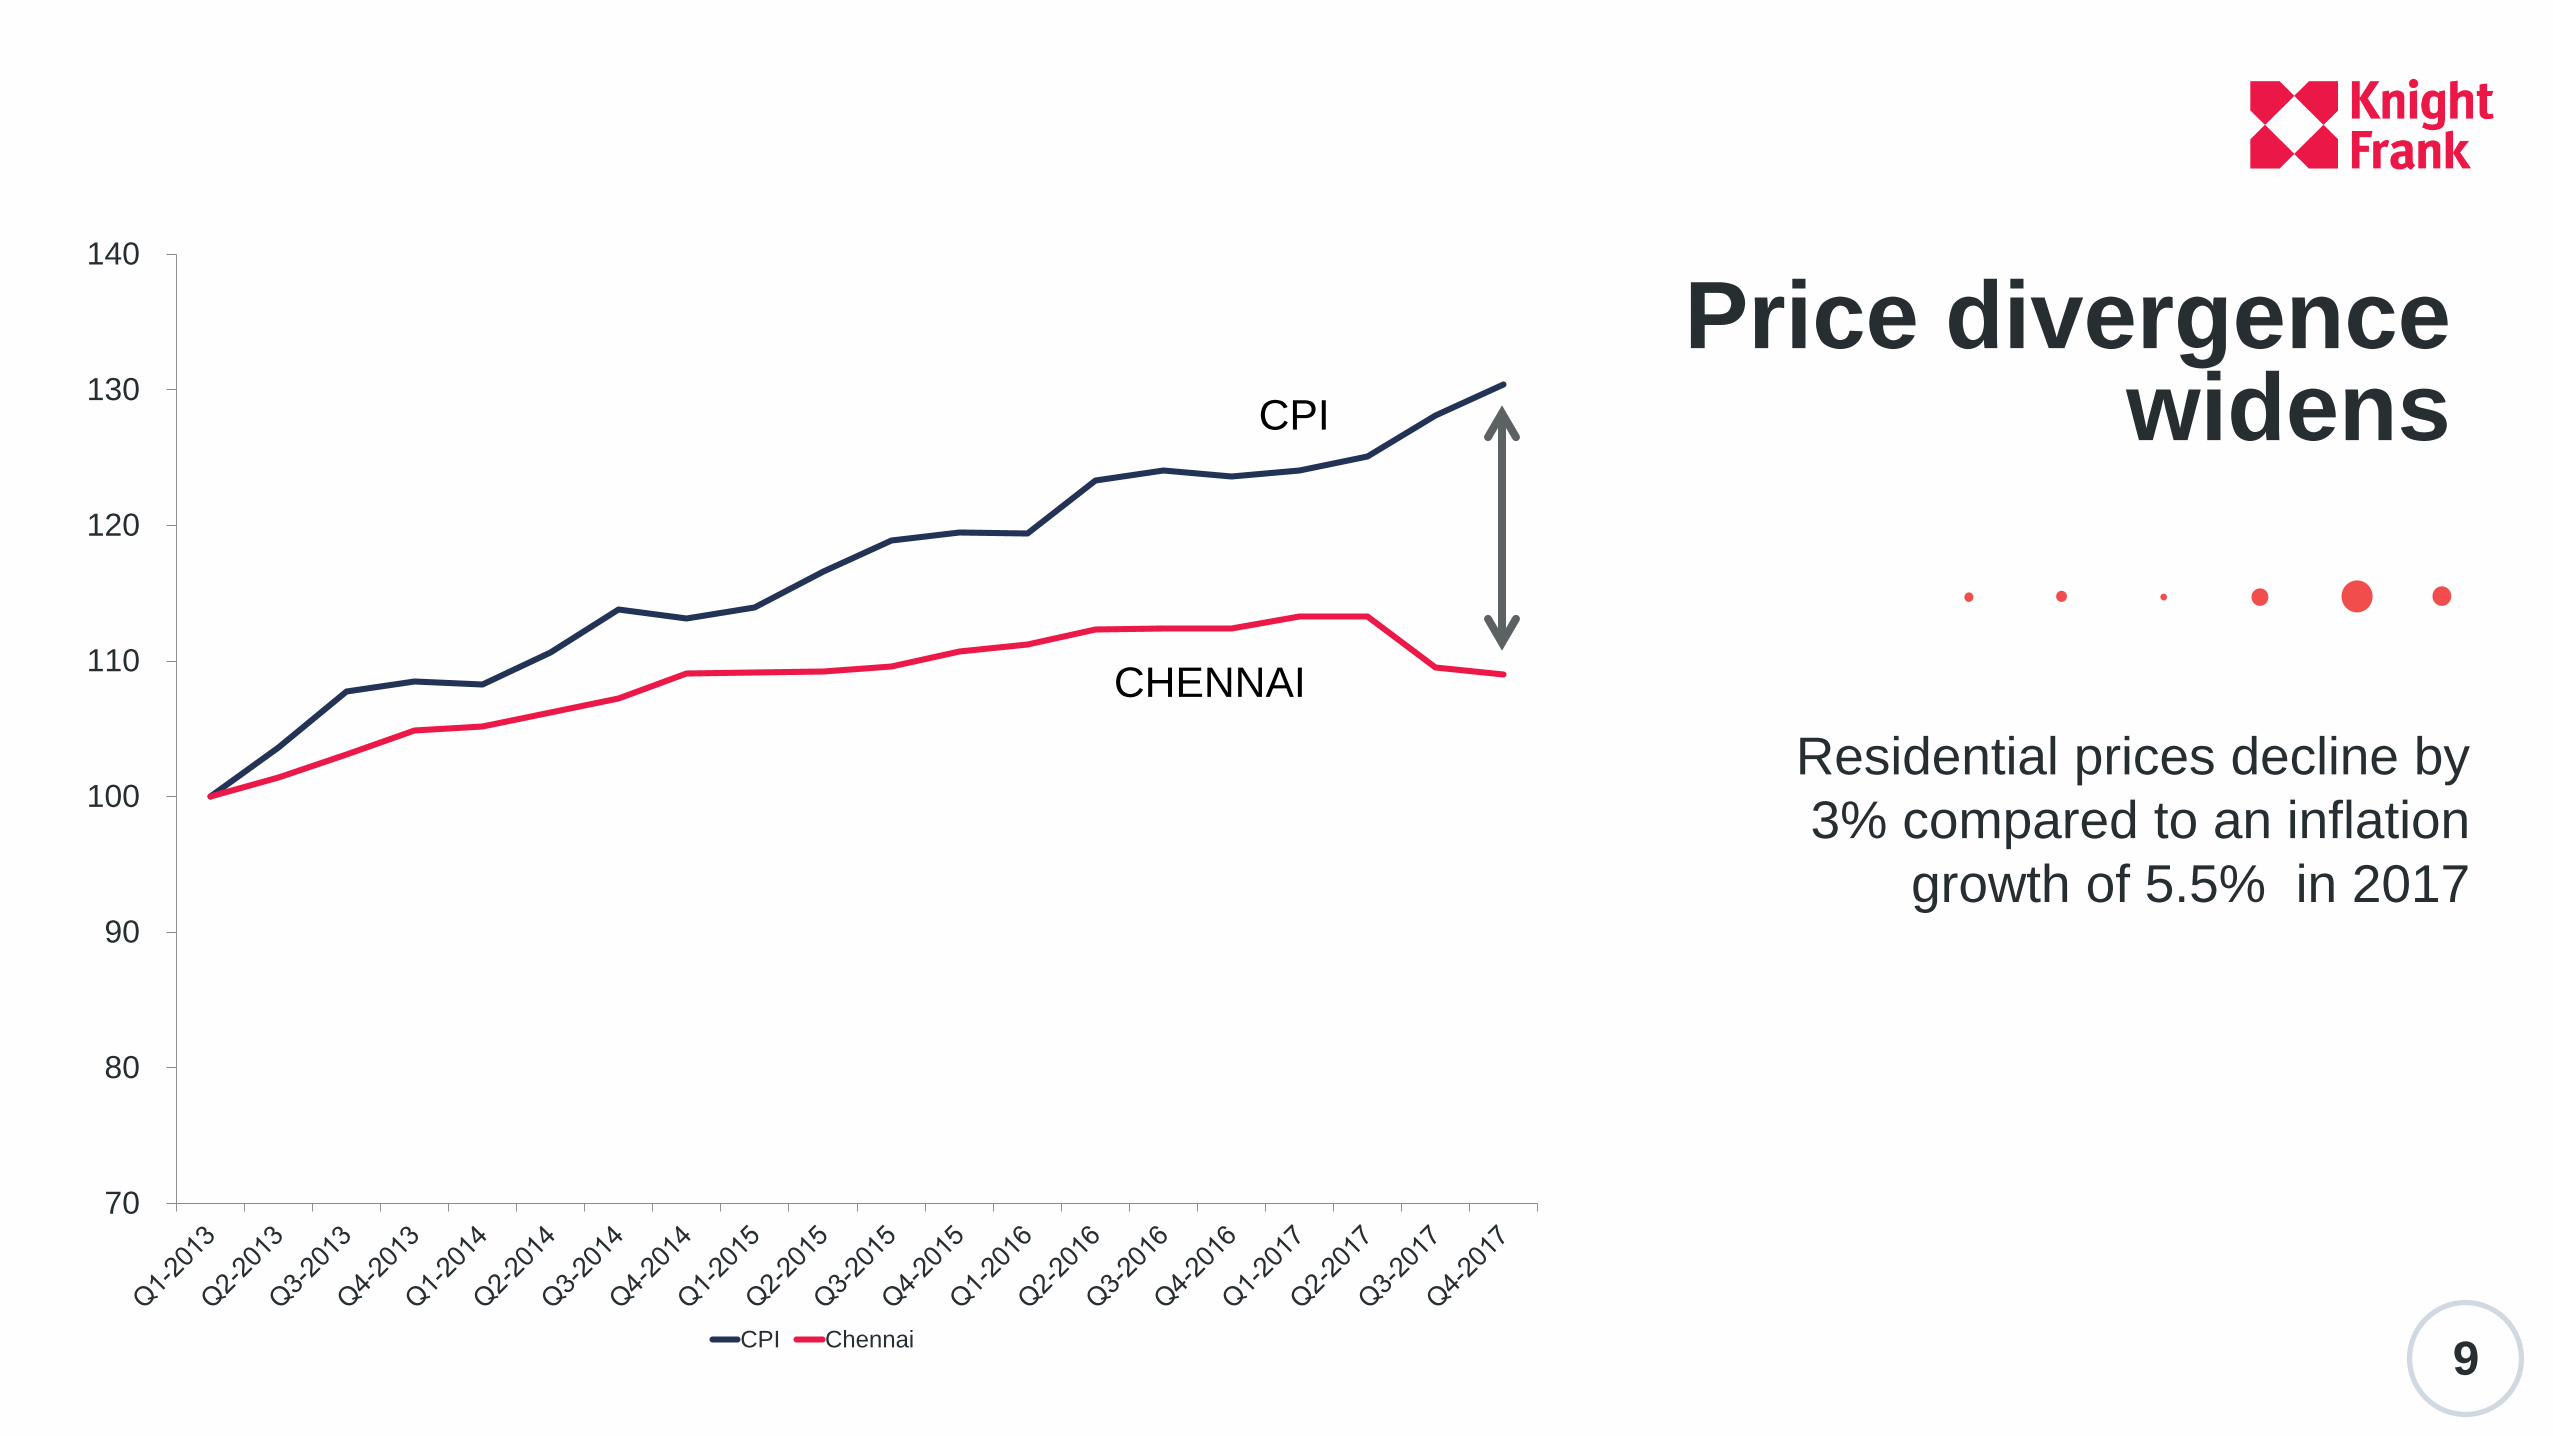
CPI Chennai
Residential prices decline by
3% compared to an inflation
growth of 5.5% in 2017
Price divergence widens
9
CPI
CHENNAI
10
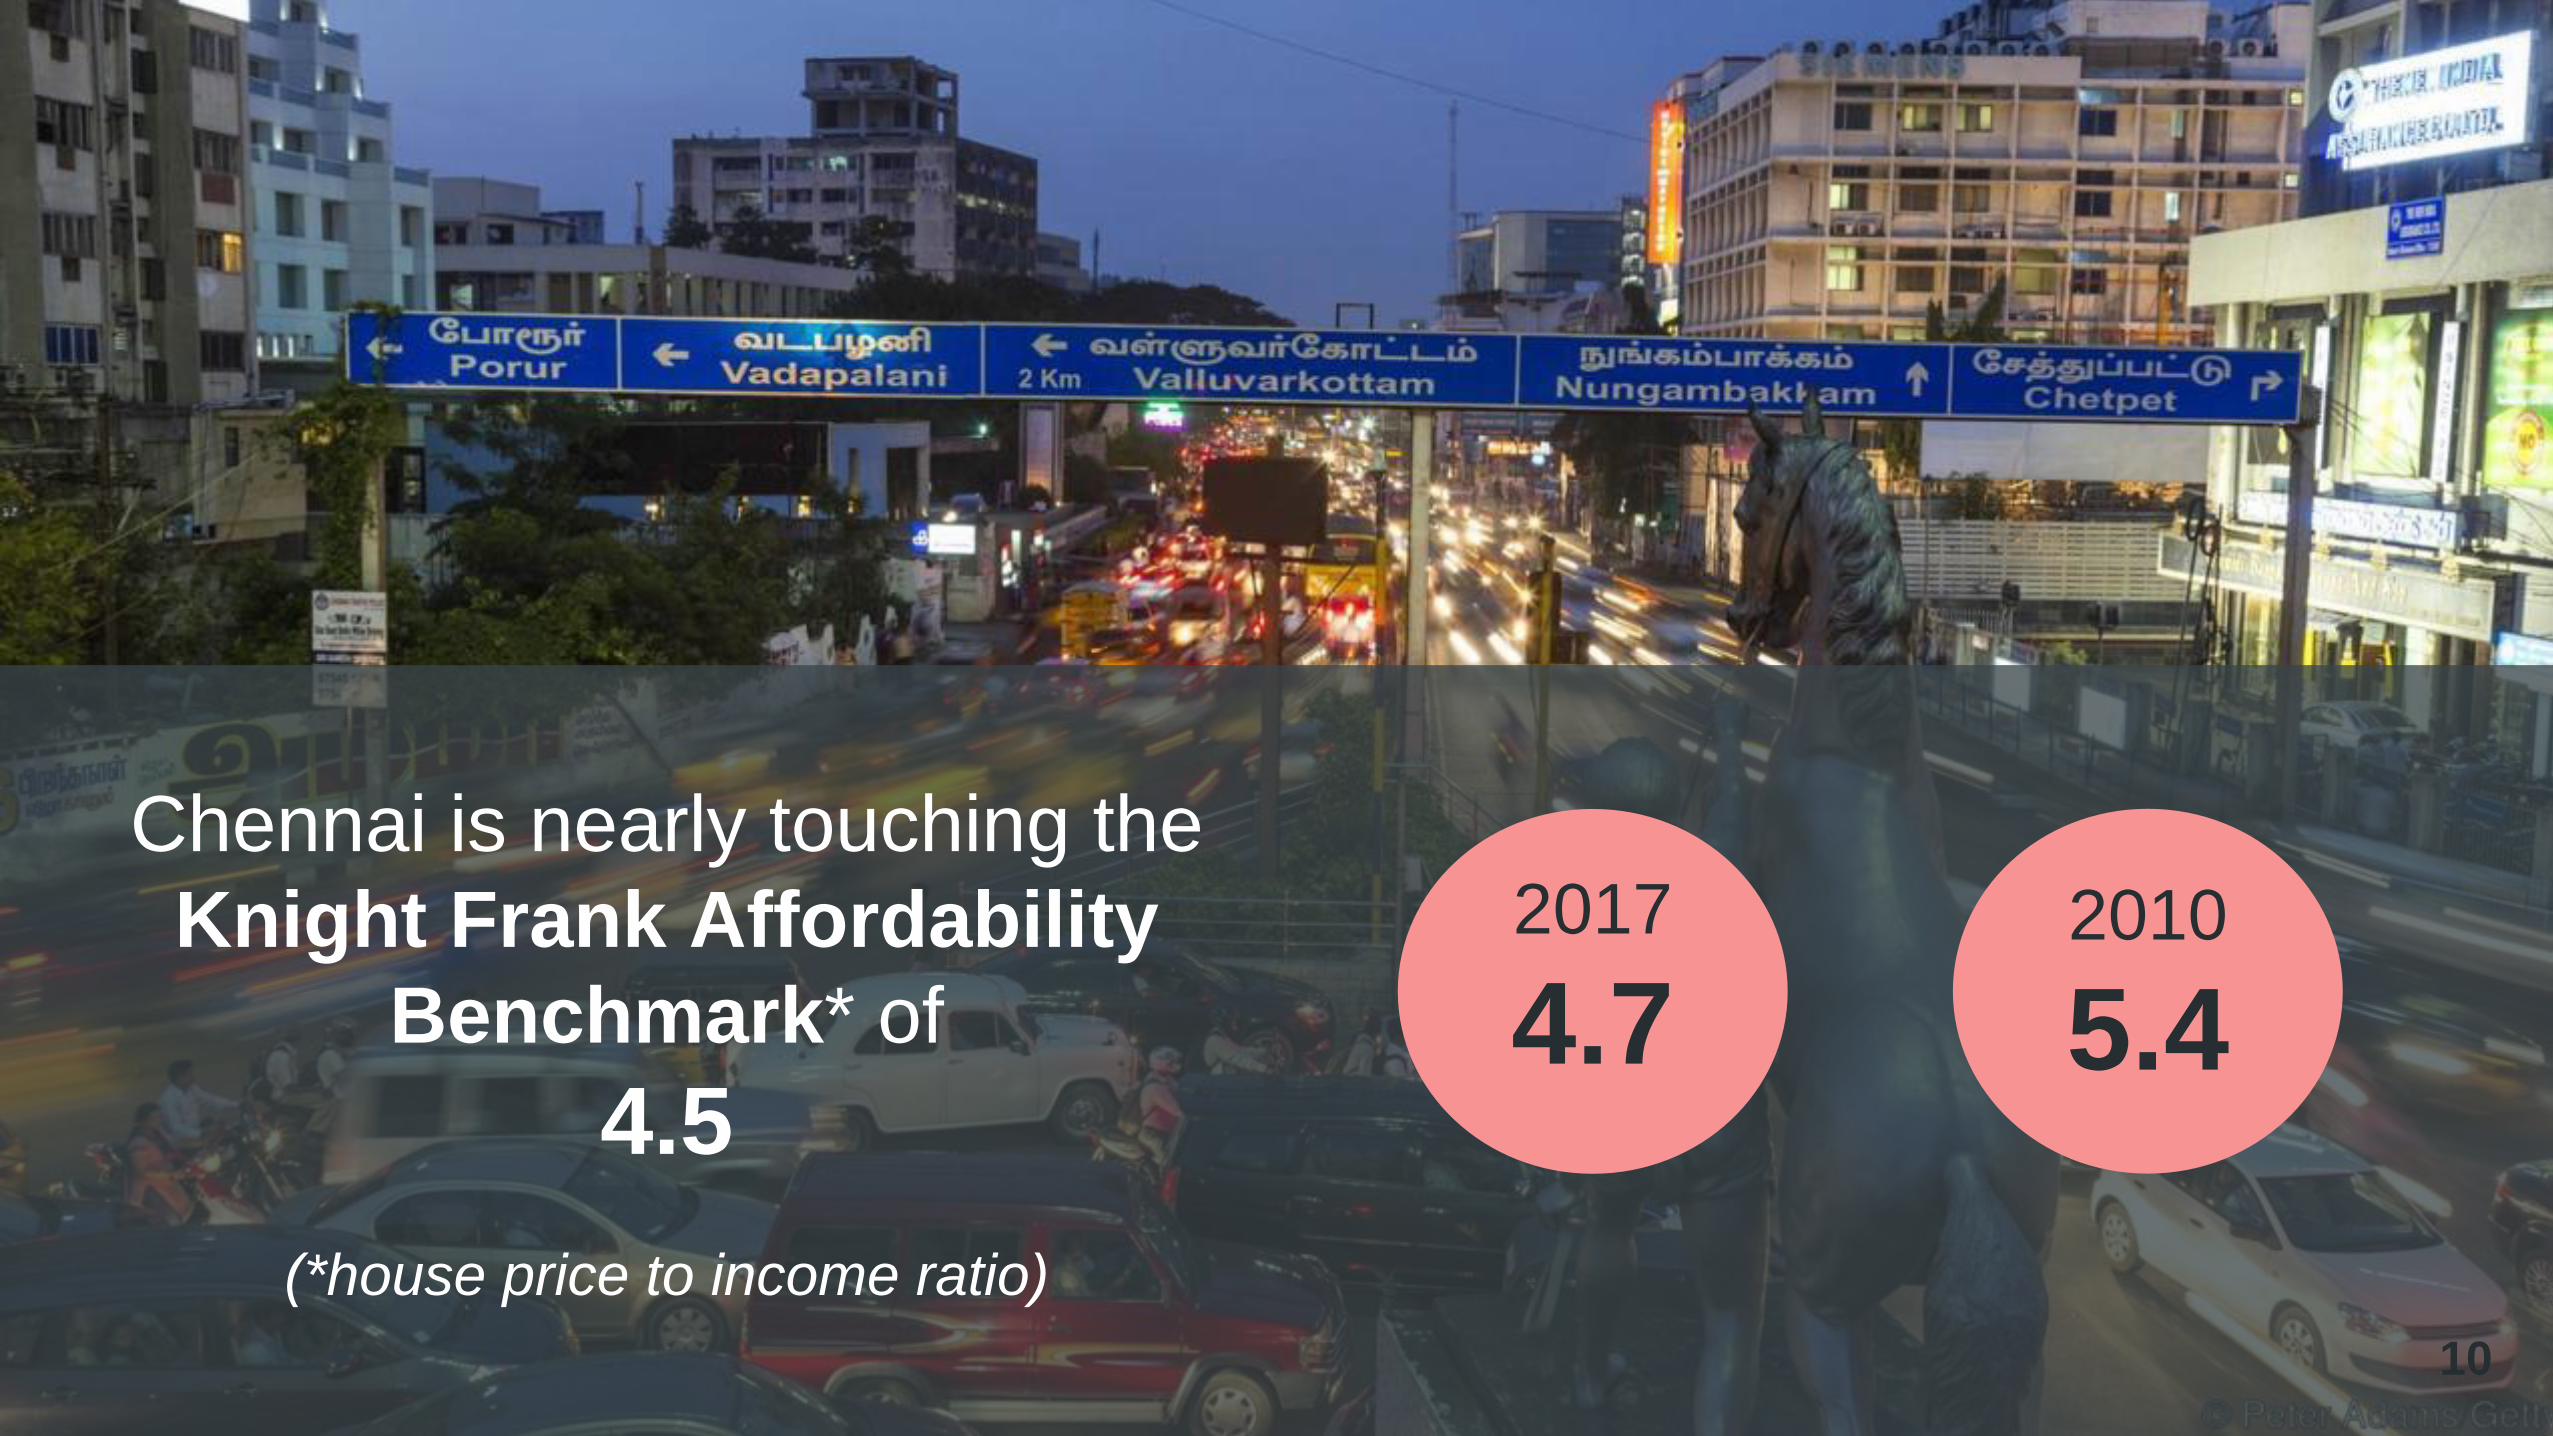
Chennai is nearly touching the
Knight Frank Affordability
Benchmark* of
4.5
(*house price to income ratio)
2017
4.72010
5.4
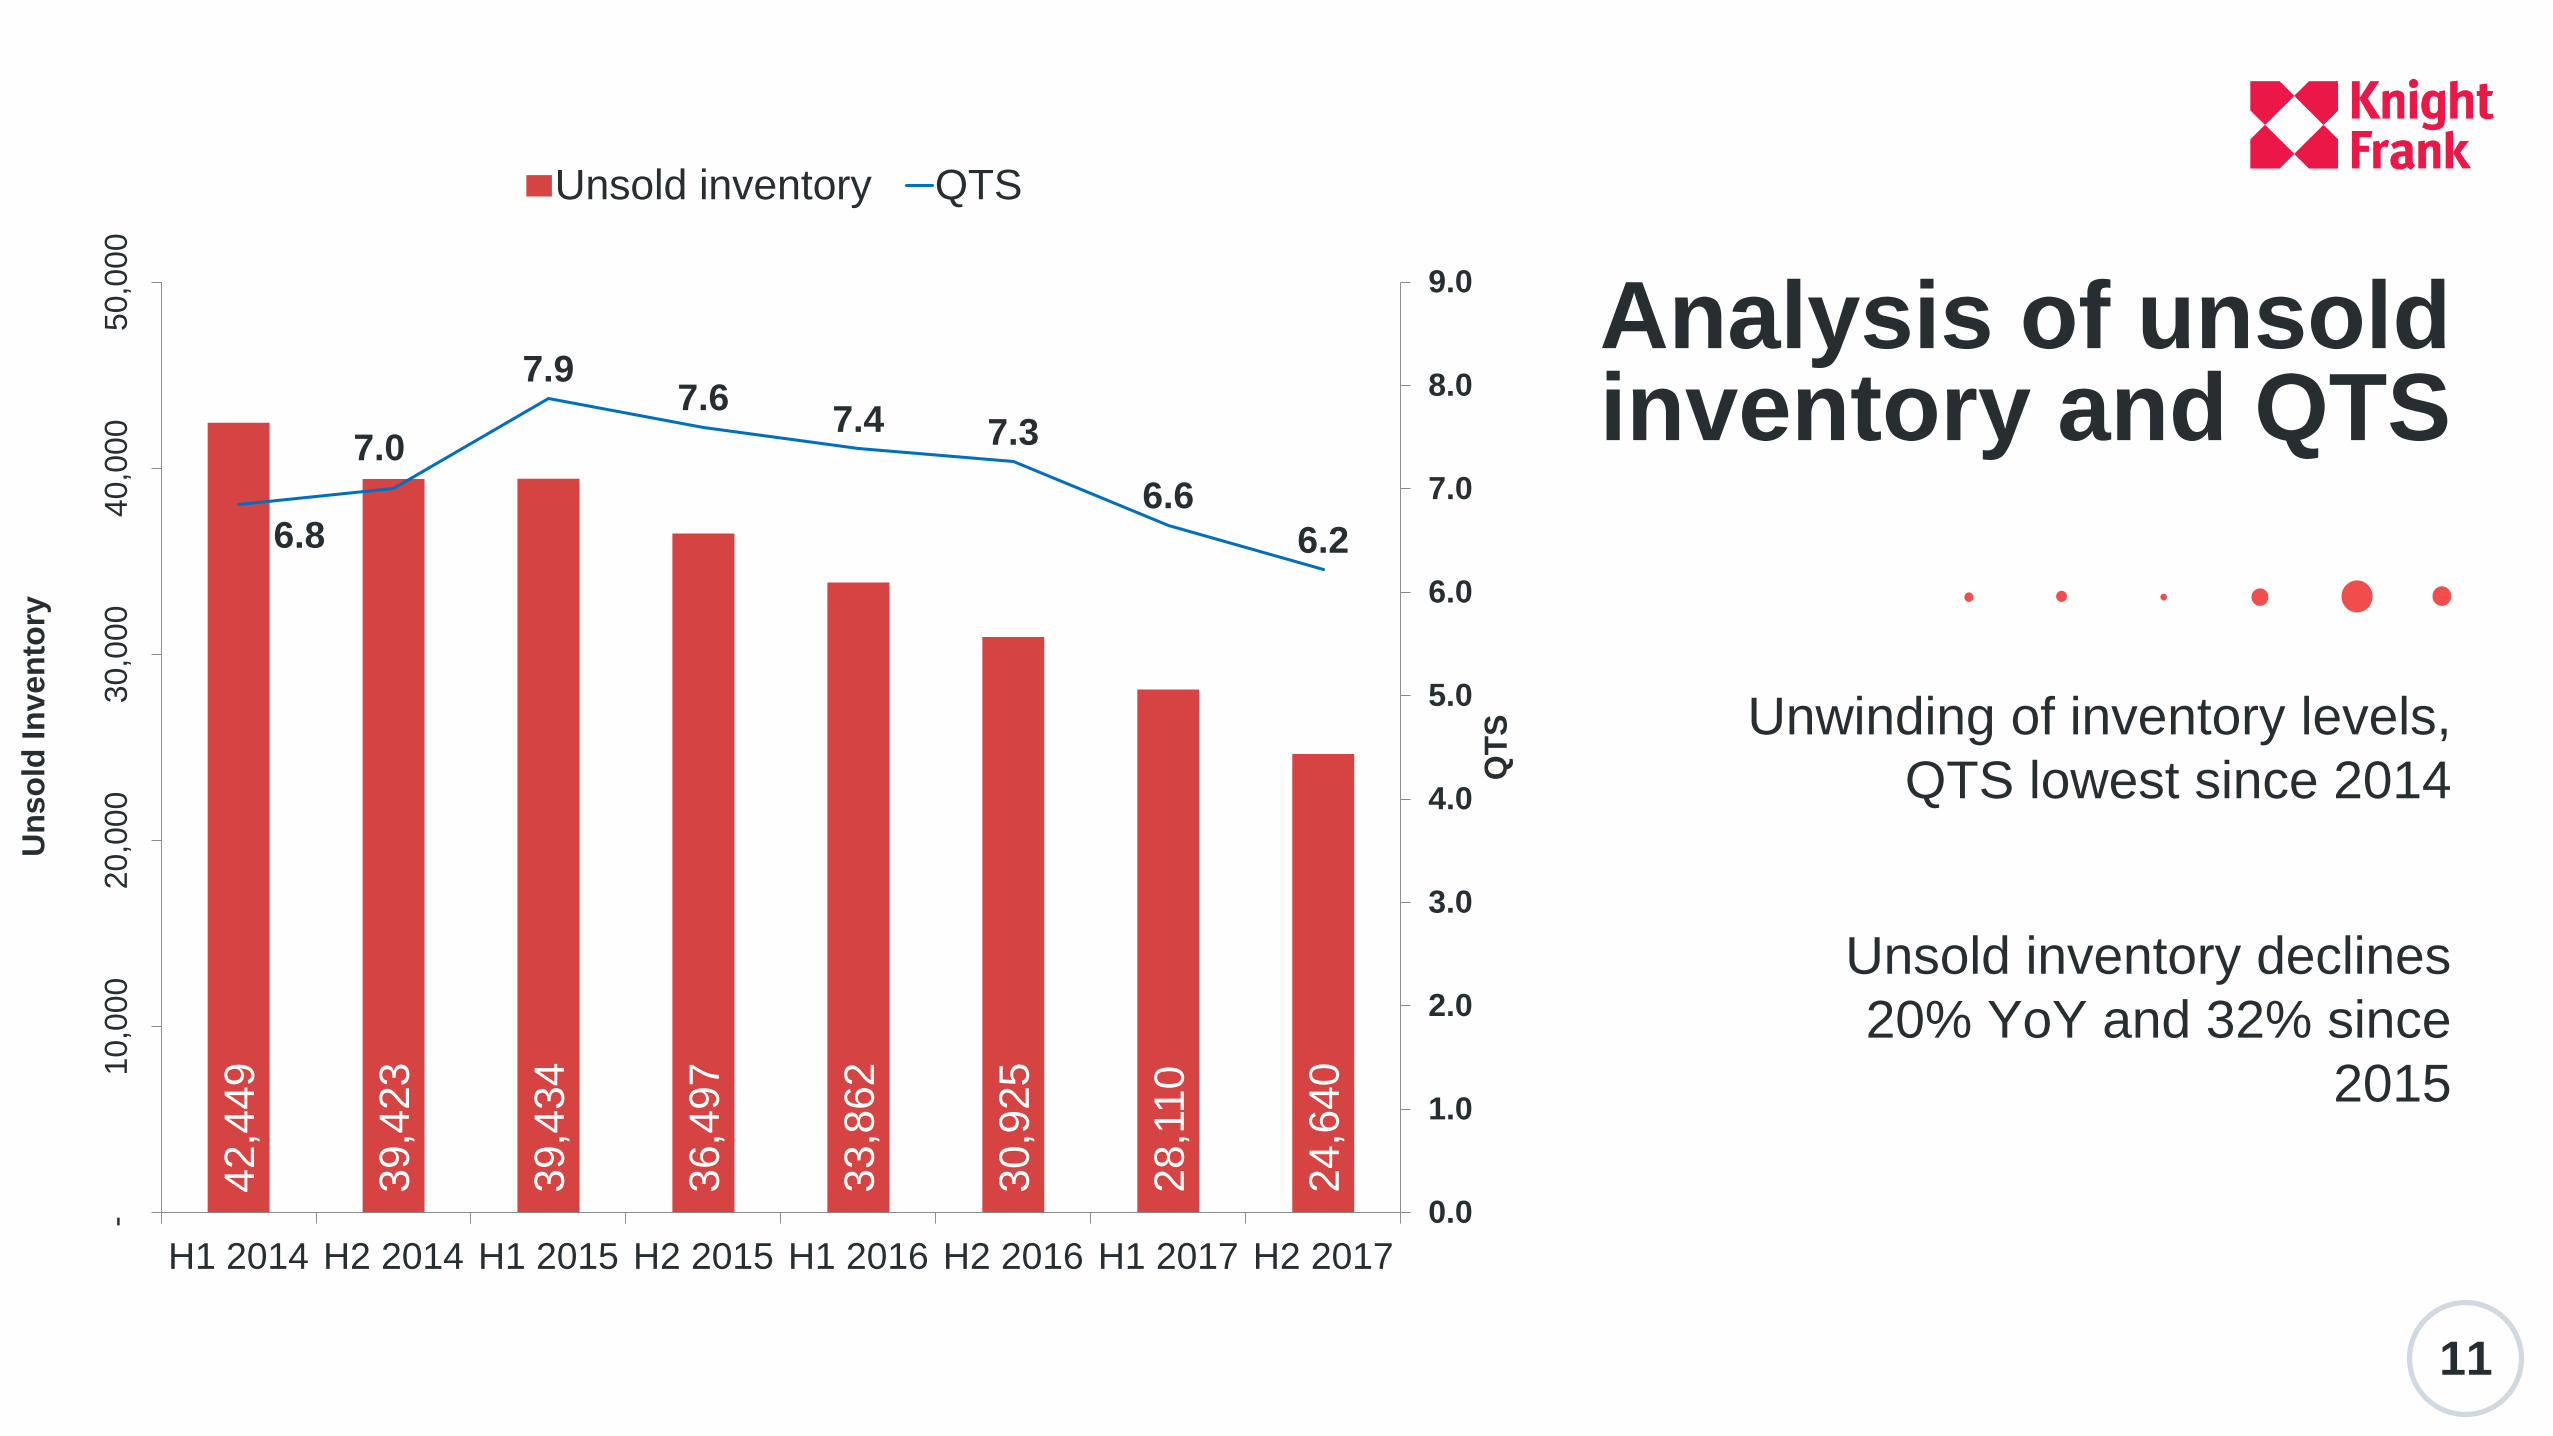
Unwinding of inventory levels,
QTS lowest since 2014
Unsold inventory declines
20% YoY and 32% since
2015
Analysis of unsold inventory and QTS
11
42,4
49
39,4
23
39,4
34
36,4
97
33,8
62
30,9
25
28,1
10
24,6
40
6.8
7.0
7.97.6
7.4 7.3
6.6
6.2
0.0
1.0
2.0
3.0
4.0
5.0
6.0
7.0
8.0
9.0
- 1
0,0
00
20,0
00
30,0
00
40,0
00
50,0
00
H1 2014 H2 2014 H1 2015 H2 2015 H1 2016 H2 2016 H1 2017 H2 2017
QT
S
Un
so
ld In
ven
tory
Unsold inventory QTS
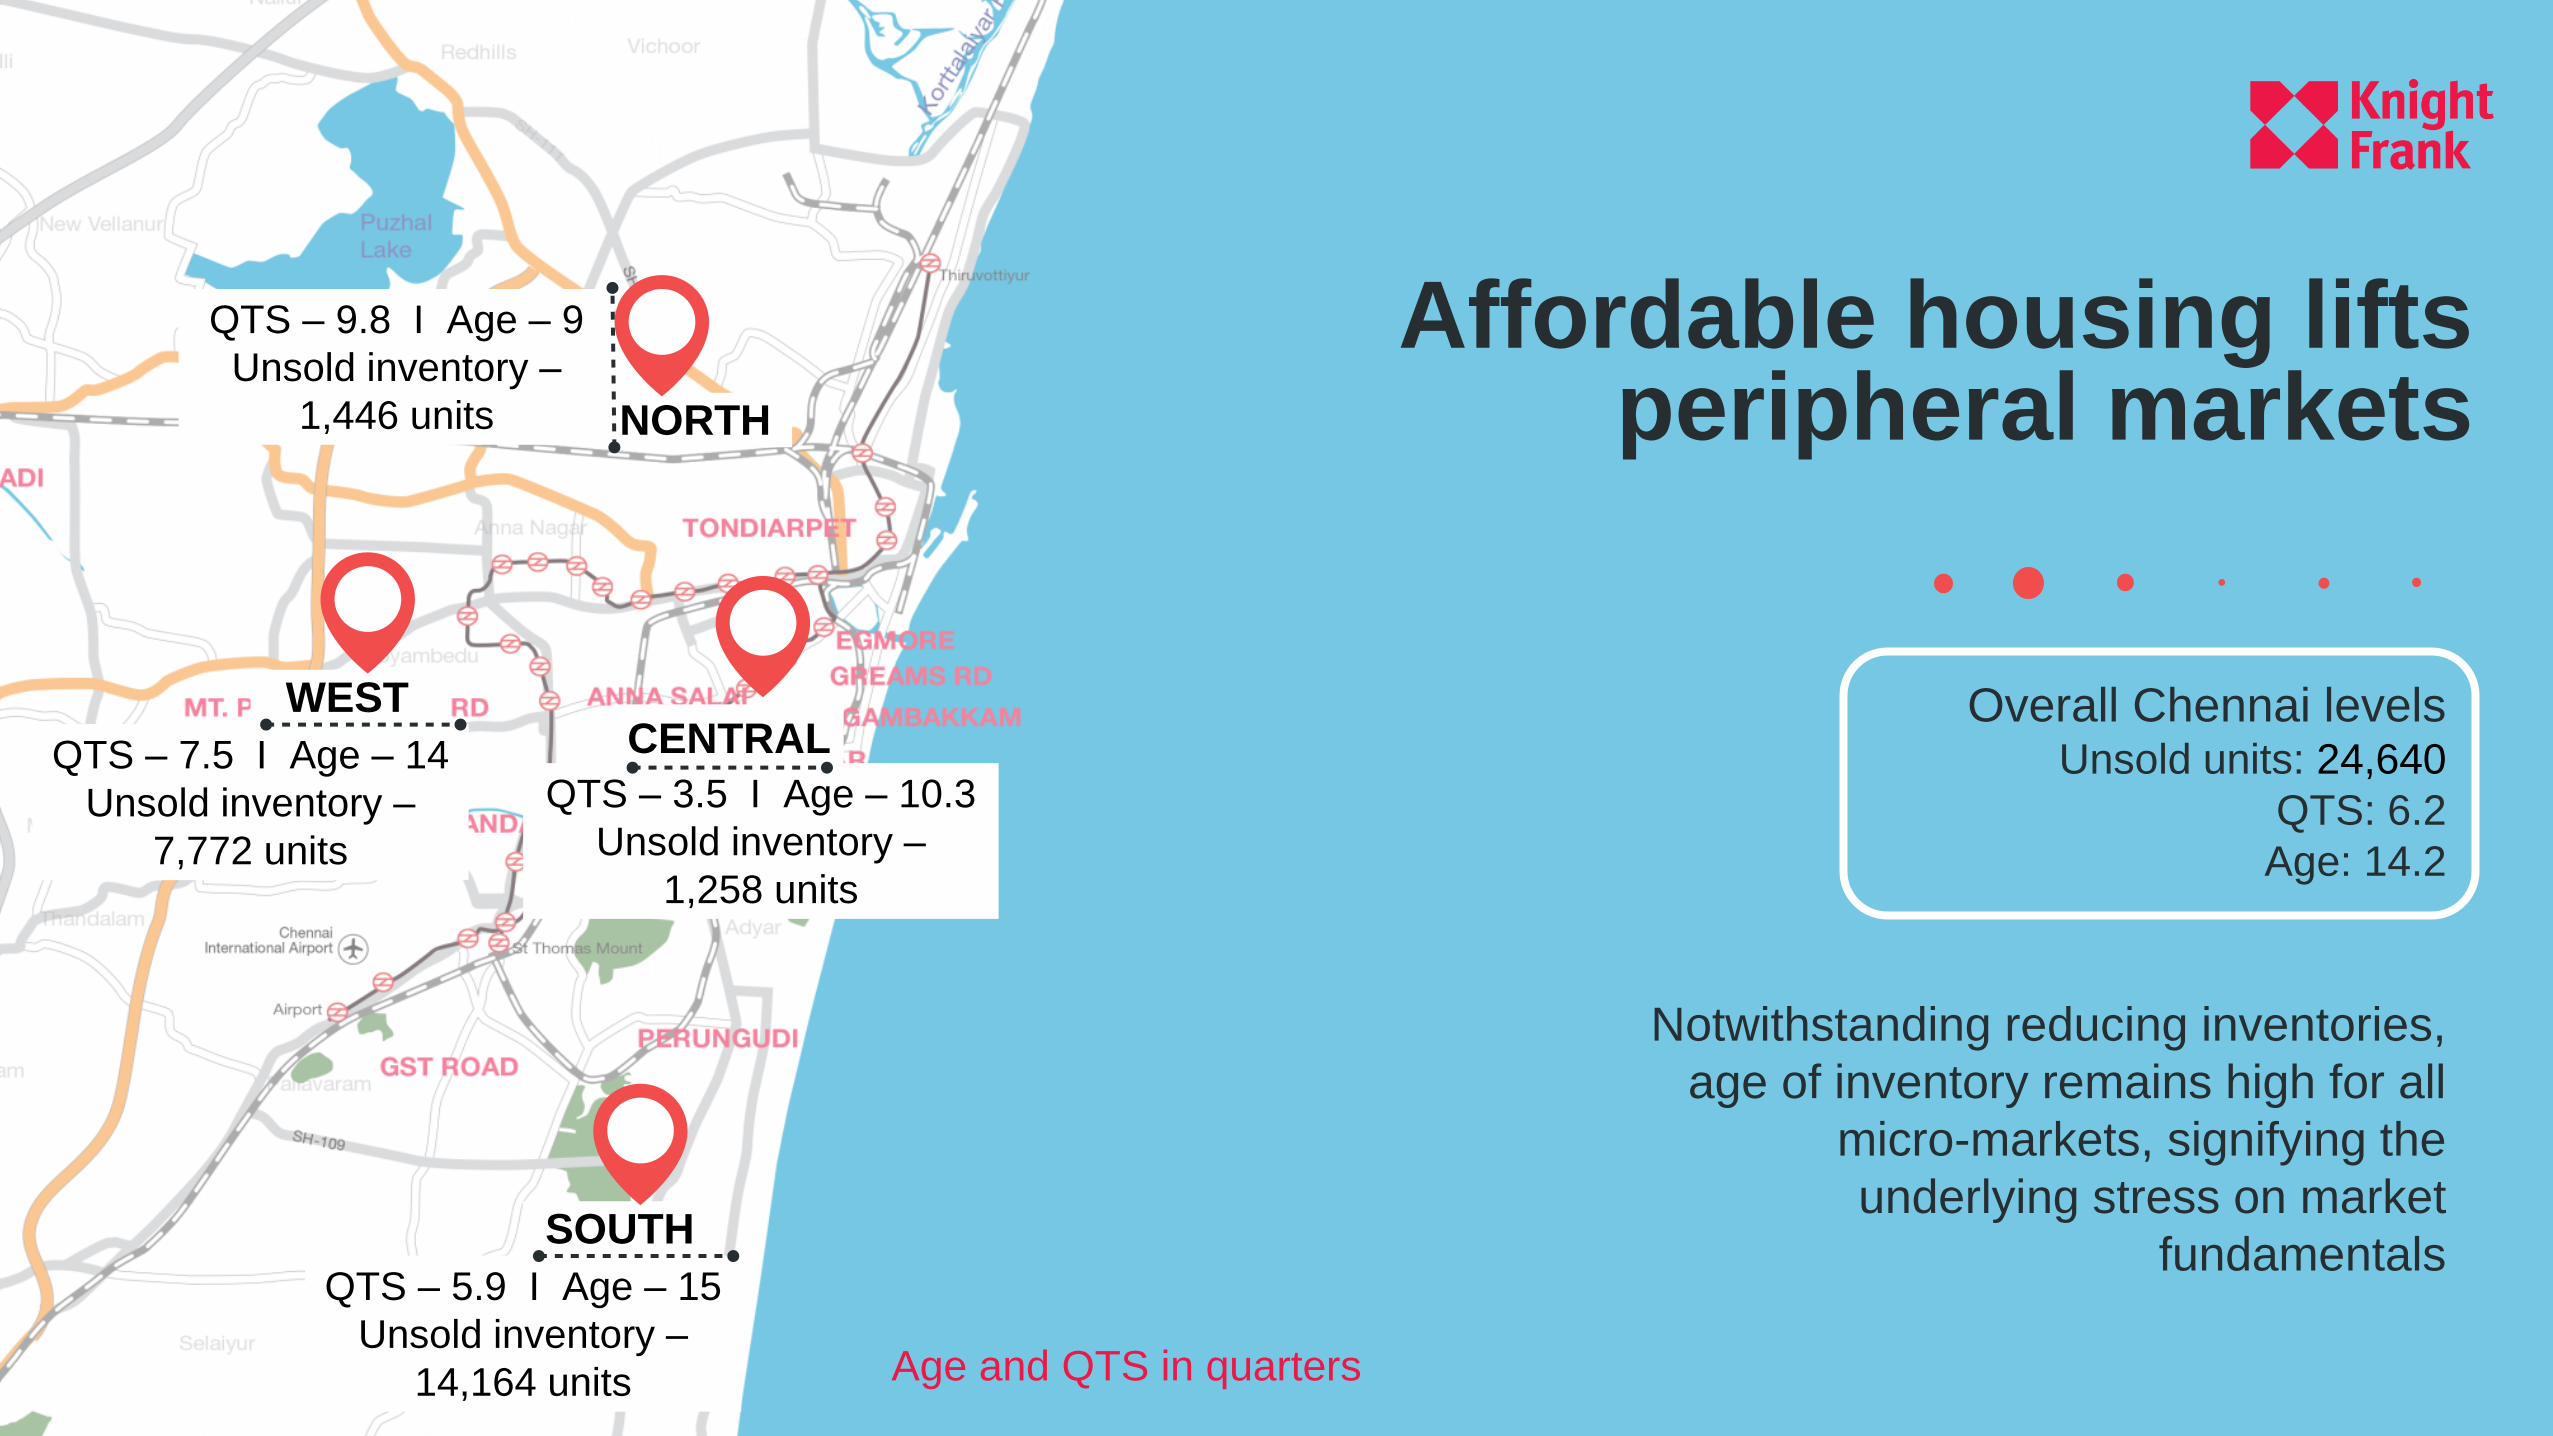
Affordable housing lifts peripheral markets
QTS – 9.8 I Age – 9
Unsold inventory –
1,446 units NORTH
QTS – 7.5 I Age – 14
Unsold inventory –
7,772 units
WEST
QTS – 5.9 I Age – 15
Unsold inventory –
14,164 units
SOUTH
QTS – 3.5 I Age – 10.3
Unsold inventory –
1,258 units
CENTRALOverall Chennai levels
Unsold units: 24,640
QTS: 6.2
Age: 14.2
Notwithstanding reducing inventories,
age of inventory remains high for all
micro-markets, signifying the
underlying stress on market
fundamentals
Age and QTS in quarters
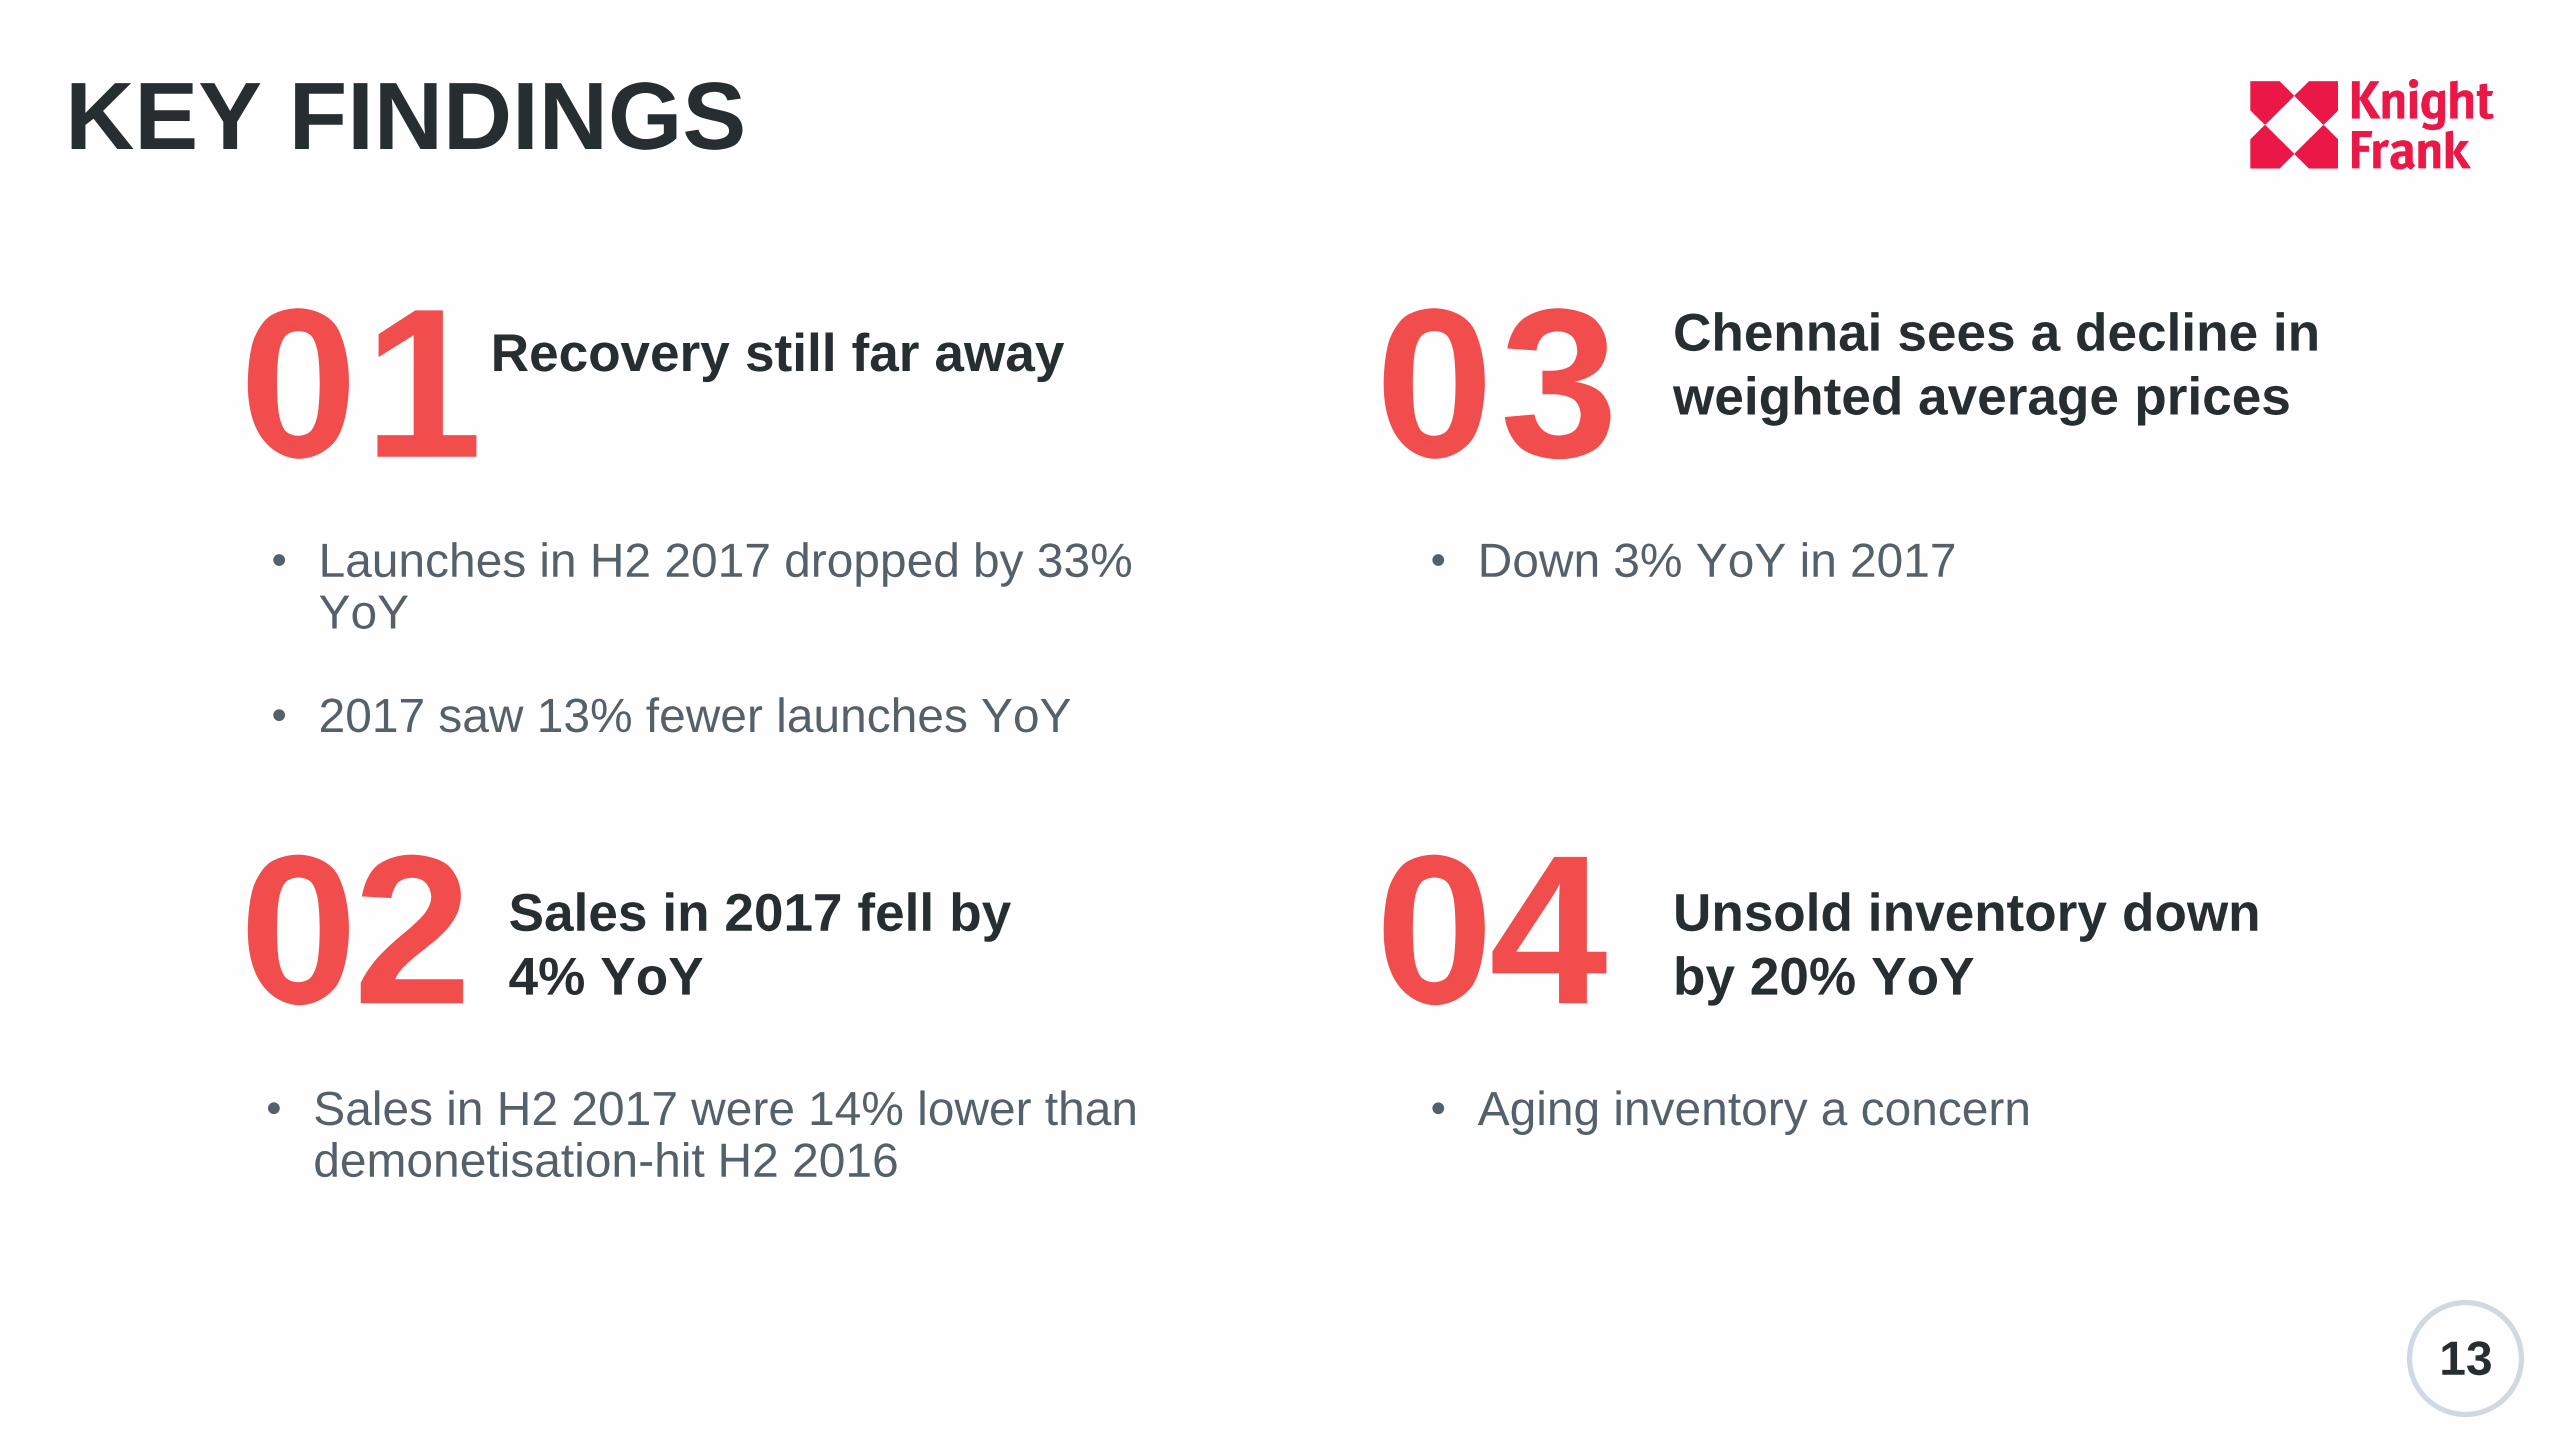
KEY FINDINGS
13
01 03
02 04
Recovery still far away Chennai sees a decline in
weighted average prices
• Down 3% YoY in 2017
Unsold inventory down
by 20% YoY
• Aging inventory a concern
Sales in 2017 fell by
4% YoY
• Sales in H2 2017 were 14% lower than demonetisation-hit H2 2016
• Launches in H2 2017 dropped by 33% YoY
• 2017 saw 13% fewer launches YoY

14
Supply crunch made office
vacancies plummet
IT/ITeS and manufacturing
share narrowed
OFFICE RECAP H1 2017
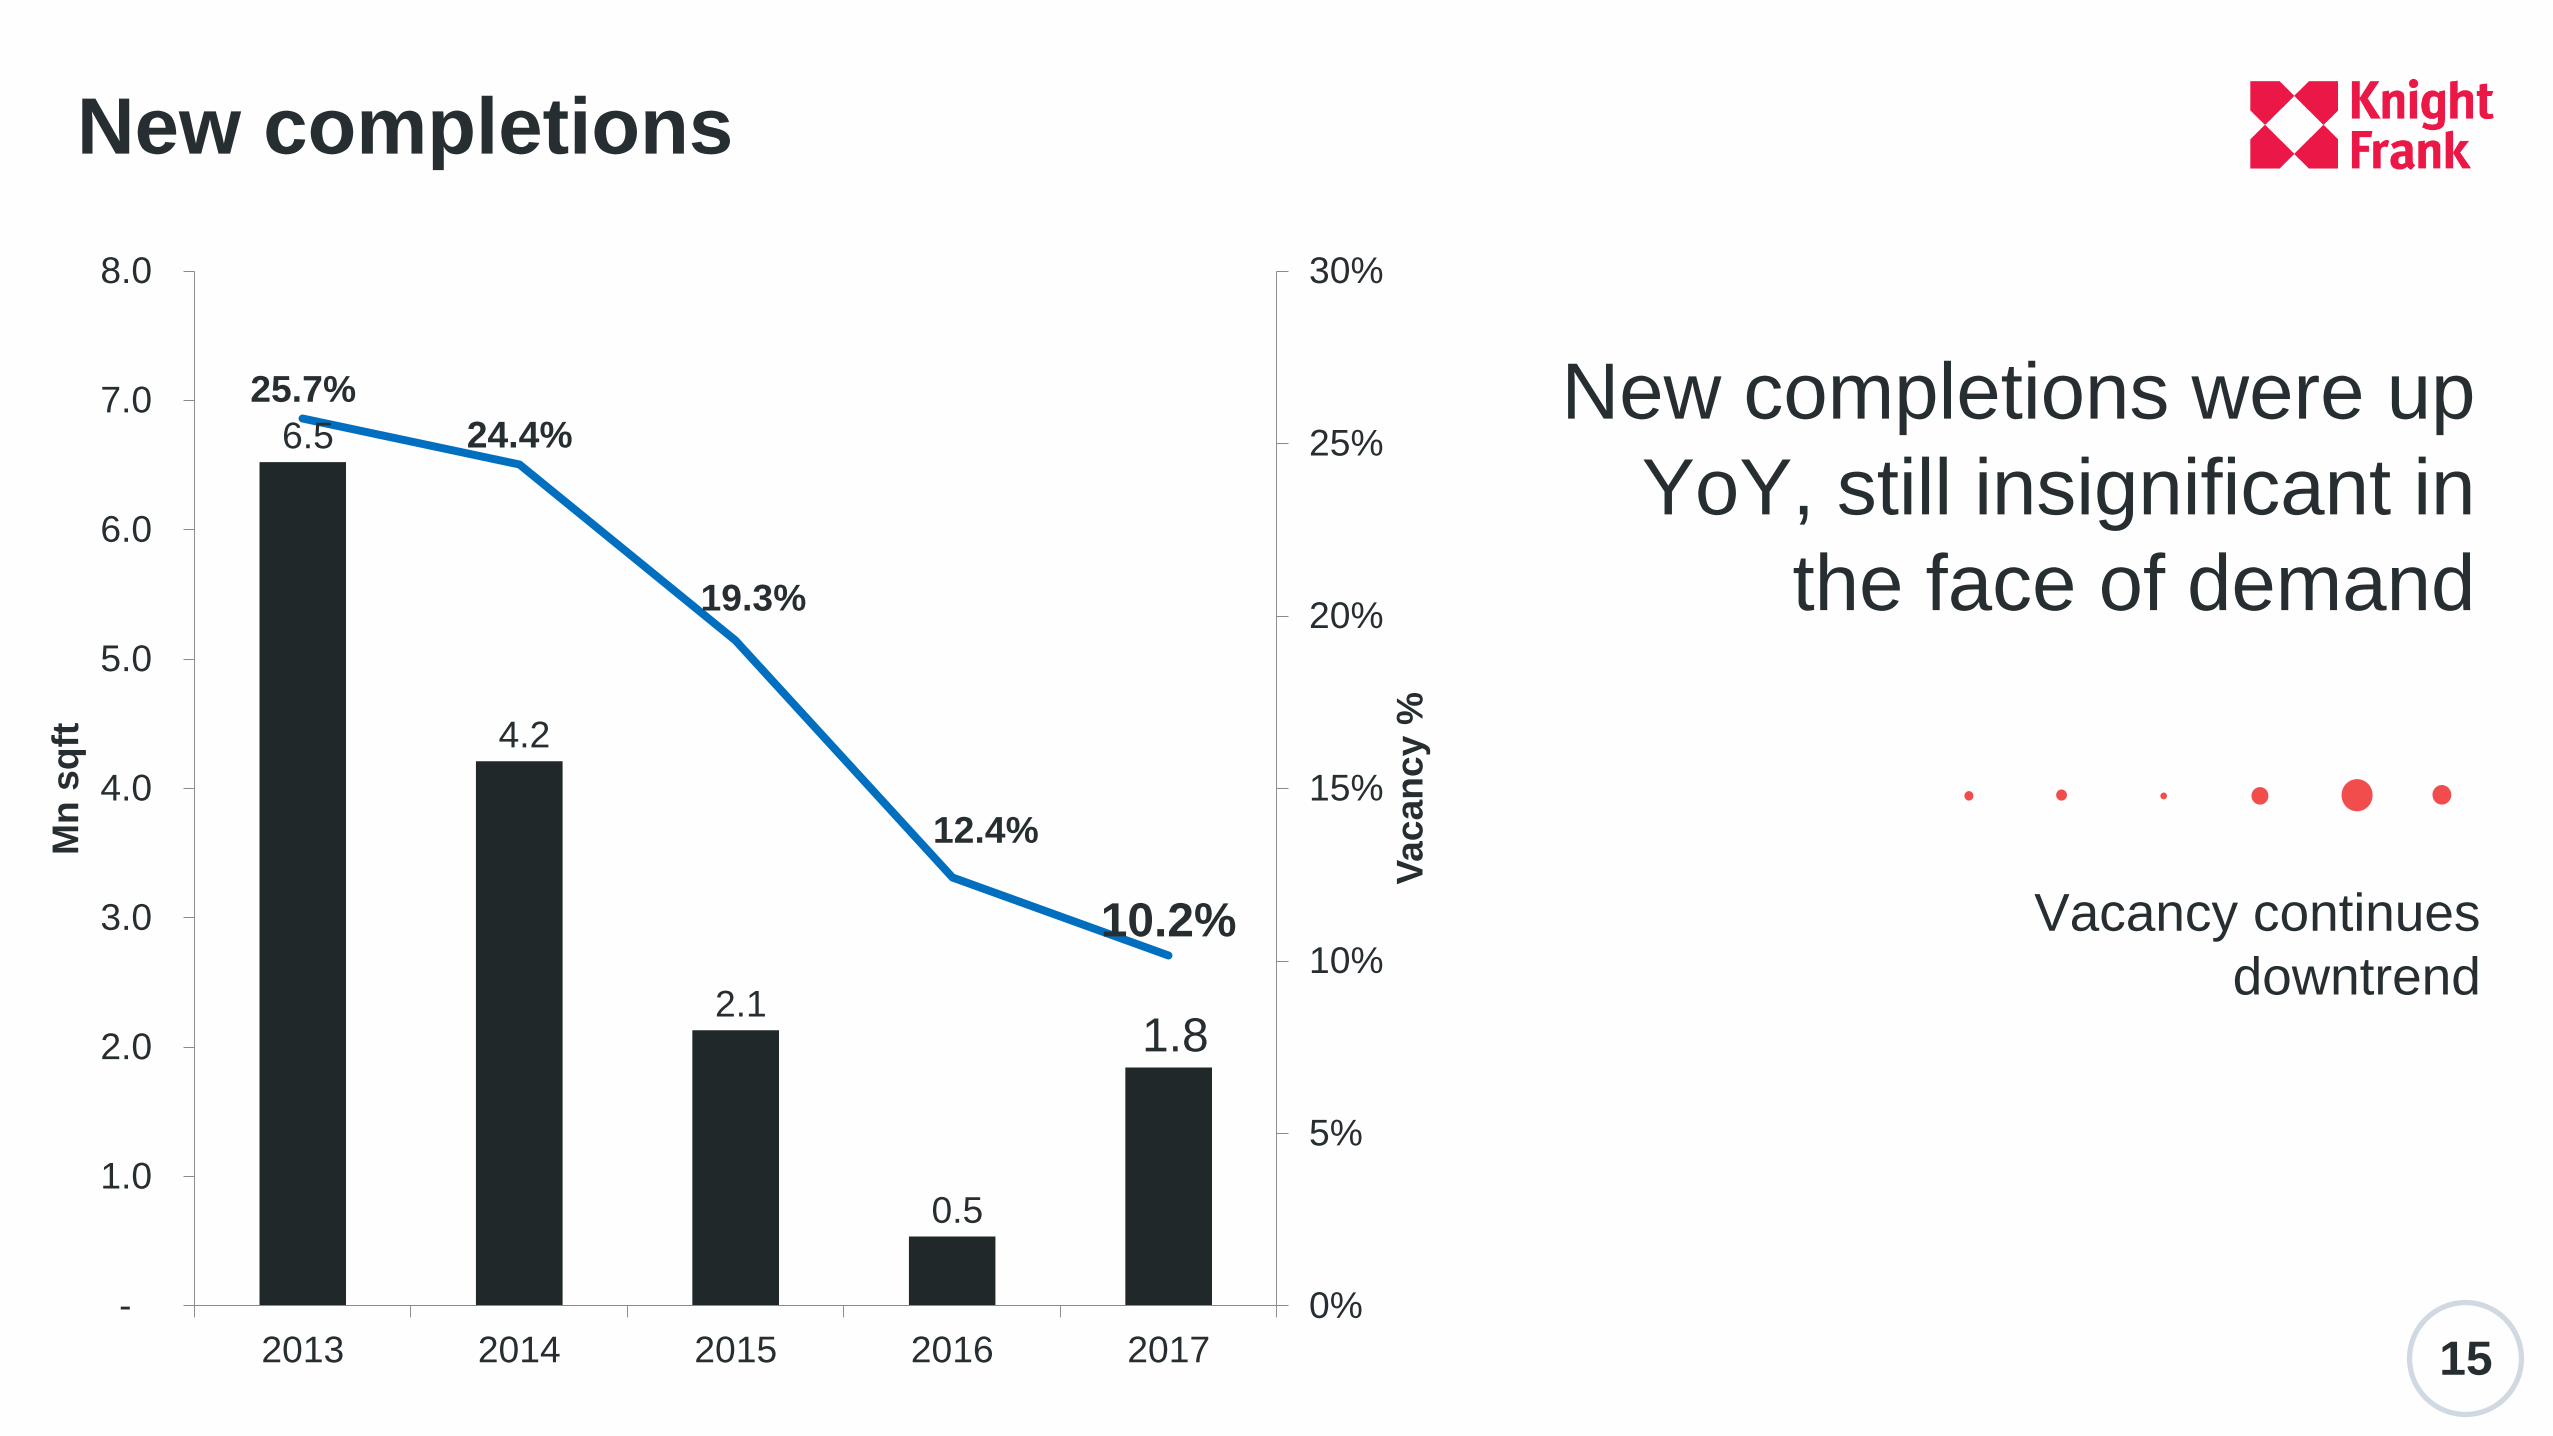
Vacancy continues
downtrend
15
6.5
4.2
2.1
0.5
1.8
25.7%
24.4%
19.3%
12.4%
10.2%
0%
5%
10%
15%
20%
25%
30%
-
1.0
2.0
3.0
4.0
5.0
6.0
7.0
8.0
2013 2014 2015 2016 2017
Vac
an
cy %
Mn
sq
ft
New completions
New completions were up
YoY, still insignificant in
the face of demand
16
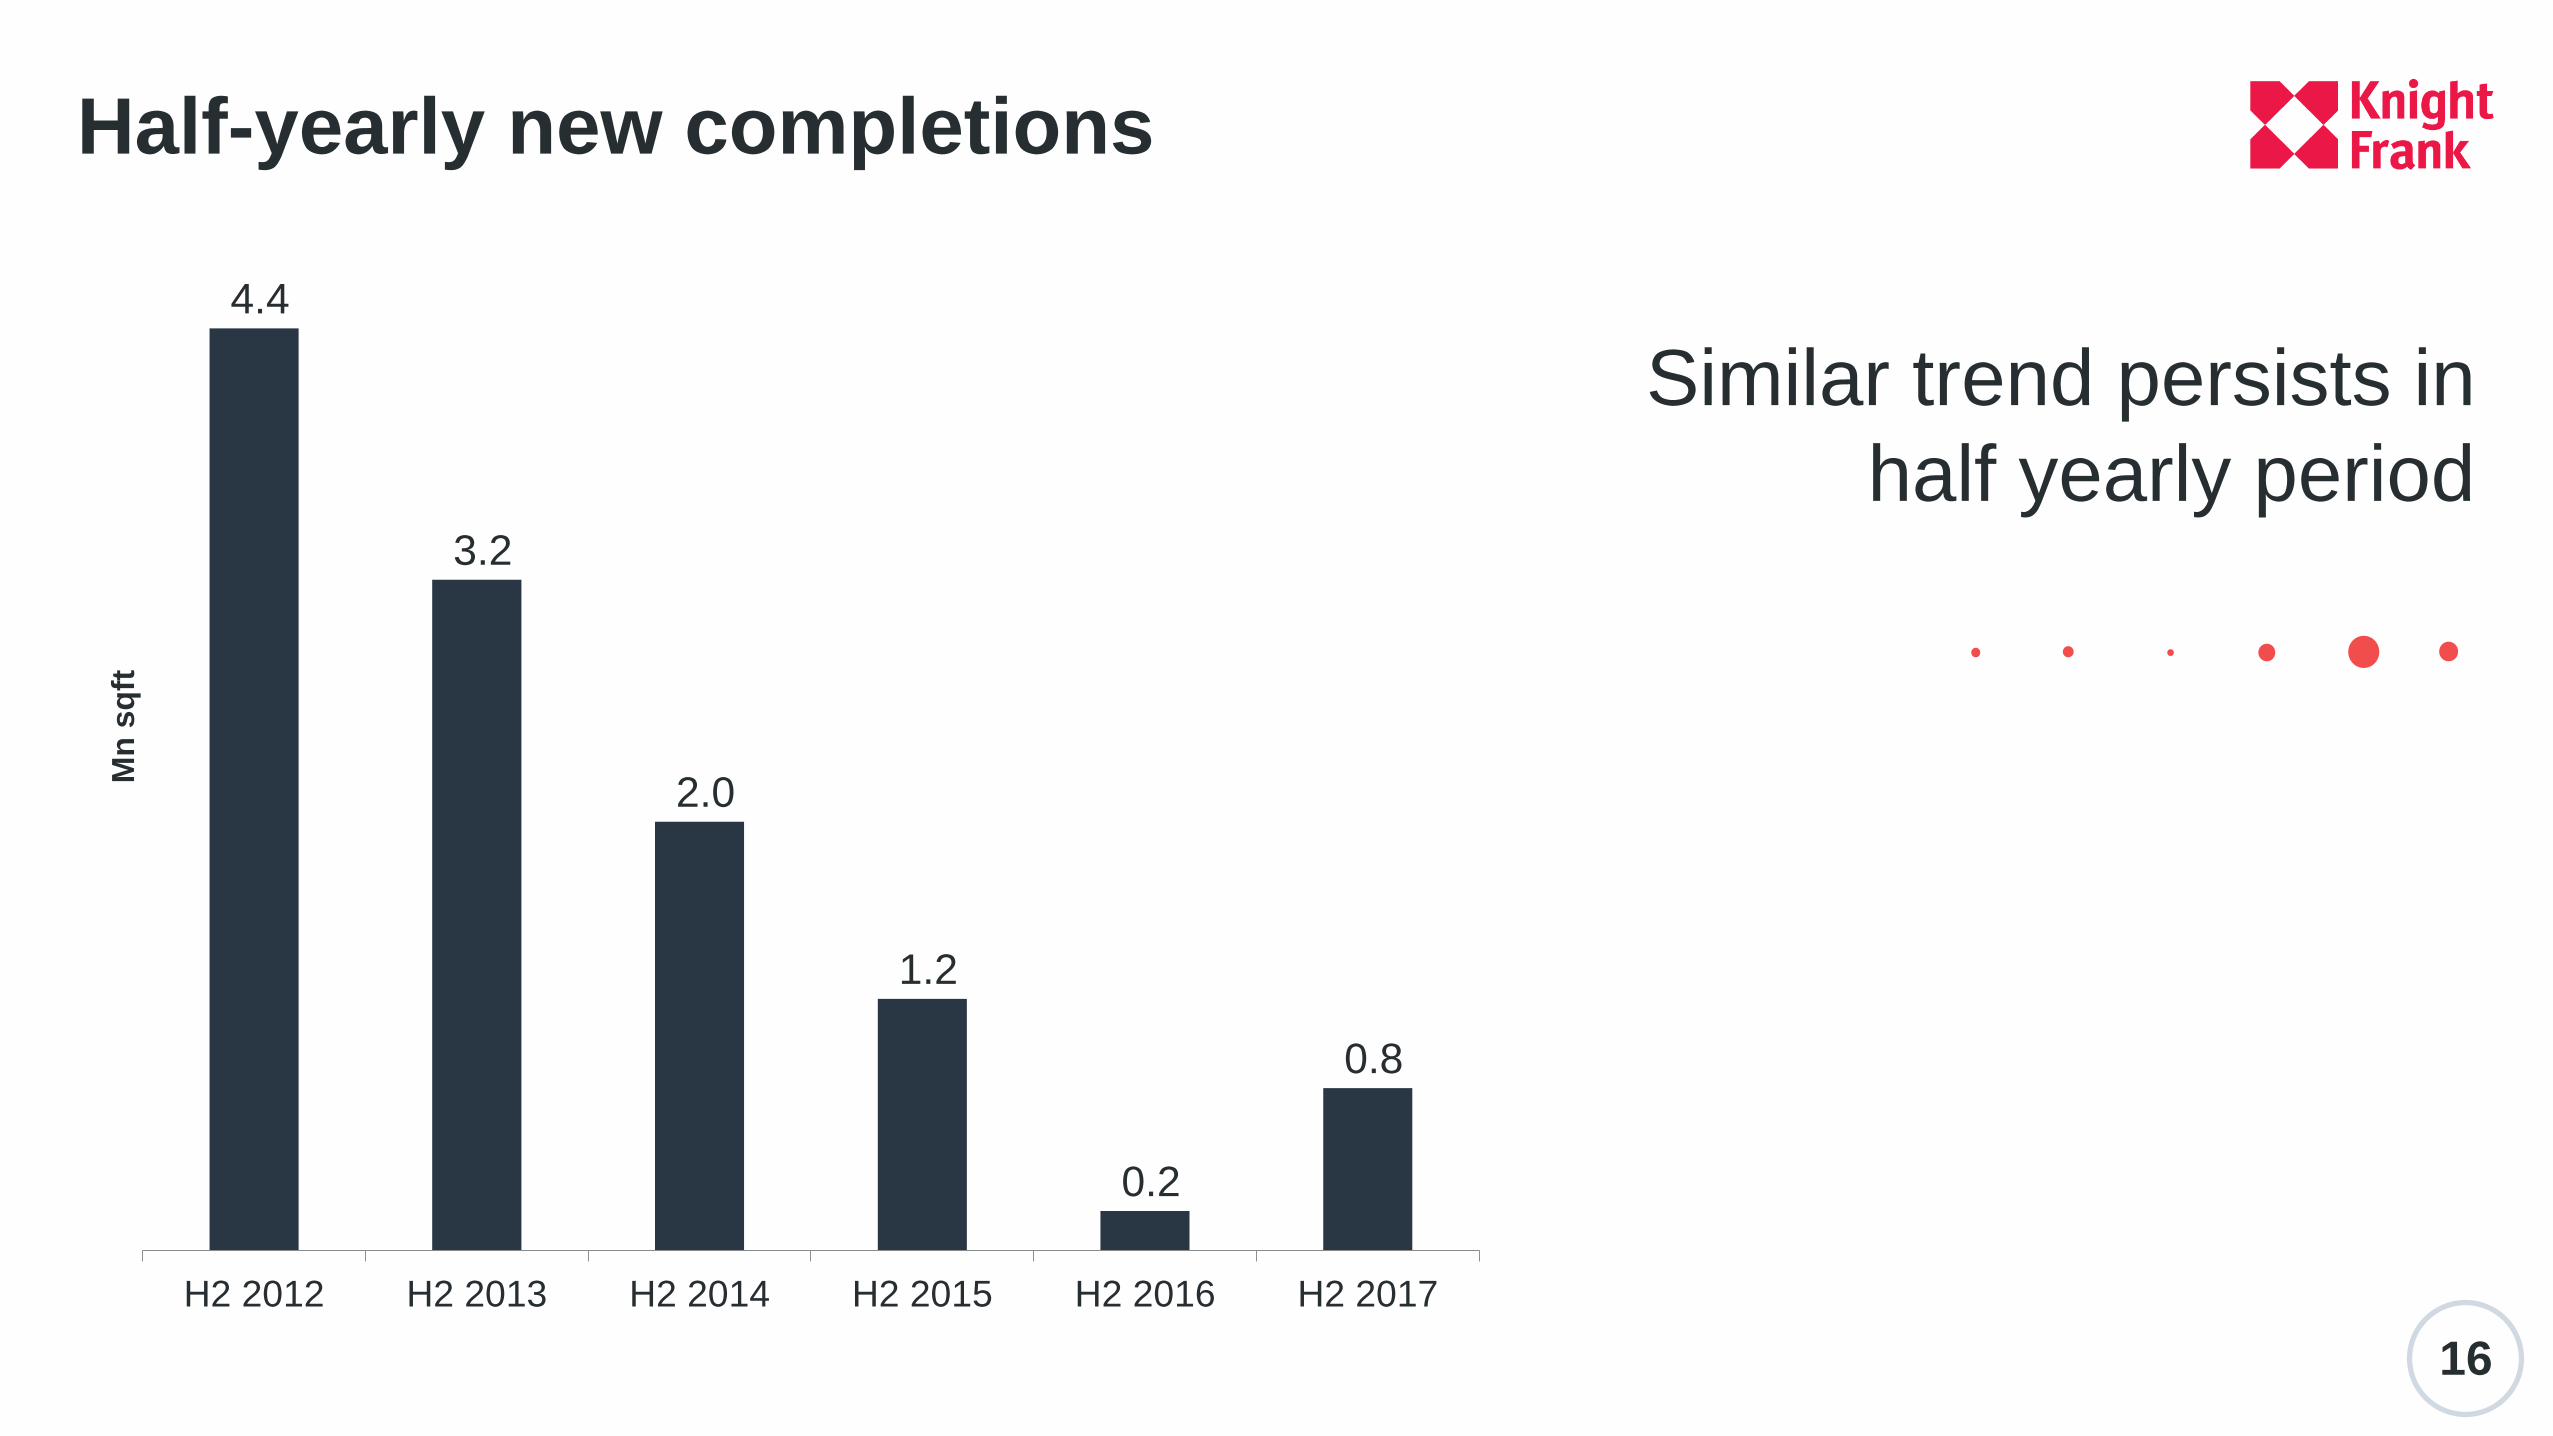
4.4
3.2
2.0
1.2
0.2
0.8
H2 2012 H2 2013 H2 2014 H2 2015 H2 2016 H2 2017
Mn
sq
ftHalf-yearly new completions
Similar trend persists in
half yearly period
17
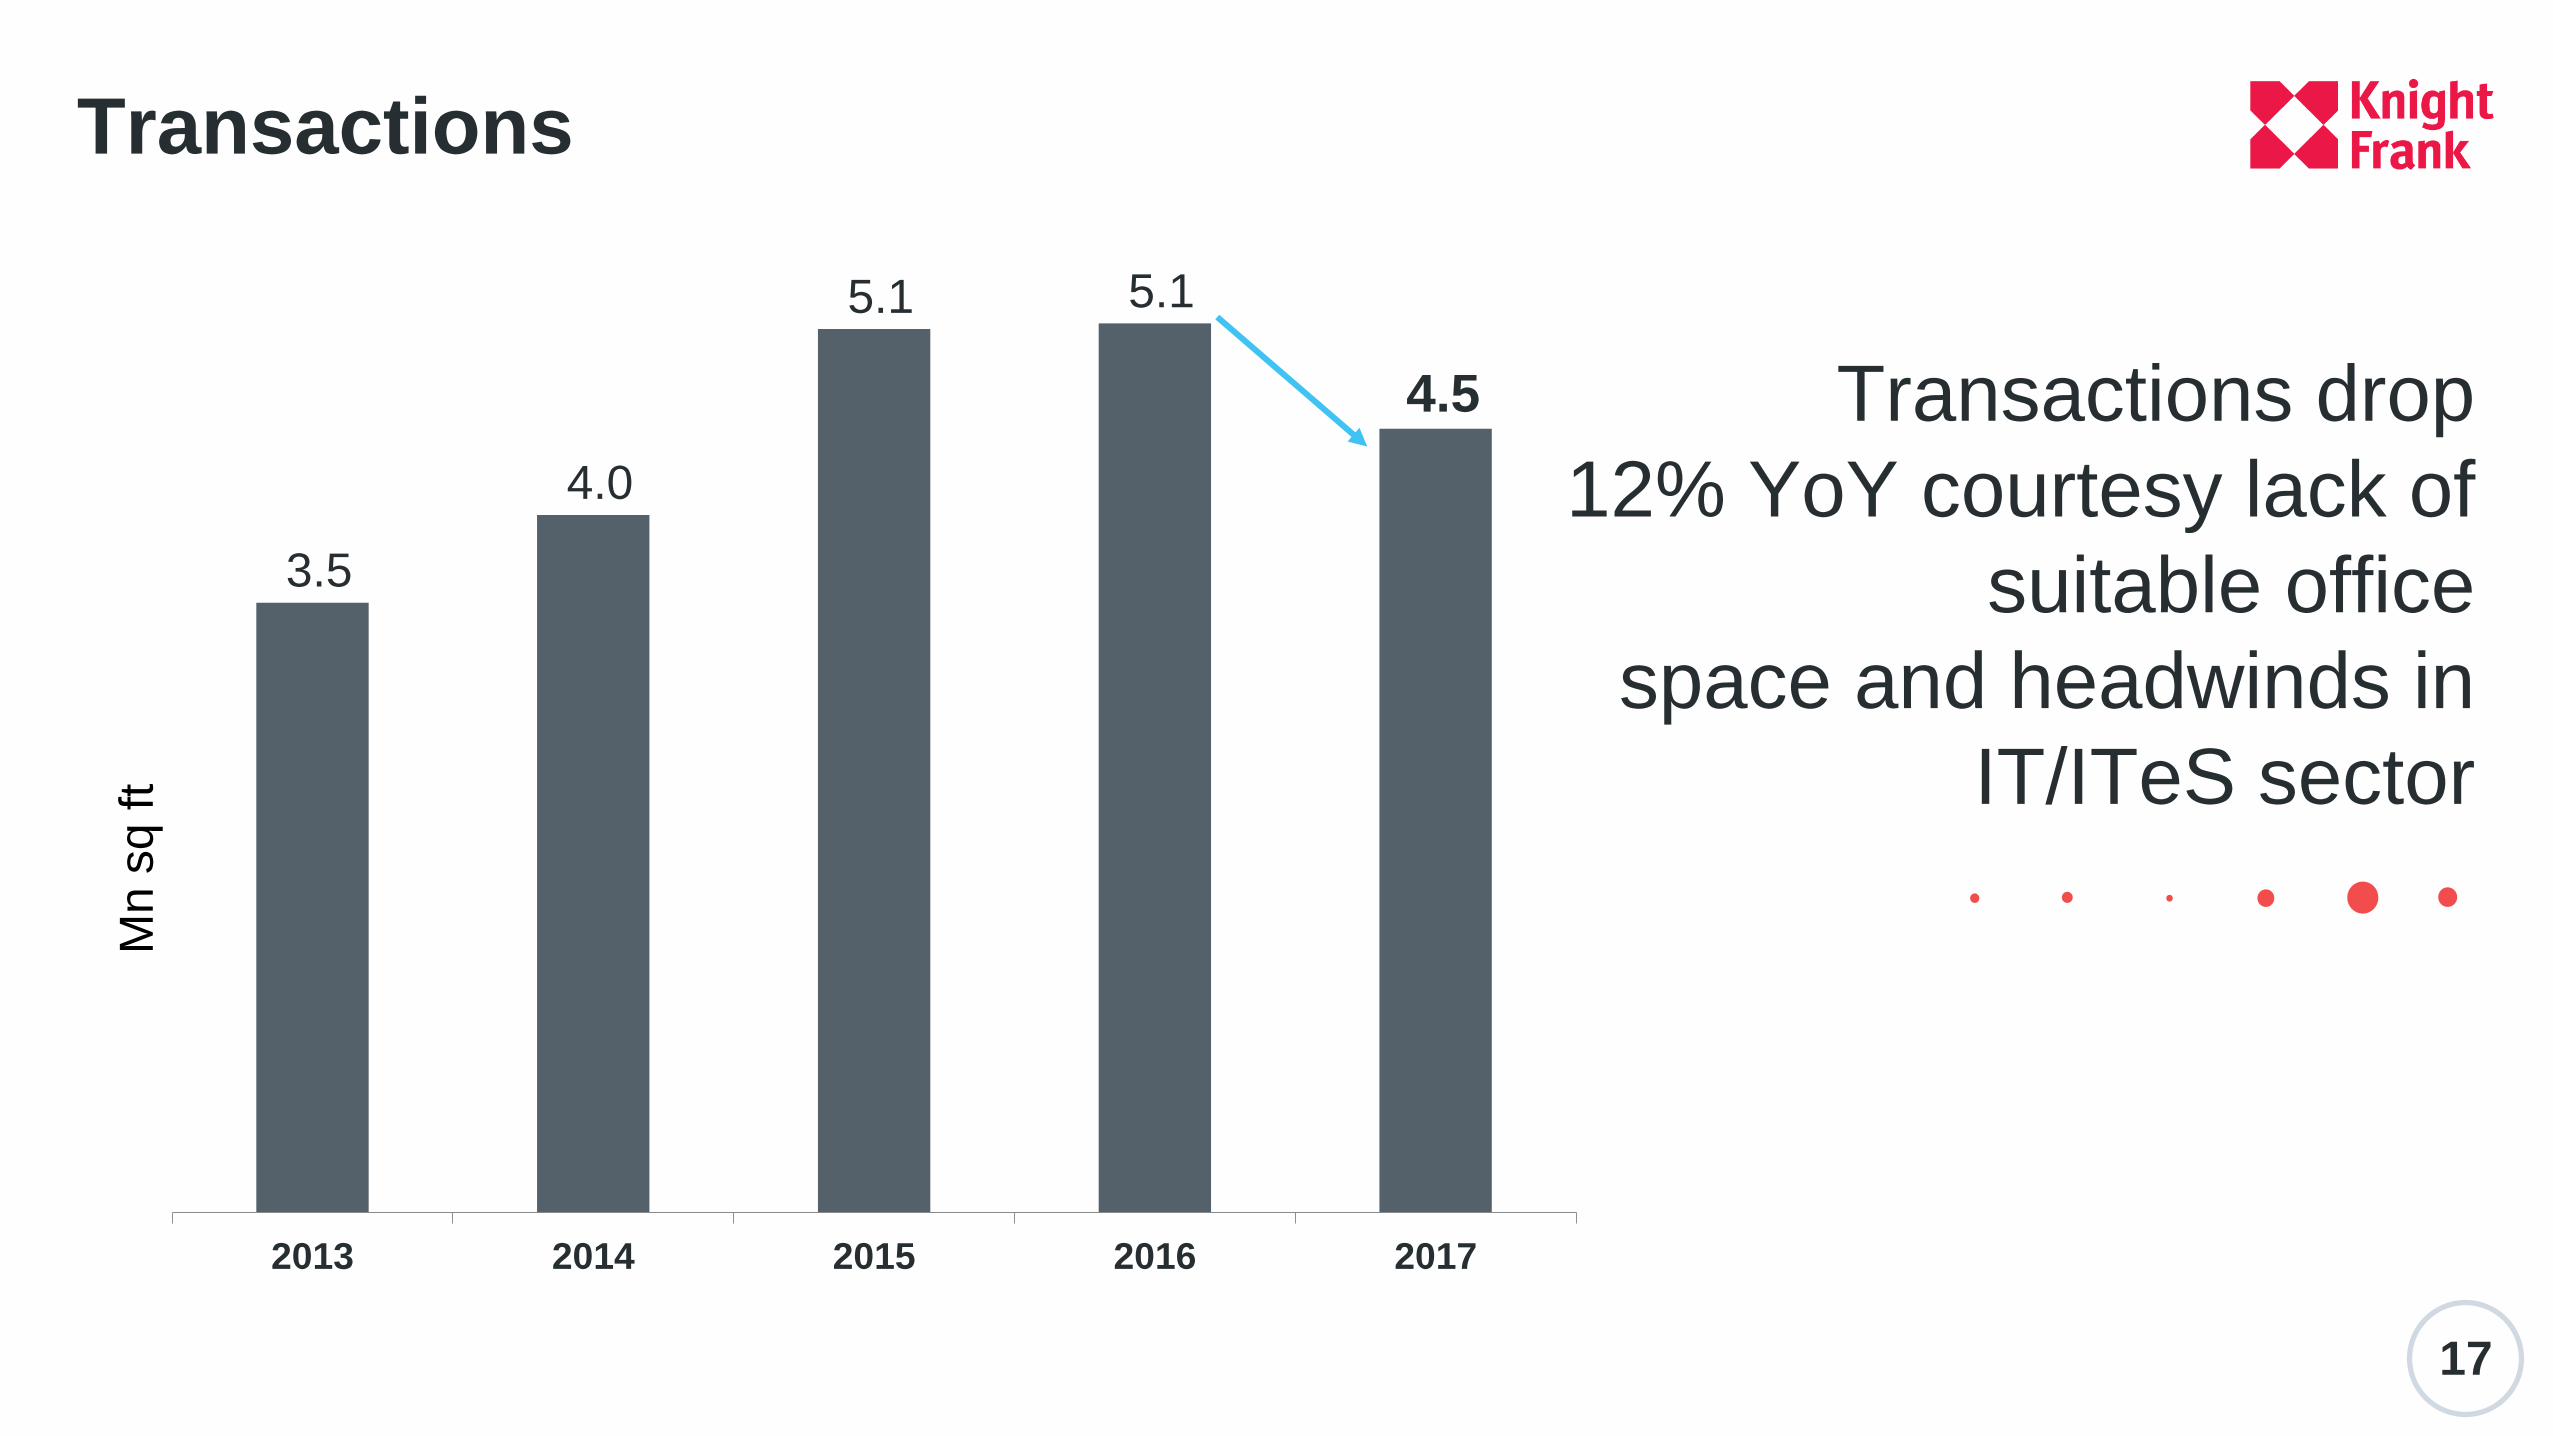
3.5
4.0
5.1 5.1
4.5
2013 2014 2015 2016 2017
Transactions
Transactions drop
12% YoY courtesy lack of
suitable office
space and headwinds in
IT/ITeS sector
Mn
sq
ft
18
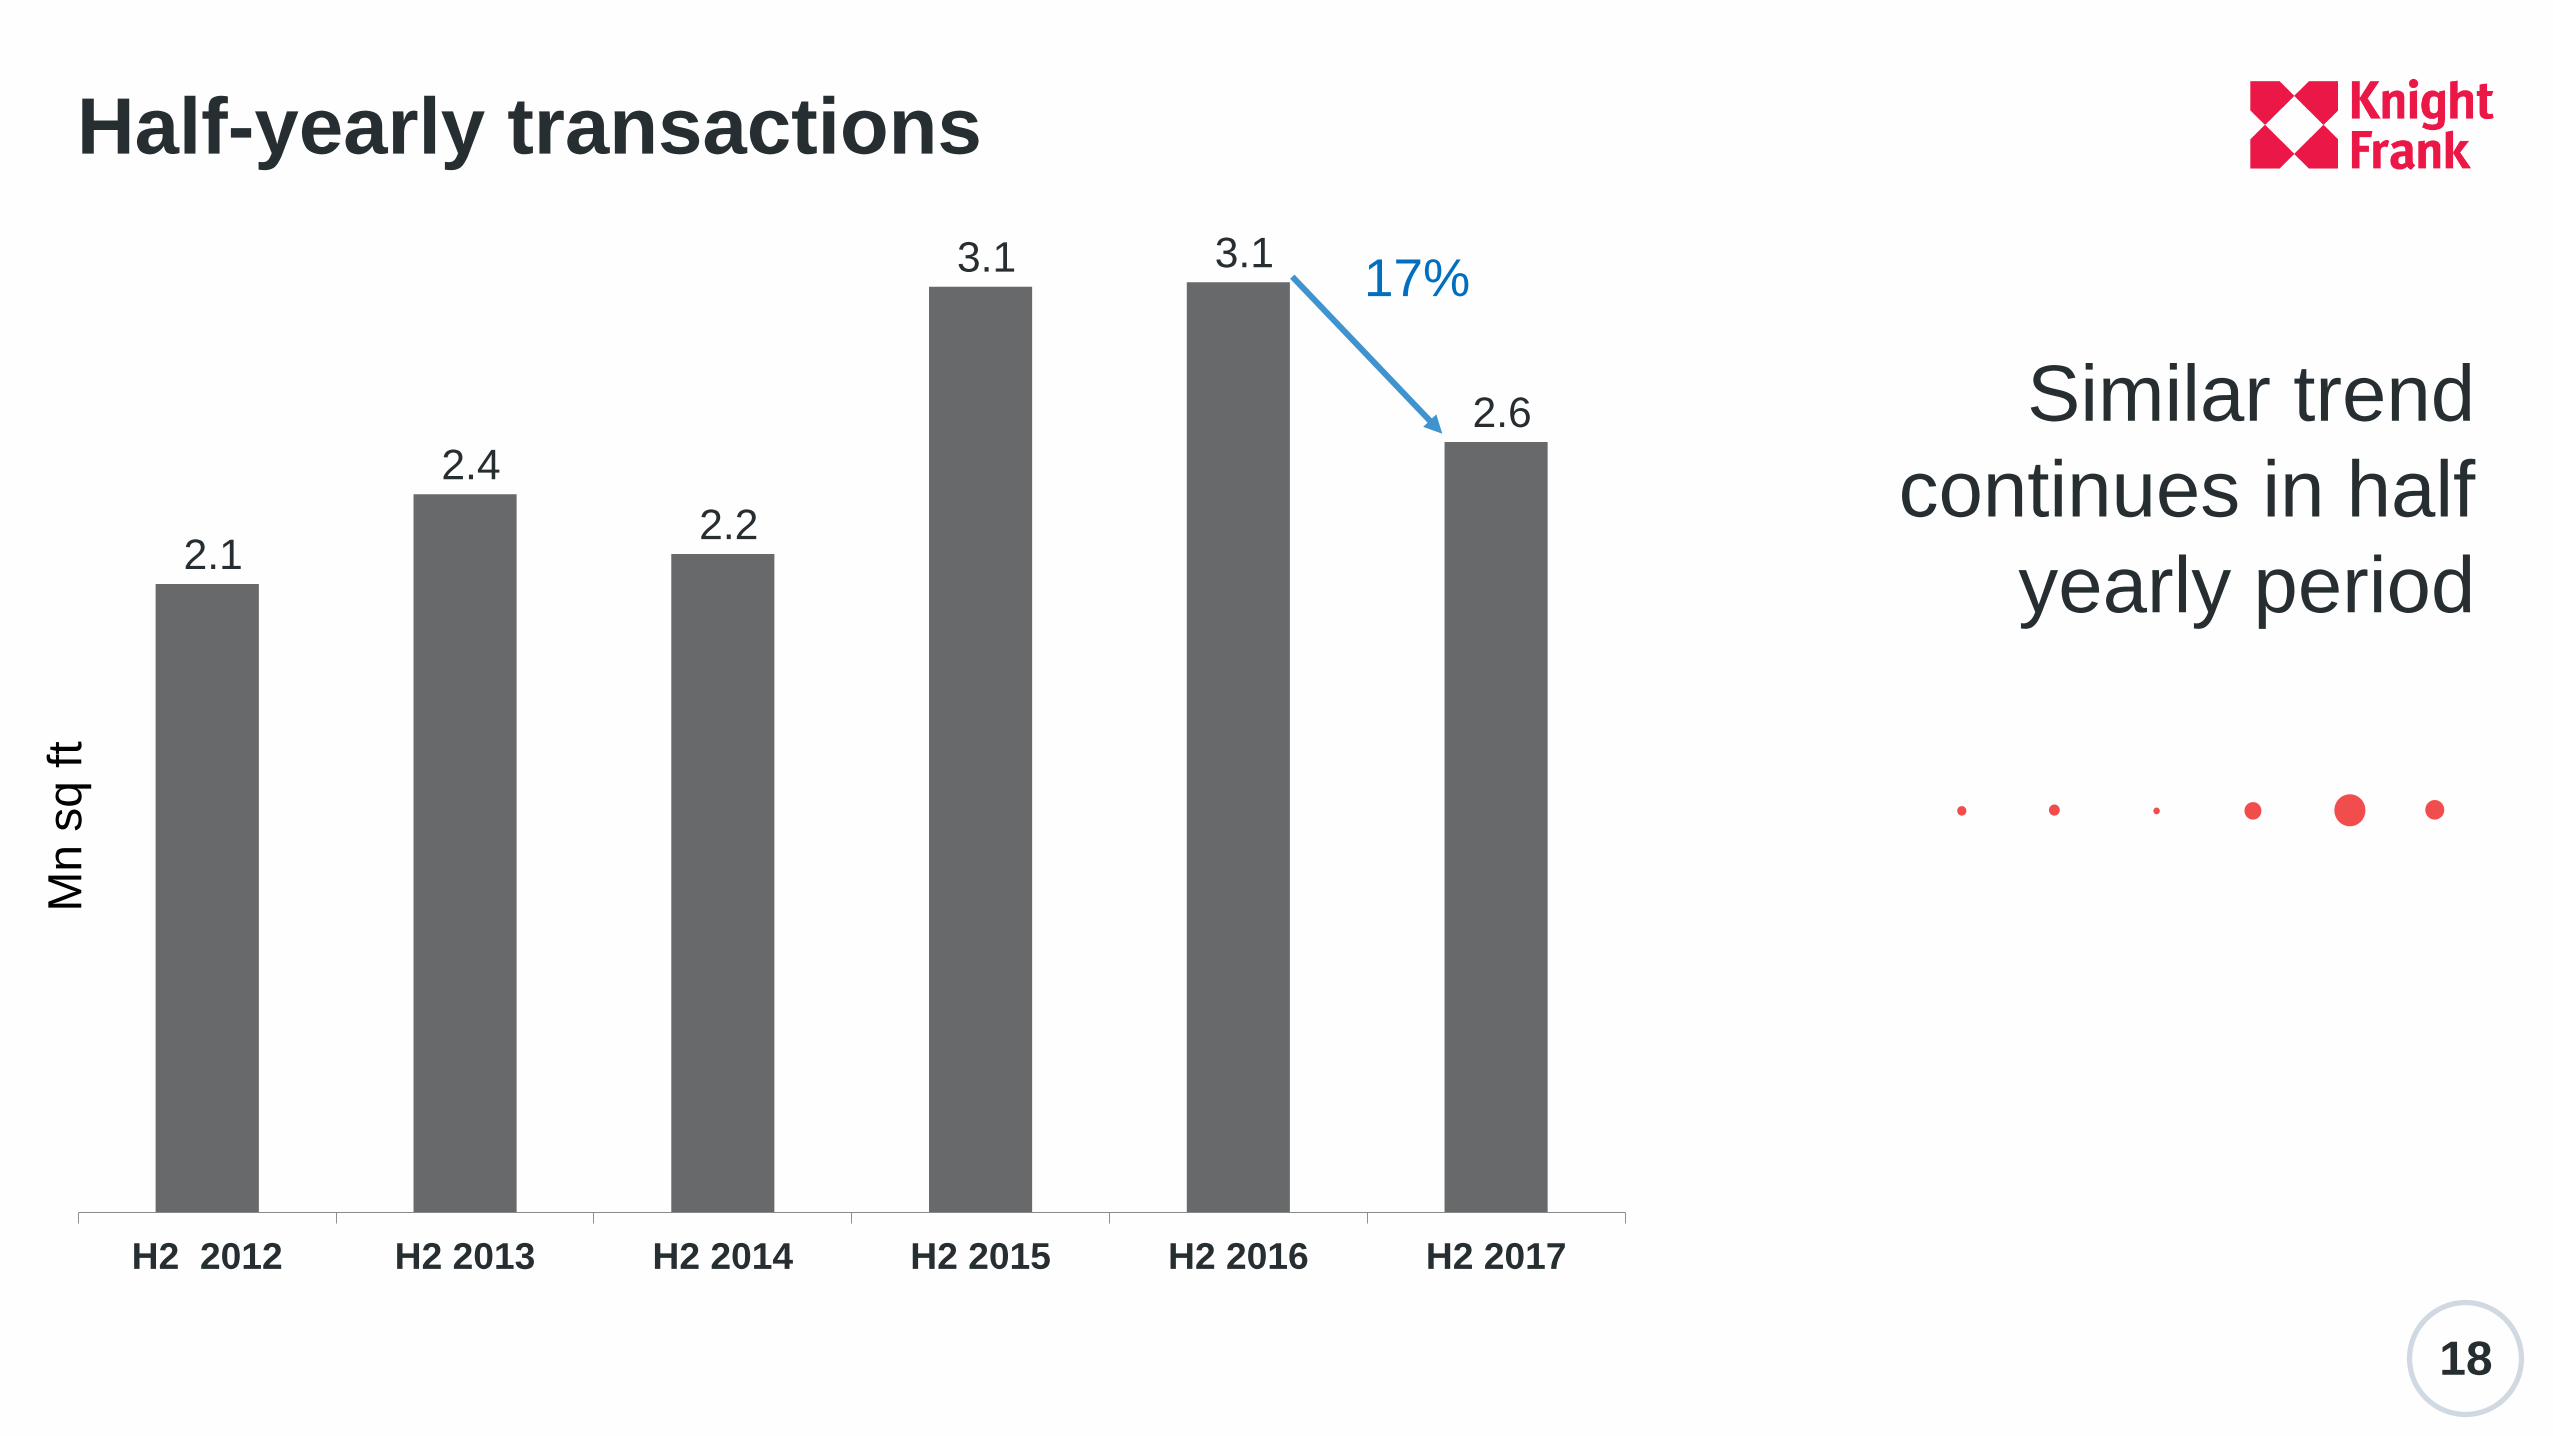
2.1
2.4
2.2
3.1 3.1
2.6
H2 2012 H2 2013 H2 2014 H2 2015 H2 2016 H2 2017
Half-yearly transactions
Similar trend
continues in half
yearly period
Mn
sq
ft
17%
19
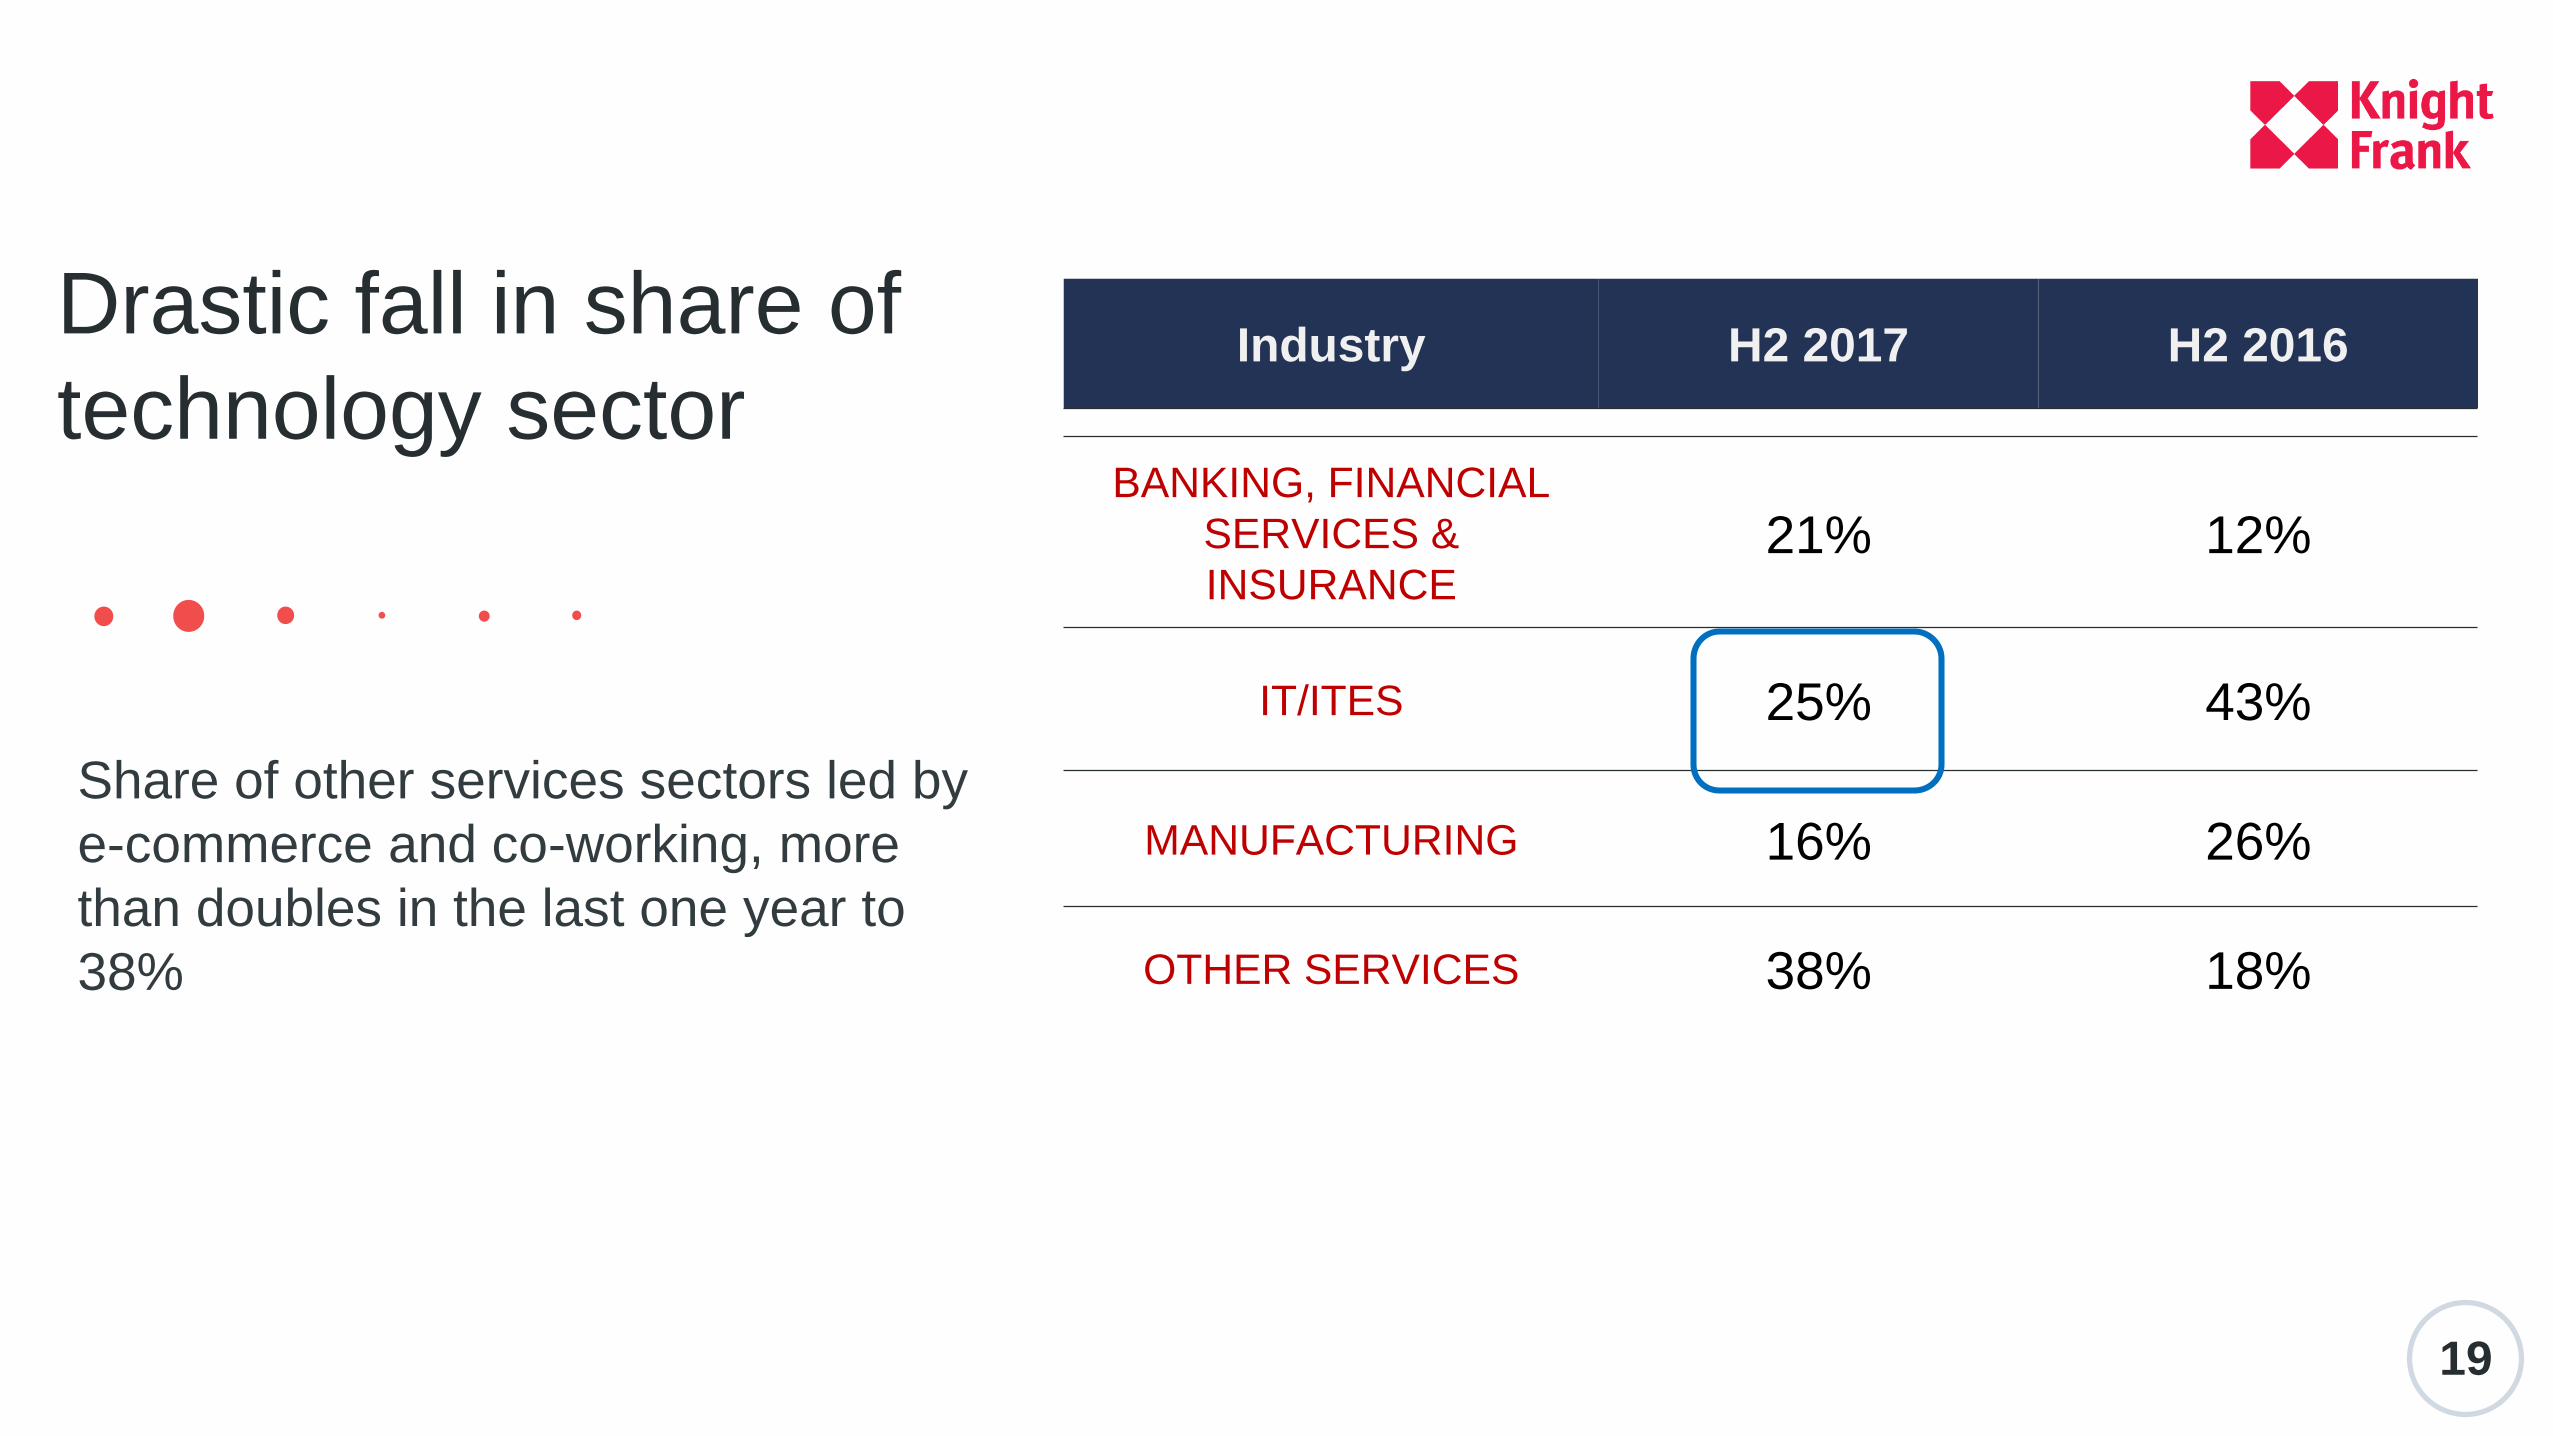
Industry H2 2017 H2 2016
BANKING, FINANCIAL
SERVICES &
INSURANCE21% 12%
IT/ITES 25% 43%
MANUFACTURING 16% 26%
OTHER SERVICES 38% 18%
Share of other services sectors led by
e-commerce and co-working, more
than doubles in the last one year to
38%
Drastic fall in share of
technology sector
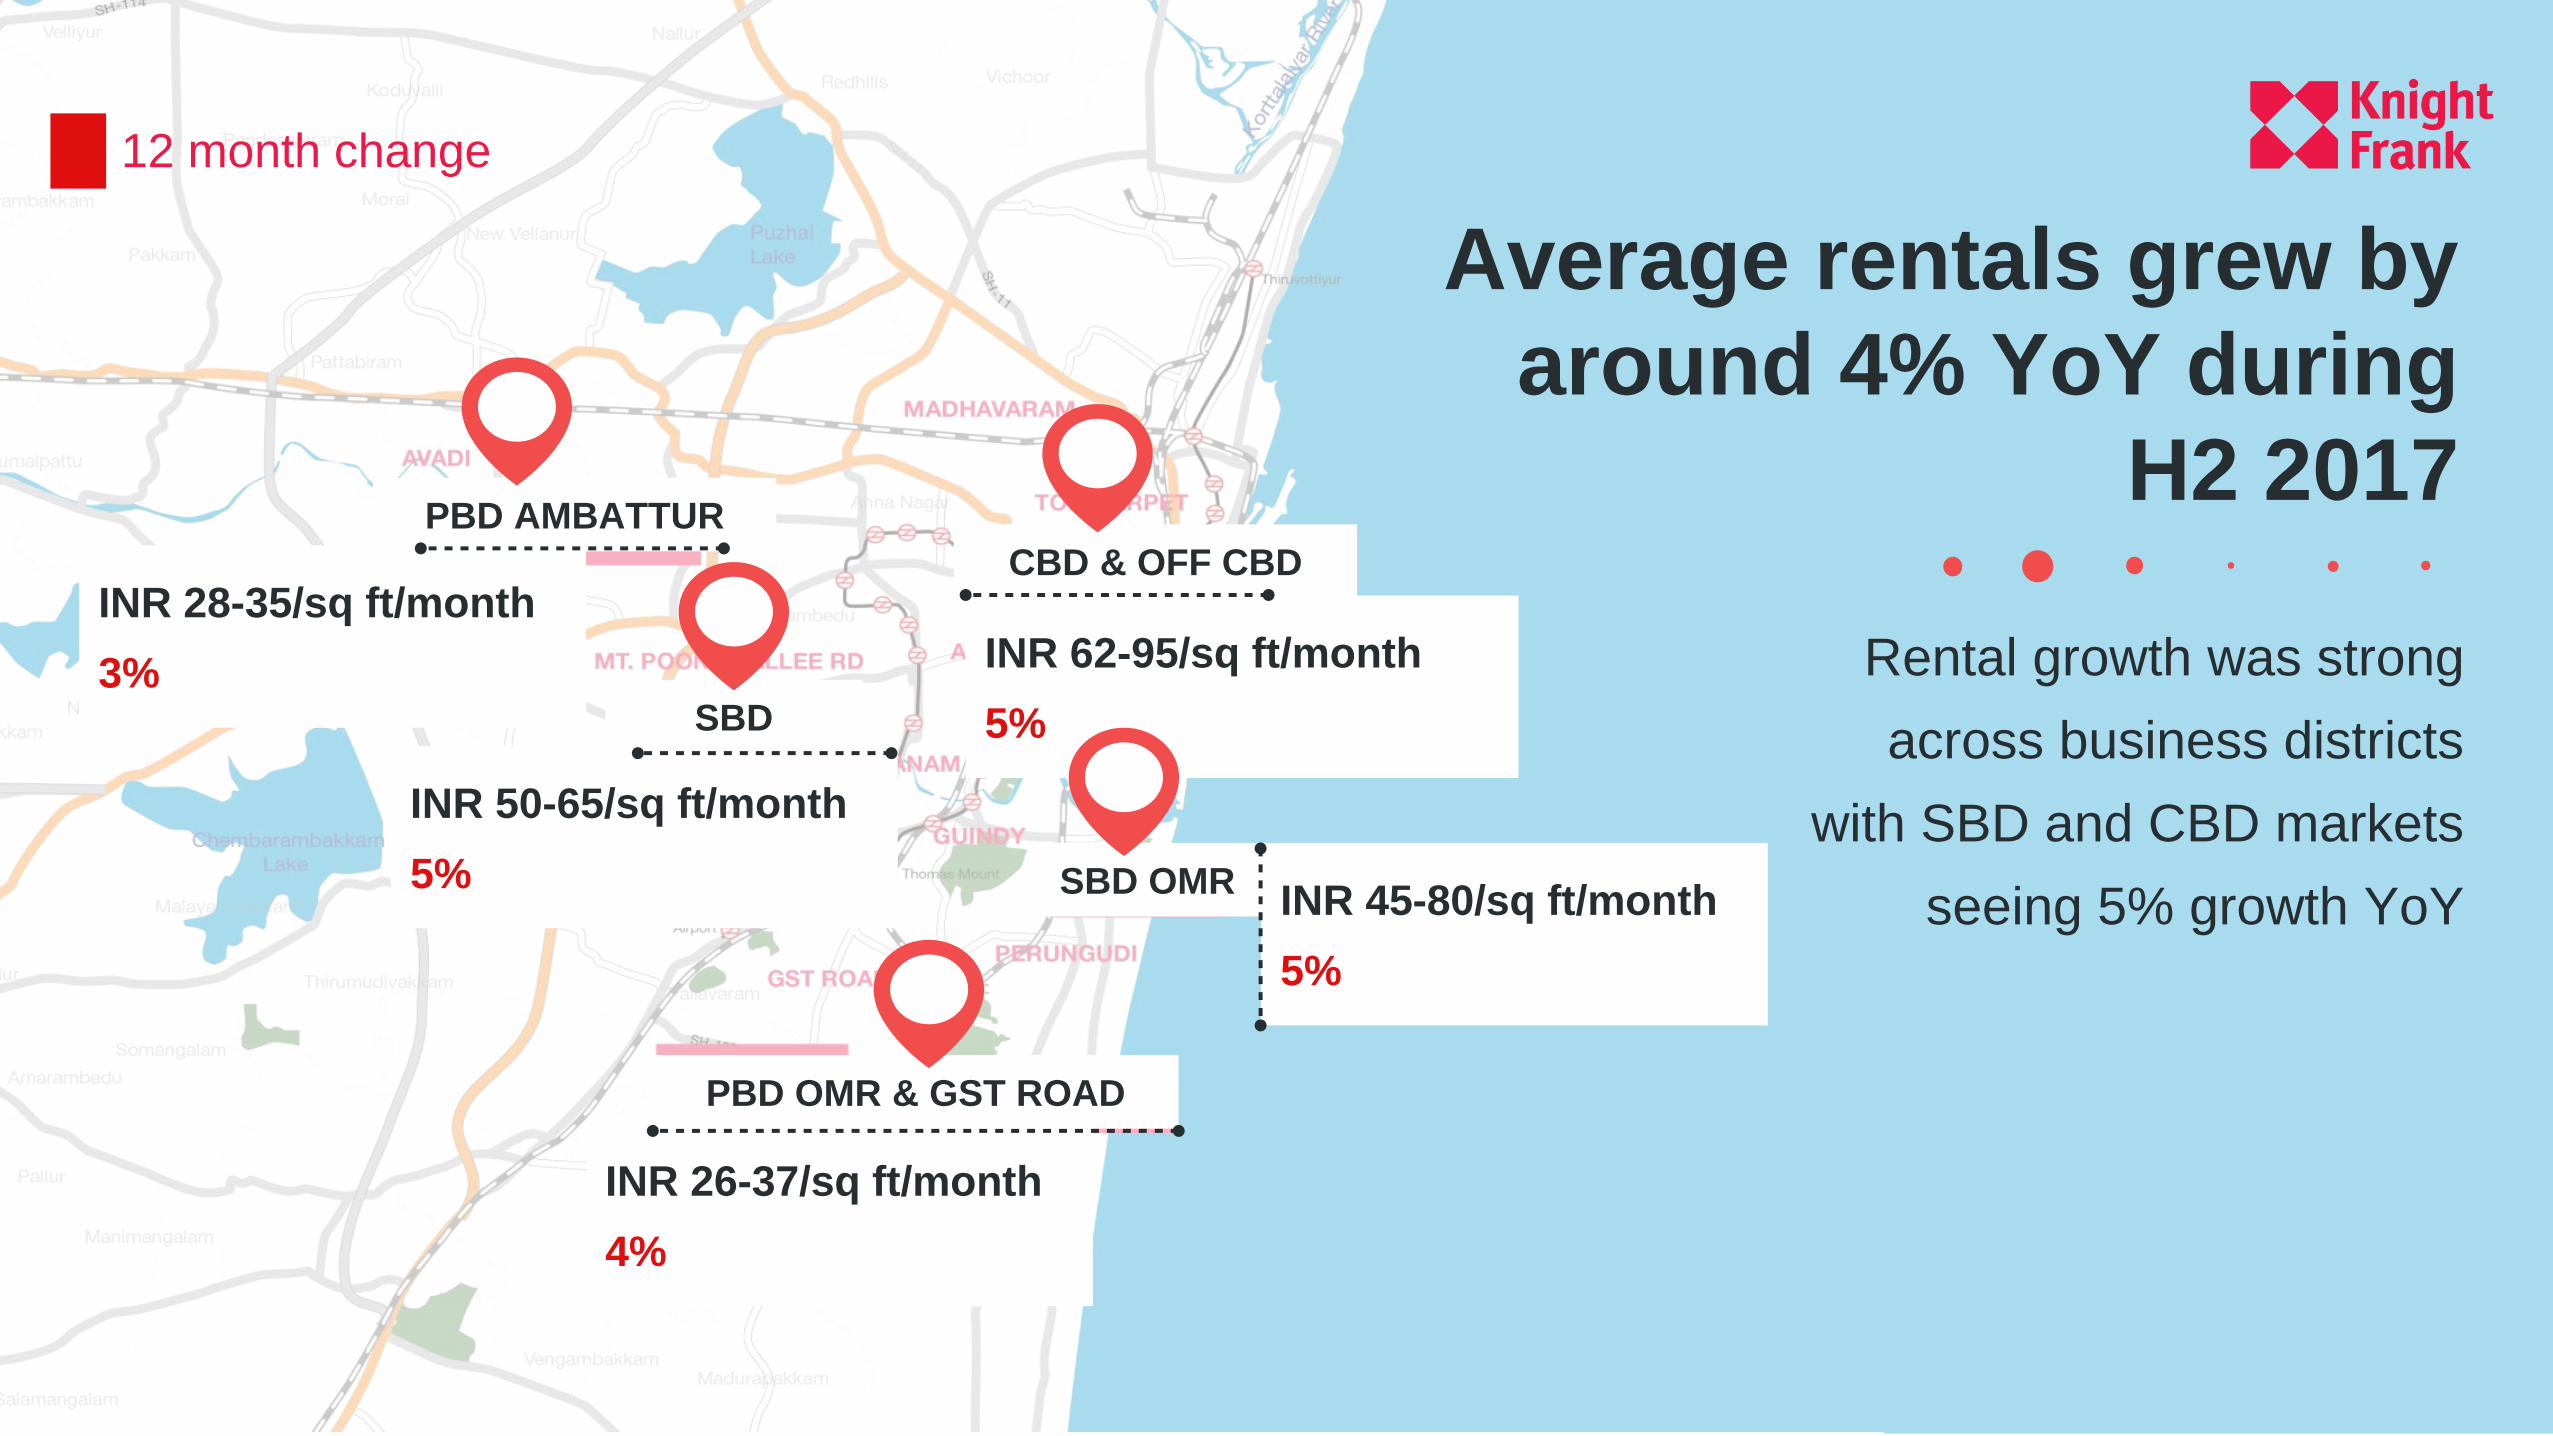
Average rentals grew by
around 4% YoY during
H2 2017
Rental growth was strong
across business districts
with SBD and CBD markets
seeing 5% growth YoY
12 month change
CBD & OFF CBD
INR 62-95/sq ft/month
5%
PBD AMBATTUR
INR 28-35/sq ft/month
3%SBD
INR 50-65/sq ft/month
5%
PBD OMR & GST ROAD
INR 26-37/sq ft/month
4%
SBD OMRINR 45-80/sq ft/month
5%
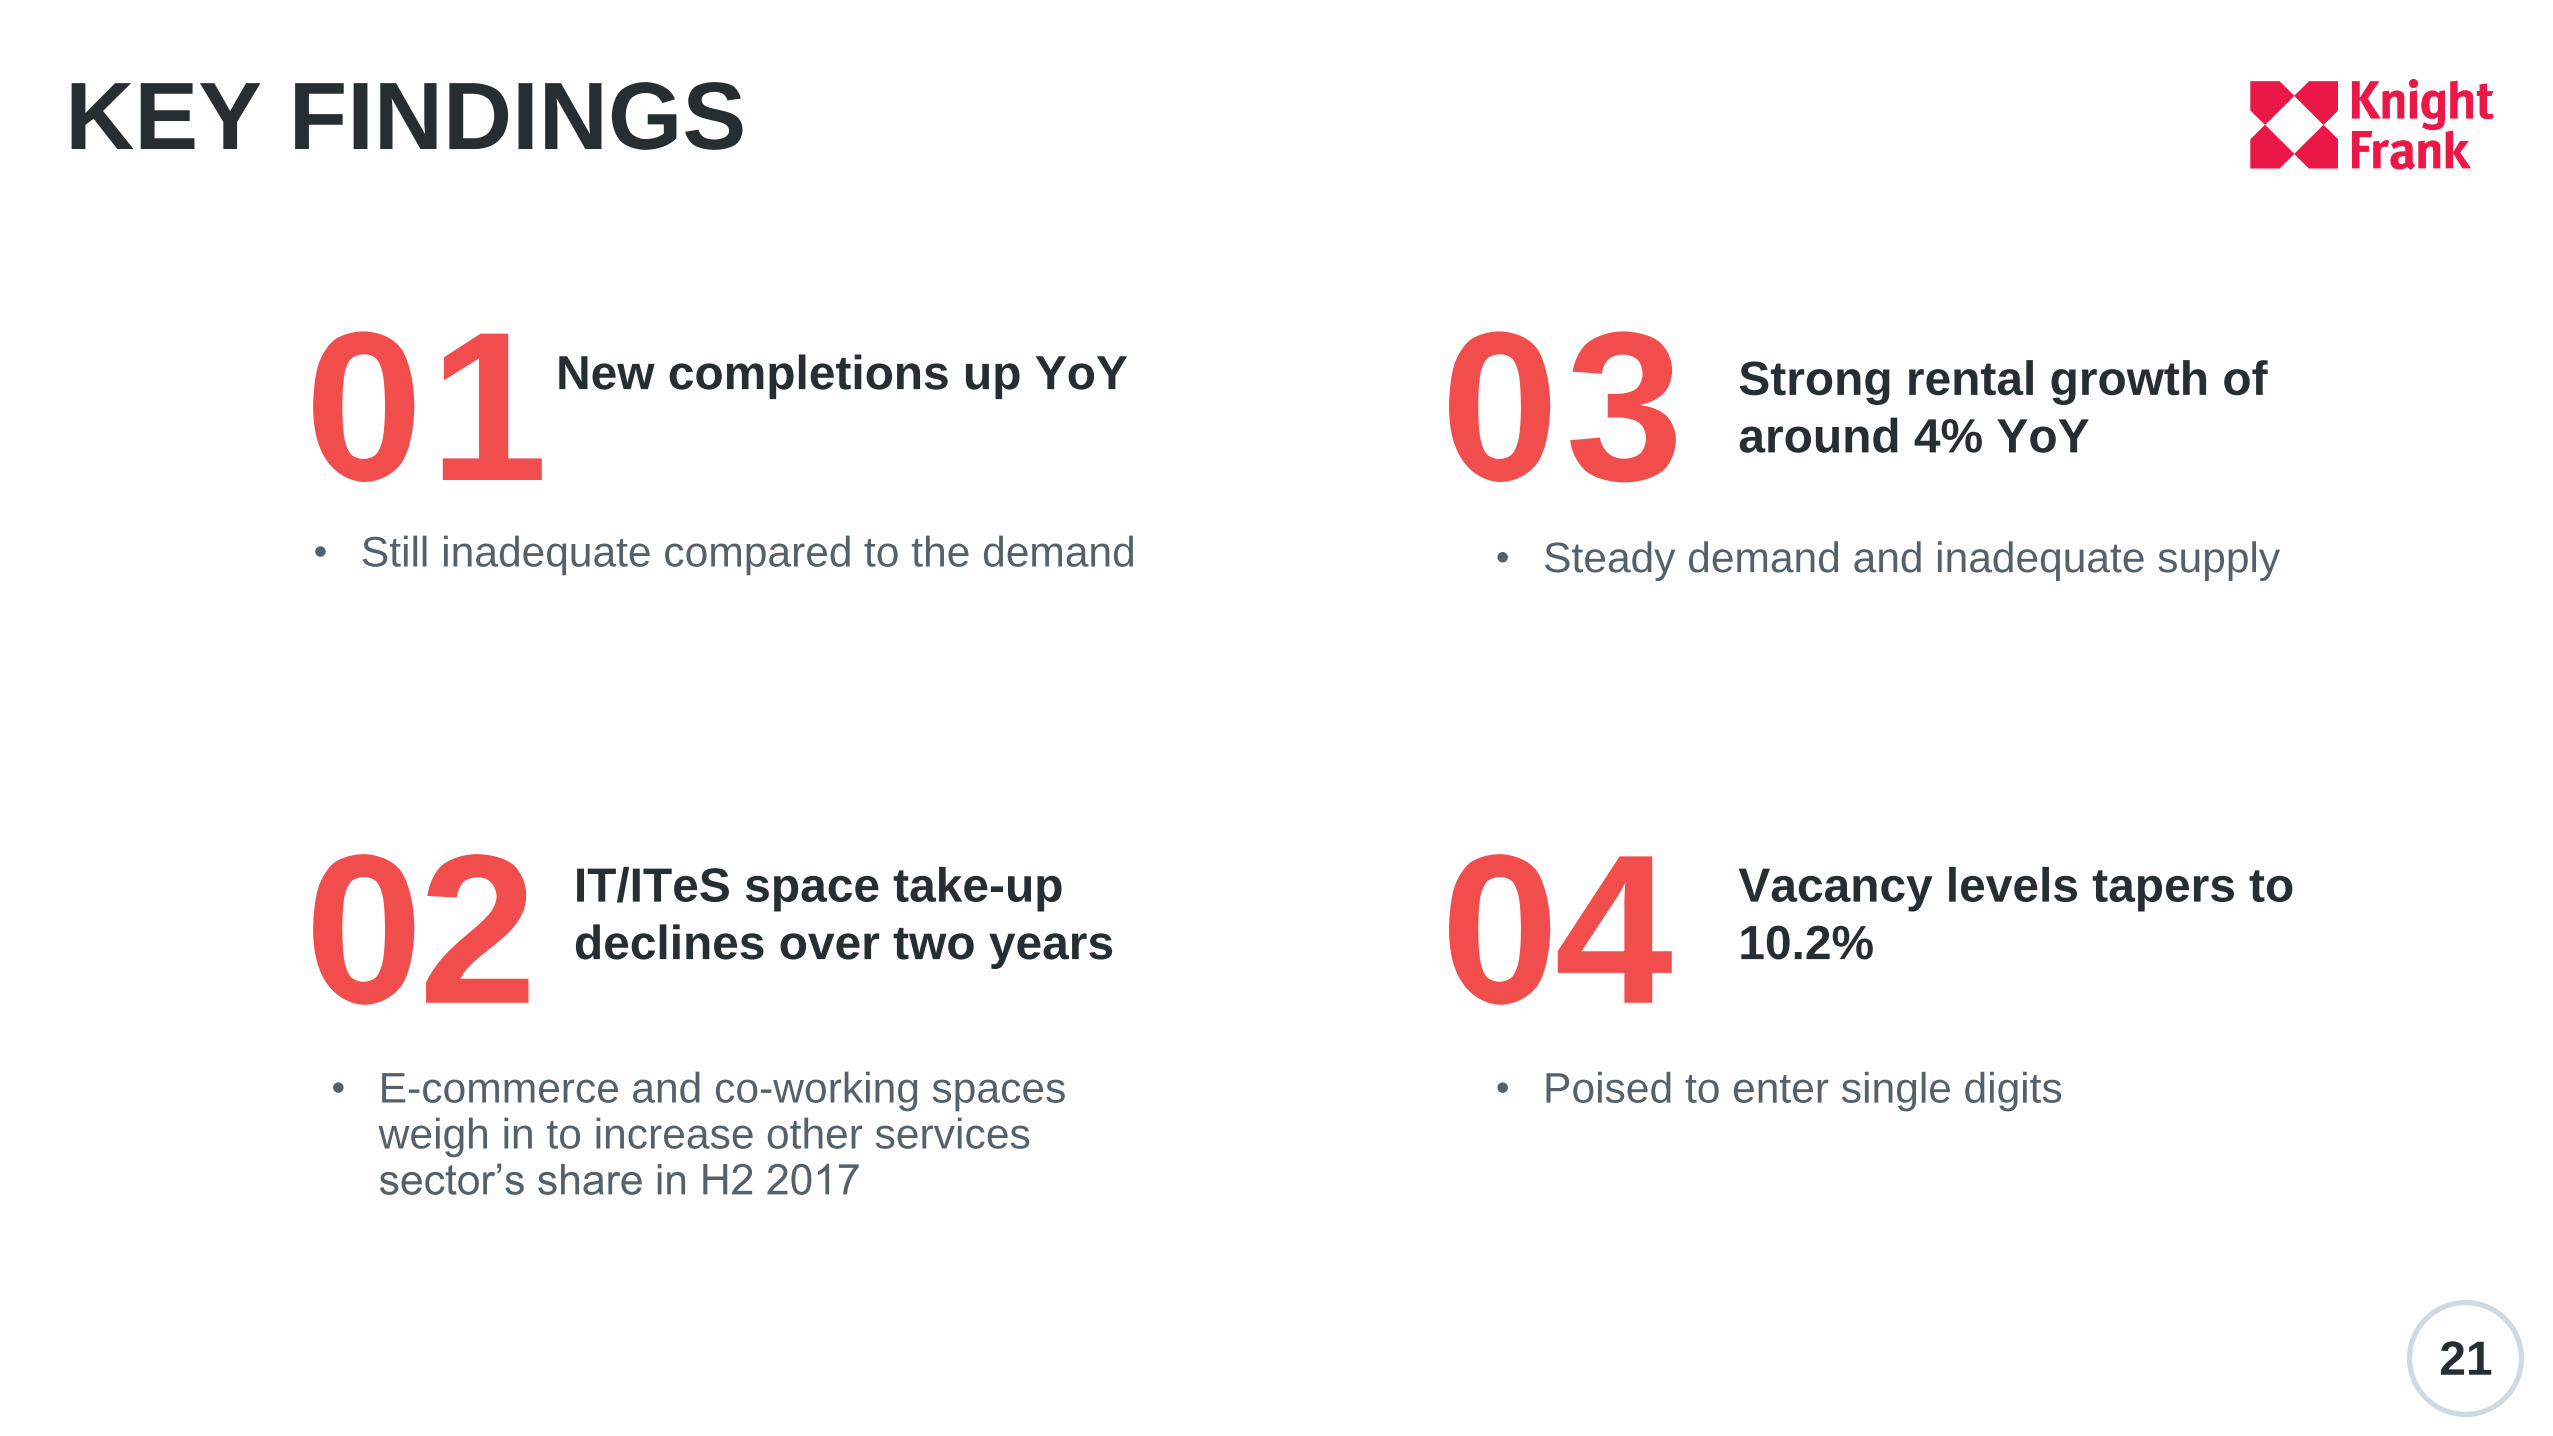
KEY FINDINGS
01 03
02 04
21
New completions up YoY
• Still inadequate compared to the demand
Strong rental growth of
around 4% YoY
• Steady demand and inadequate supply
Vacancy levels tapers to
10.2%
• Poised to enter single digits
IT/ITeS space take-up
declines over two years
• E-commerce and co-working spaces weigh in to increase other services sector’s share in H2 2017
CHENNAIRESIDENTIAL & OFFICE
In residential segment, recovery still far away
Supply crunch continues to hamstring the
Chennai office market