Embed Size (px)
Citation preview

www.ChicagoHomePartner.com 773.537.1300
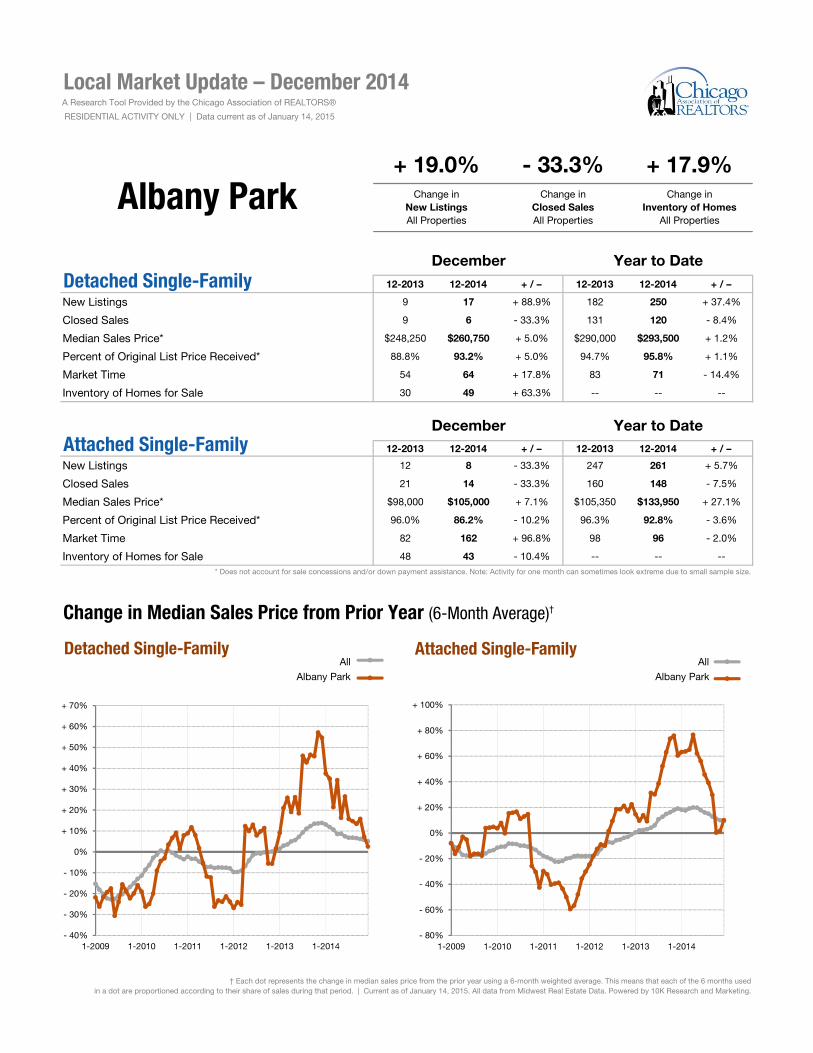
12-2013 12-2014 + / – 12-2013 12-2014 + / –
New Listings 9 17 + 88.9% 182 250 + 37.4%
Closed Sales 9 6 - 33.3% 131 120 - 8.4%
Median Sales Price* $248,250 $260,750 + 5.0% $290,000 $293,500 + 1.2%
Percent of Original List Price Received* 88.8% 93.2% + 5.0% 94.7% 95.8% + 1.1%
Market Time 54 64 + 17.8% 83 71 - 14.4%
Inventory of Homes for Sale 30 49 + 63.3% -- -- --
12-2013 12-2014 + / – 12-2013 12-2014 + / –
New Listings 12 8 - 33.3% 247 261 + 5.7%
Closed Sales 21 14 - 33.3% 160 148 - 7.5%
Median Sales Price* $98,000 $105,000 + 7.1% $105,350 $133,950 + 27.1%
Percent of Original List Price Received* 96.0% 86.2% - 10.2% 96.3% 92.8% - 3.6%
Market Time 82 162 + 96.8% 98 96 - 2.0%
Inventory of Homes for Sale 48 43 - 10.4% -- -- --* Does not account for sale concessions and/or down payment assistance. Note: Activity for one month can sometimes look extreme due to small sample size.
Local Market Update – December 2014A Research Tool Provided by the Chicago Association of REALTORS®
RESIDENTIAL ACTIVITY ONLY | Data current as of January 14, 2015
Albany Park+ 19.0% - 33.3% + 17.9%
Change inNew ListingsAll Properties
Change inClosed SalesAll Properties
Change in Inventory of Homes
All Properties
Detached Single-FamilyDecember Year to Date
Attached Single-FamilyDecember Year to Date
† Each dot represents the change in median sales price from the prior year using a 6-month weighted average. This means that each of the 6 months usedin a dot are proportioned according to their share of sales during that period. | Current as of January 14, 2015. All data from Midwest Real Estate Data. Powered by 10K Research and Marketing.
Change in Median Sales Price from Prior Year (6-Month Average)†
All AllAlbany Park Albany Park
- 40%
- 30%
- 20%
- 10%
0%
+ 10%
+ 20%
+ 30%
+ 40%
+ 50%
+ 60%
+ 70%
1-2009 1-2010 1-2011 1-2012 1-2013 1-2014
Detached Single-Familyb
a
- 80%
- 60%
- 40%
- 20%
0%
+ 20%
+ 40%
+ 60%
+ 80%
+ 100%
1-2009 1-2010 1-2011 1-2012 1-2013 1-2014
Attached Single-Familyb
a

12-2013 12-2014 + / – 12-2013 12-2014 + / –
New Listings 5 8 + 60.0% 145 184 + 26.9%
Closed Sales 8 12 + 50.0% 100 109 + 9.0%
Median Sales Price* $358,250 $385,625 + 7.6% $308,500 $345,000 + 11.8%
Percent of Original List Price Received* 95.4% 92.8% - 2.6% 96.3% 98.1% + 1.9%
Market Time 26 55 + 111.9% 63 46 - 27.2%
Inventory of Homes for Sale 20 26 + 30.0% -- -- --
12-2013 12-2014 + / – 12-2013 12-2014 + / –
New Listings 9 11 + 22.2% 177 290 + 63.8%
Closed Sales 13 17 + 30.8% 115 134 + 16.5%
Median Sales Price* $177,750 $319,000 + 79.5% $177,750 $299,950 + 68.7%
Percent of Original List Price Received* 93.9% 97.0% + 3.3% 93.7% 97.7% + 4.3%
Market Time 44 85 + 90.6% 103 88 - 14.9%
Inventory of Homes for Sale 33 32 - 3.0% -- -- --* Does not account for sale concessions and/or down payment assistance. Note: Activity for one month can sometimes look extreme due to small sample size.
Local Market Update – December 2014A Research Tool Provided by the Chicago Association of REALTORS®
RESIDENTIAL ACTIVITY ONLY | Data current as of January 14, 2015
Avondale+ 35.7% + 38.1% + 9.4%
Change inNew ListingsAll Properties
Change inClosed SalesAll Properties
Change in Inventory of Homes
All Properties
Detached Single-FamilyDecember Year to Date
Attached Single-FamilyDecember Year to Date
† Each dot represents the change in median sales price from the prior year using a 6-month weighted average. This means that each of the 6 months usedin a dot are proportioned according to their share of sales during that period. | Current as of January 14, 2015. All data from Midwest Real Estate Data. Powered by 10K Research and Marketing.
Change in Median Sales Price from Prior Year (6-Month Average)†
All AllAvondale Avondale
- 60%
- 40%
- 20%
0%
+ 20%
+ 40%
+ 60%
+ 80%
+ 100%
+ 120%
+ 140%
1-2009 1-2010 1-2011 1-2012 1-2013 1-2014
Detached Single-Familyb
a
- 60%
- 40%
- 20%
0%
+ 20%
+ 40%
+ 60%
+ 80%
+ 100%
1-2009 1-2010 1-2011 1-2012 1-2013 1-2014
Attached Single-Familyb
a
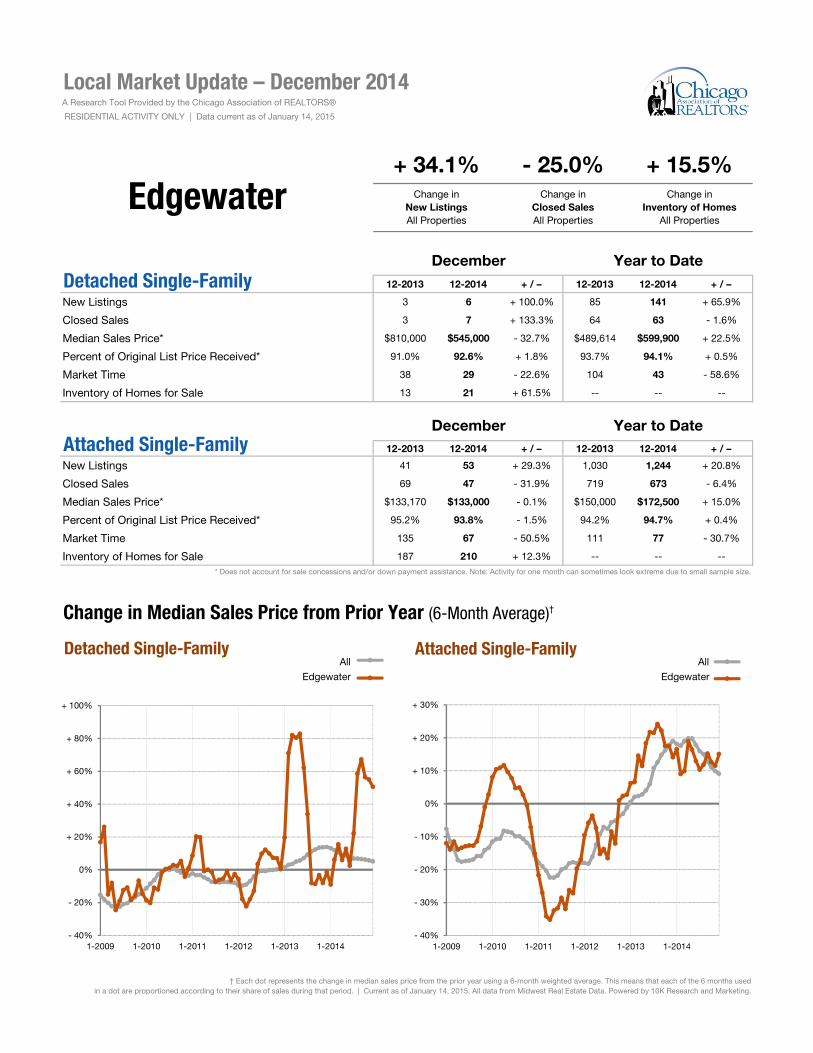
12-2013 12-2014 + / – 12-2013 12-2014 + / –
New Listings 3 6 + 100.0% 85 141 + 65.9%
Closed Sales 3 7 + 133.3% 64 63 - 1.6%
Median Sales Price* $810,000 $545,000 - 32.7% $489,614 $599,900 + 22.5%
Percent of Original List Price Received* 91.0% 92.6% + 1.8% 93.7% 94.1% + 0.5%
Market Time 38 29 - 22.6% 104 43 - 58.6%
Inventory of Homes for Sale 13 21 + 61.5% -- -- --
12-2013 12-2014 + / – 12-2013 12-2014 + / –
New Listings 41 53 + 29.3% 1,030 1,244 + 20.8%
Closed Sales 69 47 - 31.9% 719 673 - 6.4%
Median Sales Price* $133,170 $133,000 - 0.1% $150,000 $172,500 + 15.0%
Percent of Original List Price Received* 95.2% 93.8% - 1.5% 94.2% 94.7% + 0.4%
Market Time 135 67 - 50.5% 111 77 - 30.7%
Inventory of Homes for Sale 187 210 + 12.3% -- -- --* Does not account for sale concessions and/or down payment assistance. Note: Activity for one month can sometimes look extreme due to small sample size.
Local Market Update – December 2014A Research Tool Provided by the Chicago Association of REALTORS®
RESIDENTIAL ACTIVITY ONLY | Data current as of January 14, 2015
Edgewater+ 34.1% - 25.0% + 15.5%
Change inNew ListingsAll Properties
Change inClosed SalesAll Properties
Change in Inventory of Homes
All Properties
Detached Single-FamilyDecember Year to Date
Attached Single-FamilyDecember Year to Date
† Each dot represents the change in median sales price from the prior year using a 6-month weighted average. This means that each of the 6 months usedin a dot are proportioned according to their share of sales during that period. | Current as of January 14, 2015. All data from Midwest Real Estate Data. Powered by 10K Research and Marketing.
Change in Median Sales Price from Prior Year (6-Month Average)†
All AllEdgewater Edgewater
- 40%
- 20%
0%
+ 20%
+ 40%
+ 60%
+ 80%
+ 100%
1-2009 1-2010 1-2011 1-2012 1-2013 1-2014
Detached Single-Familyb
a
- 40%
- 30%
- 20%
- 10%
0%
+ 10%
+ 20%
+ 30%
1-2009 1-2010 1-2011 1-2012 1-2013 1-2014
Attached Single-Familyb
a

12-2013 12-2014 + / – 12-2013 12-2014 + / –
New Listings 18 17 - 5.6% 448 441 - 1.6%
Closed Sales 16 14 - 12.5% 275 227 - 17.5%
Median Sales Price* $402,500 $378,250 - 6.0% $355,000 $385,000 + 8.5%
Percent of Original List Price Received* 96.7% 95.8% - 0.9% 96.3% 95.8% - 0.6%
Market Time 76 41 - 46.9% 79 74 - 6.6%
Inventory of Homes for Sale 66 61 - 7.6% -- -- --
12-2013 12-2014 + / – 12-2013 12-2014 + / –
New Listings 14 14 0.0% 329 362 + 10.0%
Closed Sales 13 18 + 38.5% 253 210 - 17.0%
Median Sales Price* $153,000 $170,000 + 11.1% $137,500 $157,500 + 14.5%
Percent of Original List Price Received* 95.5% 94.0% - 1.5% 96.9% 95.6% - 1.3%
Market Time 55 69 + 25.4% 95 80 - 15.8%
Inventory of Homes for Sale 55 63 + 14.5% -- -- --* Does not account for sale concessions and/or down payment assistance. Note: Activity for one month can sometimes look extreme due to small sample size.
Local Market Update – December 2014A Research Tool Provided by the Chicago Association of REALTORS®
RESIDENTIAL ACTIVITY ONLY | Data current as of January 14, 2015
Irving Park- 3.1% + 10.3% + 2.5%
Change inNew ListingsAll Properties
Change inClosed SalesAll Properties
Change in Inventory of Homes
All Properties
Detached Single-FamilyDecember Year to Date
Attached Single-FamilyDecember Year to Date
† Each dot represents the change in median sales price from the prior year using a 6-month weighted average. This means that each of the 6 months usedin a dot are proportioned according to their share of sales during that period. | Current as of January 14, 2015. All data from Midwest Real Estate Data. Powered by 10K Research and Marketing.
Change in Median Sales Price from Prior Year (6-Month Average)†
All AllIrving Park Irving Park
- 40%
- 30%
- 20%
- 10%
0%
+ 10%
+ 20%
+ 30%
+ 40%
+ 50%
1-2009 1-2010 1-2011 1-2012 1-2013 1-2014
Detached Single-Familyb
a
- 40%
- 30%
- 20%
- 10%
0%
+ 10%
+ 20%
+ 30%
+ 40%
+ 50%
+ 60%
1-2009 1-2010 1-2011 1-2012 1-2013 1-2014
Attached Single-Familyb
a
12-2013 12-2014 + / – 12-2013 12-2014 + / –
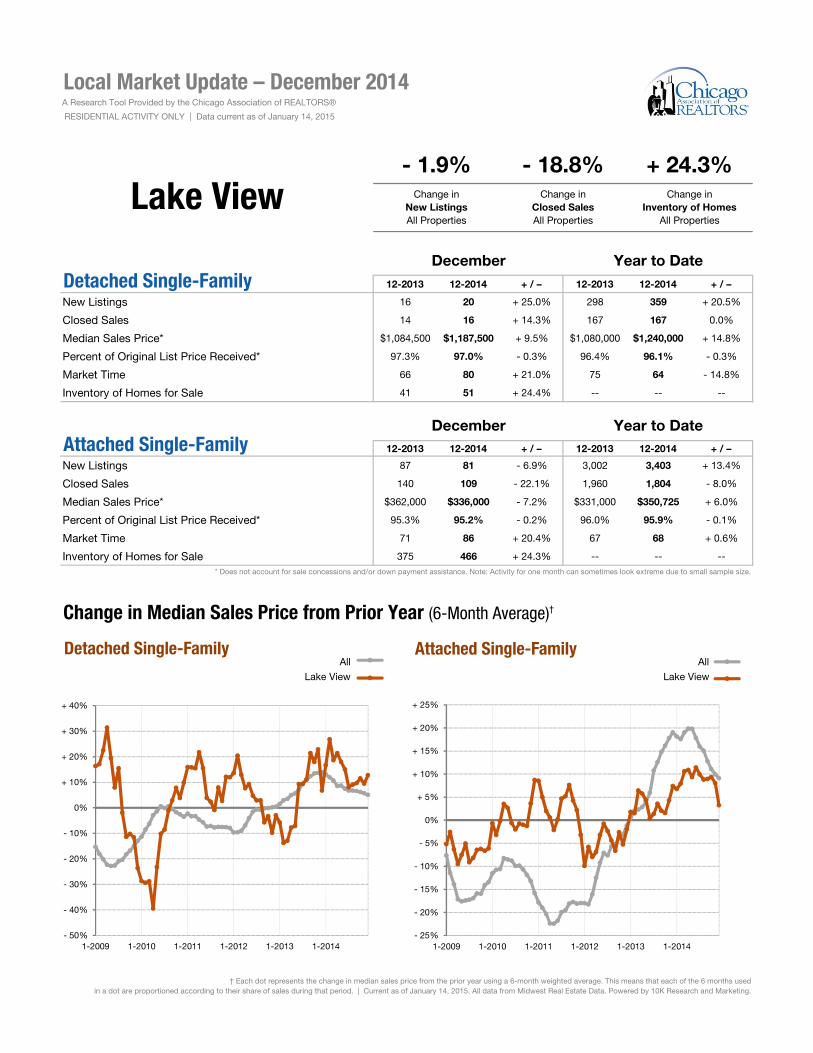
New Listings 16 20 + 25.0% 298 359 + 20.5%
Closed Sales 14 16 + 14.3% 167 167 0.0%
Median Sales Price* $1,084,500 $1,187,500 + 9.5% $1,080,000 $1,240,000 + 14.8%
Percent of Original List Price Received* 97.3% 97.0% - 0.3% 96.4% 96.1% - 0.3%
Market Time 66 80 + 21.0% 75 64 - 14.8%
Inventory of Homes for Sale 41 51 + 24.4% -- -- --
12-2013 12-2014 + / – 12-2013 12-2014 + / –
New Listings 87 81 - 6.9% 3,002 3,403 + 13.4%
Closed Sales 140 109 - 22.1% 1,960 1,804 - 8.0%
Median Sales Price* $362,000 $336,000 - 7.2% $331,000 $350,725 + 6.0%
Percent of Original List Price Received* 95.3% 95.2% - 0.2% 96.0% 95.9% - 0.1%
Market Time 71 86 + 20.4% 67 68 + 0.6%
Inventory of Homes for Sale 375 466 + 24.3% -- -- --* Does not account for sale concessions and/or down payment assistance. Note: Activity for one month can sometimes look extreme due to small sample size.
Local Market Update – December 2014A Research Tool Provided by the Chicago Association of REALTORS®
RESIDENTIAL ACTIVITY ONLY | Data current as of January 14, 2015
Lake View- 1.9% - 18.8% + 24.3%
Change inNew ListingsAll Properties
Change inClosed SalesAll Properties
Change in Inventory of Homes
All Properties
Detached Single-FamilyDecember Year to Date
Attached Single-FamilyDecember Year to Date
† Each dot represents the change in median sales price from the prior year using a 6-month weighted average. This means that each of the 6 months usedin a dot are proportioned according to their share of sales during that period. | Current as of January 14, 2015. All data from Midwest Real Estate Data. Powered by 10K Research and Marketing.
Change in Median Sales Price from Prior Year (6-Month Average)†
All AllLake View Lake View
- 50%
- 40%
- 30%
- 20%
- 10%
0%
+ 10%
+ 20%
+ 30%
+ 40%
1-2009 1-2010 1-2011 1-2012 1-2013 1-2014
Detached Single-Familyb
a
- 25%
- 20%
- 15%
- 10%
- 5%
0%
+ 5%
+ 10%
+ 15%
+ 20%
+ 25%
1-2009 1-2010 1-2011 1-2012 1-2013 1-2014
Attached Single-Familyb
a
12-2013 12-2014 + / – 12-2013 12-2014 + / –
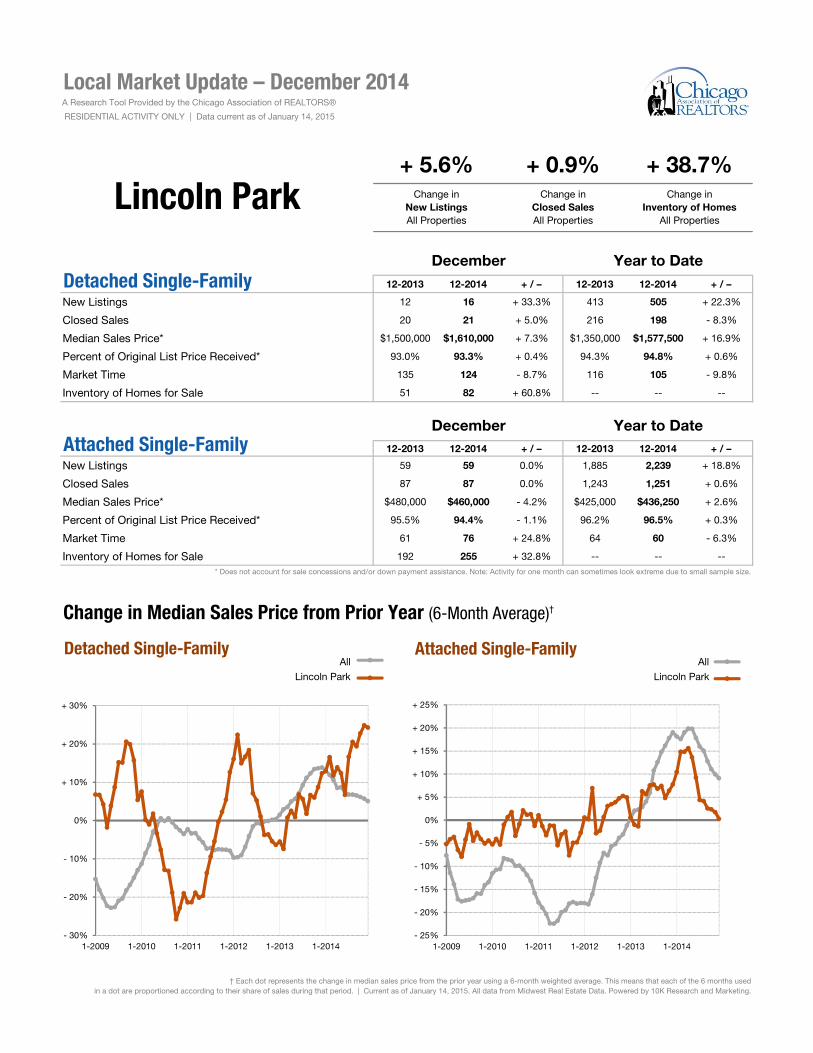
New Listings 12 16 + 33.3% 413 505 + 22.3%
Closed Sales 20 21 + 5.0% 216 198 - 8.3%
Median Sales Price* $1,500,000 $1,610,000 + 7.3% $1,350,000 $1,577,500 + 16.9%
Percent of Original List Price Received* 93.0% 93.3% + 0.4% 94.3% 94.8% + 0.6%
Market Time 135 124 - 8.7% 116 105 - 9.8%
Inventory of Homes for Sale 51 82 + 60.8% -- -- --
12-2013 12-2014 + / – 12-2013 12-2014 + / –
New Listings 59 59 0.0% 1,885 2,239 + 18.8%
Closed Sales 87 87 0.0% 1,243 1,251 + 0.6%
Median Sales Price* $480,000 $460,000 - 4.2% $425,000 $436,250 + 2.6%
Percent of Original List Price Received* 95.5% 94.4% - 1.1% 96.2% 96.5% + 0.3%
Market Time 61 76 + 24.8% 64 60 - 6.3%
Inventory of Homes for Sale 192 255 + 32.8% -- -- --* Does not account for sale concessions and/or down payment assistance. Note: Activity for one month can sometimes look extreme due to small sample size.
Local Market Update – December 2014A Research Tool Provided by the Chicago Association of REALTORS®
RESIDENTIAL ACTIVITY ONLY | Data current as of January 14, 2015
Lincoln Park+ 5.6% + 0.9% + 38.7%
Change inNew ListingsAll Properties
Change inClosed SalesAll Properties
Change in Inventory of Homes
All Properties
Detached Single-FamilyDecember Year to Date
Attached Single-FamilyDecember Year to Date
† Each dot represents the change in median sales price from the prior year using a 6-month weighted average. This means that each of the 6 months usedin a dot are proportioned according to their share of sales during that period. | Current as of January 14, 2015. All data from Midwest Real Estate Data. Powered by 10K Research and Marketing.
Change in Median Sales Price from Prior Year (6-Month Average)†
All AllLincoln Park Lincoln Park
- 30%
- 20%
- 10%
0%
+ 10%
+ 20%
+ 30%
1-2009 1-2010 1-2011 1-2012 1-2013 1-2014
Detached Single-Familyb
a
- 25%
- 20%
- 15%
- 10%
- 5%
0%
+ 5%
+ 10%
+ 15%
+ 20%
+ 25%
1-2009 1-2010 1-2011 1-2012 1-2013 1-2014
Attached Single-Familyb
a

12-2013 12-2014 + / – 12-2013 12-2014 + / –
New Listings 4 8 + 100.0% 177 181 + 2.3%
Closed Sales 12 12 0.0% 125 96 - 23.2%
Median Sales Price* $455,500 $505,000 + 10.9% $582,000 $577,500 - 0.8%
Percent of Original List Price Received* 97.0% 92.7% - 4.5% 97.2% 96.4% - 0.9%
Market Time 30 111 + 265.6% 69 57 - 16.5%
Inventory of Homes for Sale 13 27 + 107.7% -- -- --
12-2013 12-2014 + / – 12-2013 12-2014 + / –
New Listings 20 19 - 5.0% 493 617 + 25.2%
Closed Sales 21 14 - 33.3% 329 306 - 7.0%
Median Sales Price* $350,200 $282,750 - 19.3% $247,000 $263,500 + 6.7%
Percent of Original List Price Received* 97.0% 95.7% - 1.3% 95.6% 95.7% + 0.1%
Market Time 59 66 + 11.2% 86 57 - 33.8%
Inventory of Homes for Sale 59 67 + 13.6% -- -- --* Does not account for sale concessions and/or down payment assistance. Note: Activity for one month can sometimes look extreme due to small sample size.
Local Market Update – December 2014A Research Tool Provided by the Chicago Association of REALTORS®
RESIDENTIAL ACTIVITY ONLY | Data current as of January 14, 2015
Lincoln Square+ 12.5% - 21.2% + 30.6%
Change inNew ListingsAll Properties
Change inClosed SalesAll Properties
Change in Inventory of Homes
All Properties
Detached Single-FamilyDecember Year to Date
Attached Single-FamilyDecember Year to Date
† Each dot represents the change in median sales price from the prior year using a 6-month weighted average. This means that each of the 6 months usedin a dot are proportioned according to their share of sales during that period. | Current as of January 14, 2015. All data from Midwest Real Estate Data. Powered by 10K Research and Marketing.
Change in Median Sales Price from Prior Year (6-Month Average)†
All AllLincoln Square Lincoln Square
- 30%
- 20%
- 10%
0%
+ 10%
+ 20%
+ 30%
+ 40%
+ 50%
+ 60%
1-2009 1-2010 1-2011 1-2012 1-2013 1-2014
Detached Single-Familyb
a
- 60%
- 40%
- 20%
0%
+ 20%
+ 40%
+ 60%
+ 80%
+ 100%
+ 120%
1-2009 1-2010 1-2011 1-2012 1-2013 1-2014
Attached Single-Familyb
a
12-2013 12-2014 + / – 12-2013 12-2014 + / –
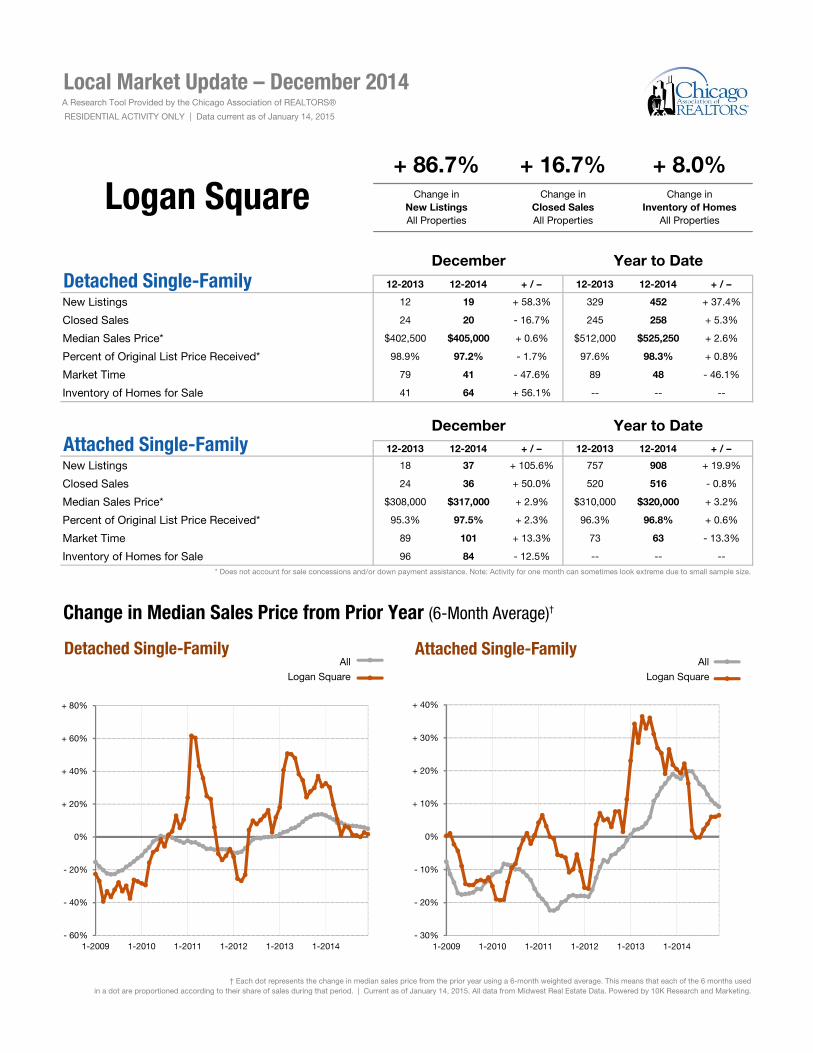
New Listings 12 19 + 58.3% 329 452 + 37.4%
Closed Sales 24 20 - 16.7% 245 258 + 5.3%
Median Sales Price* $402,500 $405,000 + 0.6% $512,000 $525,250 + 2.6%
Percent of Original List Price Received* 98.9% 97.2% - 1.7% 97.6% 98.3% + 0.8%
Market Time 79 41 - 47.6% 89 48 - 46.1%
Inventory of Homes for Sale 41 64 + 56.1% -- -- --
12-2013 12-2014 + / – 12-2013 12-2014 + / –
New Listings 18 37 + 105.6% 757 908 + 19.9%
Closed Sales 24 36 + 50.0% 520 516 - 0.8%
Median Sales Price* $308,000 $317,000 + 2.9% $310,000 $320,000 + 3.2%
Percent of Original List Price Received* 95.3% 97.5% + 2.3% 96.3% 96.8% + 0.6%
Market Time 89 101 + 13.3% 73 63 - 13.3%
Inventory of Homes for Sale 96 84 - 12.5% -- -- --* Does not account for sale concessions and/or down payment assistance. Note: Activity for one month can sometimes look extreme due to small sample size.
Local Market Update – December 2014A Research Tool Provided by the Chicago Association of REALTORS®
RESIDENTIAL ACTIVITY ONLY | Data current as of January 14, 2015
Logan Square+ 86.7% + 16.7% + 8.0%
Change inNew ListingsAll Properties
Change inClosed SalesAll Properties
Change in Inventory of Homes
All Properties
Detached Single-FamilyDecember Year to Date
Attached Single-FamilyDecember Year to Date
† Each dot represents the change in median sales price from the prior year using a 6-month weighted average. This means that each of the 6 months usedin a dot are proportioned according to their share of sales during that period. | Current as of January 14, 2015. All data from Midwest Real Estate Data. Powered by 10K Research and Marketing.
Change in Median Sales Price from Prior Year (6-Month Average)†
All AllLogan Square Logan Square
- 60%
- 40%
- 20%
0%
+ 20%
+ 40%
+ 60%
+ 80%
1-2009 1-2010 1-2011 1-2012 1-2013 1-2014
Detached Single-Familyb
a
- 30%
- 20%
- 10%
0%
+ 10%
+ 20%
+ 30%
+ 40%
1-2009 1-2010 1-2011 1-2012 1-2013 1-2014
Attached Single-Familyb
a
12-2013 12-2014 + / – 12-2013 12-2014 + / –
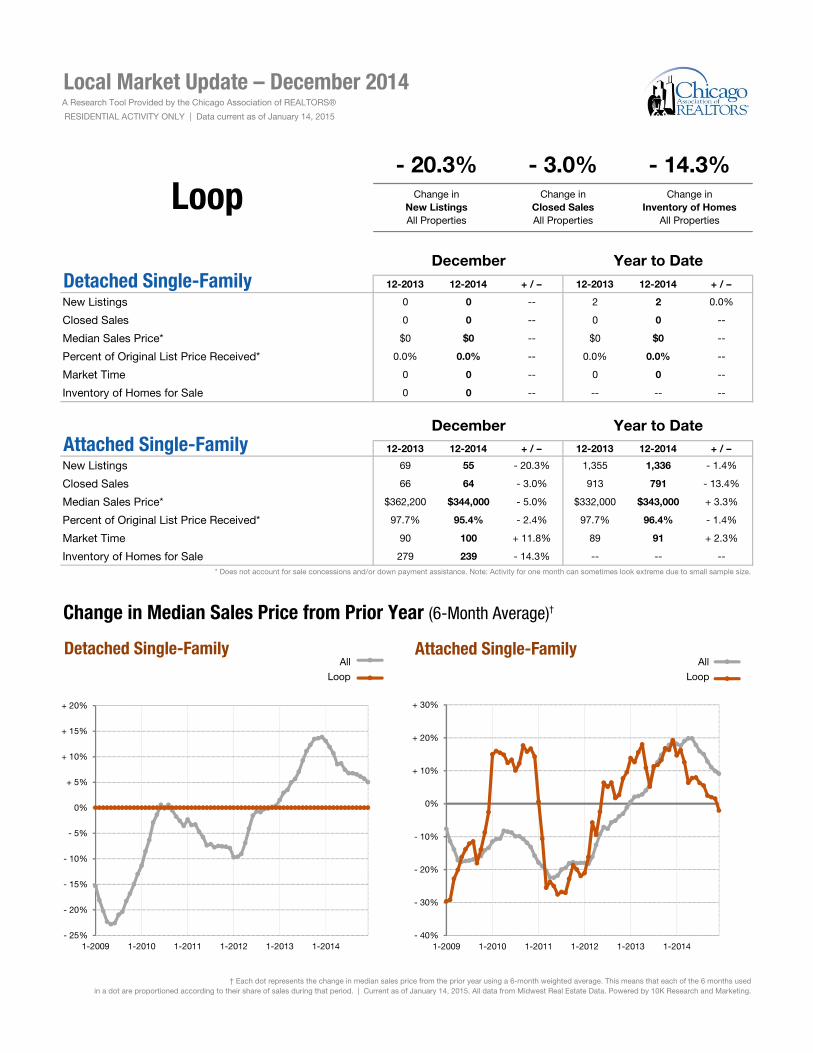
New Listings 0 0 -- 2 2 0.0%
Closed Sales 0 0 -- 0 0 --
Median Sales Price* $0 $0 -- $0 $0 --
Percent of Original List Price Received* 0.0% 0.0% -- 0.0% 0.0% --
Market Time 0 0 -- 0 0 --
Inventory of Homes for Sale 0 0 -- -- -- --
12-2013 12-2014 + / – 12-2013 12-2014 + / –
New Listings 69 55 - 20.3% 1,355 1,336 - 1.4%
Closed Sales 66 64 - 3.0% 913 791 - 13.4%
Median Sales Price* $362,200 $344,000 - 5.0% $332,000 $343,000 + 3.3%
Percent of Original List Price Received* 97.7% 95.4% - 2.4% 97.7% 96.4% - 1.4%
Market Time 90 100 + 11.8% 89 91 + 2.3%
Inventory of Homes for Sale 279 239 - 14.3% -- -- --* Does not account for sale concessions and/or down payment assistance. Note: Activity for one month can sometimes look extreme due to small sample size.
Local Market Update – December 2014A Research Tool Provided by the Chicago Association of REALTORS®
RESIDENTIAL ACTIVITY ONLY | Data current as of January 14, 2015
Loop- 20.3% - 3.0% - 14.3%
Change inNew ListingsAll Properties
Change inClosed SalesAll Properties
Change in Inventory of Homes
All Properties
Detached Single-FamilyDecember Year to Date
Attached Single-FamilyDecember Year to Date
† Each dot represents the change in median sales price from the prior year using a 6-month weighted average. This means that each of the 6 months usedin a dot are proportioned according to their share of sales during that period. | Current as of January 14, 2015. All data from Midwest Real Estate Data. Powered by 10K Research and Marketing.
Change in Median Sales Price from Prior Year (6-Month Average)†
All AllLoop Loop
- 25%
- 20%
- 15%
- 10%
- 5%
0%
+ 5%
+ 10%
+ 15%
+ 20%
1-2009 1-2010 1-2011 1-2012 1-2013 1-2014
Detached Single-Familyb
a
- 40%
- 30%
- 20%
- 10%
0%
+ 10%
+ 20%
+ 30%
1-2009 1-2010 1-2011 1-2012 1-2013 1-2014
Attached Single-Familyb
a

12-2013 12-2014 + / – 12-2013 12-2014 + / –
New Listings 4 1 - 75.0% 107 102 - 4.7%
Closed Sales 5 2 - 60.0% 34 33 - 2.9%
Median Sales Price* $1,220,000 $2,925,000 + 139.8% $1,622,500 $2,360,000 + 45.5%
Percent of Original List Price Received* 89.7% 93.0% + 3.6% 91.1% 92.1% + 1.1%
Market Time 416 78 - 81.4% 260 209 - 19.6%
Inventory of Homes for Sale 38 30 - 21.1% -- -- --
12-2013 12-2014 + / – 12-2013 12-2014 + / –
New Listings 183 143 - 21.9% 3,984 4,656 + 16.9%
Closed Sales 188 180 - 4.3% 2,677 2,540 - 5.1%
Median Sales Price* $412,500 $437,500 + 6.1% $380,000 $385,000 + 1.3%
Percent of Original List Price Received* 96.1% 93.4% - 2.8% 96.5% 95.9% - 0.6%
Market Time 73 115 + 57.3% 88 82 - 7.2%
Inventory of Homes for Sale 697 826 + 18.5% -- -- --* Does not account for sale concessions and/or down payment assistance. Note: Activity for one month can sometimes look extreme due to small sample size.
Local Market Update – December 2014A Research Tool Provided by the Chicago Association of REALTORS®
RESIDENTIAL ACTIVITY ONLY | Data current as of January 14, 2015
Near North Side- 23.0% - 5.7% + 16.5%
Change inNew ListingsAll Properties
Change inClosed SalesAll Properties
Change in Inventory of Homes
All Properties
Detached Single-FamilyDecember Year to Date
Attached Single-FamilyDecember Year to Date
† Each dot represents the change in median sales price from the prior year using a 6-month weighted average. This means that each of the 6 months usedin a dot are proportioned according to their share of sales during that period. | Current as of January 14, 2015. All data from Midwest Real Estate Data. Powered by 10K Research and Marketing.
Change in Median Sales Price from Prior Year (6-Month Average)†
All AllNear North Side Near North Side
- 40%
- 20%
0%
+ 20%
+ 40%
+ 60%
+ 80%
+ 100%
+ 120%
+ 140%
+ 160%
+ 180%
1-2009 1-2010 1-2011 1-2012 1-2013 1-2014
Detached Single-Familyb
a
- 30%
- 20%
- 10%
0%
+ 10%
+ 20%
+ 30%
1-2009 1-2010 1-2011 1-2012 1-2013 1-2014
Attached Single-Familyb
a
12-2013 12-2014 + / – 12-2013 12-2014 + / –
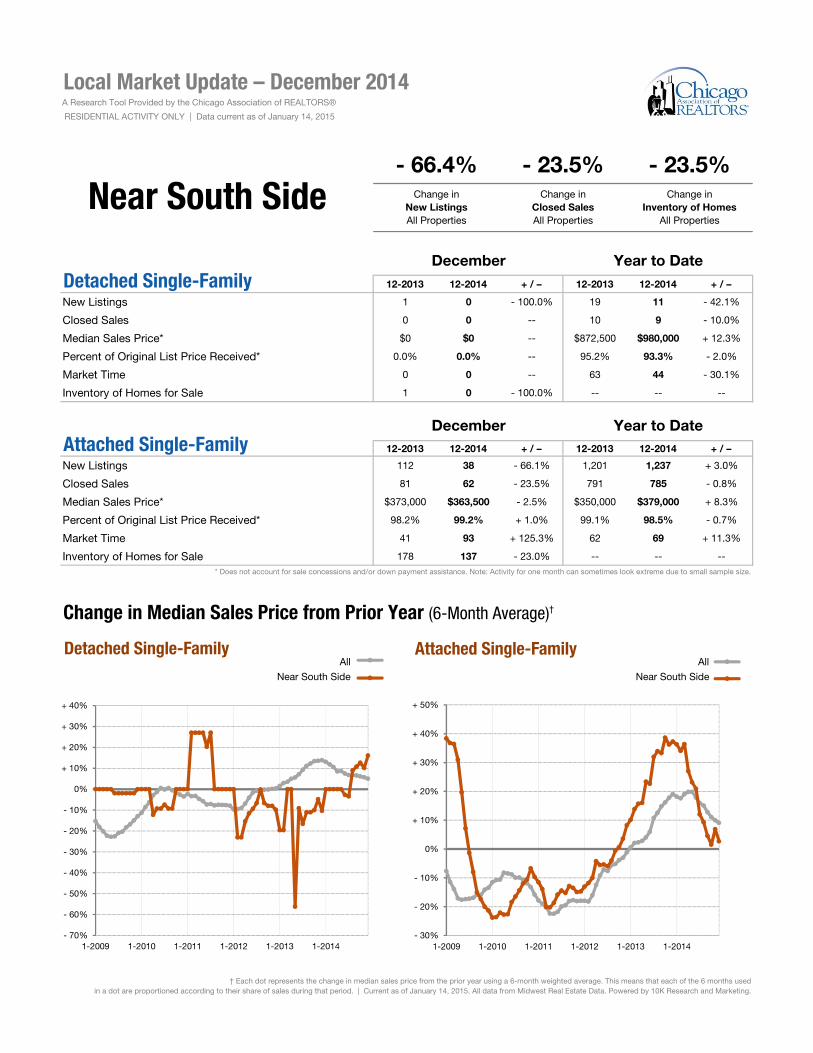
New Listings 1 0 - 100.0% 19 11 - 42.1%
Closed Sales 0 0 -- 10 9 - 10.0%
Median Sales Price* $0 $0 -- $872,500 $980,000 + 12.3%
Percent of Original List Price Received* 0.0% 0.0% -- 95.2% 93.3% - 2.0%
Market Time 0 0 -- 63 44 - 30.1%
Inventory of Homes for Sale 1 0 - 100.0% -- -- --
12-2013 12-2014 + / – 12-2013 12-2014 + / –
New Listings 112 38 - 66.1% 1,201 1,237 + 3.0%
Closed Sales 81 62 - 23.5% 791 785 - 0.8%
Median Sales Price* $373,000 $363,500 - 2.5% $350,000 $379,000 + 8.3%
Percent of Original List Price Received* 98.2% 99.2% + 1.0% 99.1% 98.5% - 0.7%
Market Time 41 93 + 125.3% 62 69 + 11.3%
Inventory of Homes for Sale 178 137 - 23.0% -- -- --* Does not account for sale concessions and/or down payment assistance. Note: Activity for one month can sometimes look extreme due to small sample size.
Local Market Update – December 2014A Research Tool Provided by the Chicago Association of REALTORS®
RESIDENTIAL ACTIVITY ONLY | Data current as of January 14, 2015
Near South Side- 66.4% - 23.5% - 23.5%
Change inNew ListingsAll Properties
Change inClosed SalesAll Properties
Change in Inventory of Homes
All Properties
Detached Single-FamilyDecember Year to Date
Attached Single-FamilyDecember Year to Date
† Each dot represents the change in median sales price from the prior year using a 6-month weighted average. This means that each of the 6 months usedin a dot are proportioned according to their share of sales during that period. | Current as of January 14, 2015. All data from Midwest Real Estate Data. Powered by 10K Research and Marketing.
Change in Median Sales Price from Prior Year (6-Month Average)†
All AllNear South Side Near South Side
- 70%
- 60%
- 50%
- 40%
- 30%
- 20%
- 10%
0%
+ 10%
+ 20%
+ 30%
+ 40%
1-2009 1-2010 1-2011 1-2012 1-2013 1-2014
Detached Single-Familyb
a
- 30%
- 20%
- 10%
0%
+ 10%
+ 20%
+ 30%
+ 40%
+ 50%
1-2009 1-2010 1-2011 1-2012 1-2013 1-2014
Attached Single-Familyb
a

12-2013 12-2014 + / – 12-2013 12-2014 + / –
New Listings 2 3 + 50.0% 64 65 + 1.6%
Closed Sales 2 4 + 100.0% 37 24 - 35.1%
Median Sales Price* $521,125 $378,600 - 27.3% $215,000 $357,100 + 66.1%
Percent of Original List Price Received* 137.8% 99.2% - 28.0% 94.5% 95.9% + 1.5%
Market Time 110 40 - 63.6% 171 66 - 61.4%
Inventory of Homes for Sale 11 14 + 27.3% -- -- --
12-2013 12-2014 + / – 12-2013 12-2014 + / –
New Listings 58 56 - 3.4% 1,510 1,558 + 3.2%
Closed Sales 76 69 - 9.2% 1,105 1,060 - 4.1%
Median Sales Price* $283,000 $305,000 + 7.8% $288,500 $315,000 + 9.2%
Percent of Original List Price Received* 96.6% 97.0% + 0.4% 98.6% 98.7% + 0.1%
Market Time 64 56 - 12.4% 60 56 - 6.7%
Inventory of Homes for Sale 188 176 - 6.4% -- -- --* Does not account for sale concessions and/or down payment assistance. Note: Activity for one month can sometimes look extreme due to small sample size.
Local Market Update – December 2014A Research Tool Provided by the Chicago Association of REALTORS®
RESIDENTIAL ACTIVITY ONLY | Data current as of January 14, 2015
Near West Side- 1.7% - 6.4% - 4.5%
Change inNew ListingsAll Properties
Change inClosed SalesAll Properties
Change in Inventory of Homes
All Properties
Detached Single-FamilyDecember Year to Date
Attached Single-FamilyDecember Year to Date
† Each dot represents the change in median sales price from the prior year using a 6-month weighted average. This means that each of the 6 months usedin a dot are proportioned according to their share of sales during that period. | Current as of January 14, 2015. All data from Midwest Real Estate Data. Powered by 10K Research and Marketing.
Change in Median Sales Price from Prior Year (6-Month Average)†
All AllNear West Side Near West Side
- 100%
- 50%
0%
+ 50%
+ 100%
+ 150%
+ 200%
+ 250%
+ 300%
+ 350%
+ 400%
+ 450%
1-2009 1-2010 1-2011 1-2012 1-2013 1-2014
Detached Single-Familyb
a
- 30%
- 20%
- 10%
0%
+ 10%
+ 20%
+ 30%
1-2009 1-2010 1-2011 1-2012 1-2013 1-2014
Attached Single-Familyb
a

12-2013 12-2014 + / – 12-2013 12-2014 + / –
New Listings 11 13 + 18.2% 362 427 + 18.0%
Closed Sales 12 16 + 33.3% 254 205 - 19.3%
Median Sales Price* $1,094,750 $1,045,000 - 4.5% $875,000 $900,000 + 2.9%
Percent of Original List Price Received* 95.7% 96.2% + 0.5% 97.3% 96.9% - 0.3%
Market Time 39 86 + 122.1% 60 52 - 13.7%
Inventory of Homes for Sale 31 52 + 67.7% -- -- --
12-2013 12-2014 + / – 12-2013 12-2014 + / –
New Listings 11 25 + 127.3% 541 668 + 23.5%
Closed Sales 27 29 + 7.4% 375 334 - 10.9%
Median Sales Price* $380,000 $392,000 + 3.2% $355,000 $386,000 + 8.7%
Percent of Original List Price Received* 96.0% 94.8% - 1.2% 97.4% 96.9% - 0.6%
Market Time 67 72 + 6.8% 72 57 - 21.0%
Inventory of Homes for Sale 52 68 + 30.8% -- -- --* Does not account for sale concessions and/or down payment assistance. Note: Activity for one month can sometimes look extreme due to small sample size.
Local Market Update – December 2014A Research Tool Provided by the Chicago Association of REALTORS®
RESIDENTIAL ACTIVITY ONLY | Data current as of January 14, 2015
North Center+ 72.7% + 15.4% + 44.6%
Change inNew ListingsAll Properties
Change inClosed SalesAll Properties
Change in Inventory of Homes
All Properties
Detached Single-FamilyDecember Year to Date
Attached Single-FamilyDecember Year to Date
† Each dot represents the change in median sales price from the prior year using a 6-month weighted average. This means that each of the 6 months usedin a dot are proportioned according to their share of sales during that period. | Current as of January 14, 2015. All data from Midwest Real Estate Data. Powered by 10K Research and Marketing.
Change in Median Sales Price from Prior Year (6-Month Average)†
All AllNorth Center North Center
- 40%
- 30%
- 20%
- 10%
0%
+ 10%
+ 20%
+ 30%
+ 40%
+ 50%
1-2009 1-2010 1-2011 1-2012 1-2013 1-2014
Detached Single-Familyb
a
- 25%
- 20%
- 15%
- 10%
- 5%
0%
+ 5%
+ 10%
+ 15%
+ 20%
+ 25%
1-2009 1-2010 1-2011 1-2012 1-2013 1-2014
Attached Single-Familyb
a
12-2013 12-2014 + / – 12-2013 12-2014 + / –
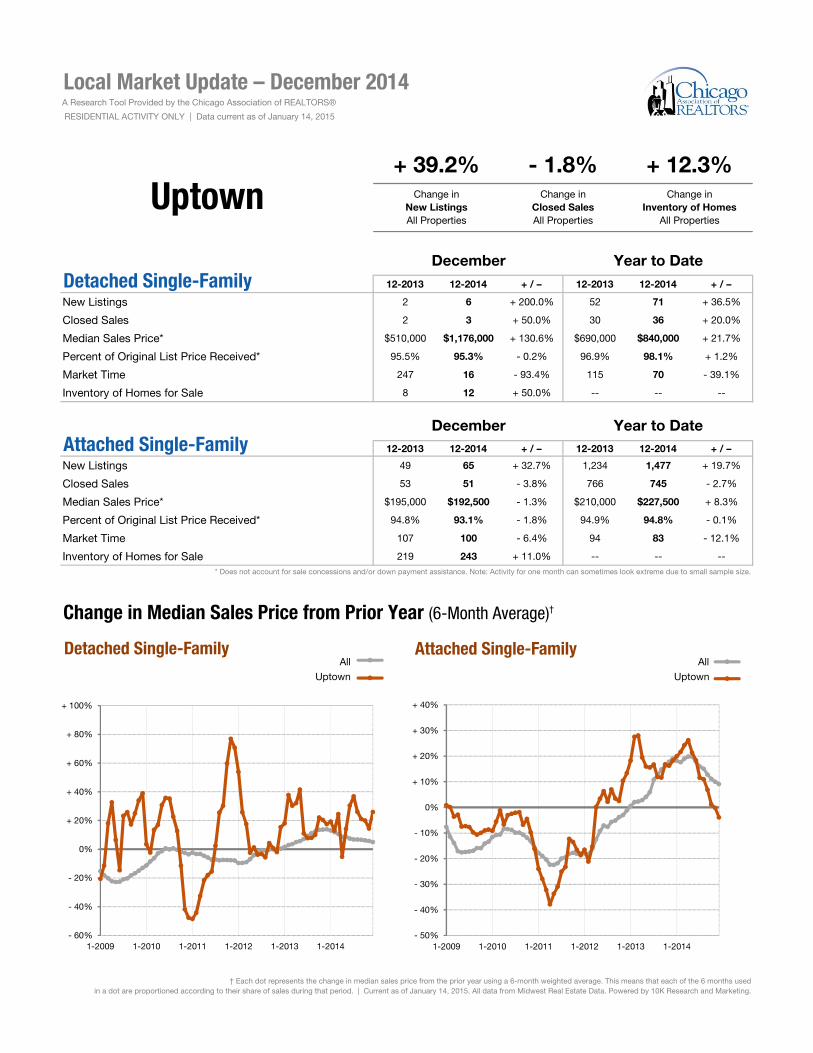
New Listings 2 6 + 200.0% 52 71 + 36.5%
Closed Sales 2 3 + 50.0% 30 36 + 20.0%
Median Sales Price* $510,000 $1,176,000 + 130.6% $690,000 $840,000 + 21.7%
Percent of Original List Price Received* 95.5% 95.3% - 0.2% 96.9% 98.1% + 1.2%
Market Time 247 16 - 93.4% 115 70 - 39.1%
Inventory of Homes for Sale 8 12 + 50.0% -- -- --
12-2013 12-2014 + / – 12-2013 12-2014 + / –
New Listings 49 65 + 32.7% 1,234 1,477 + 19.7%
Closed Sales 53 51 - 3.8% 766 745 - 2.7%
Median Sales Price* $195,000 $192,500 - 1.3% $210,000 $227,500 + 8.3%
Percent of Original List Price Received* 94.8% 93.1% - 1.8% 94.9% 94.8% - 0.1%
Market Time 107 100 - 6.4% 94 83 - 12.1%
Inventory of Homes for Sale 219 243 + 11.0% -- -- --* Does not account for sale concessions and/or down payment assistance. Note: Activity for one month can sometimes look extreme due to small sample size.
Local Market Update – December 2014A Research Tool Provided by the Chicago Association of REALTORS®
RESIDENTIAL ACTIVITY ONLY | Data current as of January 14, 2015
Uptown+ 39.2% - 1.8% + 12.3%
Change inNew ListingsAll Properties
Change inClosed SalesAll Properties
Change in Inventory of Homes
All Properties
Detached Single-FamilyDecember Year to Date
Attached Single-FamilyDecember Year to Date
† Each dot represents the change in median sales price from the prior year using a 6-month weighted average. This means that each of the 6 months usedin a dot are proportioned according to their share of sales during that period. | Current as of January 14, 2015. All data from Midwest Real Estate Data. Powered by 10K Research and Marketing.
Change in Median Sales Price from Prior Year (6-Month Average)†
All AllUptown Uptown
- 60%
- 40%
- 20%
0%
+ 20%
+ 40%
+ 60%
+ 80%
+ 100%
1-2009 1-2010 1-2011 1-2012 1-2013 1-2014
Detached Single-Familyb
a
- 50%
- 40%
- 30%
- 20%
- 10%
0%
+ 10%
+ 20%
+ 30%
+ 40%
1-2009 1-2010 1-2011 1-2012 1-2013 1-2014
Attached Single-Familyb
a
12-2013 12-2014 + / – 12-2013 12-2014 + / –
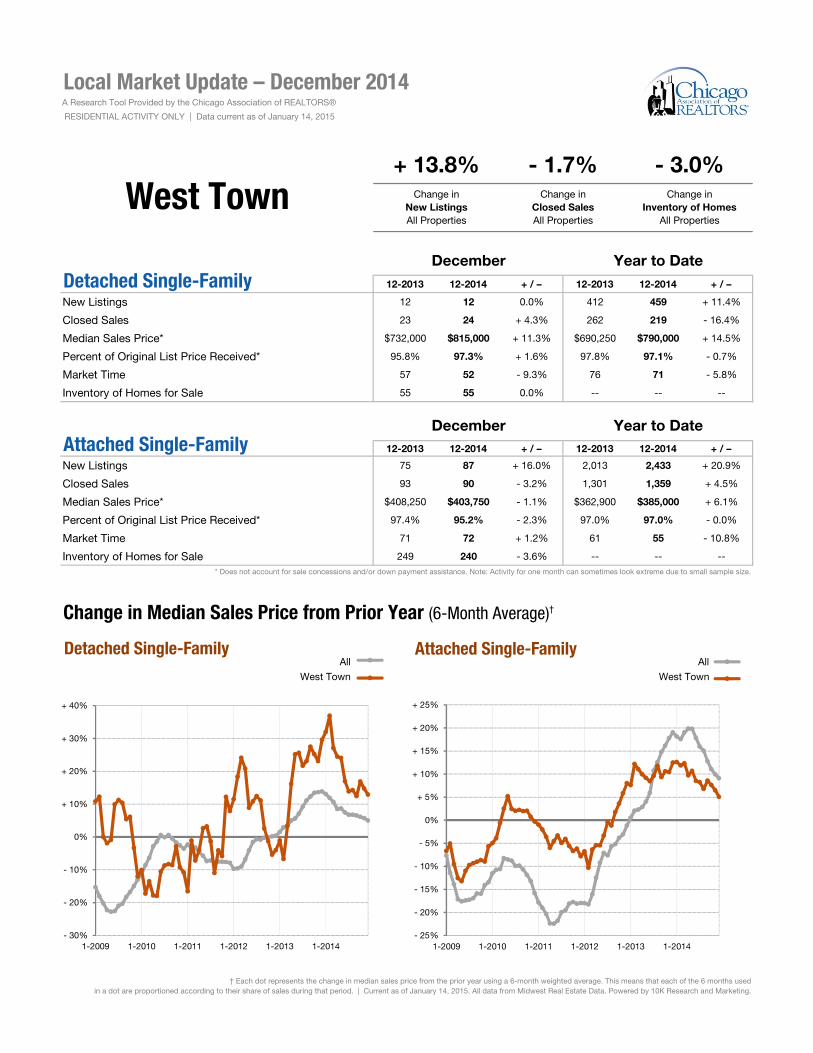
New Listings 12 12 0.0% 412 459 + 11.4%
Closed Sales 23 24 + 4.3% 262 219 - 16.4%
Median Sales Price* $732,000 $815,000 + 11.3% $690,250 $790,000 + 14.5%
Percent of Original List Price Received* 95.8% 97.3% + 1.6% 97.8% 97.1% - 0.7%
Market Time 57 52 - 9.3% 76 71 - 5.8%
Inventory of Homes for Sale 55 55 0.0% -- -- --
12-2013 12-2014 + / – 12-2013 12-2014 + / –
New Listings 75 87 + 16.0% 2,013 2,433 + 20.9%
Closed Sales 93 90 - 3.2% 1,301 1,359 + 4.5%
Median Sales Price* $408,250 $403,750 - 1.1% $362,900 $385,000 + 6.1%
Percent of Original List Price Received* 97.4% 95.2% - 2.3% 97.0% 97.0% - 0.0%
Market Time 71 72 + 1.2% 61 55 - 10.8%
Inventory of Homes for Sale 249 240 - 3.6% -- -- --* Does not account for sale concessions and/or down payment assistance. Note: Activity for one month can sometimes look extreme due to small sample size.
Local Market Update – December 2014A Research Tool Provided by the Chicago Association of REALTORS®
RESIDENTIAL ACTIVITY ONLY | Data current as of January 14, 2015
West Town+ 13.8% - 1.7% - 3.0%
Change inNew ListingsAll Properties
Change inClosed SalesAll Properties
Change in Inventory of Homes
All Properties
Detached Single-FamilyDecember Year to Date
Attached Single-FamilyDecember Year to Date
† Each dot represents the change in median sales price from the prior year using a 6-month weighted average. This means that each of the 6 months usedin a dot are proportioned according to their share of sales during that period. | Current as of January 14, 2015. All data from Midwest Real Estate Data. Powered by 10K Research and Marketing.
Change in Median Sales Price from Prior Year (6-Month Average)†
All AllWest Town West Town
- 30%
- 20%
- 10%
0%
+ 10%
+ 20%
+ 30%
+ 40%
1-2009 1-2010 1-2011 1-2012 1-2013 1-2014
Detached Single-Familyb
a
- 25%
- 20%
- 15%
- 10%
- 5%
0%
+ 5%
+ 10%
+ 15%
+ 20%
+ 25%
1-2009 1-2010 1-2011 1-2012 1-2013 1-2014
Attached Single-Familyb
a


![SMV [McMillan 93]](https://img.pdfslide.us/doc/110x75/5681572a550346895dc4c47a/smv-mcmillan-93.jpg)