Embed Size (px)
Citation preview
Copyright @ 2011. All rights reserved
Earned Value Management and PRINCE2John Chapman
PRINCE2® is a Registered Trade Mark of the Office of Government Commerce in the United Kingdom and other countries
Project Controls ExpoThursday 10th Nov 2011
Copyright @ 2011. All rights reserved
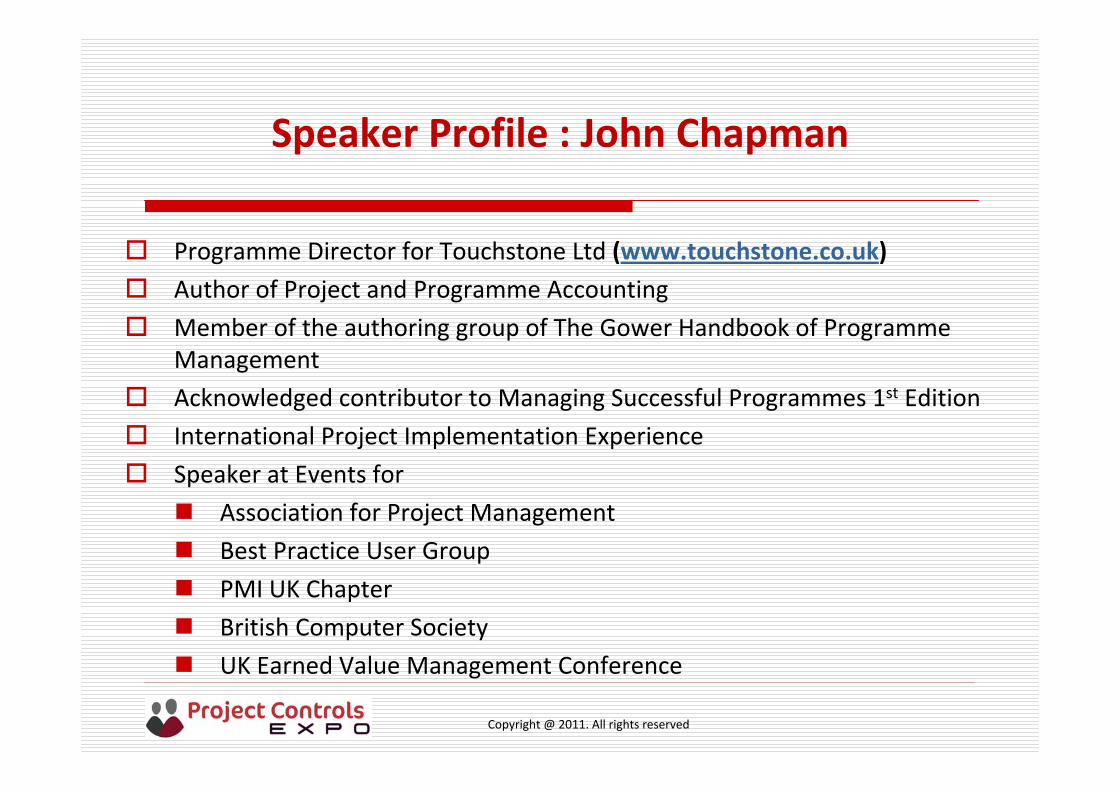
Speaker Profile : John Chapman
Programme Director for Touchstone Ltd (www.touchstone.co.uk)
Author of Project and Programme Accounting
Member of the authoring group of The Gower Handbook of ProgrammeManagement
Acknowledged contributor to Managing Successful Programmes 1st Edition
International Project Implementation Experience
Speaker at Events for
Association for Project Management
Best Practice User Group
PMI UK Chapter
British Computer Society
UK Earned Value Management Conference
Copyright @ 2011. All rights reserved
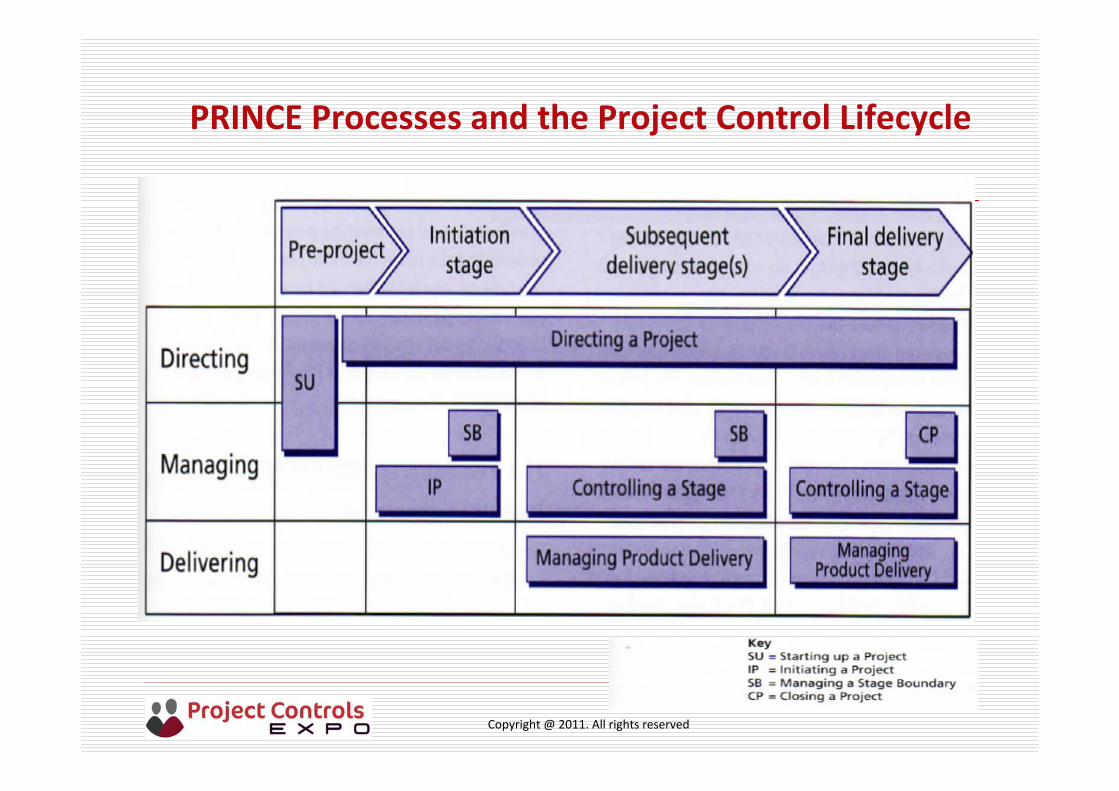
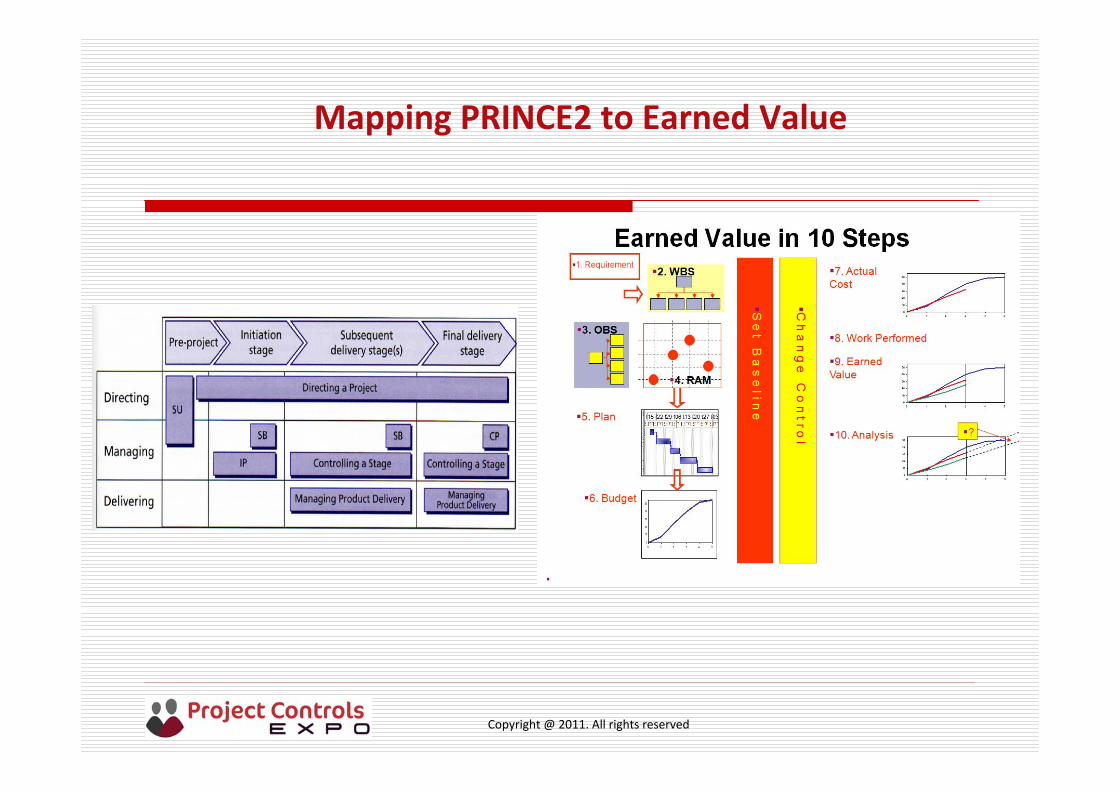
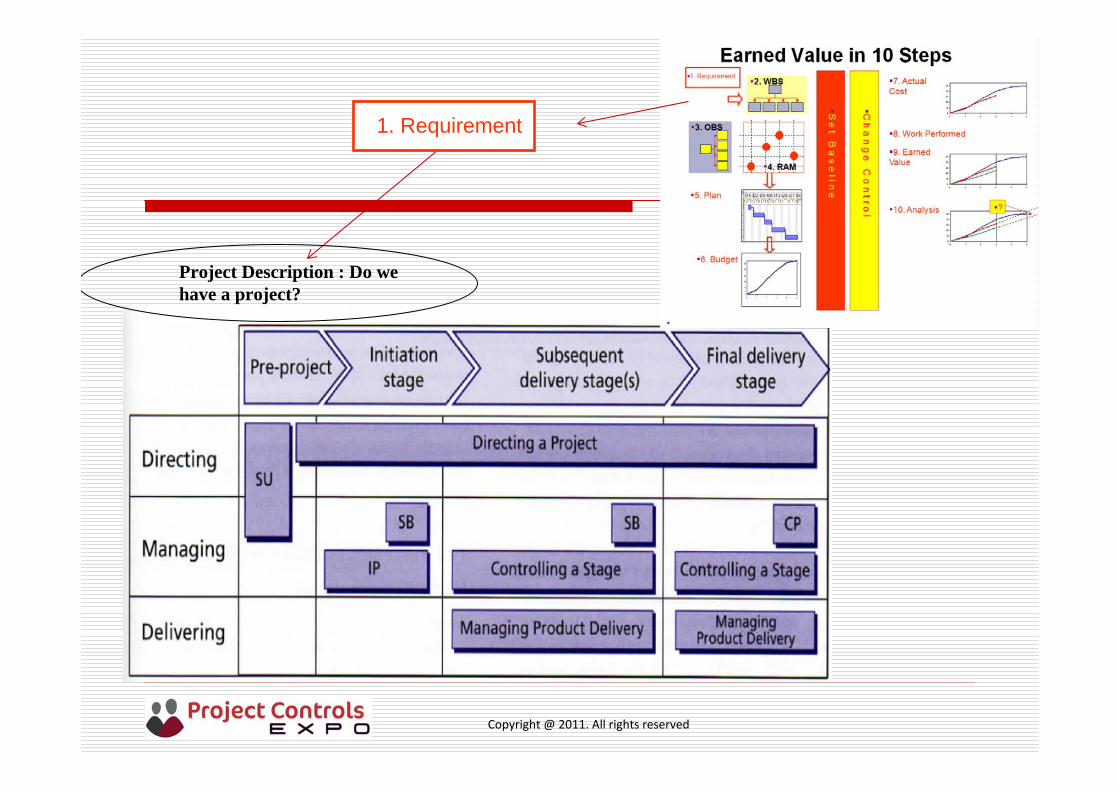
PRINCE Processes and the Project Control Lifecycle
Copyright @ 2011. All rights reserved
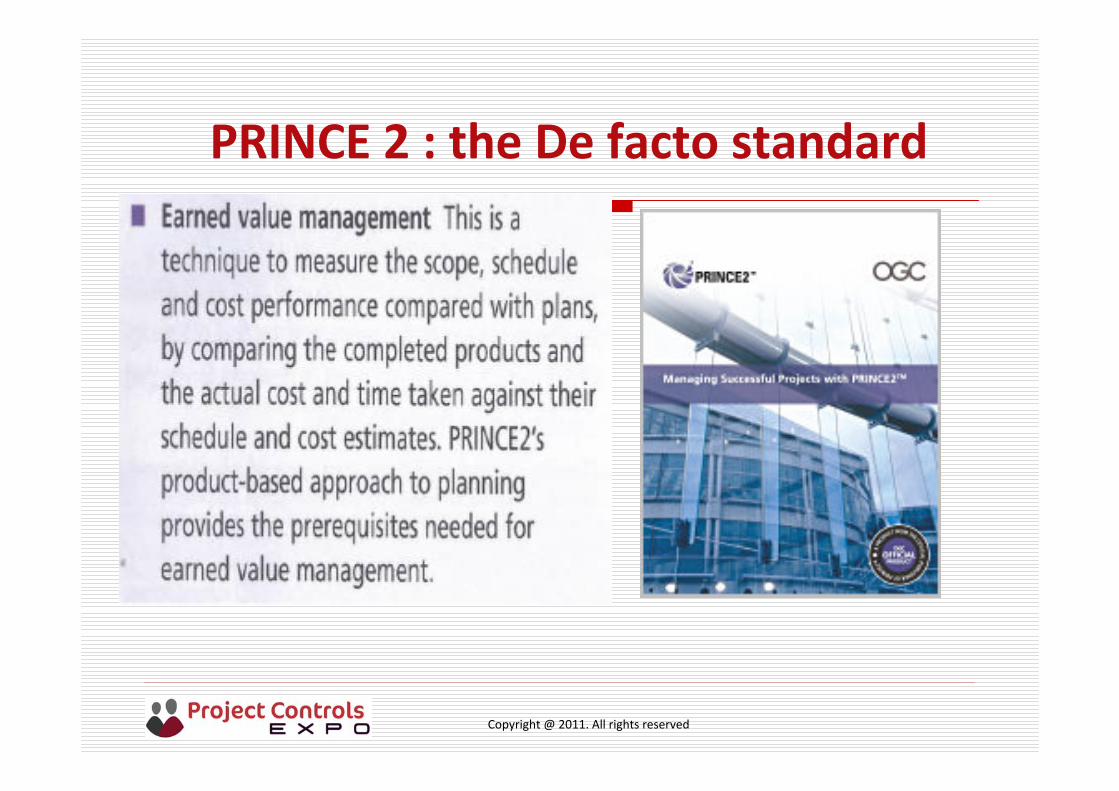
PRINCE 2 : the De facto standard
Copyright @ 2011. All rights reserved5
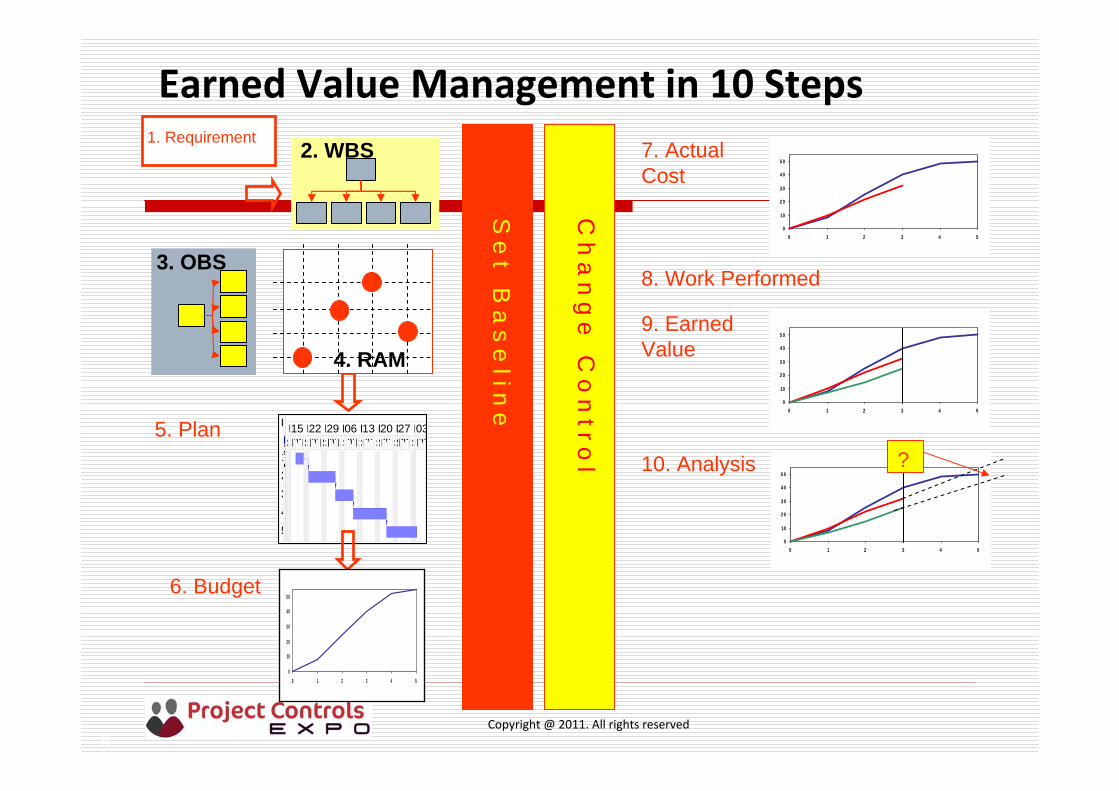
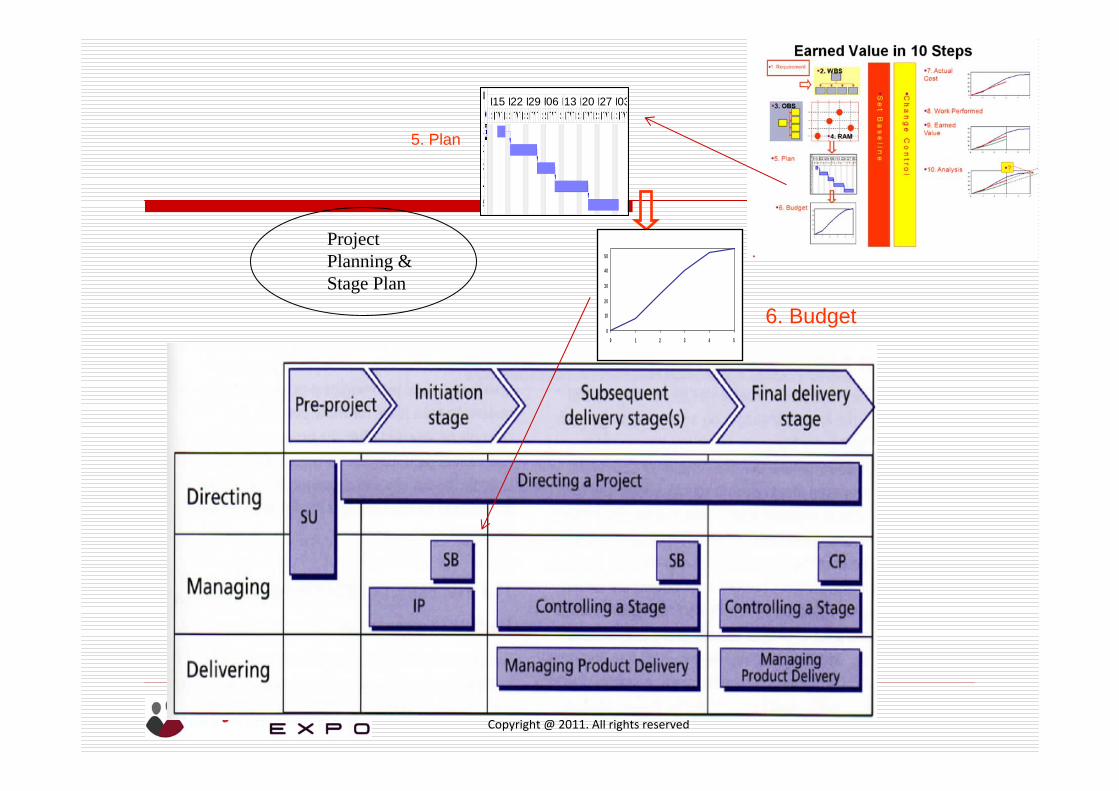
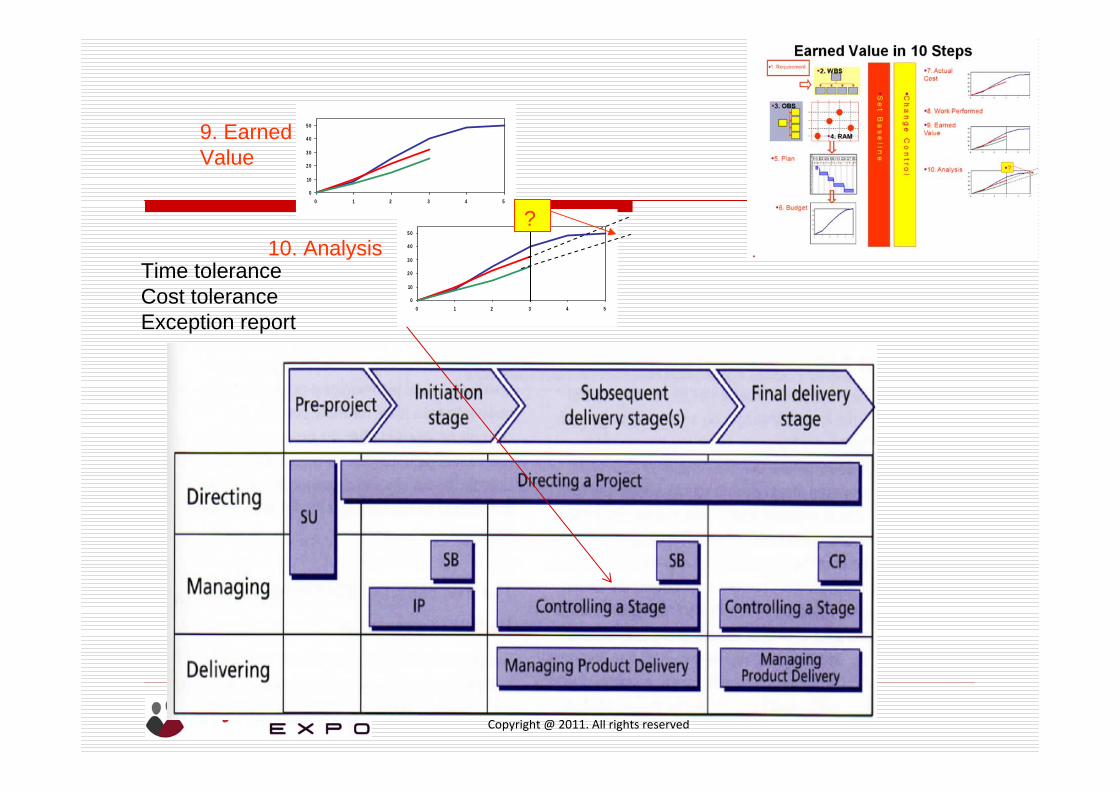
Earned Value Management in 10 Steps1. Requirement
2. WBS
3. OBS
I
12345
SSMTWTFSSMTWTFSSMTWTFSSMTWTFSSMTWTFSSMTWTFSSMTWTFSSMTWTN15 N22 N29 N06 D13 D20 D27 D035. Plan
6. Budget
0
10
2 0
3 0
4 0
5 0
0 1 2 3 4 5
S e t B
a s e l i n e
4. RAM
0
10
2 0
3 0
4 0
5 0
0 1 2 3 4 5
7. Actual Cost
8. Work Performed
0
10
2 0
3 0
4 0
5 0
0 1 2 3 4 5
9. Earned Value
0
10
2 0
3 0
4 0
5 0
0 1 2 3 4 5
10. Analysis ?
C h a n g e C
o n t r o l
Copyright @ 2011. All rights reserved
Mapping PRINCE2 to Earned Value
Slide 7 of 133Copyright @ 2011. All rights reserved
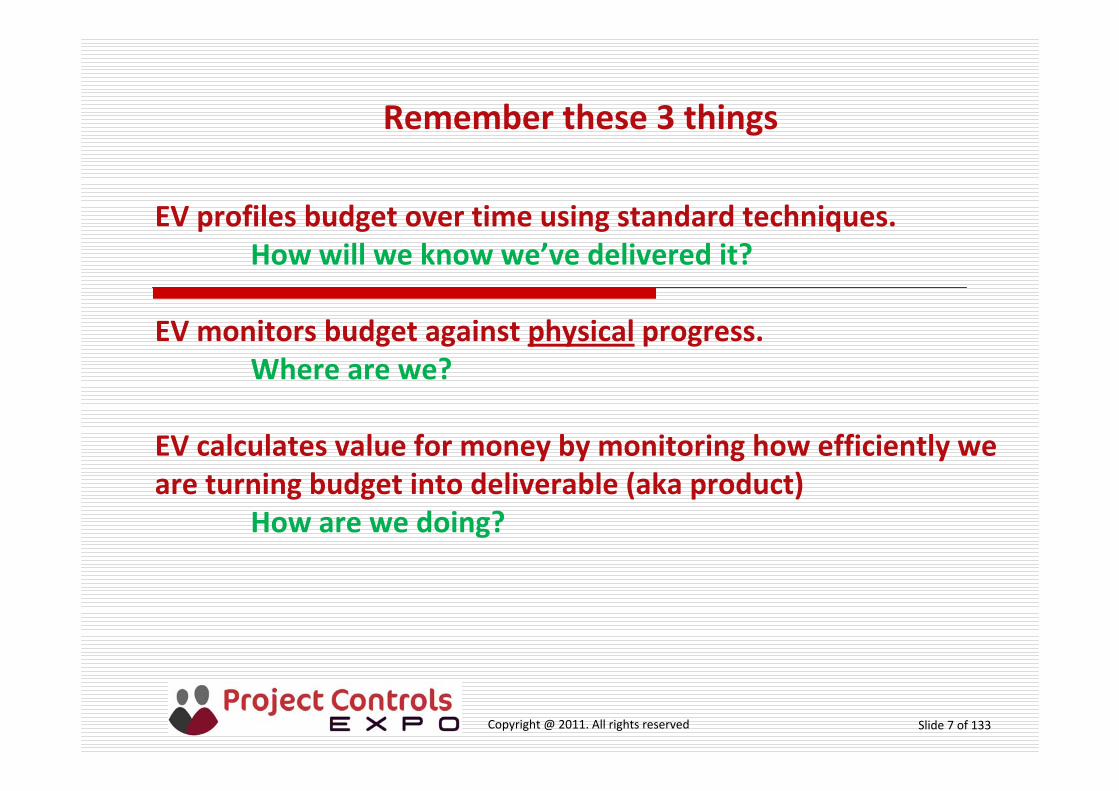
EV profiles budget over time using standard techniques.How will we know we’ve delivered it?
EV monitors budget against physical progress.Where are we?
EV calculates value for money by monitoring how efficiently we are turning budget into deliverable (aka product)
How are we doing?
Remember these 3 things
Copyright @ 2011. All rights reserved
1. Requirement
Project Description : Do we have a project?
Copyright @ 2011. All rights reserved
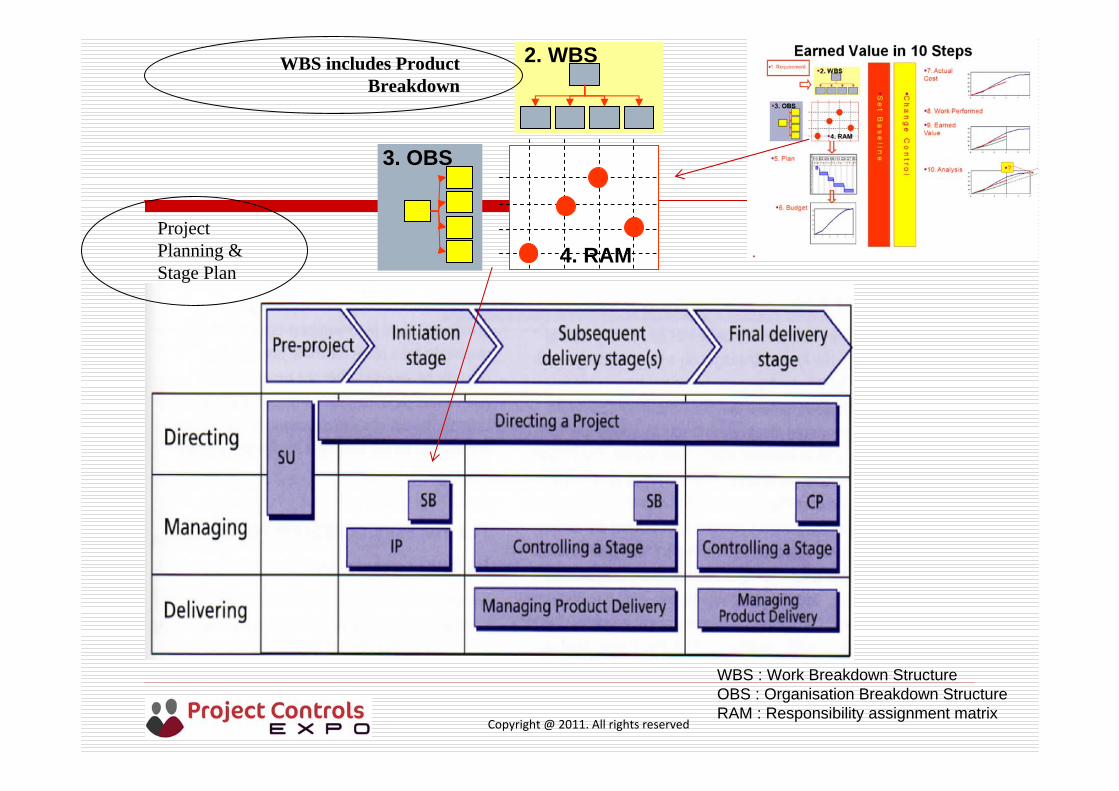
3. OBS
4. RAM
2. WBS
WBS : Work Breakdown StructureOBS : Organisation Breakdown StructureRAM : Responsibility assignment matrix
Project Planning & Stage Plan
WBS includes Product Breakdown
Copyright @ 2011. All rights reserved
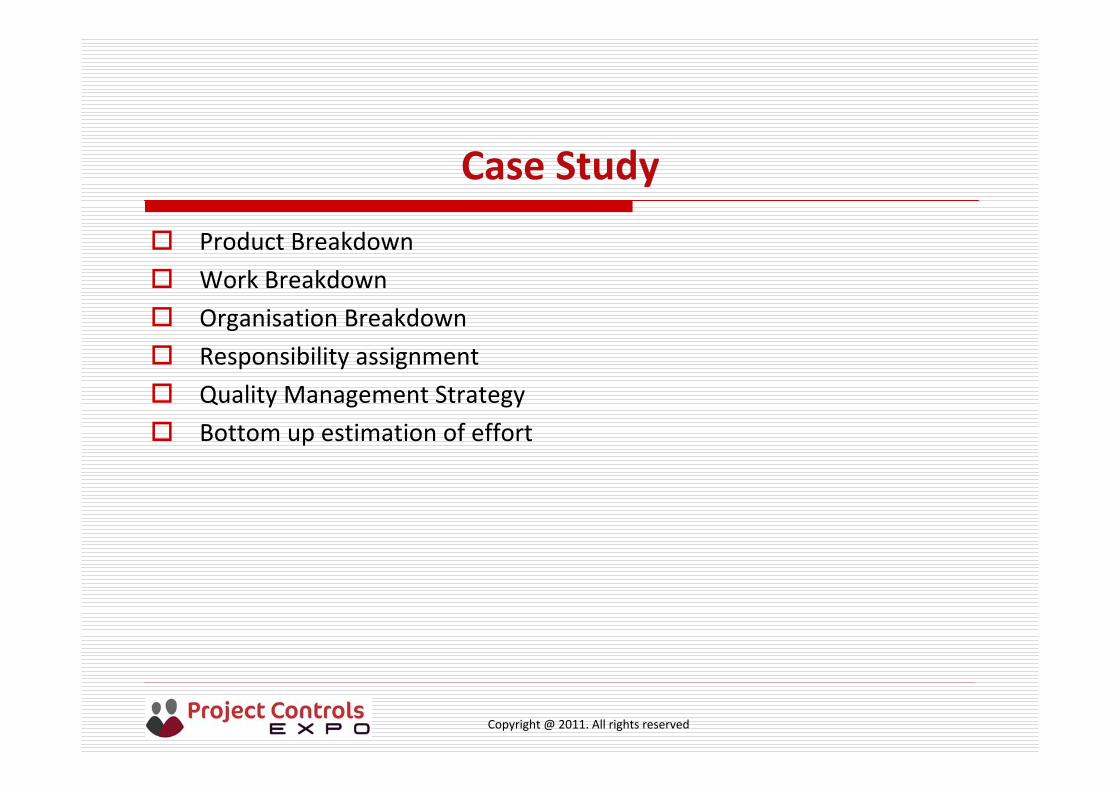
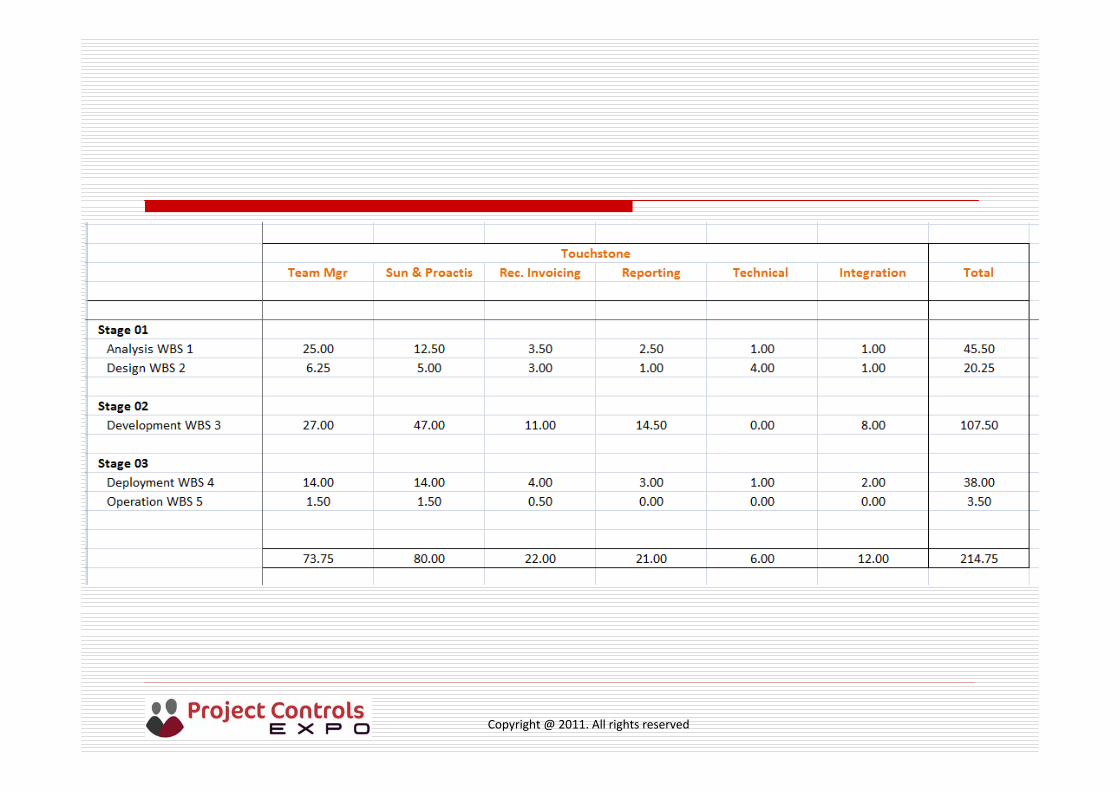
Case Study
Product Breakdown
Work Breakdown
Organisation Breakdown
Responsibility assignment
Quality Management Strategy
Bottom up estimation of effort
Copyright @ 2011. All rights reserved
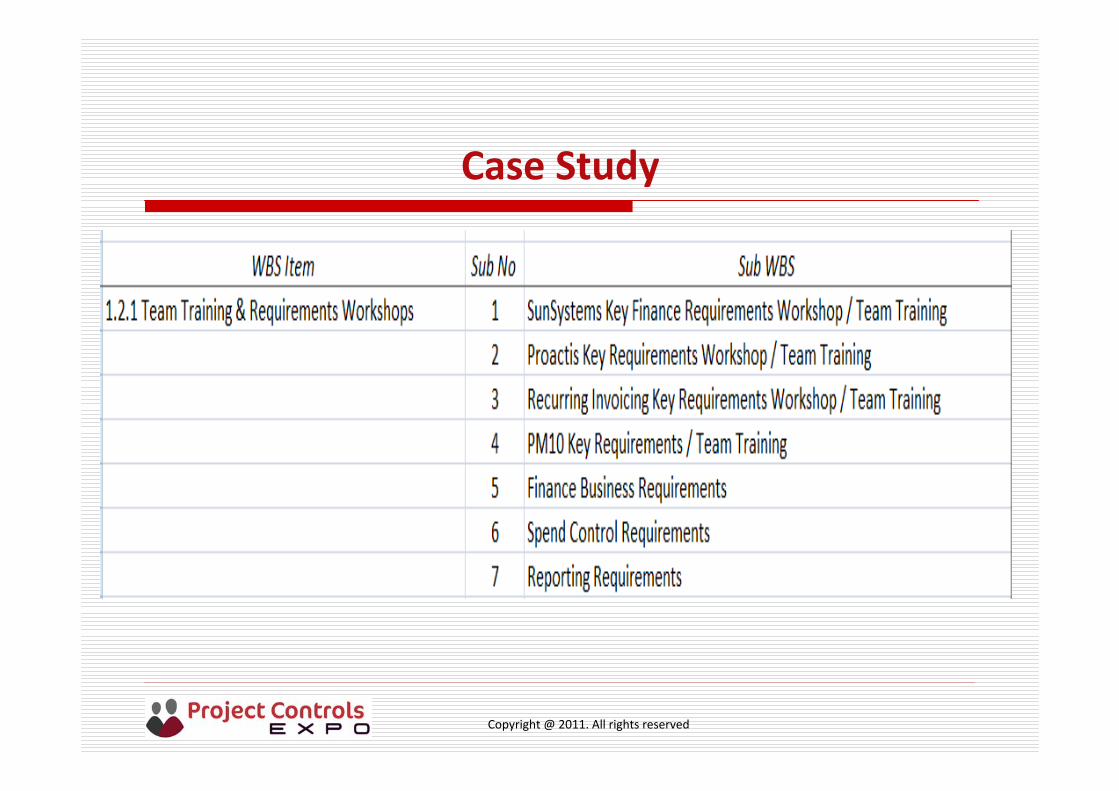
Case Study
Copyright @ 2011. All rights reserved
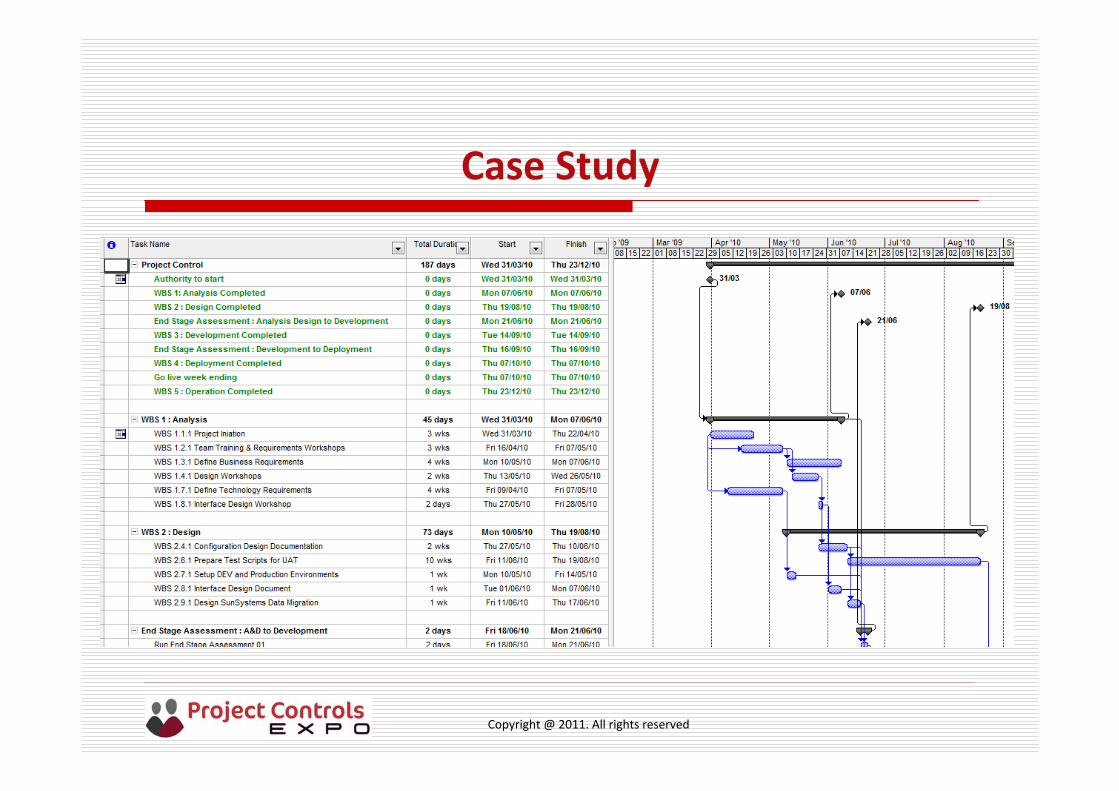
Case Study
Copyright @ 2011. All rights reserved
I
12345
SSMTWTFSSMTWTFSSMTWTFSSMTWTFSSMTWTFSSMTWTFSSMTWTFSSMTWTN15 N22 N29 N06 D13 D20 D27 D03
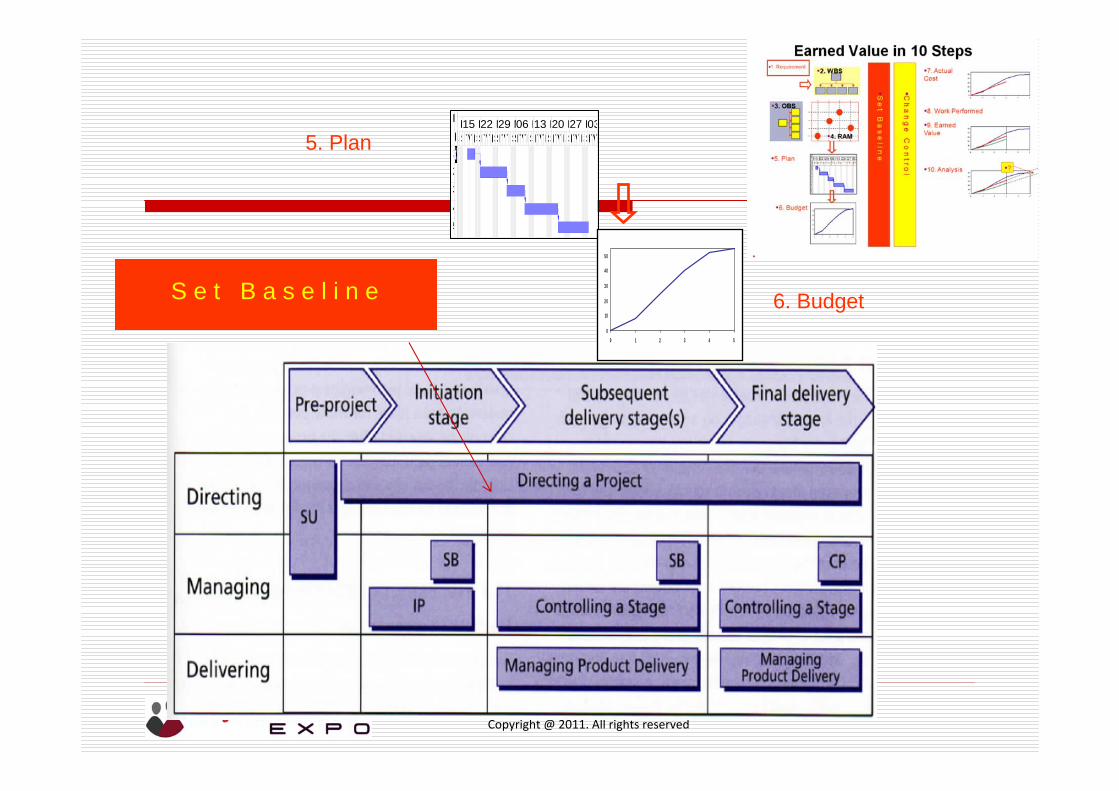
5. Plan
6. Budget0
10
2 0
3 0
4 0
5 0
0 1 2 3 4 5
Project Planning & Stage Plan
Copyright @ 2011. All rights reserved
Case Study
Project plan gives milestone dates with estimated dates by Stage
Stage plans which have the allocation of resource assignment against activities
Detailed plans for the current Stage
Bottom up estimate of time by level 4 WBS
Totalled by Project Stage
Copyright @ 2011. All rights reserved
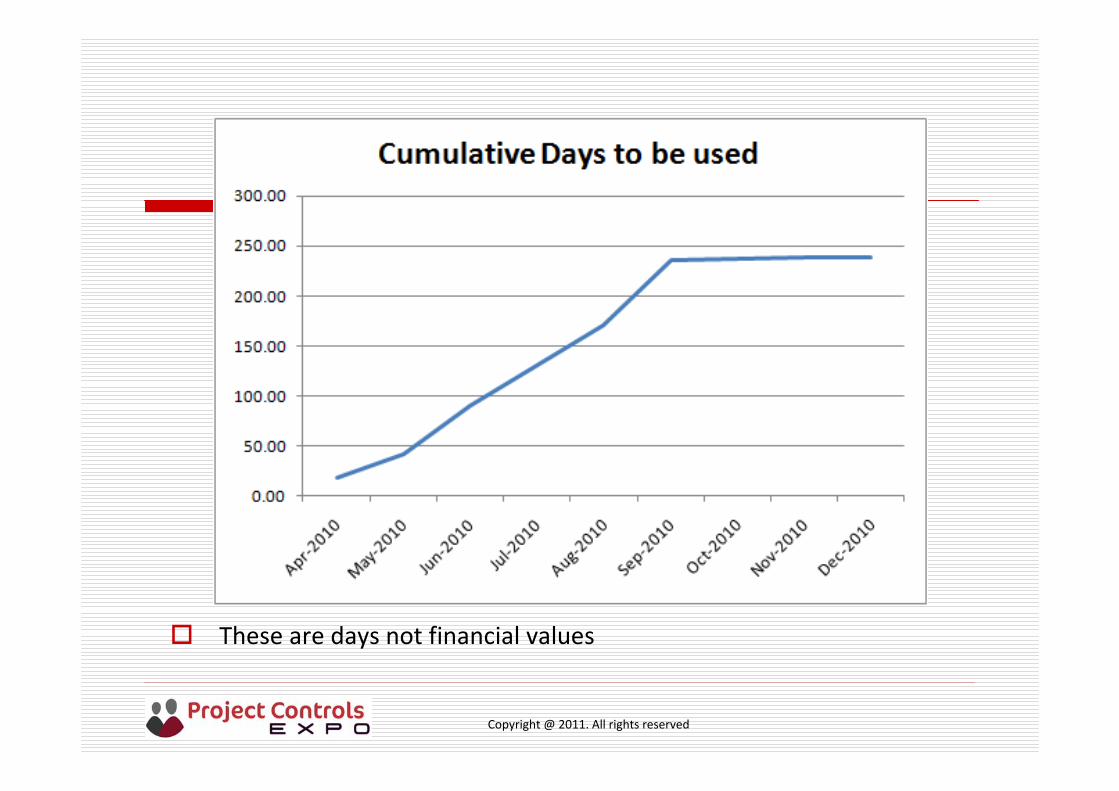
Copyright @ 2011. All rights reserved
These are days not financial values
Copyright @ 2011. All rights reserved
I
12345
SSMTWTFSSMTWTFSSMTWTFSSMTWTFSSMTWTFSSMTWTFSSMTWTFSSMTWTN15 N22 N29 N06 D13 D20 D27 D03
5. Plan
6. Budget0
10
2 0
3 0
4 0
5 0
0 1 2 3 4 5
S e t B a s e l i n e
Copyright @ 2011. All rights reserved
Case Study
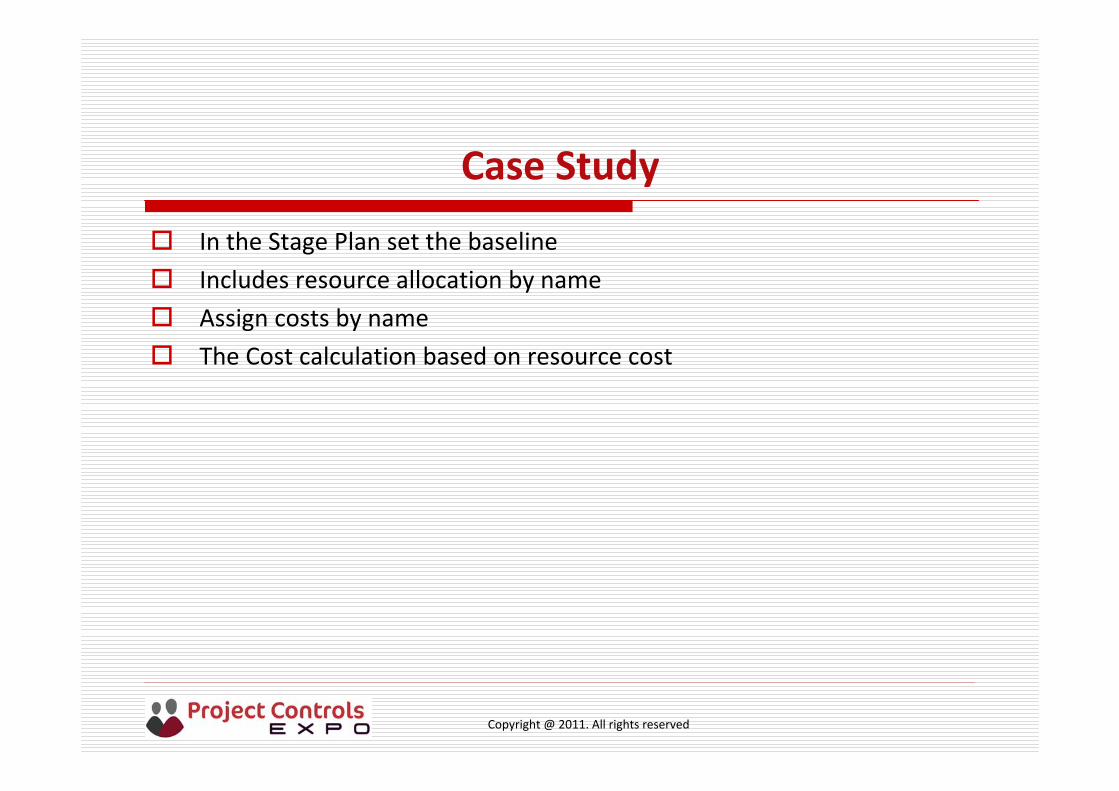
In the Stage Plan set the baseline
Includes resource allocation by name
Assign costs by name
The Cost calculation based on resource cost
Copyright @ 2011. All rights reserved
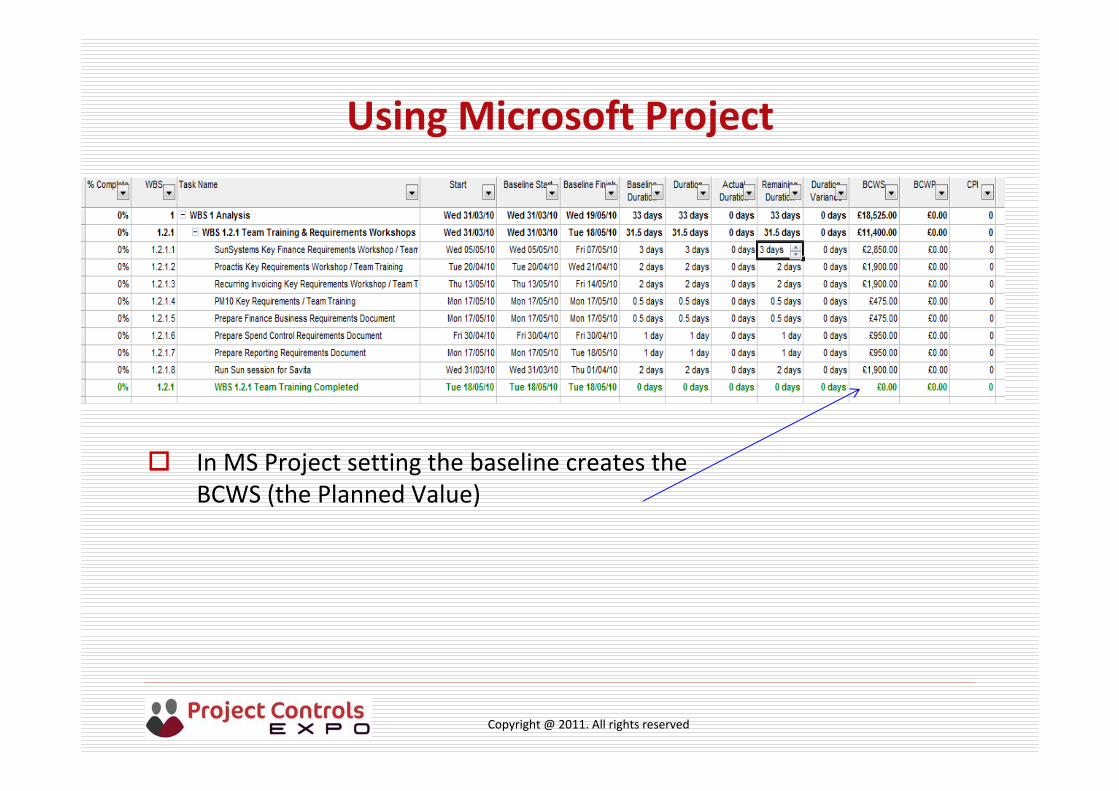
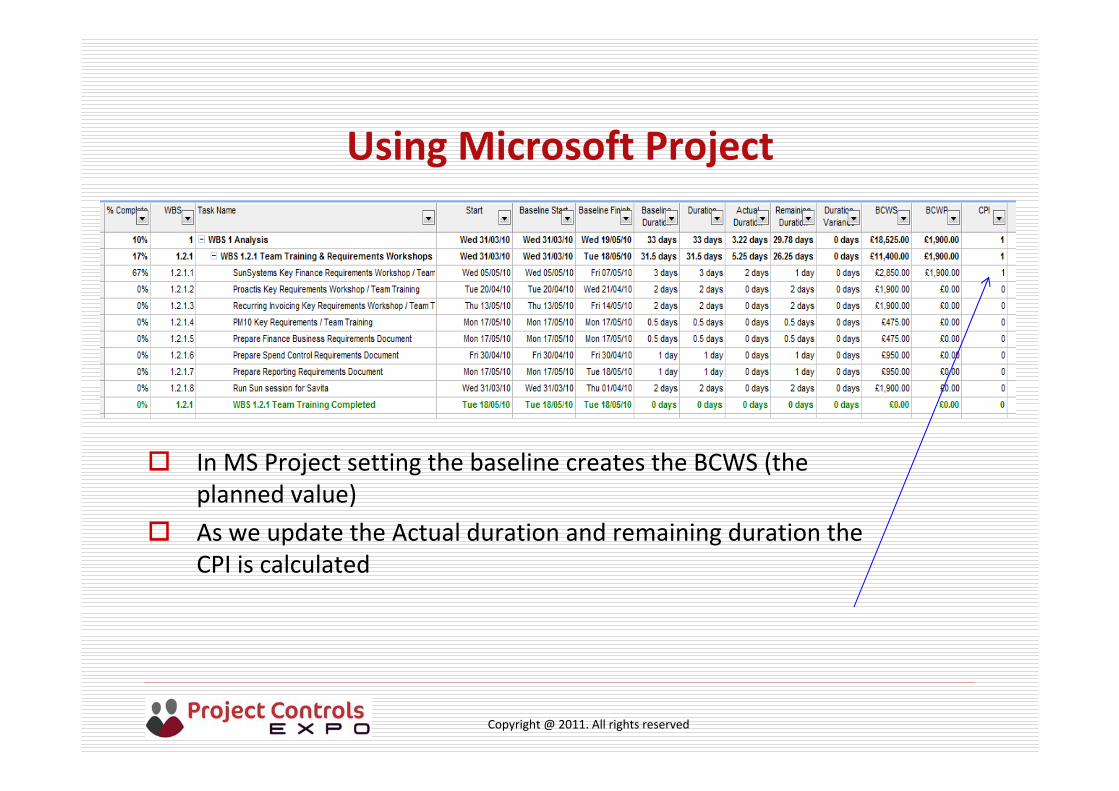
In MS Project setting the baseline creates the BCWS (the Planned Value)
Using Microsoft Project
Copyright @ 2011. All rights reserved
0
10
2 0
3 0
4 0
5 0
0 1 2 3 4 5
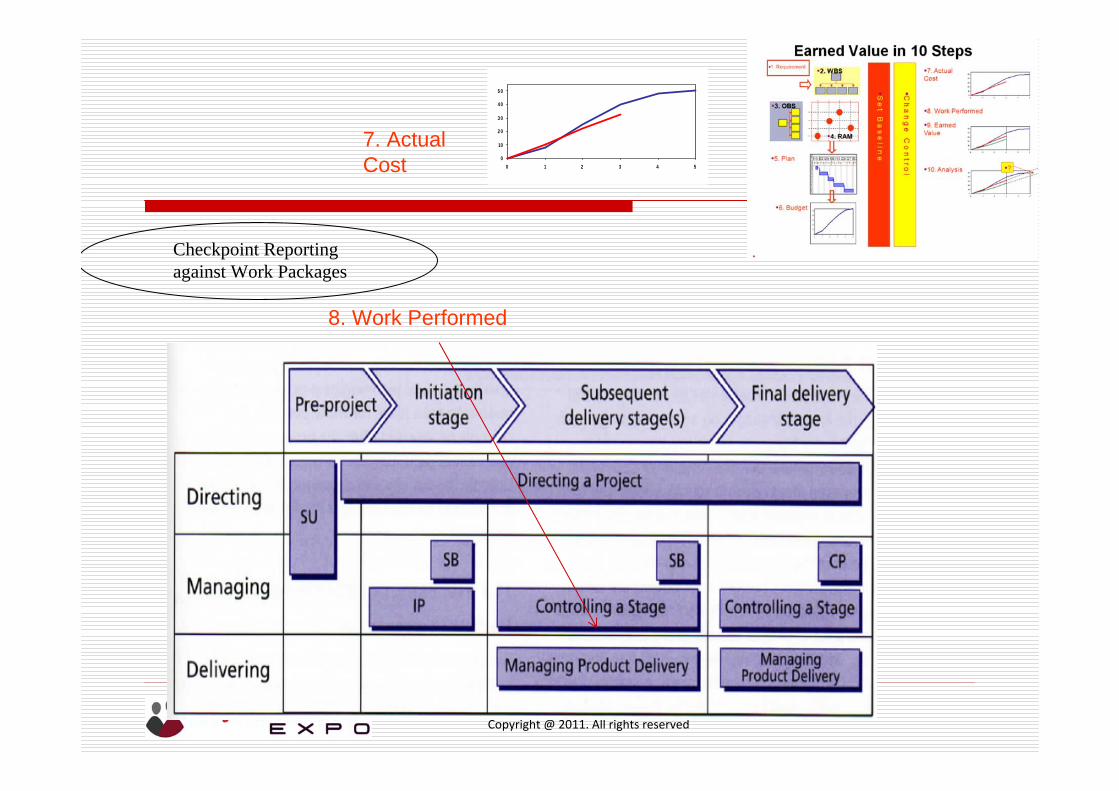
7. Actual Cost
8. Work Performed
Checkpoint Reporting against Work Packages
Copyright @ 2011. All rights reserved
Case Study
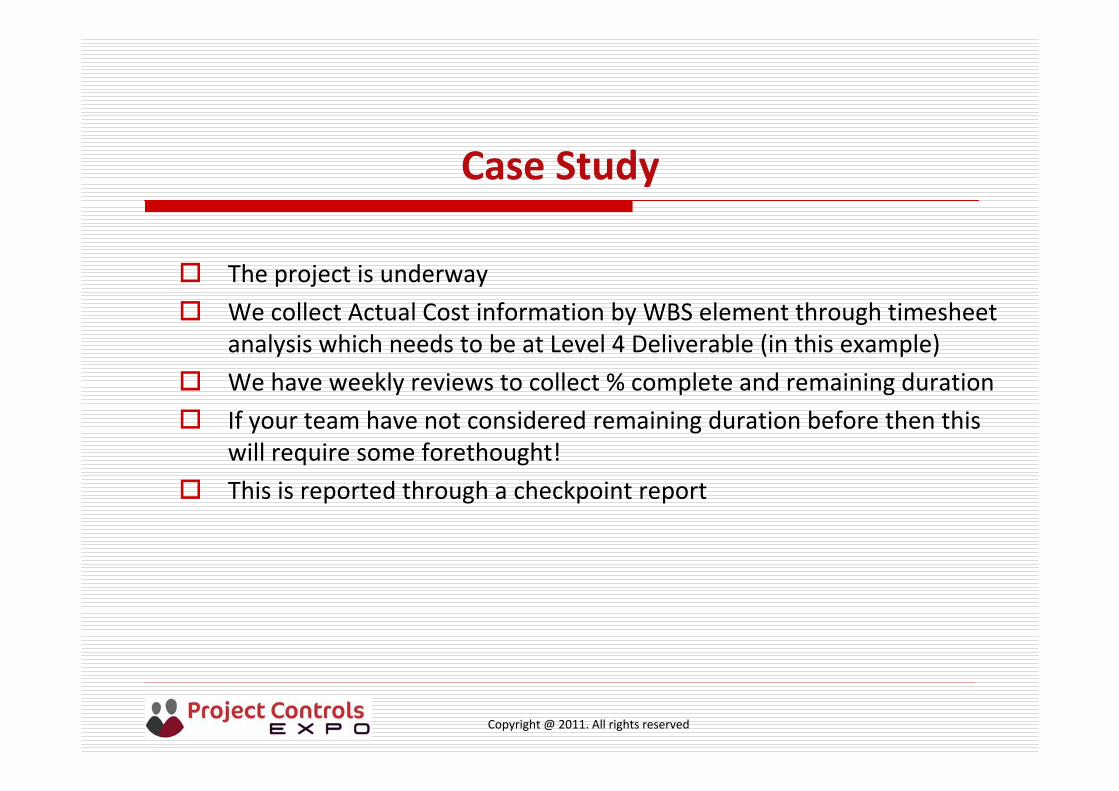
The project is underway
We collect Actual Cost information by WBS element through timesheet analysis which needs to be at Level 4 Deliverable (in this example)
We have weekly reviews to collect % complete and remaining duration
If your team have not considered remaining duration before then this will require some forethought!
This is reported through a checkpoint report
Copyright @ 2011. All rights reserved
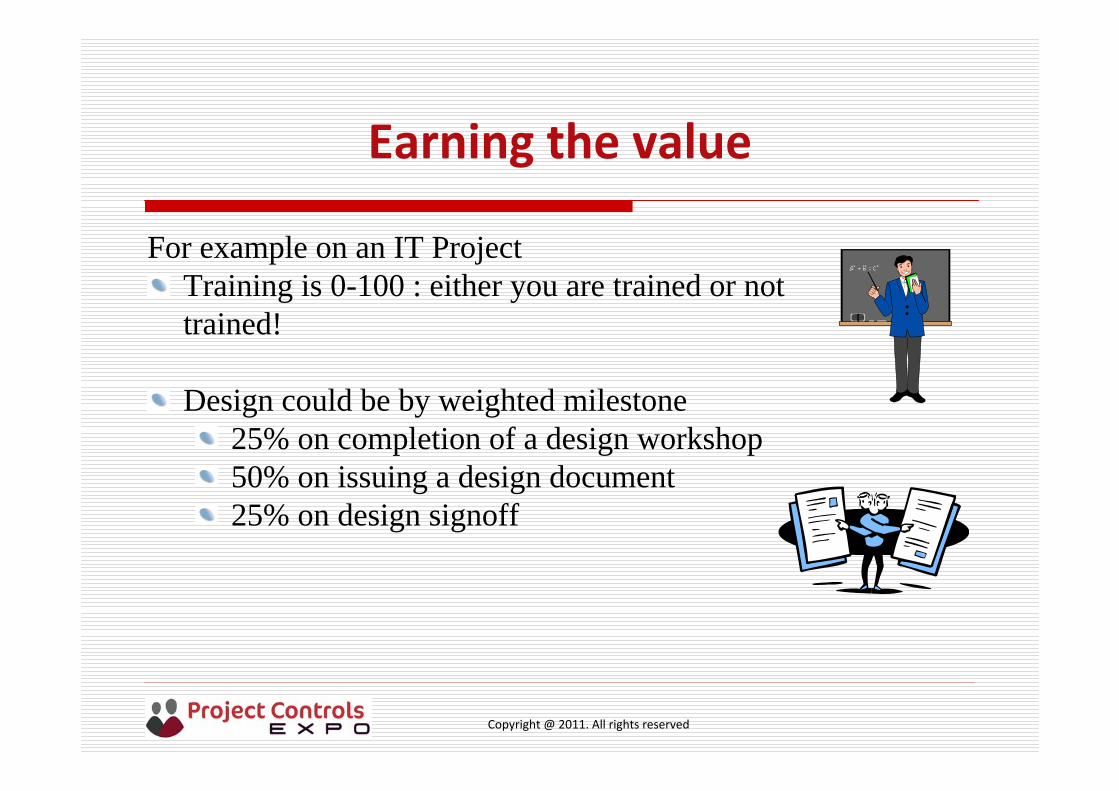
Earning the value
For example on an IT ProjectTraining is 0-100 : either you are trained or not trained!
Design could be by weighted milestone25% on completion of a design workshop50% on issuing a design document25% on design signoff
Copyright @ 2011. All rights reserved
In MS Project setting the baseline creates the BCWS (the planned value)
As we update the Actual duration and remaining duration the CPI is calculated
Using Microsoft Project
Copyright @ 2011. All rights reserved
0
10
2 0
3 0
4 0
5 0
0 1 2 3 4 5
9. Earned Value
0
10
2 0
3 0
4 0
5 0
0 1 2 3 4 5
10. Analysis?
Time toleranceCost toleranceException report
Copyright @ 2011. All rights reserved
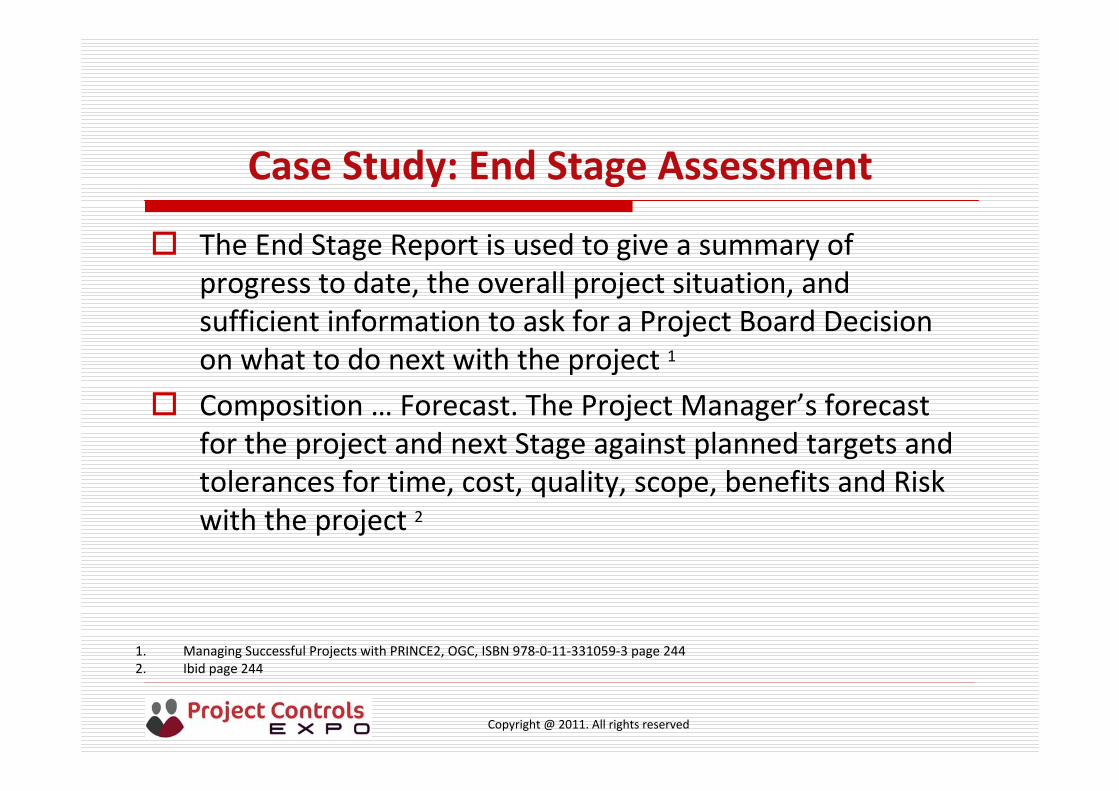
Case Study: End Stage Assessment
The End Stage Report is used to give a summary of progress to date, the overall project situation, and sufficient information to ask for a Project Board Decision on what to do next with the project 1
Composition … Forecast. The Project Manager’s forecast for the project and next Stage against planned targets and tolerances for time, cost, quality, scope, benefits and Risk with the project 2
1. Managing Successful Projects with PRINCE2, OGC, ISBN 978‐0‐11‐331059‐3 page 2442. Ibid page 244
Copyright @ 2011. All rights reserved
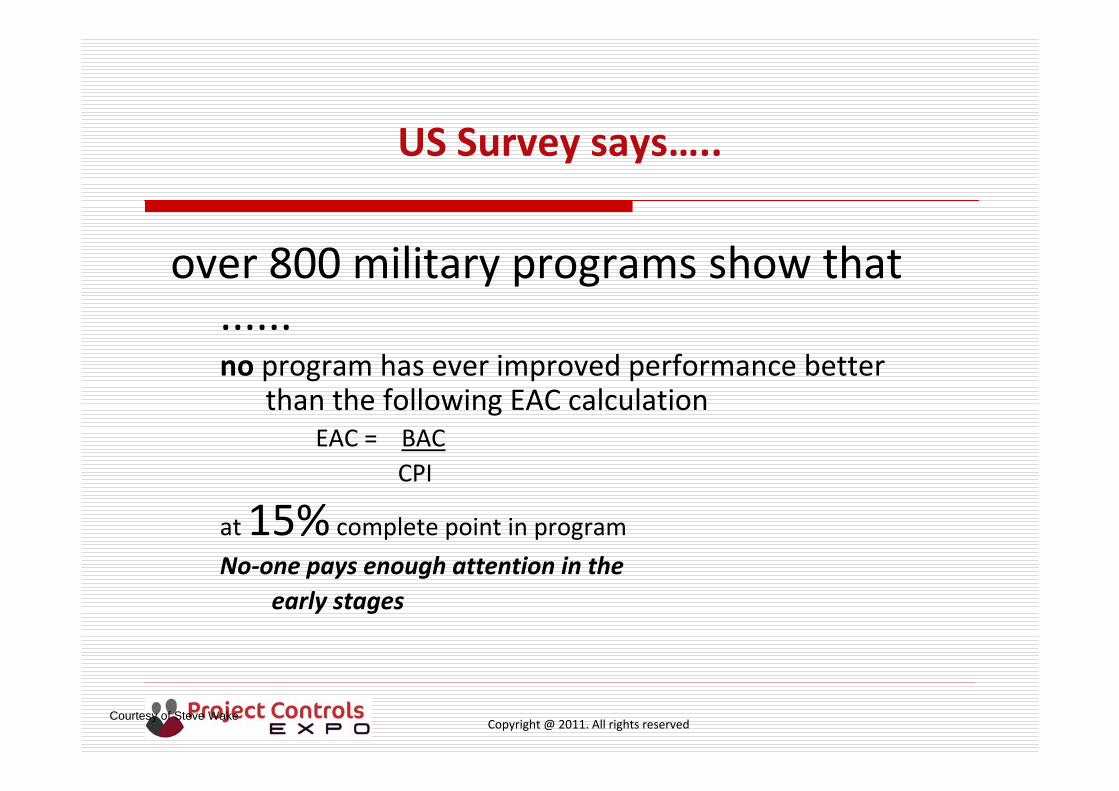
US Survey says…..
over 800 military programs show that ......no program has ever improved performance better
than the following EAC calculationEAC = BAC
CPI
at 15%complete point in program
No‐one pays enough attention in theearly stages
Courtesy of Steve Wake
Copyright @ 2011. All rights reserved
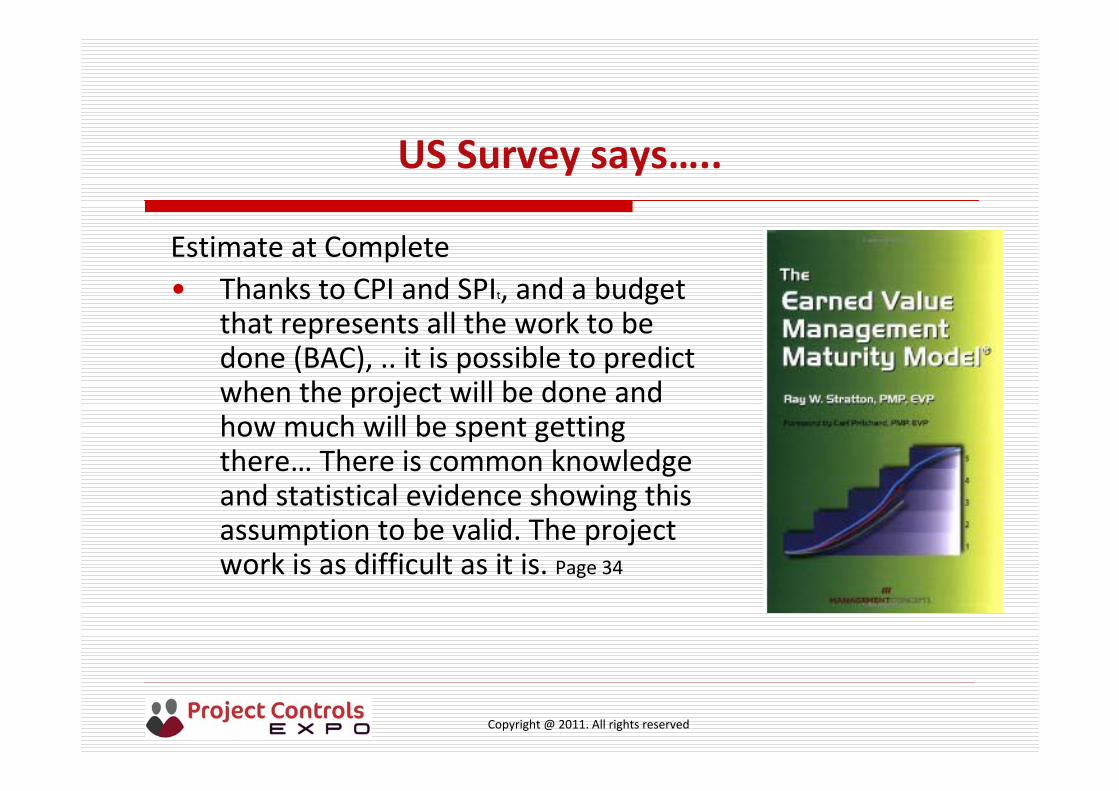
US Survey says…..
Estimate at Complete• Thanks to CPI and SPIt, and a budget
that represents all the work to be done (BAC), .. it is possible to predict when the project will be done and how much will be spent getting there… There is common knowledge and statistical evidence showing this assumption to be valid. The project work is as difficult as it is. Page 34
Copyright @ 2011. All rights reserved
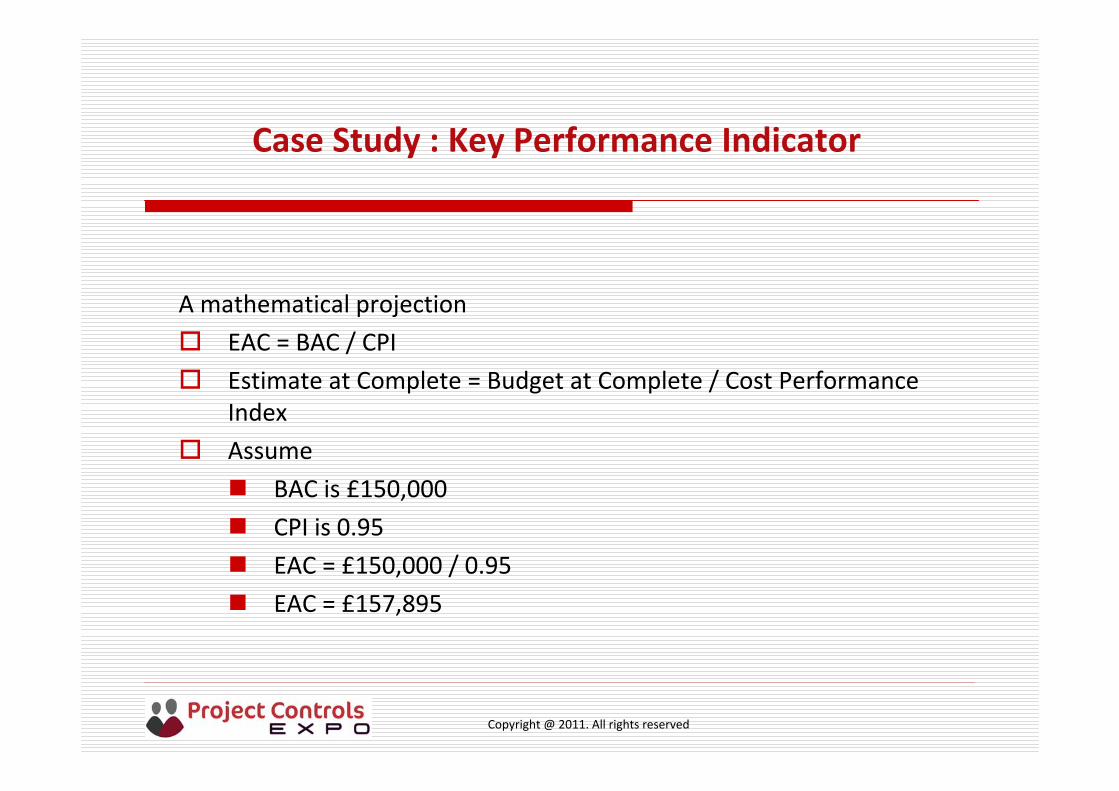
Case Study : Key Performance Indicator
A mathematical projection
EAC = BAC / CPI
Estimate at Complete = Budget at Complete / Cost Performance Index
Assume
BAC is £150,000
CPI is 0.95
EAC = £150,000 / 0.95
EAC = £157,895
Copyright @ 2011. All rights reserved
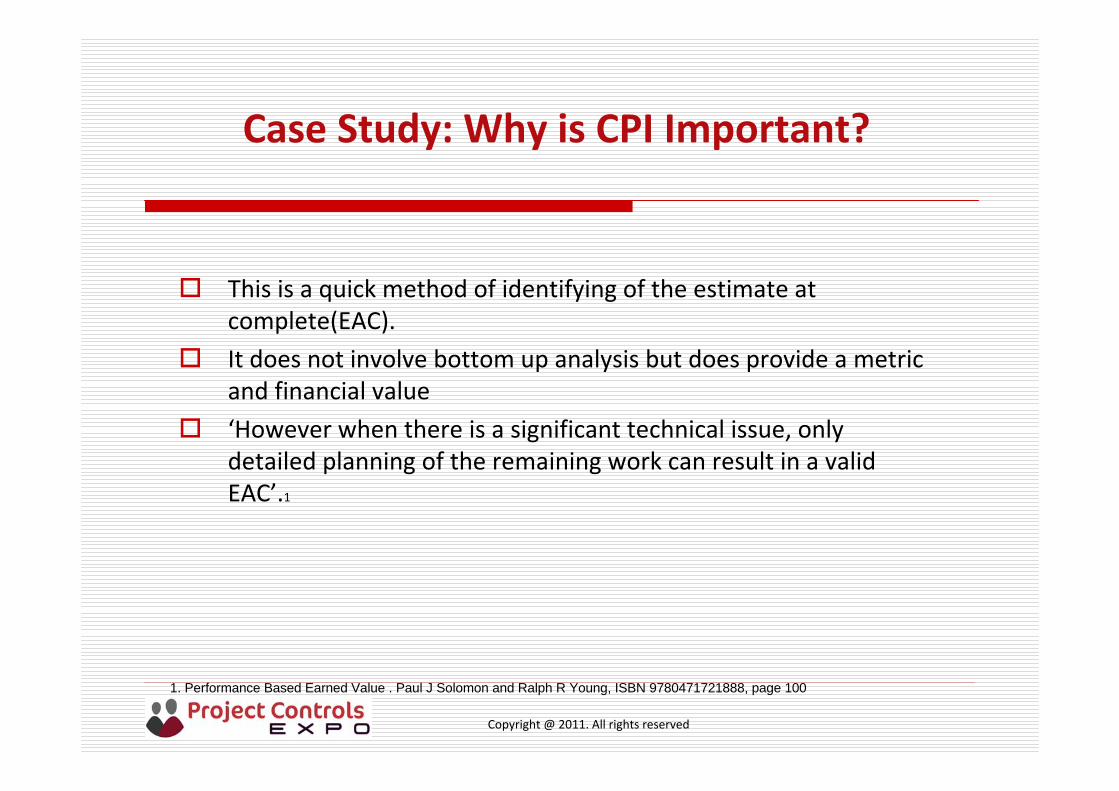
Case Study: Why is CPI Important?
This is a quick method of identifying of the estimate at complete(EAC).
It does not involve bottom up analysis but does provide a metricand financial value
‘However when there is a significant technical issue, only detailed planning of the remaining work can result in a valid EAC’.1
1. Performance Based Earned Value . Paul J Solomon and Ralph R Young, ISBN 9780471721888, page 100
Copyright @ 2011. All rights reserved
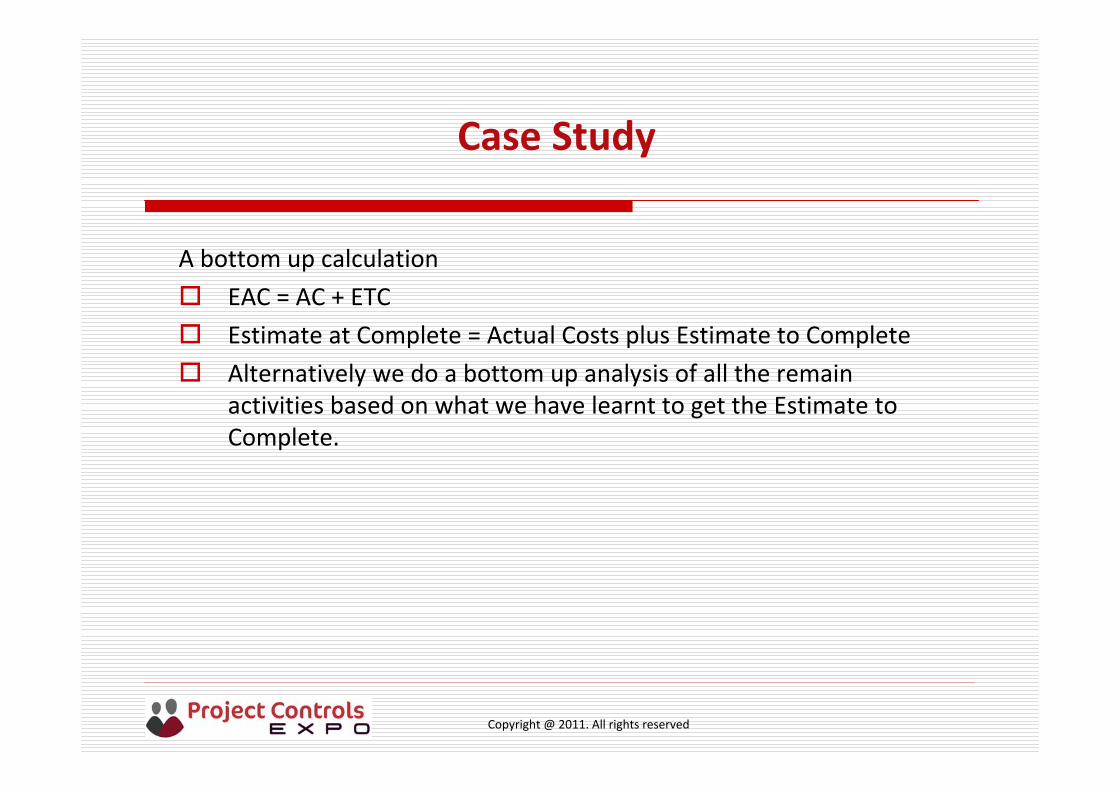
Case Study
A bottom up calculation
EAC = AC + ETC
Estimate at Complete = Actual Costs plus Estimate to Complete
Alternatively we do a bottom up analysis of all the remain activities based on what we have learnt to get the Estimate to Complete.
Copyright @ 2011. All rights reserved
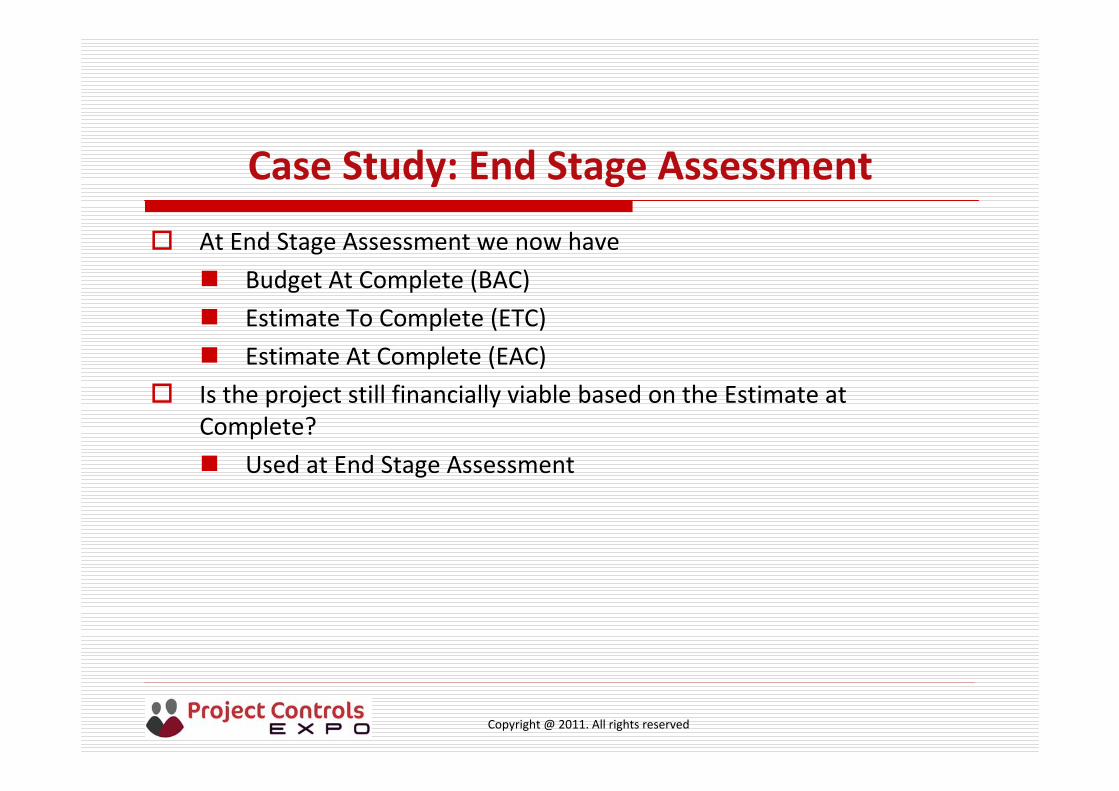
Case Study: End Stage Assessment
At End Stage Assessment we now have
Budget At Complete (BAC)
Estimate To Complete (ETC)
Estimate At Complete (EAC)
Is the project still financially viable based on the Estimate atComplete?
Used at End Stage Assessment
Copyright @ 2011. All rights reserved
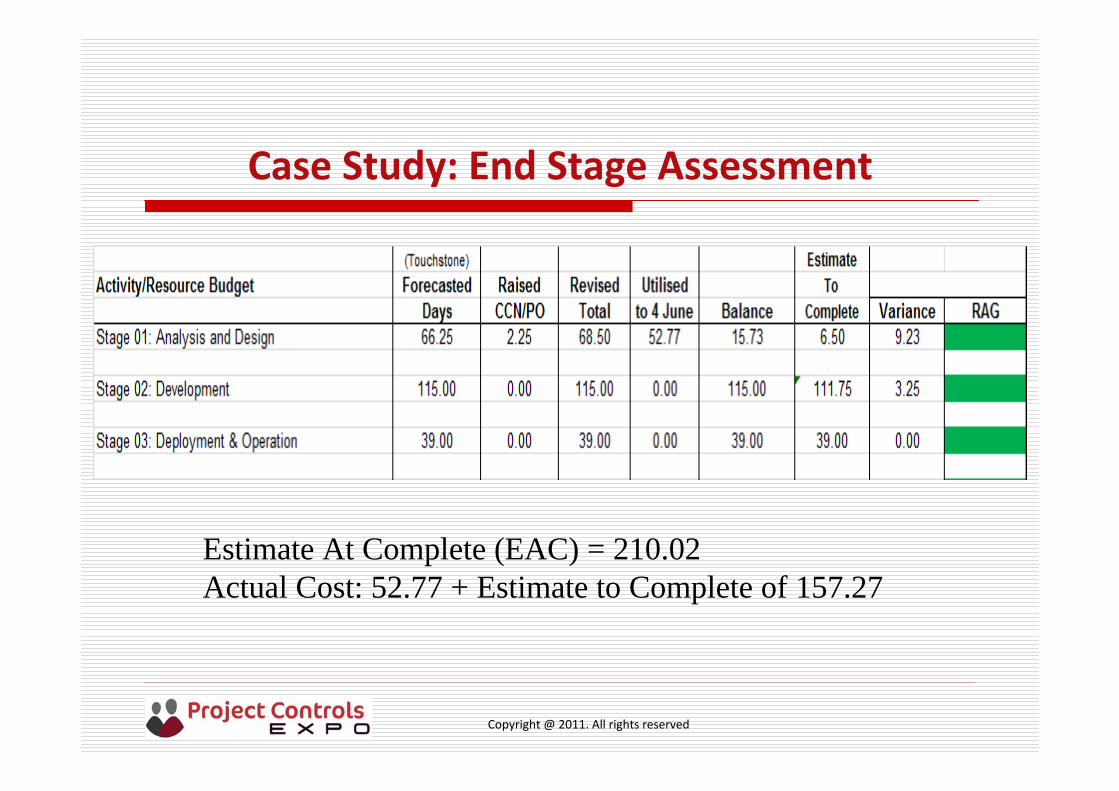
Case Study: End Stage Assessment
Estimate At Complete (EAC) = 210.02Actual Cost: 52.77 + Estimate to Complete of 157.27
Copyright @ 2011. All rights reserved
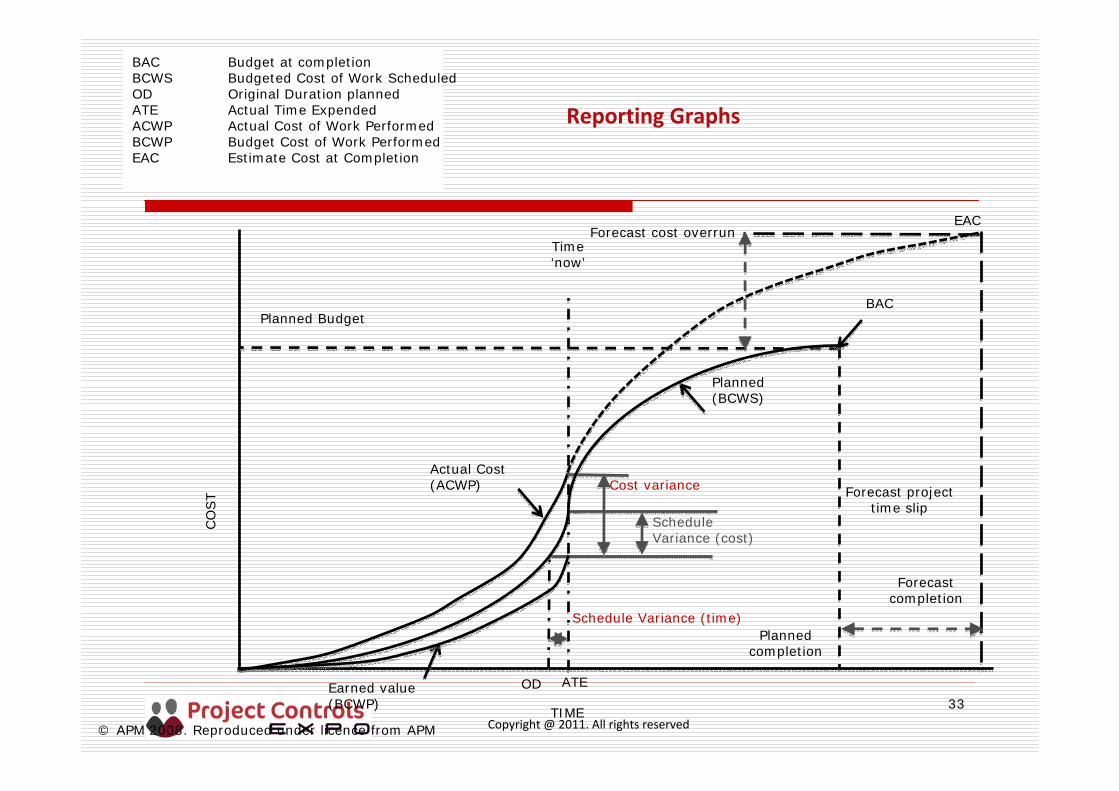
33
Reporting Graphs
TIME
CO
ST
Plannedcompletion
Planned BudgetBAC
Planned(BCWS)
EAC
Forecast projecttime slip
Actual Cost(ACWP)
Earned value(BCWP)
OD ATE
Forecast cost overrunTime‘now’
BAC Budget at completionBCWS Budgeted Cost of Work ScheduledOD Original Duration plannedATE Actual Time ExpendedACWP Actual Cost of Work PerformedBCWP Budget Cost of Work PerformedEAC Estimate Cost at Completion
Schedule Variance (time)
ScheduleVariance (cost)
Cost variance
Forecastcompletion
© APM 2008. Reproduced under licence from APM
Copyright @ 2011. All rights reserved
Book References
The Earned Value Management Maturity Model, Ray W Stratton, ISBN 1‐56726180‐9Earned Value Project Management, 3rd Edition, Quentin W Fleming and Joel M Koppelman, ISBN 193069989‐1EVA in the UK, Steve WakeAPM Body of Knowledge, 5th Edition, Association for Project Management, ISBN 1‐903494‐13‐3
Interfacing Risk and Earned Value Management, Association for Project Management, ISBN 1‐903494‐24‐9
The Mythical Man Month and Other Essays on Software Engineering, Frederick Brooks, ISBN 0201835959
‘Project and Programme Accounting, a practical guide for Professional Service Organisations and IT’, John Chapman, Project Manager Today Publications, ISBN: 1‐900391‐14
Earned Value Management using Microsoft Office Project, Sham Dayal, J.Ross Publishing, ISBN 978‐1‐932159‐98‐1
Work Breakdown Structures, The Foundation for Project Management Excellence, Eric S Norman, Shelly A Brotherton, Robert T Fried, Wiley, ISBN 978‐0470‐17712‐9
Performance Based Earned Value, Paul J Solomon, Ralph R Young, Wiley Interscience, ISBN 978‐0‐471‐721888
Copyright @ 2011. All rights reserved
Thank you to…
Steve [email protected]
Graham Williams [email protected]
John Chapman, Touchstone [email protected], Tel: +44 (0) 7973 108 426
John Flaherty, OTC [email protected]
Alex Davis, MOD [email protected]
… and members of the EVM SIG