Embed Size (px)
Citation preview

GLOBAL CITIES INITIATIVEA J O I N T P R OJ ECT O F B R O O K I N GS A N D J P M O R GA N C H AS E
Washington, DC / November 5, 2015Metropolitan Policy Programat BROOKINGS

Source: Brookings analysis of Moody’s Analytics and Brookings Global Metro Monitor
Greater Washington’s economy is strong
3.2 million jobs5th largest metro in the US50th largest metro in the world
$403.6 billion6th largest metro in the US14th largest metro in the world
DC
PRINCEGEORGE’S
CALVERT
CHARLES
PRINCEWILLIAM
FAIRFAX
MONTGOMERY
FREDERICK
LOUDOUN
JEFFERSON
CLARKE
WARREN
FAUQUIER
CULPEPPERSTAFFORD
SPOTSYLVANIA

Greater Washington’s economy is strong
METRO AREAMETRO AREA OUTPUT OUTPUT/WORKER
1 New York $1,071 b $174,798
2 Tokyo $736 b $93,227
3 Los Angeles $592 b $172,284
4 London $500 b $89,604
5 Paris $484 b $118,053
6 Seoul-Incheon $370 b $69,632
7 Washington $367 b $156,9578 Chicago $359 b $133,021
9 Beijing $307 b $41,424
10 Moscow $301 b $94,949
Largest Business, Financial, Professional Services Economies
Source: Brookings analysis of data from Oxford Economies and Moody’s Analytics
DC
PRINCEGEORGE’S
CALVERT
CHARLES
PRINCEWILLIAM
FAIRFAX
MONTGOMERY
FREDERICK
LOUDOUN
JEFFERSON
CLARKE
WARREN
FAUQUIER
CULPEPPERSTAFFORD
SPOTSYLVANIA
Source: American Community Survey, 2013 Estimates
Greater Washington’s economy is strong
1.5x national median
household income
US
$52k
$90k
DC Metro
50% national poverty
rate
US
15.8%
8.5%
DC Metro
DC
PRINCEGEORGE’S
CALVERT
CHARLES
PRINCEWILLIAM
FAIRFAX
MONTGOMERY
FREDERICK
LOUDOUN
JEFFERSON
CLARKE
WARREN
FAUQUIER
CULPEPPERSTAFFORD
SPOTSYLVANIA

But the region’s economy is slow-growing
Source: Brookings Analysis of Moody’s Analytics GDP estimates
93rdGrowth in GDP 2010-2014 ranks
among top 100 metros
1
1.2
1.4
1.6
2008 2014 2020
Projected output growth
TOP 100METROS
DCMETRO
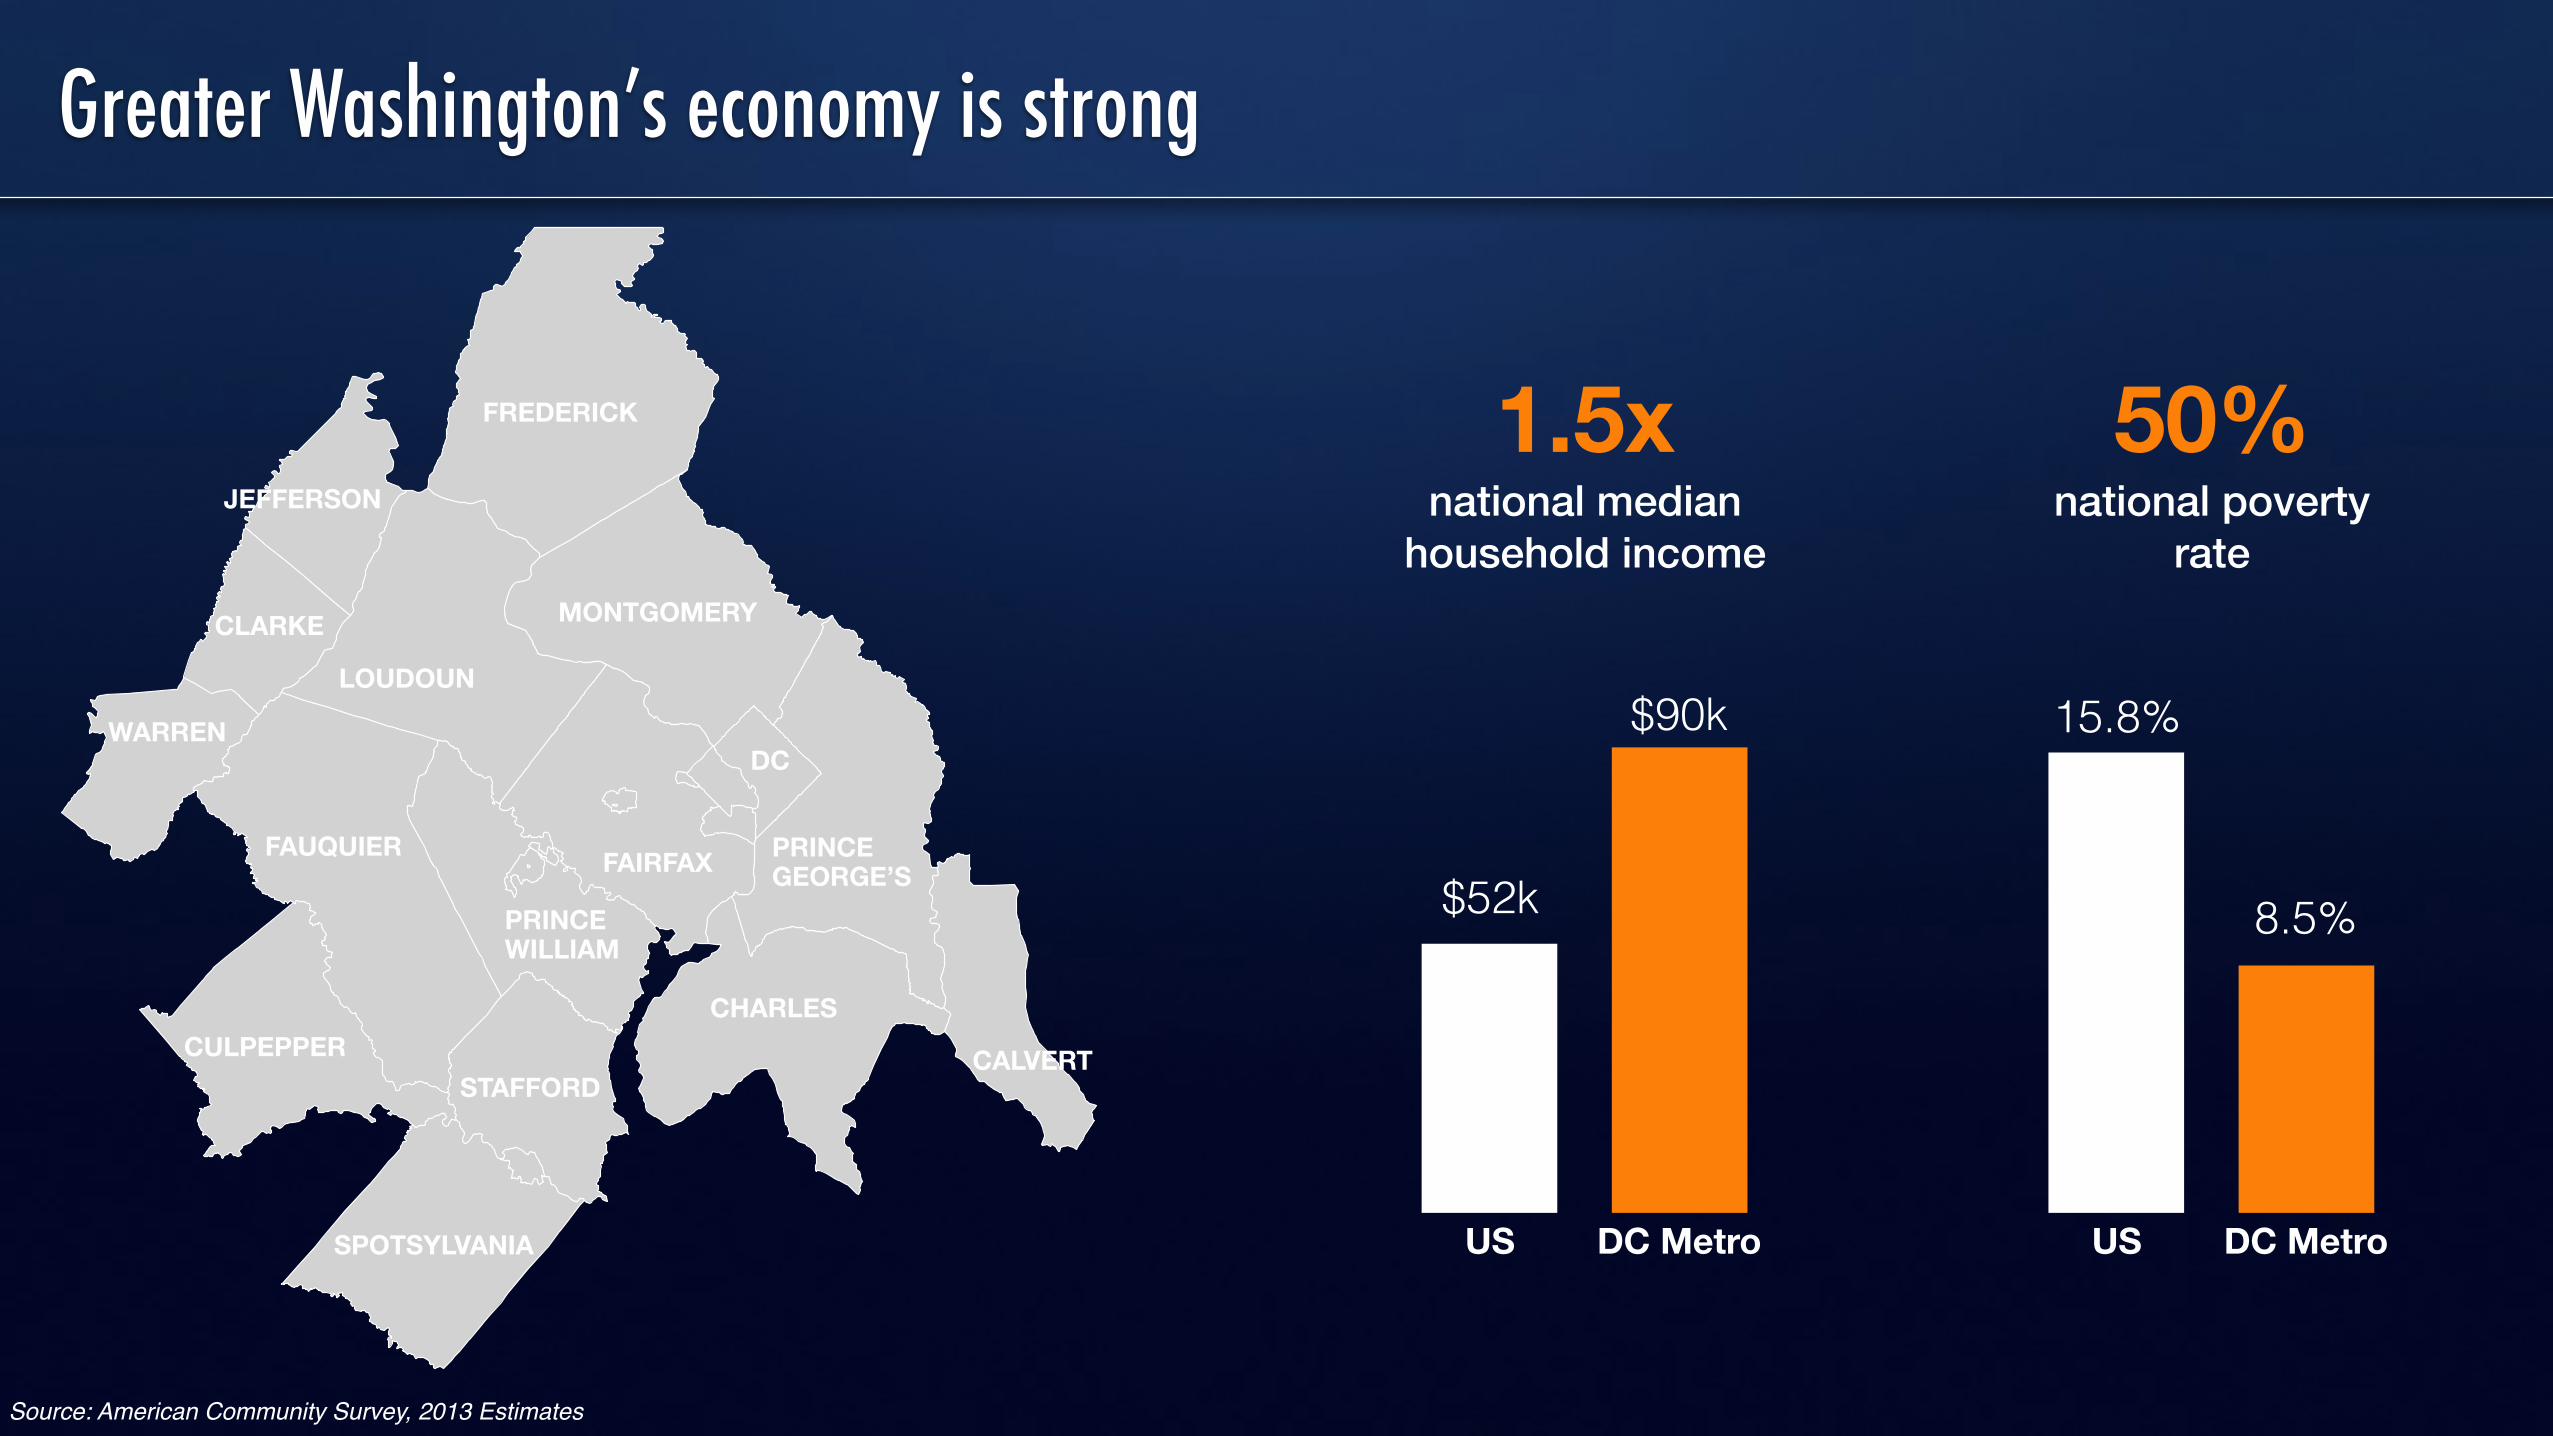
But the region’s economy is slow-growing and must diversify
FederalGovernment19%
Greater Washington Economy (2014)
Source: Brookings Analysis of Moody’s Analytics GDP estimates & USA Spending Data*includes Federal spending on contracts, grants, loans and other financial assistance
Federal Contractors19%
Manufacturing2%
OtherServices60%
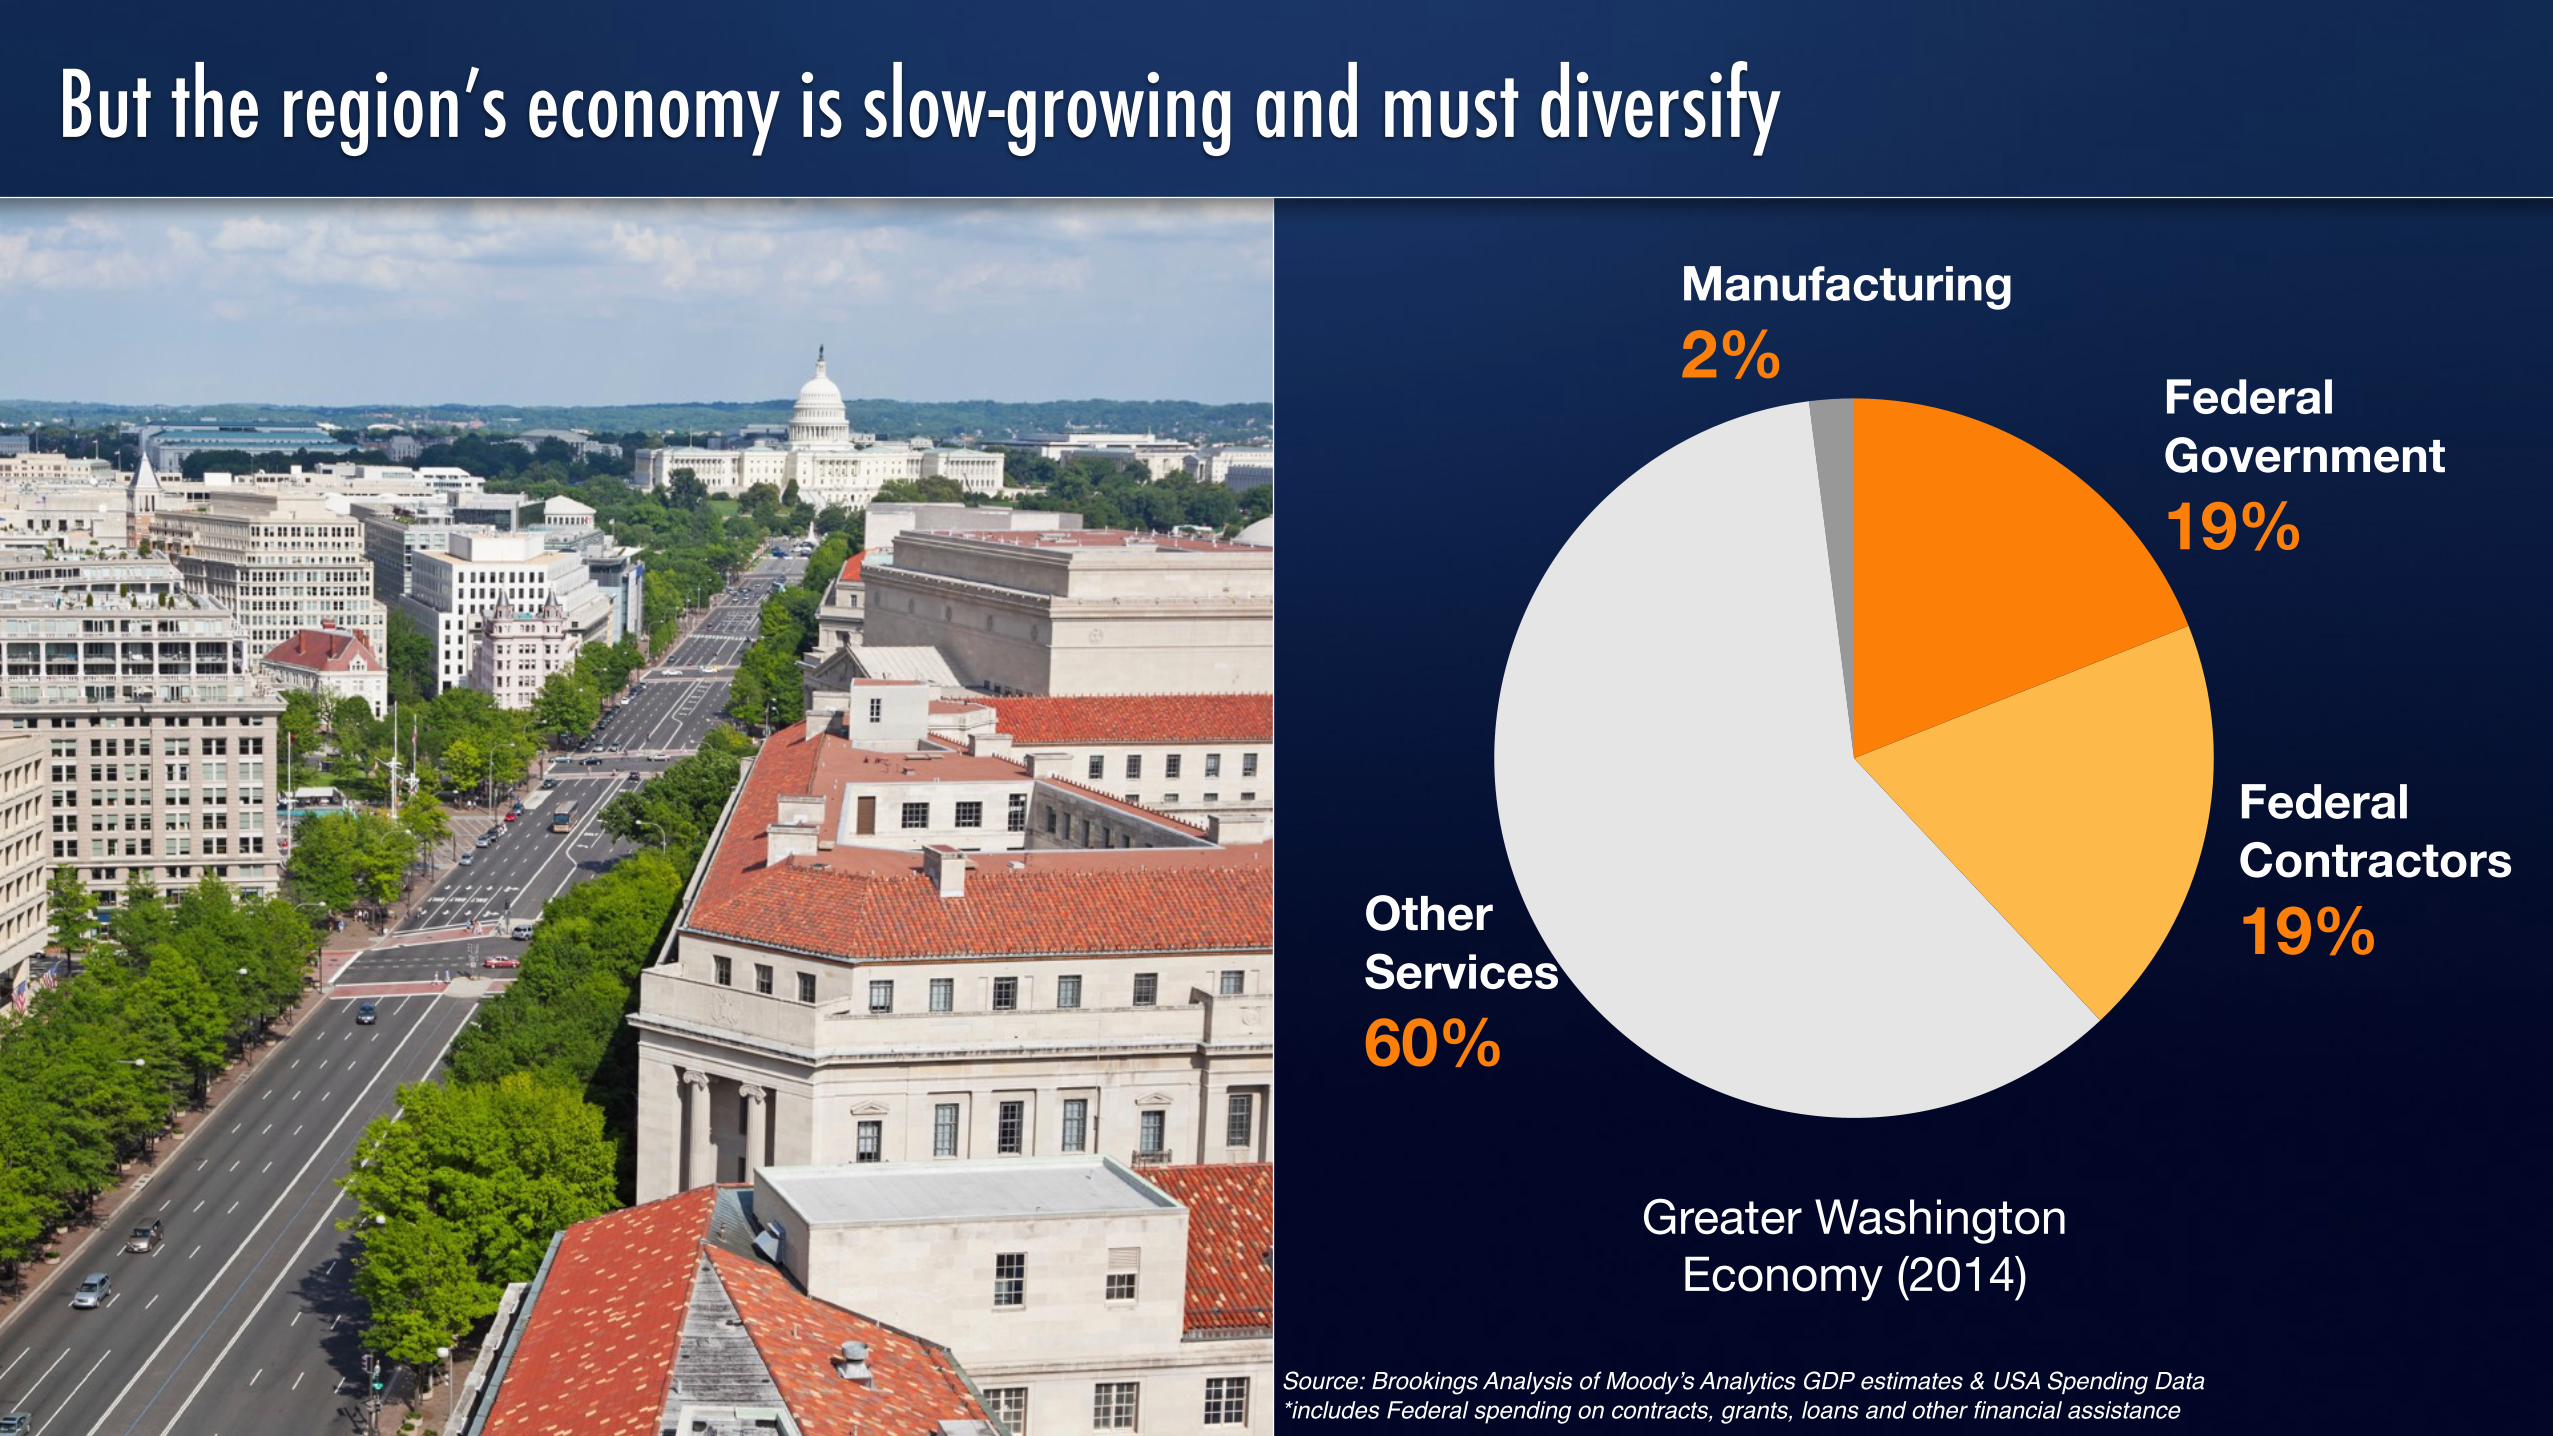
Why global engagement matters
How Greater Washington is faring
Lessons emerging from other metros
1 2 3
1
2
3

Why global engagement matters1
8
Advanced Industries
Global Engagement
Trade Investment

9
Global Engagement
Trade Investment
Advanced Industries

Pharmaceuticals
Medical EquipmentMotor Vehicles & Parts
Aerospace
Manufacturing35
Software Computer Systems Design
Telecommunications R&D Consulting Services
Services12
Oil & Gas Extraction
Electricity Generation
Energy
3
Advanced Industries

11
Advanced industries drive exports and innovation
Share of U.S. Totals
Source: Brookings Institution, forthcoming
PatentsGDP R&DJobs Exports
8.9%
17.9%
57.5%
81.2% 90.3%
Advanced Industries

12
Wages
$90,000 > $47,000average advanced
industry wageaverage wage
Skills
1 out of 2advanced industry jobs require less
than a 4-year degree
Advanced industries support high-paying jobs and mid-skilled work
Source: Brookings Institution, forthcoming
Advanced Industries

Advanced Industries
13
Global Engagement
Trade Investment

Source: World Economic Outlook, International Monetary Fund, 2015
Trade
1980
$3 trillion
$26 trillion
2012
The cross-border flow of goods, capital and services has
exploded in recent decades…
36%global GDP 86%
of global economic growth will occur outside the US from 2015 to 2020
Source: James Manyika and others, “Global flows,” McKinsey & Co., 2014
…and foreign markets will continue to drive global
economic growth

15
Trade
Share of GDP Growth
‘09-‘14
Share of Job Growth
‘09-‘14
Manuf. Trade Wage
Premium
Services Trade Wage
Premium
8.1%
20.0%
27.0%
17.0%
Exports are driving economic growth and wage gains
Sources: Moody’s Analytics; Brookings “Export Nation”; J. Bradford Jensen, “Global Trade in Services,” Petersen Institute for International Economics, 2011; David Riker, “Do Jobs in Export Industries Still Pay More?” ITA, 2010.
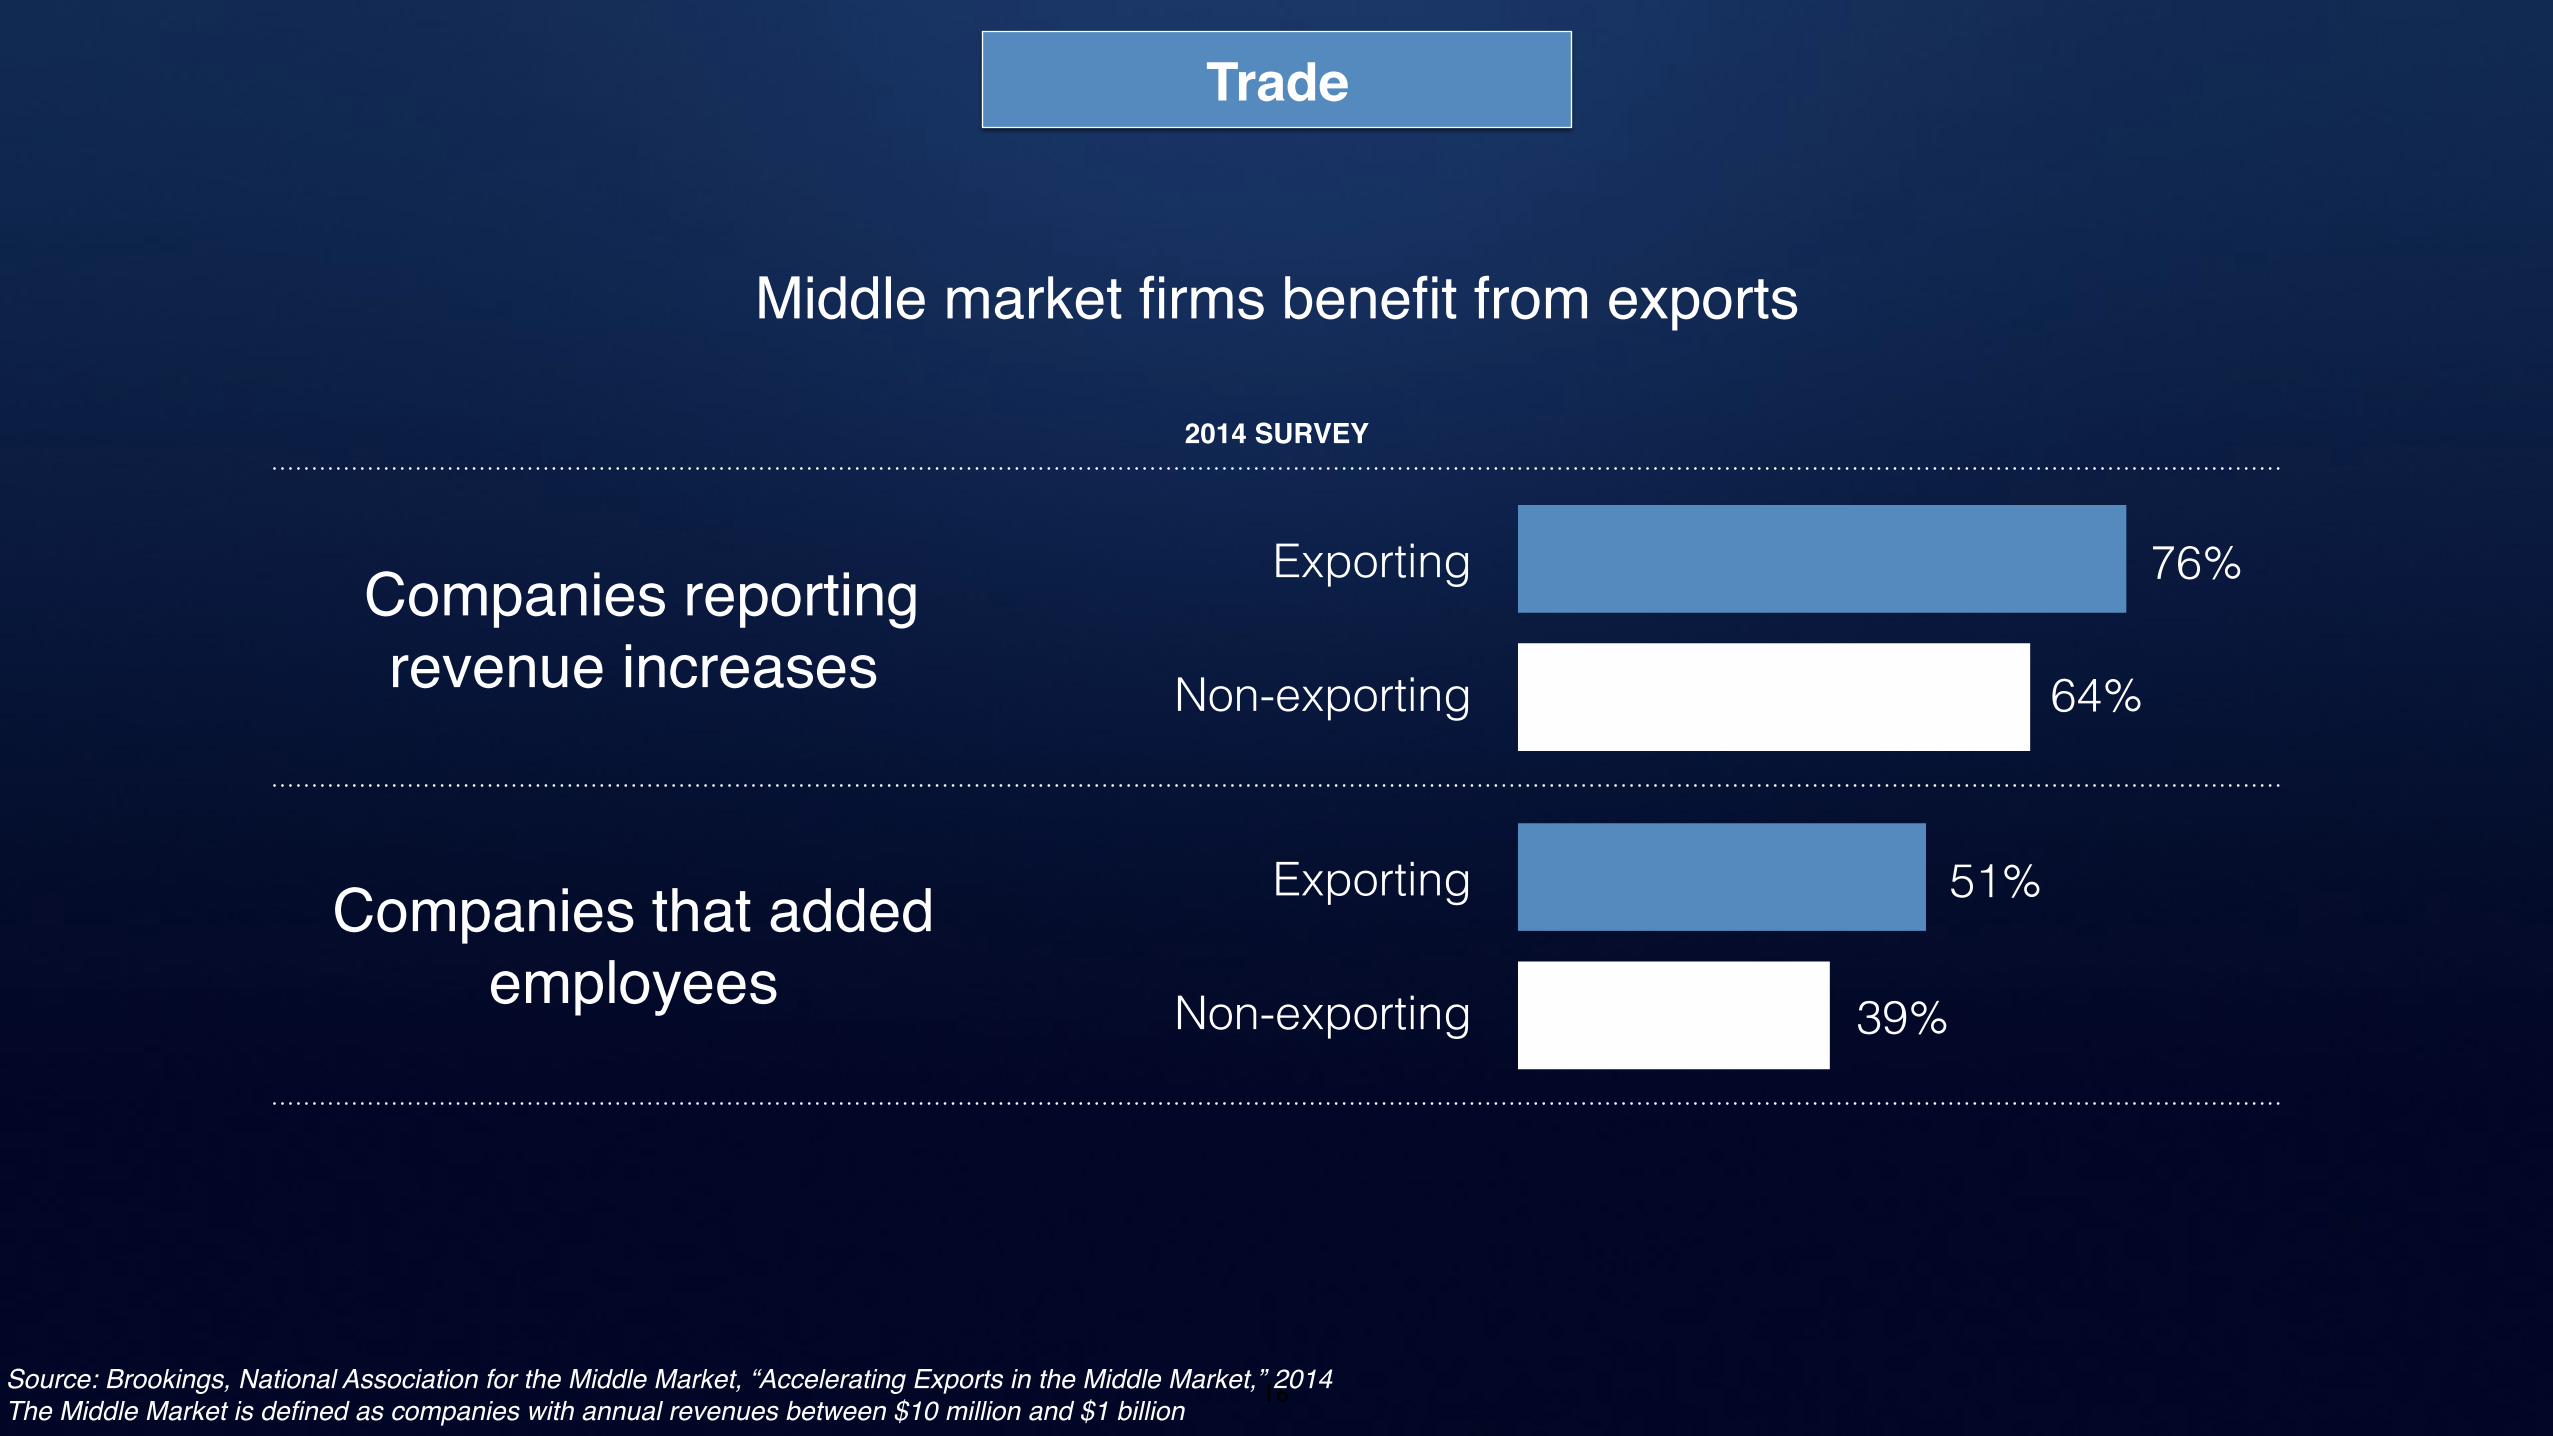
16Source: Brookings, National Association for the Middle Market, “Accelerating Exports in the Middle Market,” 2014The Middle Market is defined as companies with annual revenues between $10 million and $1 billion
Trade
Middle market firms benefit from exports
Companies reporting revenue increases
Exporting
Non-exporting
76%
64%
Companies that added employees
Exporting
Non-exporting
51%
39%
2014 SURVEY
Advanced Industries
17
Global Engagement
Trade Investment

Global investment flows are growing…but the US is losing market share
Source: UNCTAD
TradeInvestment
1984 1999 2012
$2 trillion
$1 trillion
Global
U.S.
Foreign Capital Investment, 1980-2012

19Source: Brookings, Bureau of Economic Analysis
Investment
5.6 millionemployees in foreign-owned firms, 2011
…and tend to pay higher wages
Average wages domestic firms
$77k
$60k
Average wages foreign-owned
firms
Foreign-owned firms employ millions of workers…

5.0%foreign-owned investment share of workers
Investment
20.3%foreign-owned investment share of goods exports
18.9%foreign-owned investment share of corporate R&D
They also punch above their weight on export and innovation
capacity
Source: Brookings, Bureau of Economic Analysis

How Greater Washington is faring2

22
Advanced Industries Trade Investment
Regional Indicators of Global Engagement
Advanced Industry Intensity &
Specialization
Patenting
Talent
Export Strength
Export Industry Specialties
Infrastructure
Foreign Investment
Intensity
Foreign Investment in
Advanced Industries

23
PEER METRO AREASPEER METRO AREAS ADVANCED INDUSTRY SHARE OF WORKFORCE (2014)
1 Seattle 15.9%
2 San Francisco 14.5%
3 Washington 13.5%4 Boston 13.4%
5 Austin 12.8%
6 San Diego 12.4%
7 Raleigh 12.2%
8 Baltimore 9.0%
9 Philadelphia 8.7%
10 Sacramento 6.4%
Computer Systems Design
39%
Management & Technical Consulting
23%
12%
R&D Services
11%
Agricultural & Engineering
A large share of the workforce is in Advanced Industries…
…spread across major employment sectors
Greater WashingtonAdvanced Industry Employment
(2014)Source: Brookings analysis of Moody’s Analytics data and USA Spending data
Advanced Industries

24
GREATER WASHINGTONCOUNTY OR CITY
ADVANCED INDUSTRY
EMPLOYMENT
Fairfax & Falls Church (VA) 148,550
District of Columbia (DC) 71,650
Montgomery County (VA) 68,980
Arlington County (VA) 39,230
Loudoun County (VA) 23,730
Prince George’s County (MD) 23,040
Alexandria City (VA) 16,390
Prince William & Manassas Park (VA) 13,690
Frederick County (MD) 10,520
Advanced Industries are present throughout the Greater Washington region
Source: Brookings analysis of Moody’s Analytics data
Advanced Industries

25
But Advanced Industries in this region are reliant on the Federal Government
Federal Government
Exxon Mobil Research
Georgetown University
Avicode Inc.
The Boeing Co.
Medimmune Inc.
Verisign
Amazon Tech Inc.
Henry M Jackson Foundation
Canon U.S. Life Sciences Inc.
150 300 450 600patents, 2008-2014
Top Patenting OrganizationsGreater Washington
FederalGovernment
64%
Share of Advanced Industry Revenue from Federal Contracts
Greater Washington
Sources: Brookings analysis of Moody’s Analytics and USA Spending data, OECD REGPAT Database, PCT Patents
Advanced Industries

26Source: American Community Survey, 2013 Estimates
1.5x population
Bachelor’s degree attainment rate
US
30%
49%
DC Metro
1.4x immigrant
Bachelor’s degree attainment rate
US
29%
42%
DC Metro
A highly educated workforce… …but employers have a hard time filling STEM jobs
Source: Brookings, Still Searching: Job Vacancies and STEM Skills
Washington, DC
San Francisco, CA
Baltimore, MD
Boston, MA
Austin, TX
Seattle, WA
Philadelphia, PA
Raleigh, NC
Sacramento, CA
San Diego, CA
5 10 15 20
median duration of STEM job listings
days
PEER METRO AREAS
Advanced Industries

Source: American Community Survey, 2013 Estimates
1.5x population
Bachelor’s degree attainment rate
US
30%
49%
DC Metro
1.4x immigrant
Bachelor’s degree attainment rate
US
29%
42%
DC Metro
A highly educated workforce… …yet low representation of foreign students
Source: Brookings Geography of Foreign Students
Advanced Industries
Boston, MA
San Francisco, CA
San Diego, CA
Seattle, WA
Durham, NC
Washington, DC
Philadelphia, PA
Austin, TX
Baltimore, MD
Sacramento, CA
F1 visas approved per 1,000 students
70
PEER METRO AREAS
35

$6.8 b
$4.4 b
$3.4 b
$2.7 b
$1.9 b
Travel & Tourism
Technology
Management & Legal
Royalties
Finance
28
Trade
$27 billionGreater Washington exports
13thlargest export economy in the United States
A leading export economy…
Source: Brookings, Export Nation
…powered by service industries

…yet it punches below it’s weight in export intensity
29
Trade
$27 billionGreater Washington exports
13thlargest export economy in the United States
A leading export economy…
Source: Brookings, Export Nation
95thgreatest export intensity in the United States
6.1%share of GDP in exports

30Source: Sabre Global Flights
LondonToronto
ParisSan Juan
BeijingSeoul-Incheon
Frankfurt am MainTokyo
Mexico CityRome
0 250 500 750 1000
Origin-Destination Passengers (thousands)
Trade
San Francisco
BostonSeattle
PhiladelphiaSan DiegoBaltimore
RaleighAustin
Sacramento
International Origin-Destination Passengers (millions)
Washington DC
160 8
A major aviation center… …with strong global connectionsPEER METRO AREAS

31Source: Brookings FDI in US Metros
Investment
US
5.0%5.4%
DC Metro
Above-average FDI jobs share…
34thhighest FDI jobs share in the United States 50th
in the United States
24%of FDI jobs in Advanced Industries
…but low Advanced Industries share of FDI

3 Lessons emerging from other metros

State and local leaders need to focus on the real sources of job growth
1.9%job creation from firm
attraction
98.1%job creation from firm expansion & startups
Sources: Brookings analysis of NETS data

AtlantaBaltimoreCharlestonChicagoColumbusDes MoinesFresnoHoustonIndianapolisJacksonvilleKansas CityLouisville-LexingtonLos AngelesMilwaukee
Minneapolis-St. PaulPhiladelphiaPhoenixPortlandSacramentoSalt LakeSan AntonioSan DiegoSeattleSt. LouisSyracuseTampa BayUpstate SCWichita
GLOBAL CITIES INITIATIVEA Joint Project of Brookings and JP Morgan Chase
Metro areas are pioneering global trade and investment strategies

35
Greater Portland: Targeting under-exporting firms and industries
Goal: Double Regional Exports Maintain the region’s competitive advantage through a heightened focus on cluster development, trade and innovation.
Computers & Electronics
Research: 67 percent of region’s total exports
Strategy: Maintain advantage, boost secondary exports, fill supply chain gaps
We Build Green Cities
Research: Portland has an international reputation for sustainability
Strategy: Brand and market Portland’s global edge in key clusters
Target Under-Exporters
Research: Company surveys reveal lack of proactive export strategies
Strategy: Provide case management to 10-15 mid-sized under-exporters

It’s time for Greater Washington to act like the economic power that it is

GLOBAL CITIES INITIATIVEA J O I N T P R OJ ECT O F B R O O K I N GS A N D J P M O R GA N C H AS E
Washington, DC / November 5, 2015Metropolitan Policy Programat BROOKINGS