Embed Size (px)
Citation preview
WORLD BANK ENERGY EFFICIENT CITIES INITIATIVE - RAPID ASSESSMENT FRAMEWORK
EECI RAF
EECI RAF FIELD TESTING AND VALIDATION FINAL CITY REPORT
30 APRIL 2010

EECI RAF FIELDTESTING AND VALIDATION FINAL CITY REPORT
EECI RAF
QUEZON CITY ENERGY EFFICIENCY RAF
4
EECI RAF
Executive Summary
1. Introduction2. Background to The EECI Rapid Assessment Framework and Field Test and Validation in Quezon City3. Current Energy Performance in Quezon City4. Identifying Priority Sectors5. Energy Effi ciency Recommendations6. Implementing Energy Effi ciency Recommendations7. Findings / Lessons Learned from the Quezon City Mission
Appendix: ● Quezon City Meeting Schedule
● Quezon City Key Performance Indicators
● Recommendation Selection Appraisal
Contents
5
Executive Summary
The Quezon City Energy Effi ciency Report documents the fi ndings from a two week study of energy use and effi ciency opportunities during February 2010. The study was undertaken as part of a wider program of work commissioned by the World Bank’s Energy Sector Management Assistance Program (ESMAP) to fi eld test and validate an early version of the Energy Effi cient Cities Initiative Rapid Assessment Framework (RAF). The RAF is a novel tool that quickly diagnoses ineffi cient energy performance across a city’s systems and offers a range of potential solutions embedded within implementation guidance and case studies. The study therefore had two objectives: to provide Quezon City Government (QCG) with recommendations to improve energy performance and to validate and test the RAF.
Quezon City’s current energy performance across the buildings, public lighting, transport, power and heat, water and waste water, and waste sectors were reviewed against the performance of a range of peer cities through a benchmarking process. This review provided a number of signifi cant fi ndings which helped focus activity during the early part of study and contribute to the defi nition of priority sectors for further study. Principal fi ndings included: high electricity use per capita; high patronage of public transport, but equally very high energy consumption by public transport, low city-wide energy use on public lighting (although this was later found to be a major component of QCG energy expenditure), and high water consumption per capita.
During the early part of the study, interviews were held with a range of QCG departmental personnel and representatives from a range of city agencies. Information gathered during this period enabled a classifi cation of each sector based upon the degree of control exerted by the QCG, the potential for energy savings in the sector and relative spend on energy in each sector. On the basis of these fi ndings, a sector prioritisation process was undertaken. Although this process is subject to further and ongoing development, the analysis concluded that the transport, buildings and public lighting sectors were priority sectors for further investigation; however, as the study also had the objective of validating
the RAF, all sectors were reviewed further during the course of the mission.
The latter part of the study involved further interviews and site visits. These enabled detailed systematic fi ltering of all of the RAF energy effi ciency recommendations currently contained within the RAF to examine their suitability in Quezon City. This process demonstrated that a large number of recommendations were:
• either likely to be technically and/or fi nancially unviable;
• outside of the direct control of the QCG; or
• already being implemented or trialled.
The review established that there is considerable sectoral energy effi ciency activity taking place in Quezon City currently. Public lighting programs include audit and retrofi t, new design guidance, and the trialling of new lighting technologies. In the buildings sector, a new green building code is in place, and Quezon City is currently undergoing a detailed buildings energy effi ciency program sponsored by the World Bank. The privatised water companies seemed particularly adept at managing energy use and considered energy effi ciency as a central component of their ongoing effi ciency programs. QCG has no jurisdiction over the supply of power and heat and no recommendations were found to be suitable in this sector. In the waste sector, collection and transportation is contracted out to third parties and no fi nancially viable recommendations were considered practicable at this point. Good practice with respect to wastes management was observed with neighbourhood waste recovery taking place at Barangay level and, at the larger scale, a landfi ll gas capture and energy generation project at the Payatas landfi ll site. Transport, the major city-wide energy consumer, is proving diffi cult to control by QCG. Much of the transport sector is either under private ownership (jeepneys and tricycles), licensed by national authorities or in the case of infrastructure,
6
EECI RAF
planned and developed at a metropolitan level.
Most of the activities currently underway in Quezon City were successfully identifi ed by the RAF, although not pursued further due to their ongoing nature.
Of the energy effi ciency recommendations currently incorporated into the RAF, eight were deemed a high priority for Quezon City. These covered the water, buildings, and transport sectors, as well as improvements to current procurement processes, investment programs and the administration of energy effi ciency activities across QCG departments. These are as follows:
Municipal fleet maintenance program: The fl eet maintenance program was selected because there are 850 vehicles owned and maintained directly by Quezon City government and, currently, there is no existing maintenance procedure specifi cally focused on fuel effi ciency.
Engine efficiency improvement program: This program applies to the 17,000 tricycles in Quezon City that would benefi t from an engine replacement program. As Quezon City is the sole regulator for franchised tricycles, the Mayor has complete control to legislate and enforce this program. Tricycles with replacement engines will result in lower operational costs for owners and cleaner air for the residents of Quezon City.
Walking / Cycle path development program: The walking and cycle path program was selected due to the high mode split of walking and cycling (21%) and the observed limited number of dedicated cycle lanes. A goal of 10km of new bike paths per year for the next 4 years would be achievable and increase the safety, total length, access to and integration of bike paths.
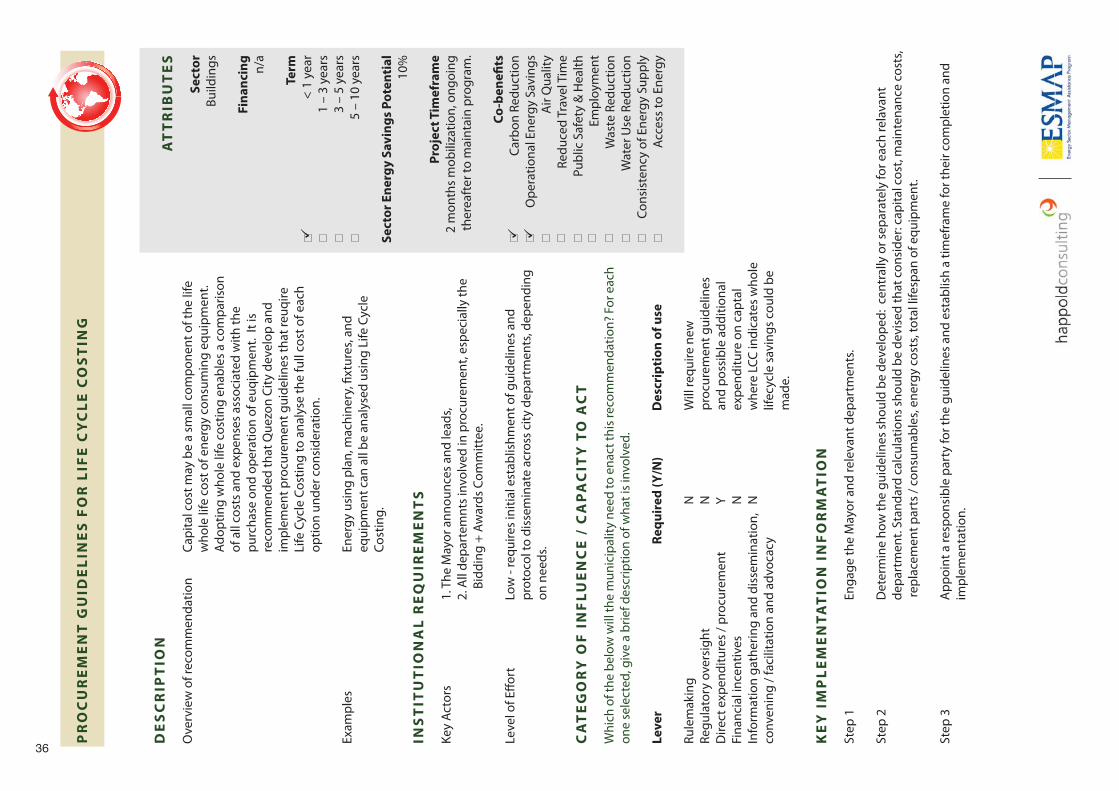
Procurement guidelines for life cycle costing: This recommendation requires changes to existing procurement processes for buildings and capital equipment to incorporate whole life costing (i.e. capital and operational expenditure) rather than just capital expenditure. The current procurement processes in Quezon
City tend to discourage the selection of energy effi cient systems installation in new construction and major renovations.
5 year capital planning for energy efficiency retrofits: This requires the development and approval of a fi ve year planning strategy for upgrading existing QCG buildings. This requires incorporation into the annual budget to provide for expenditure on building renovation. Such a long-term plan can be used to attract energy effi ciency funding or capital funds to realize the many opportunities Quezon City has for energy effi ciency.
Water Infrastructure Planning: This recommendation relates to QCG support to Manila Water and Maynilad to locate critical water infrastructure equipment in the most energy-effi cient locations. Electricity costs for pumping water are over 15% of the total operational costs for both Manila Water and Maynilad, which is their second largest operational expense after staff costs.
Energy Efficiency Task Force: The Mayor’s Task Force on Energy Effi ciency is an important recommendation because it allows for a central driving force to focus the city’s efforts on energy effi ciency in one team, enabling prioritization of efforts and resources according to the highest opportunity and lowest costs
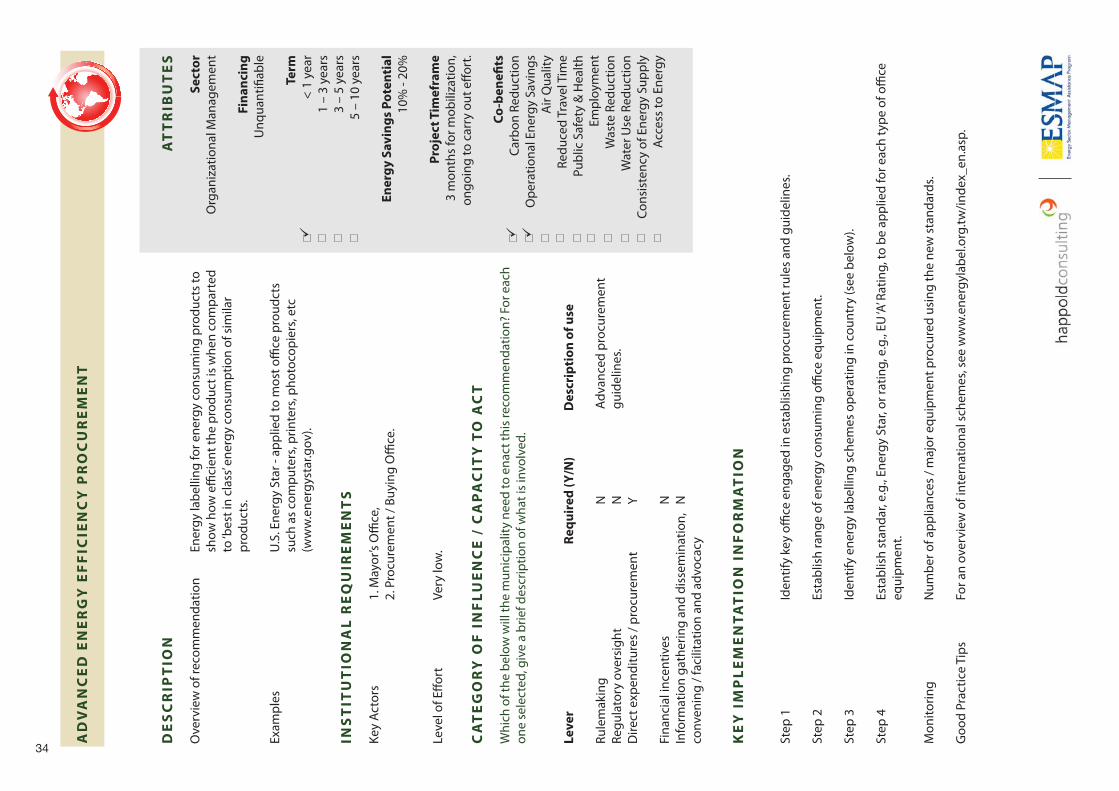
Advanced Energy Efficiency Procurement: This recommendation requires the introduction of procurement guidelines to support energy performance labelling and standards for smaller purchases such as computers and fax machines.
These energy effi ciency proposals are supported by ‘Recommendation’ sheets providing the requisite information to enable the Quezon City government implement each measure and monitor its progress.
With respect to the second objective of the mission, the fi eld testing and validation of the RAF, the team learned a number of valuable lessons regarding both content and process that be usefully applied in its subsequent further development.
7
In summary the principal observations were as follows:
Pre-mission: Both data gathering and access to QCG representatives was particularly challenging pre-mission. This was due to a number of factors such as the granting of authorisation to access data, the availability of data, and the willingness of QCG representatives to meet with local consultants. This diffi culty highlighted the need in the design and implementation of the RAF to ensure that a clear and prescriptive approach to the pre-mission stage to be defi ned, with a number of purpose built communications measures and processes to ensure access to data and city authority staff. Equally, the data requirements for the baseline city report should be practical and achievable pre-mission.
Energy Performance Benchmarking: Energy performance benchmarking proved an excellent means to solicit engagement of the QCG representatives in the RAF process. The majority of data required for benchmarking was not available at the start of the mission which meant a restricted range of benchmarks were presented; however, these datasets were in existence and a full set of KPIs were collated during the course of the mission. Equally, the RAF database of city energy performance remains under development. In order to aid its future value it is essential that RAF candidate cities agree to ‘add’ their city data to the benchmarking database as a prerequisite to their acceptance as a RAF candidate.
Identifying Priority Sectors: The identifi cation of priority sectors for further focus takes place after the consultant has had a brief period in which to assimilate information gathered. The Quezon City mission directed focus on the key factors in determining priorities: technical energy savings potential (gleaned from benchmarking results and the consultants views after site visits and interviews), proportionate use of energy in each sector (city-wide and within the city authority) and the level of control or infl uence exerted by the city authority. This poses a number of challenges for the further development of the prioritisation process which, inescapably, will rely on quantitative, qualitative
and contextual information.
The Quezon City Field test and validation exercise was enormously benefi cial to the further development of the RAF process and content. The process was greatly aided by the support of the Mayor and Vice Mayor and the time and effort provided to the consultant team by QCG representatives.
8
EECI RAF
This Quezon City Energy Effi ciency Report is the fi nal output of the World Bank’s Rapid Assessment Framework (RAF) fi eld testing and validation work in Quezon City during February 2010. It serves to bring together and build on all key information that was collated over the course of the RAF Team mission and provide direction for continued progress in this area.
The fi eld mission in Quezon City was designed to achieve two complimentary objectives:
1. Field test and validate the RAF process and components; and
2. Identify energy effi ciency opportunities across the RAF sectors and propose energy effi ciency measures that may be applied or followed by the Quezon City government.
This report concludes the second objective and formalises the recommendations presented to city offi cials on the fi nal day of the fi eld test. The report provides an overview of the RAF, a summary of the process undertaken and principal fi ndings and decisions made, and detailed recommendations that the Quezon City government can take forward.
The Quezon City Energy Effi ciency Report consists of four main sections that coincide with the schedule of activities undertaken before, during and after the fi eld test:
● Current Energy Performance in Quezon City: This section provides an overview of the data that has been collected for Quezon City energy use across the six primary RAF sectors. Quezon City energy data has been compared to a range of other peer cities to provide an indication of relative performance and highlight areas with signifi cant potential for improvement.
● Identifying Priority Sectors: This section details how each sector has been reviewed against other sectors in order to evaluate the relative potential for energy effi ciencies in each sector. Sectors are then prioritised accordingly and sectors with minimal energy effi ciency opportunity are disregarded. For the purposes of Quezon City fi eld test, sectors have been prioritized, but none has been removed.
● Energy Effi ciency Recommendations: The RAF tool contains energy effi ciency
recommendations for each of the six sectors. Potential energy effi ciency recommendations for Quezon City have been reviewed in the light of the comparative performance benchmarking for Quezon City and additional information provided by city offi cials through interviews and documented information. The fi nal recommendations are based upon this review, fi ltering out those that are not considered appropriate or workable at this time. The review includes an explanation of how each recommendation was assessed in light of the pre-mission analysis and information gathered during the mission.
Included in the appendix of this report are contained the following:
● Meeting schedule: The fi nal agenda for the 10 day mission.
● RAF Key Performance Indicators: A complete list of all RAF KPI data for Quezon City including source documentation.
● Recommendation Selection Appraisal: A Summary of the retaionale for selecting or rejecting each of the RAF recommendations.
A separate Annex to this main report contants the Background City Report: A pre-fi eld test report compiled using publicly available information relating to the institutional, contextual and energy performance in Quezon City.
1. Introduction

9
10
EECI RAF
The rapid urbanisation of developing countries over the last fi fty years has led to challenges in achieving environmental, social and economic sustainability. While cities in developing countries continue to face signifi cant environmental challenges, they remain the primary engines of economic growth. The challenge is thus to achieve economic growth while minimising it’s associated environmental externalities. In this context, improving energy effi ciency is essential.
However, the lack of city-specifi c, disaggregated data has been a major impediment to assessing the overall energy implications of diff erent urbanization patterns and to guiding improved energy, economic and environmental analysis, especially in cities of the developing world.
The Rapid Assessment Framework (RAF) is a central component of the Energy Effi cient Cities Initiative (EECI), launched by the Energy Sector Management Assistance Program (ESMAP) in collaboration with the Urban Anchor in 2008.
The purpose of the RAF is to identify technical and institutional measures that will improve the energy effi ciency of the municipal infrastructure across the following six sectors:
1. Transport2. Waste3. Water and Waste Water4. Power & Heat5. Public Lighting6. Buildings
The organizational management practices of the City Authority (CA) that span all of the sectors above are also considered.
The ultimate aim of the RAF is to identify ways in which energy effi ciency can be improved by the CA and therefore reduce their expenditure on energy. However, in some cases it is clear that there are city-wide activities that cut across all sectors. In such instances, the RAF process identifi es how these issues may be addressed through engagement, representation and other means.
At the inaugural workshop session of the EECI in Washington DC in October 2008, the requirement for a city-wide energy effi ciency rapid assessment framework was conceived. This workshop was attended by Secretary Enriques, senior advisor to Mayor Belmonte, representing Quezon City. In the spirit of collaboration and a shared wish to move the concept forward, Secretary Enriques signalled his willingness to help develop the RAF by off ering the ESMAP team the opportunity to fi eld test the concept framework in Quezon City.
The design of the RAF has been in development since September 2009. By February 2010 a well developed approach and many of the technical components had been produced. At this point in the design process a fi eld test or validation off ered essential insights that would enable both the RAF process and components to be refi ned and augmented where necessary.
The fi eld testing process took place over three discrete stages: pre-mission, mission and post-mission.
During the pre-mission phase two local consultants (Raymond Marques and Wilbert Billones) were commissioned to gather essential data and information that would provide an understanding of the institutional framework, energy performance and local context. This work is compiled into a Background City Report and is contained in the Annex to this report. The Background City Report enabled the international consultant, Happold Consulting International, to prepare the schedule and data requirements for meetings over the course of the fi eld visit and undertake energy performance benchmarking.
The RAF fi eld testing lasted two weeks and ran from 22 February 2010 to 5 March 2010. The mission was led by Robert Carr and Byron Stigge of Happold Consulting International. The mission was attended by Dr. Ranjan Bose of ESMAP and was coordinated by Eng. Jet of Quezon City Offi ce of the Building Offi cial. The schedule for the fi eld testing broadly followed the same order as the Report content. The majority of the fi rst week’s activity involved workshops, presentations, interviews and information review in order for the Consultant to gain a detailed overview of
2. Background to the EECI Rapid Assessment Framework (RAF) and Field Test in Quezon City
The Energy Effi cient Cities Initiative Rapid Assessment Framework Background to Field-testing the RAF in Quezon City
EECI RAF
11
energy effi ciency activities in each sector. The second week entailed more detailed interviews with personnel with relation to specifi c recommendations. During the course of the second week, sectors and recommendations were honed down to concentrate on those with greatest potential in Quezon City. Finally, at the end of the fi eld test, a presentation was given by the Consultant to the Vice Mayor Herbert Bautista and senior Quezon City Government (QCG) offi cials.
The fi nal ‘post-mission’ component of the RAF process is the culmination of all activities captured within a City Energy Effi ciency Report. The submission of this report thus completes the fi eld testing process.
Quezon City Government’s commitment to energy effi ciency is demonstrated by pockets of high achievement, however this is balanced by other areas in need for improvement. There is a Task Force to improve Street Lighting energy consumption, a Green Building Ordinance currently in development, a QC government building energy audit underway, and energy effi ciency pamphlets distributed to QC administrative buildings to educate staff on energy effi cient behaviour. The private commercial building sector is generally engaged in energy audits and retrofi ts. A district cooling plant is designed for the high tech hub in central QC. And CFL blubs are the dominant bulb type for non commercial lighting. Light rail and heavy rail connect some parts of Metro Manila and are powered by electricity.
Best practice design is certainly taking hold in QC, though this has not always been so. Old street lights have erratic spacing and lighting coverage and there still remain some metal halide street lighting lamps. Many offi ce buildings still have very high lighting power density and old, small, ineffi cient compressor chillers. Some lighting and A/C systems are grossly oversized further reducing their total system effi ciency. Building energy effi ciency in general can be described more in terms of needing higher quality of service: ventilation, A/C, lighting and computer use are all under-served currently and will inevitably increase in the coming years of economic expansion with a resultant increase in energy demand.
Water and power distribution systems throughout Quezon City did not raise any fl ags in terms of energy effi ciency. Both water companies and the electrical company are privately owned and have extensive infl uence and interaction with international best practice from Japan, Singapore and the US. Manila Water demonstrated keen attention to energy consumption issues and a pump replacement program. Meralco, the electrical service company, demonstrated energy effi ciency programs for commercial buildings and industrial users.
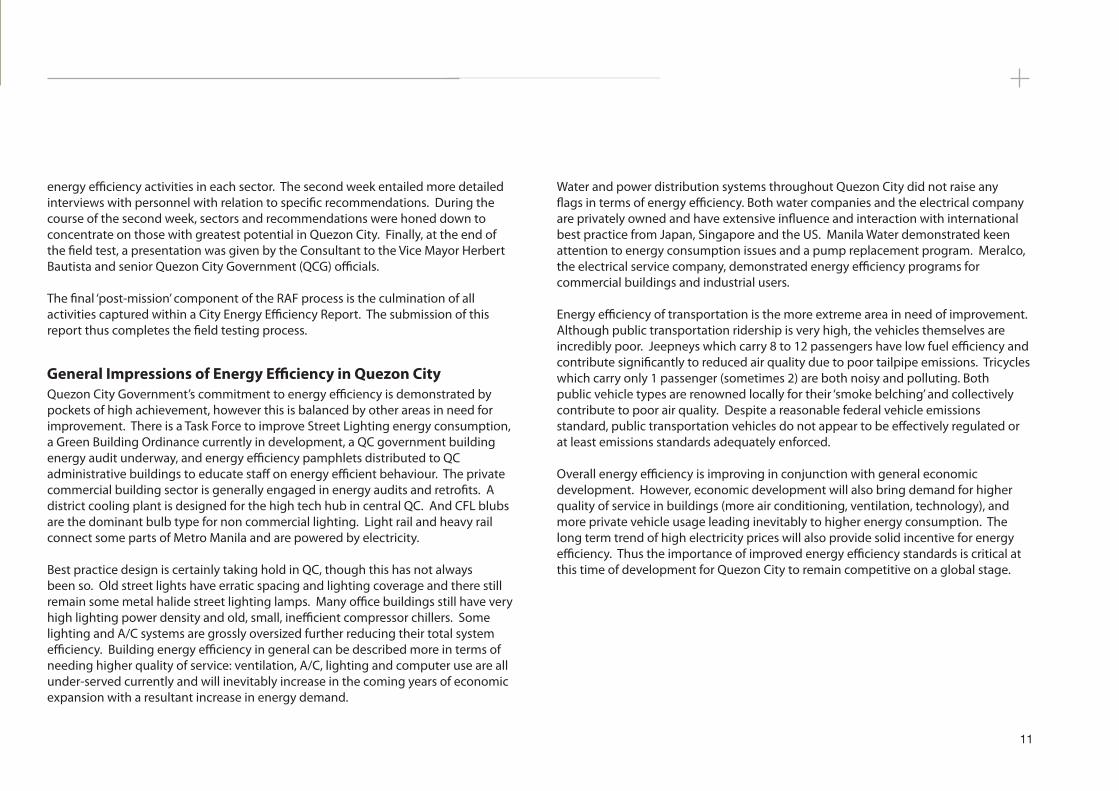
Energy effi ciency of transportation is the more extreme area in need of improvement. Although public transportation ridership is very high, the vehicles themselves are incredibly poor. Jeepneys which carry 8 to 12 passengers have low fuel effi ciency and contribute signifi cantly to reduced air quality due to poor tailpipe emissions. Tricycles which carry only 1 passenger (sometimes 2) are both noisy and polluting. Both public vehicle types are renowned locally for their ‘smoke belching’ and collectively contribute to poor air quality. Despite a reasonable federal vehicle emissions standard, public transportation vehicles do not appear to be eff ectively regulated or at least emissions standards adequately enforced.
Overall energy effi ciency is improving in conjunction with general economic development. However, economic development will also bring demand for higher quality of service in buildings (more air conditioning, ventilation, technology), and more private vehicle usage leading inevitably to higher energy consumption. The long term trend of high electricity prices will also provide solid incentive for energy effi ciency. Thus the importance of improved energy effi ciency standards is critical at this time of development for Quezon City to remain competitive on a global stage.
General Impressions of Energy Effi ciency in Quezon City
12
EECI RAF
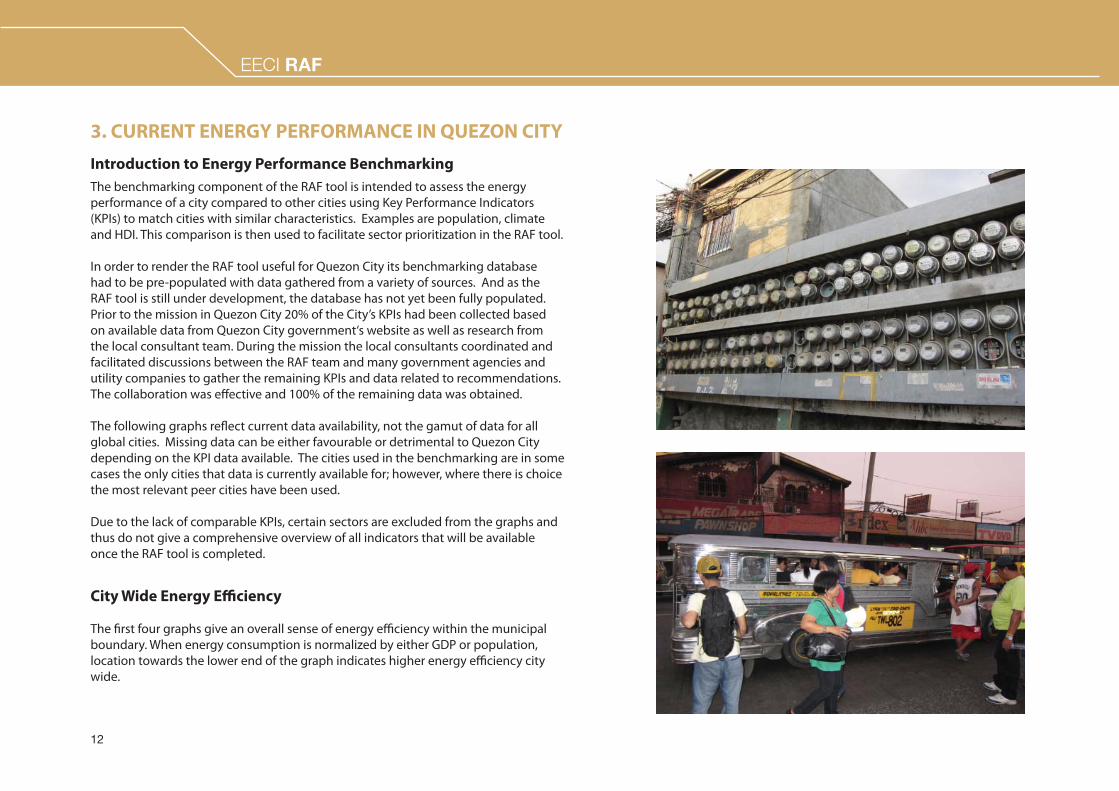
The benchmarking component of the RAF tool is intended to assess the energy performance of a city compared to other cities using Key Performance Indicators (KPIs) to match cities with similar characteristics. Examples are population, climate and HDI. This comparison is then used to facilitate sector prioritization in the RAF tool.
In order to render the RAF tool useful for Quezon City its benchmarking database had to be pre-populated with data gathered from a variety of sources. And as the RAF tool is still under development, the database has not yet been fully populated. Prior to the mission in Quezon City 20% of the City’s KPIs had been collected based on available data from Quezon City government‘s website as well as research from the local consultant team. During the mission the local consultants coordinated and facilitated discussions between the RAF team and many government agencies and utility companies to gather the remaining KPIs and data related to recommendations. The collaboration was eff ective and 100% of the remaining data was obtained.
The following graphs refl ect current data availability, not the gamut of data for all global cities. Missing data can be either favourable or detrimental to Quezon City depending on the KPI data available. The cities used in the benchmarking are in some cases the only cities that data is currently available for; however, where there is choice the most relevant peer cities have been used.
Due to the lack of comparable KPIs, certain sectors are excluded from the graphs and thus do not give a comprehensive overview of all indicators that will be available once the RAF tool is completed.
City Wide Energy Effi ciency
The fi rst four graphs give an overall sense of energy effi ciency within the municipal boundary. When energy consumption is normalized by either GDP or population, location towards the lower end of the graph indicates higher energy effi ciency city wide.
3. CURRENT ENERGY PERFORMANCE IN QUEZON CITY
Introduction to Energy Performance Benchmarking
EECI RAF
13
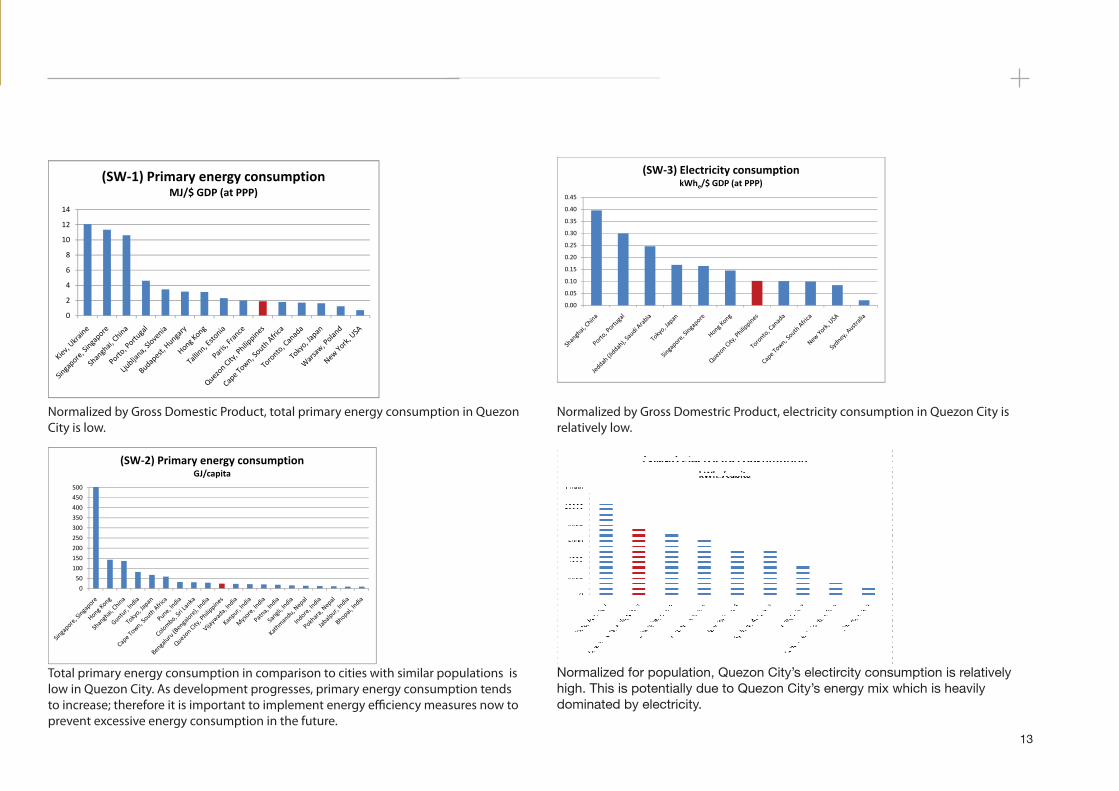
Normalized by Gross Domestic Product, total primary energy consumption in Quezon City is low.
Normalized by Gross Domestric Product, electricity consumption in Quezon City is relatively low.
Total primary energy consumption in comparison to cities with similar populations is low in Quezon City. As development progresses, primary energy consumption tends to increase; therefore it is important to implement energy effi ciency measures now to prevent excessive energy consumption in the future.
Normalized for population, Quezon City’s electircity consumption is relatively high. This is potentially due to Quezon City’s energy mix which is heavily dominated by electricity.
14
EECI RAF
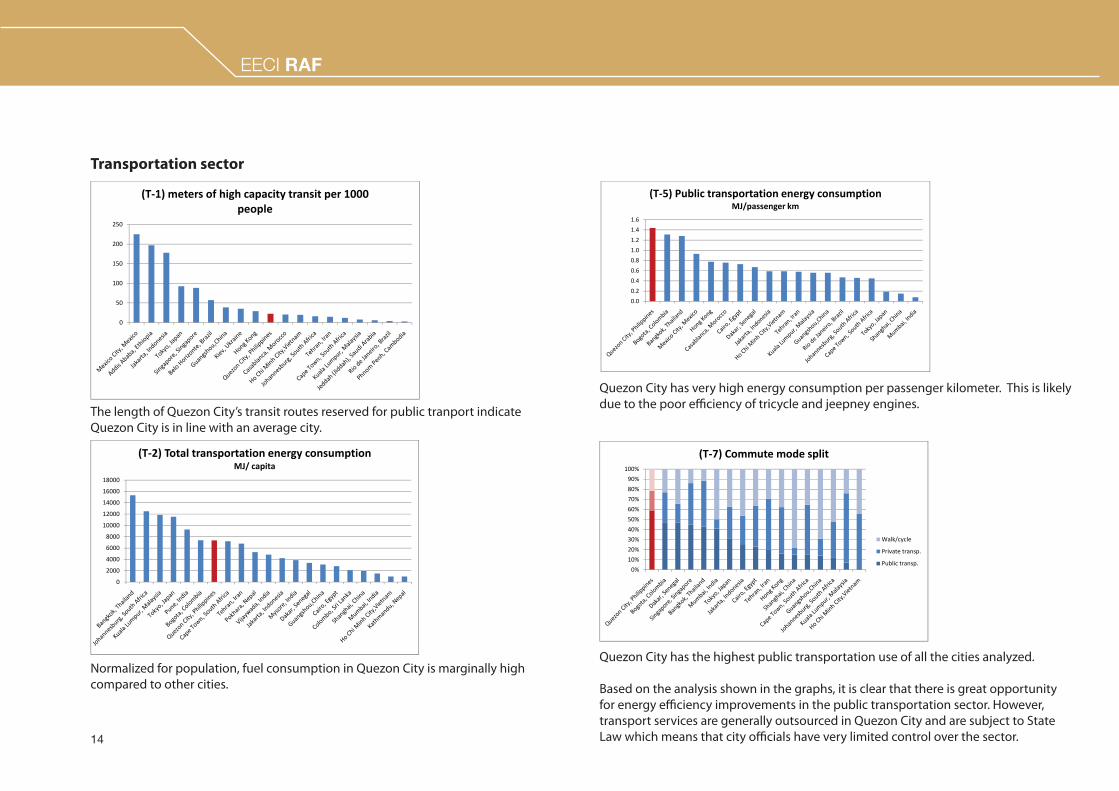
The length of Quezon City’s transit routes reserved for public tranport indicate Quezon City is in line with an average city.
Quezon City has very high energy consumption per passenger kilometer. This is likely due to the poor effi ciency of tricycle and jeepney engines.
Normalized for population, fuel consumption in Quezon City is marginally high compared to other cities.
Quezon City has the highest public transportation use of all the cities analyzed.
Based on the analysis shown in the graphs, it is clear that there is great opportunity for energy effi ciency improvements in the public transportation sector. However, transport services are generally outsourced in Quezon City and are subject to State Law which means that city offi cials have very limited control over the sector.
Transportation sector
EECI RAF
15
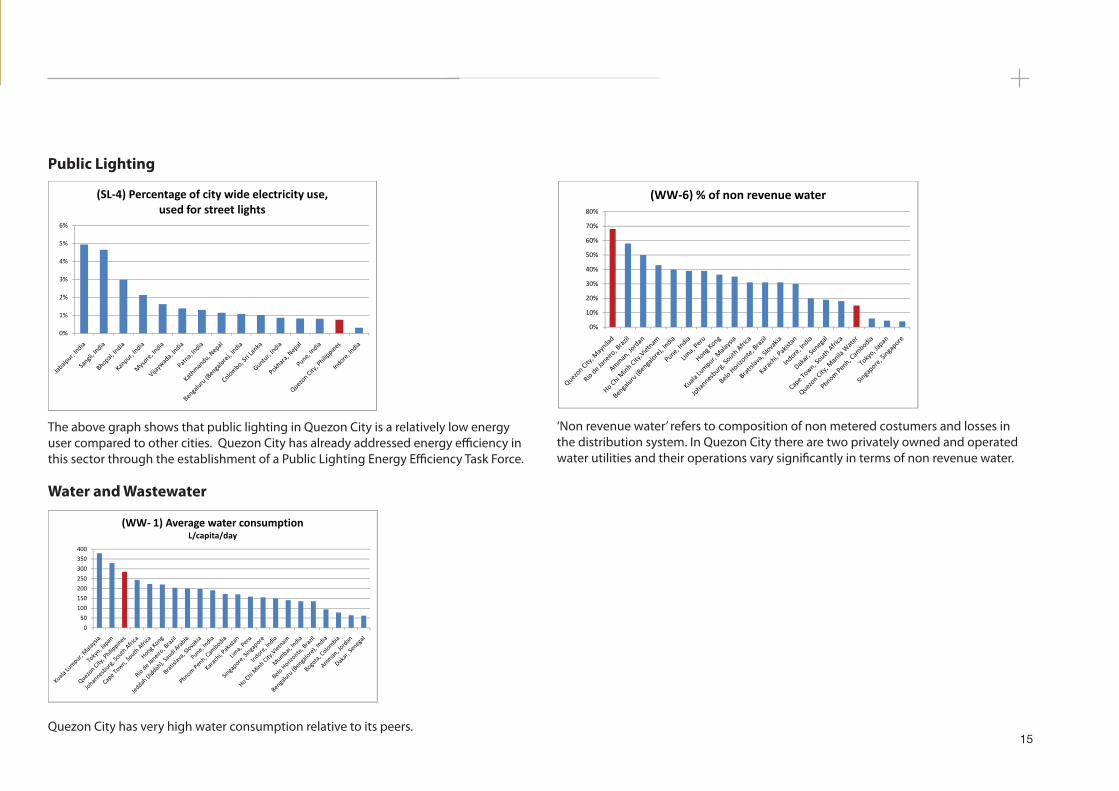
The above graph shows that public lighting in Quezon City is a relatively low energy user compared to other cities. Quezon City has already addressed energy effi ciency in this sector through the establishment of a Public Lighting Energy Effi ciency Task Force.
‘Non revenue water’ refers to composition of non metered costumers and losses in the distribution system. In Quezon City there are two privately owned and operated water utilities and their operations vary signifi cantly in terms of non revenue water.
Quezon City has very high water consumption relative to its peers.
Public Lighting
Water and Wastewater
16
EECI RAF
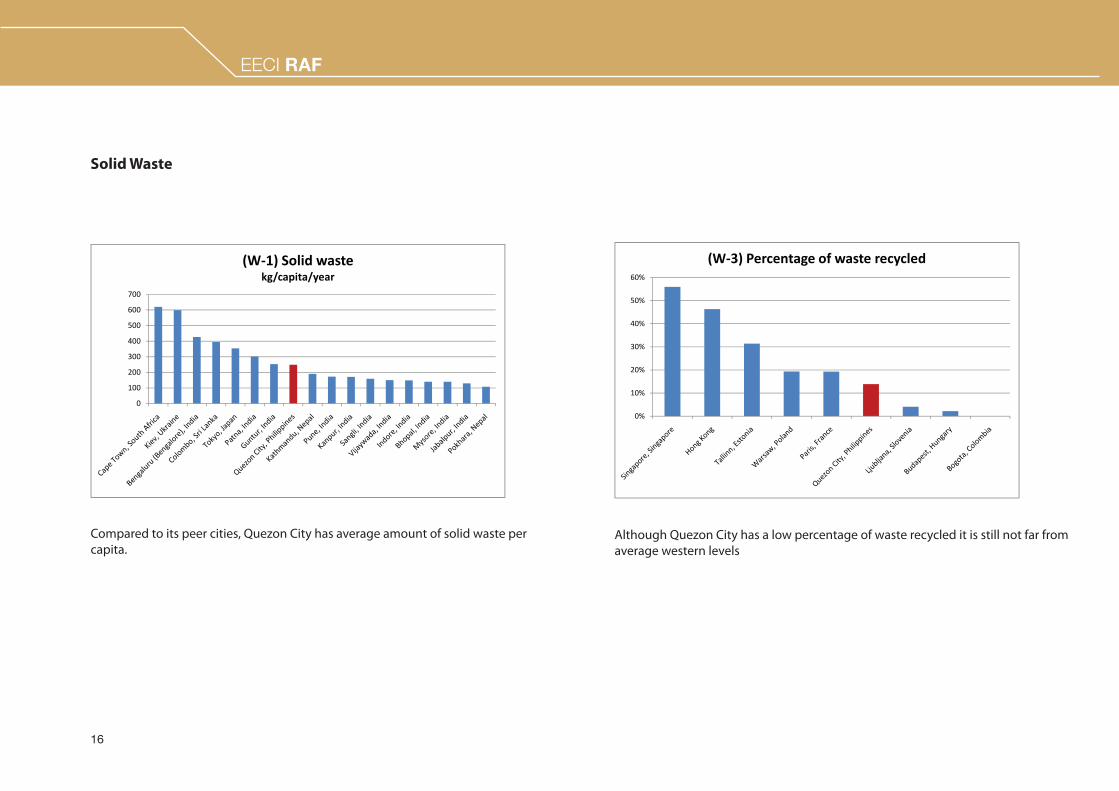
Although Quezon City has a low percentage of waste recycled it is still not far from average western levels
Compared to its peer cities, Quezon City has average amount of solid waste per capita.
Solid Waste
EECI RAF

17

18
EECI RAF
The nature and purpose of the RAF is to rapidly assess energy use in a city in order to identify and prioritise sectors, and suggest specifi c energy effi ciency interventions. It is necessary, therefore, to distinguish at an early stage which sectors are most likely to off er energy effi ciency savings which are practical and fi nancially justifi able.
In the early part of the mission, the consultant had the opportunity to review each sector covered by the RAF through interviews, site visits and review of information provided. This process is designed to provide the consultant with a robust overview of energy use and potential effi ciencies in each sector. This information is used alongside the results of the benchmarking data to assess which of the six sectors should be focused upon during the remaining part of the mission, ultimately leading to specifi c energy effi ciency recommendations.
At this point, therefore, certain sectors are set aside and not pursued further. This does not necessarily mean that no energy effi ciencies are to be developed in these sectors. It simply indicates that, when compared to other sectors, they are unlikely to produce as compelling energy effi ciency savings potential.
The process for identifying priority sectors considers three main issues:
● The proportionate spend on, and city-wide use of, energy;
● The energy savings potential for the sector, based upon the results of the benchmarking exercise and the consultant’s professional opinion having reviewed each sector.
● The degree of control that the Quezon City government has over each sector, or components of a particular sector; in this respect budgetary control is considered the most important;
The prioritisation process in Quezon City was aided considerably by both the availability of data and a willingness of government representatives to share this information.
Note that, at this stage, spend by QCG on energy is distinguished from city-wide energy use. The latter includes private and commercial energy consumption, whereas the former relates to energy consumption that is completely inside the control of QCG.
Prioritisation of sectors was achieved using the framework and information contained in the tables shown on the next two pages. On the basis of this information, the consultant identifi ed three sectors that would have been pursued during the course of a typical RAF assignment. As the principal purpose of the mission to Quezon City was to trial and enhance the design of the RAF, eff orts were made to ensure that all sectors were further reviewed (to the extent this was possible) during the course of the mission. Hence, fi nal recommendations include suggested activities that cover a number of sectors.
In time the prioritisation process will be developed further to provide a quantitative appraisal of each sector to provide a ranking that identifi es priority sectors. This component remains in development; however, the RAF team collectively view the quantitative approach to sector ranking as an initial step which must be contextualised further by both the professional opinion of the consultant and discussion with city government leadership.
4. Identifying Priority Sectors
EECI RAF
19
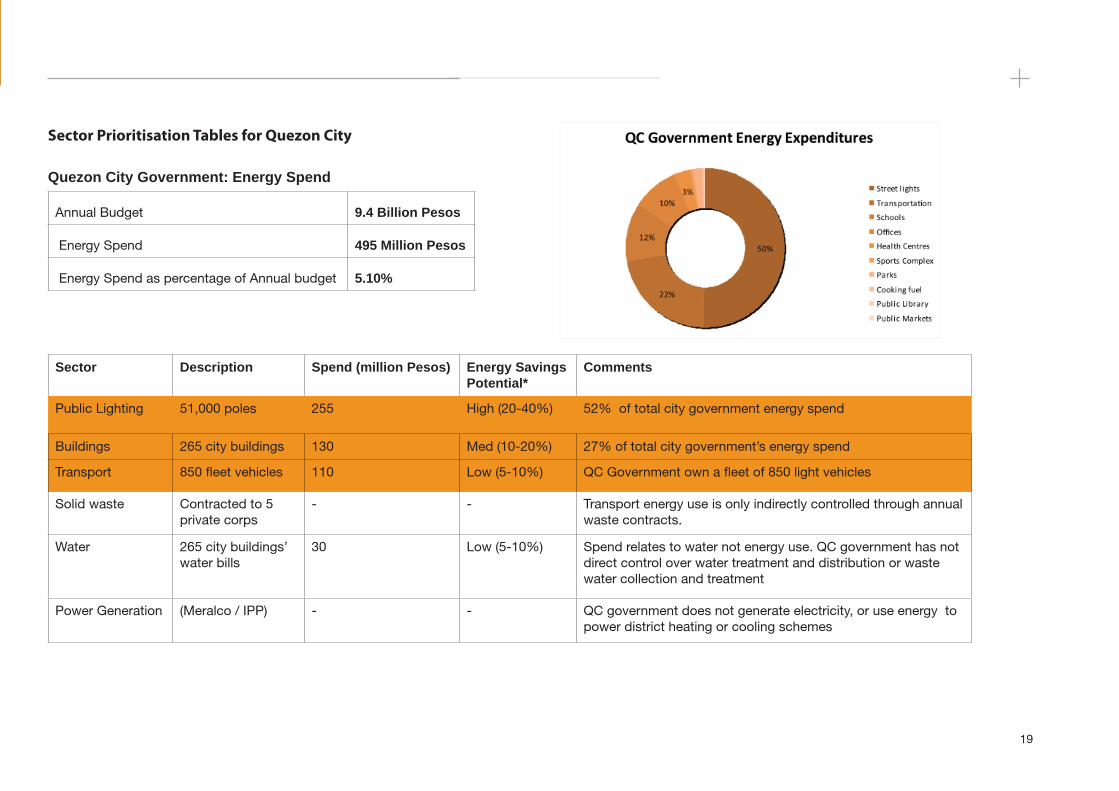
Sector Prioritisation Tables for Quezon City
Quezon City Government: Energy Spend
Annual Budget 9.4 Billion Pesos
Energy Spend 495 Million Pesos
Energy Spend as percentage of Annual budget 5.10%
Sector Description Spend (million Pesos) Energy Savings Potential*
Comments
Public Lighting 51,000 poles 255 High (20-40%) 52% of total city government energy spend
Buildings 265 city buildings 130 Med (10-20%) 27% of total city government’s energy spend
Transport 850 fl eet vehicles 110 Low (5-10%) QC Government own a fl eet of 850 light vehicles
Solid waste Contracted to 5 private corps
- - Transport energy use is only indirectly controlled through annual waste contracts.
Water 265 city buildings’ water bills
30 Low (5-10%) Spend relates to water not energy use. QC government has not direct control over water treatment and distribution or waste water collection and treatment
Power Generation (Meralco / IPP) - - QC government does not generate electricity, or use energy to power district heating or cooling schemes
20
EECI RAF
Sector Mayor’s Infl uence % of city energy use Energy Savings Potential* Comments
Transport Low 51% High (20-40%) 200,000 motorcycles and tricylces regulated by QC.
Buildings Med 40% Low (5-10%) Second highest energy using sector
Water Low 0.70% Med (10-20%) Spend relates to water not energy use. QC government has no direct control over water treatment and distribution or waste water collection and treatment
Waste Med - - Low utilisation of energy in waste management other than in transportation
Public Lighting High 0.40% High (20-40%) 60% roads lit: 45,000 lamps
Power Generation
V. Low - Low (5-10%) QC government does not generate electricity, or use energy to power district heating or cooling schemes
EECI RAF
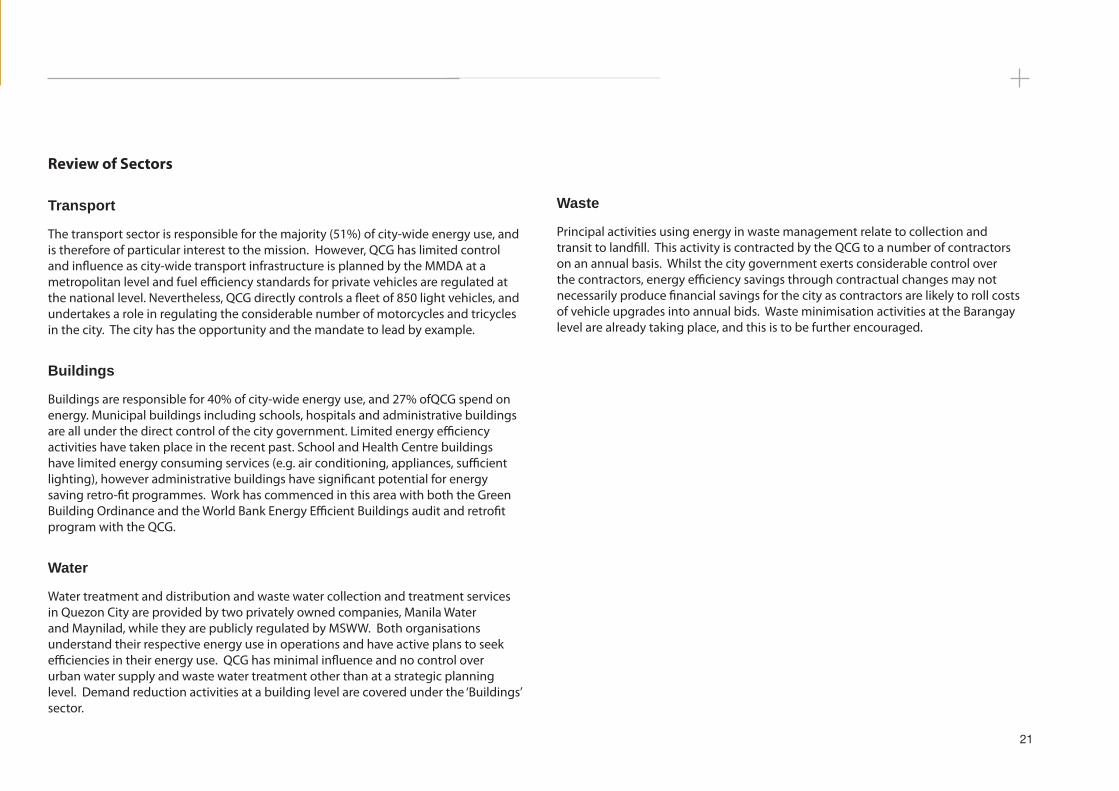
Quezon City-wide Energy UseCity Wide Energy End Use
(MJ)
14%
17%
6%62%
0.3%1%
Residential
Commercial
Industrial
Streetlights
Water
Transportation
21
Review of Sectors
Transport
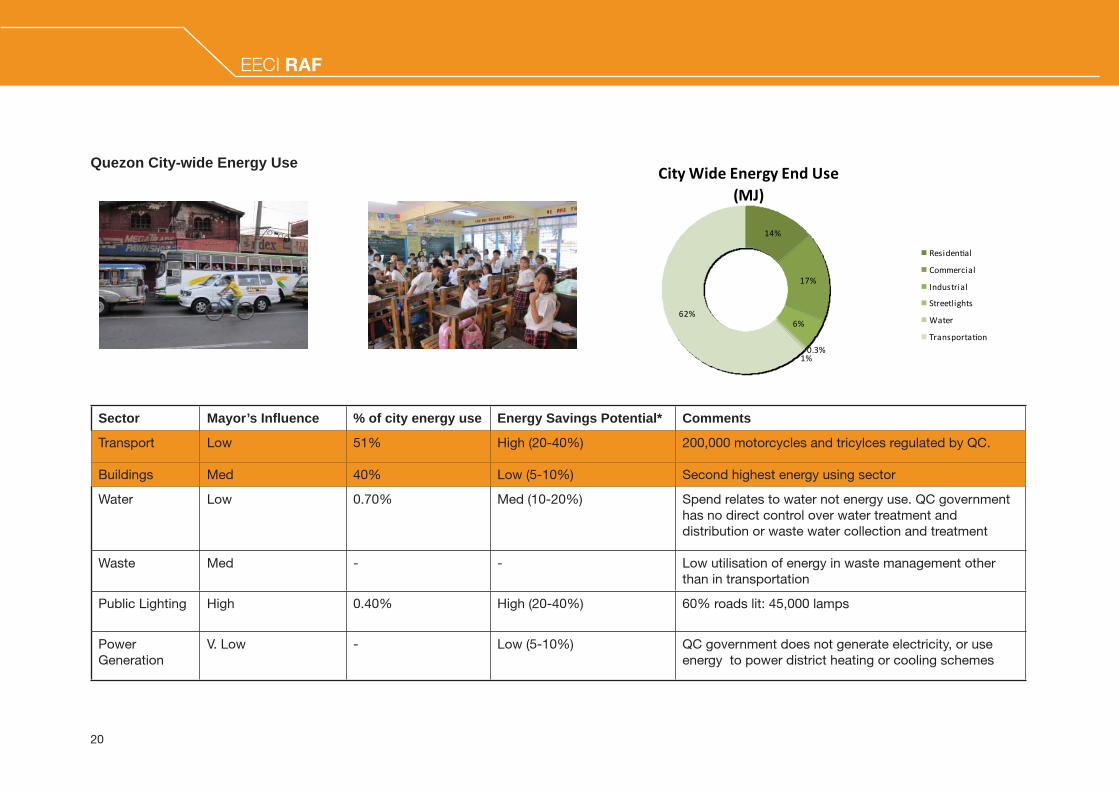
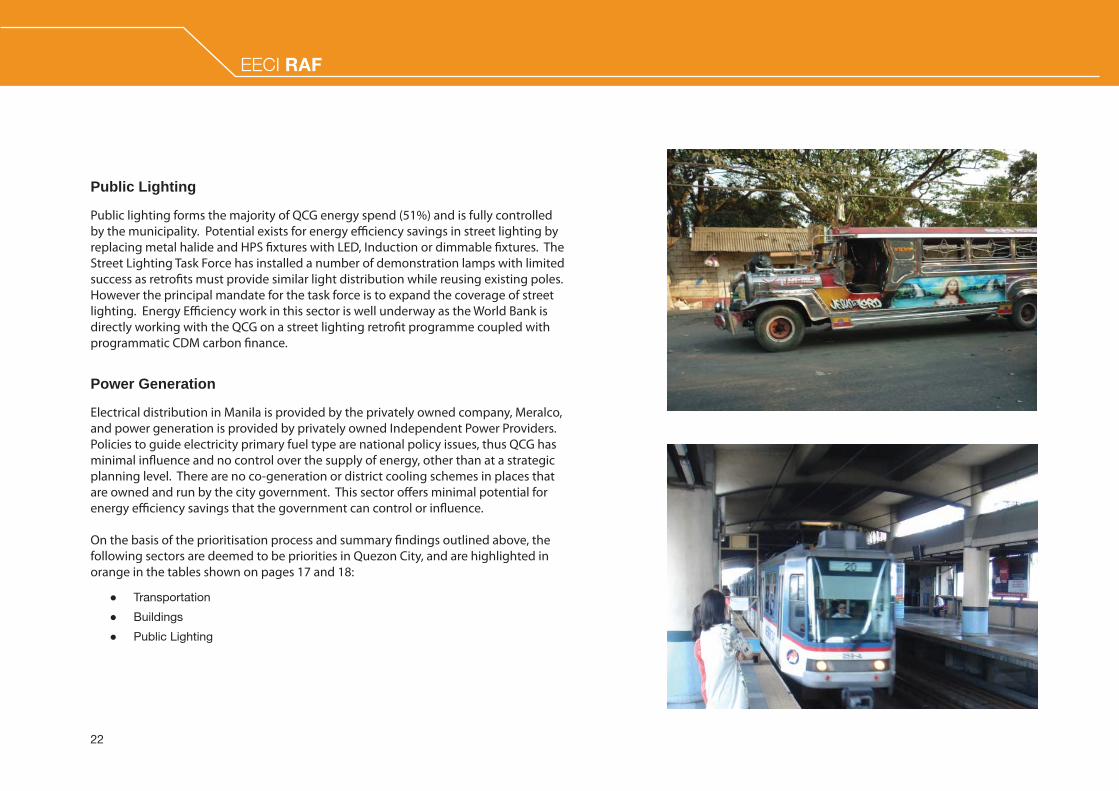
The transport sector is responsible for the majority (51%) of city-wide energy use, and is therefore of particular interest to the mission. However, QCG has limited control and infl uence as city-wide transport infrastructure is planned by the MMDA at a metropolitan level and fuel effi ciency standards for private vehicles are regulated at the national level. Nevertheless, QCG directly controls a fl eet of 850 light vehicles, and undertakes a role in regulating the considerable number of motorcycles and tricycles in the city. The city has the opportunity and the mandate to lead by example.
Buildings
Buildings are responsible for 40% of city-wide energy use, and 27% ofQCG spend on energy. Municipal buildings including schools, hospitals and administrative buildings are all under the direct control of the city government. Limited energy effi ciency activities have taken place in the recent past. School and Health Centre buildings have limited energy consuming services (e.g. air conditioning, appliances, suffi cient lighting), however administrative buildings have signifi cant potential for energy saving retro-fi t programmes. Work has commenced in this area with both the Green Building Ordinance and the World Bank Energy Effi cient Buildings audit and retrofi t program with the QCG.
Water
Water treatment and distribution and waste water collection and treatment services in Quezon City are provided by two privately owned companies, Manila Water and Maynilad, while they are publicly regulated by MSWW. Both organisations understand their respective energy use in operations and have active plans to seek effi ciencies in their energy use. QCG has minimal infl uence and no control over urban water supply and waste water treatment other than at a strategic planning level. Demand reduction activities at a building level are covered under the ‘Buildings’ sector.
Waste
Principal activities using energy in waste management relate to collection and transit to landfi ll. This activity is contracted by the QCG to a number of contractors on an annual basis. Whilst the city government exerts considerable control over the contractors, energy effi ciency savings through contractual changes may not necessarily produce fi nancial savings for the city as contractors are likely to roll costs of vehicle upgrades into annual bids. Waste minimisation activities at the Barangay level are already taking place, and this is to be further encouraged.
22
EECI RAF
Public Lighting
Public lighting forms the majority of QCG energy spend (51%) and is fully controlled by the municipality. Potential exists for energy effi ciency savings in street lighting by replacing metal halide and HPS fi xtures with LED, Induction or dimmable fi xtures. The Street Lighting Task Force has installed a number of demonstration lamps with limited success as retrofi ts must provide similar light distribution while reusing existing poles. However the principal mandate for the task force is to expand the coverage of street lighting. Energy Effi ciency work in this sector is well underway as the World Bank is directly working with the QCG on a street lighting retrofi t programme coupled with programmatic CDM carbon fi nance.
Power Generation
Electrical distribution in Manila is provided by the privately owned company, Meralco, and power generation is provided by privately owned Independent Power Providers. Policies to guide electricity primary fuel type are national policy issues, thus QCG has minimal infl uence and no control over the supply of energy, other than at a strategic planning level. There are no co-generation or district cooling schemes in places that are owned and run by the city government. This sector off ers minimal potential for energy effi ciency savings that the government can control or infl uence.
On the basis of the prioritisation process and summary fi ndings outlined above, the following sectors are deemed to be priorities in Quezon City, and are highlighted in orange in the tables shown on pages 17 and 18:
● Transportation
● Buildings
● Public Lighting
EECI RAF

23
24
EECI RAF
Maintenance programs with fuel-effi ciency focused procedures have been shown to save 10%-20% of fuel consumption. With an annual expenditure of 110M pesos on transportation fuel, we estimate that Quezon City government may be able to save a minimum of 11M pesos per year in fuel costs. Some of these savings would need to be allocated to additional staff to perform, teach and check the new maintenance procedures, and some savings will be allocated to additional equipment costs.
This program includes technical maintenance procedures such as tire pressure checking, engine tune-ups, fuel additives for combustion chamber cleaning, and other simple technical fi xes. However, this program must also include behavioral change for fuel effi ciency such as acceleration/deceleration rates, maximum time for engine idling, maximum speeds and other minor behaviors that have signifi cant fuel effi ciency impacts.
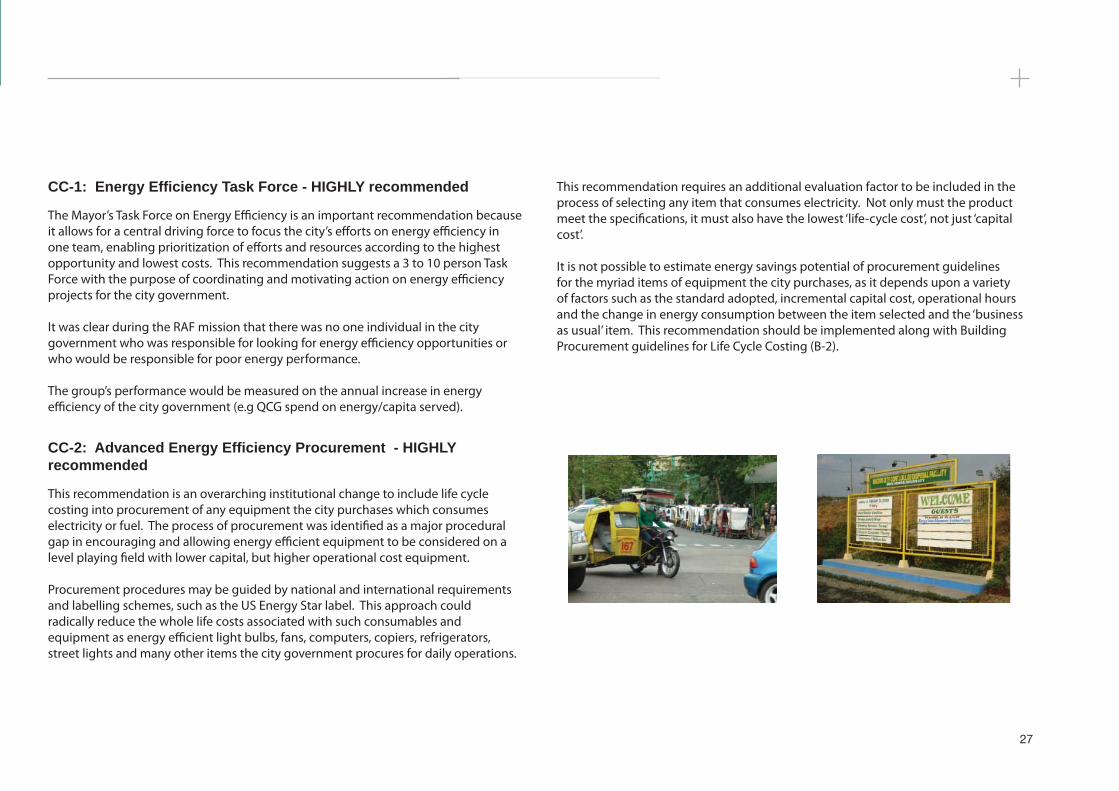
T-4: Engine effi ciency improvement program - HIGHLY recommended
The engine replacement program from 2-stroke to 4-stroke was selected due to the high number of motorcycles and tricycles still running on 2-stroke engines (17,000). 2-stroke engines are both fuel ineffi cient and highly polluting as they do not completely burn the fuel in the combustion chamber and provide fresh combustion air for the next combustion cycle. Quezon City is the sole regulator for franchised tricycles, so the Mayor has complete control to legislate and enforce this program. Tricycles are a mode of transportation that should be encouraged as they are more effi cient than private automobiles and jeepneys. Tricycles with 4-stroke engines will result in lower operational costs for owners and cleaner air for the residents of Quezon City.
Neighboring cities have implemented a 4-stroke engine replacement program via both incentives and mandates. The more eff ective programs are incentive-based as these programs cover the costs for nearly all of the cost of replacement; however, these programs require signifi cant funding from external sources. Further investigation into the implementation route for this recommendation, be it a mandate or an incentive, would be advisable.
The RAF (currently) contains 56 energy effi ciency recommendations applicable across the six individual sectors. Following on from the sector prioritization process, each individual recommendation was reviewed to establish its applicability in the Quezon City context. This review or fi ltering process is necessary so that, time is spent eff ectively, focusing on those recommendations that are both viable and practicable. Where recommendations were not progressed the predominant reasons were that:
● QCG has already engaged in work in that area;
● Technically minimal savings were available in the area; or
● Savings in the area would not be fi nancially viable.
Of the 56 recommendations, eight stood out as particularly relevant opportunities for signifi cant energy savings in the Quezon City context. It should be noted however, that this list purposely excludes the many programs currently underway, and other programs which are relevant, but do not seem to off er signifi cant energy savings opportunities. A concentrated focus into each of the eight recommendations was conducted during the second week of the mission by gathering specifi c data to assess the viability of each recommendation.
The recommendations are not prioritized as the RAF model deems all eight to be a high priority. Additionally, many of the recommendations work together to develop synergies and a culture of energy effi ciency throughout the administration that create savings well beyond the goals set out below.
The implementation and attributes of each of the recommendation is presented in detail in the next section. The rationale for selecting specifi c energy effi ciency recommendations is summarised below. A full list of all RAF recommendations alongside the rationale for their selection or rejection is provided in the Appendix.
T-1: Municipal fl eet maintenance program - HIGHLY recommended
The fl eet maintenance program was selected because there are 850 vehicles owned and maintained directly by Quezon City government and, currently there is no existing maintenance procedure specifi cally focused on for fuel effi ciency.
5. Energy Effi ciency Recommendations
EECI RAF
25
T-11: Walking / Cycle path development program - HIGHLY recommended
The walking and cycle path program was selected due to the high mode split of walking and cycling (21%) and the observed limited number of dedicated cycle lanes. Cycling through Quezon City is potentially very dangerous as cyclists often ride in the middle of busy roads. Walking and cycling are the lowest energy mode of transport and provide exercise for an ever increasingly sedentary urban population.
By increasing the safety, total length, access to and integration of bike paths, increasing numbers of riders will utilize walking and cycling in favor of private vehicle transportation. A goal of 25% to 30% of mode split from cycling would be an aggressive goal since private vehicle usage is increasing annually as wealth and access to vehicles increases.
Neighbouring communities have been developing dedicated cycle paths through river and stream corridors. Allocating a 1m right of way for cycles on each side of the road with physical separation from pedestrians and automobiles via curbs, trees or bollards is the key to safe cycle paths in urban areas. Funding of bike paths is most effi cient when the path design and construction is integrated into a major road renovation and construction is ongoing for larger reasons. A goal of 10km of new bike paths per year for the next 4 years would be an aggressive goal.
B-2: Procurement guidelines for life cycle costing - HIGHLY recommended
The institutional change to include life cycle costing into building design and construction was identifi ed as a major procedural gap in encouraging and allowing energy effi cient systems to be installed in new construction and major renovations. Studies in Europe have shown that the capital cost of new commercial property is generally less than 10% of the whole lifecycle cost.
Procurement procedures are rigorous in Quezon City and rules are strictly enforced
to guarantee competition in the bidding process; however, the current procurement process does not consider operational expenditure to enable the value of long term savings from effi cient plant and consumables such as energy effi cient lights, pumps, air conditioning and appliances.
This recommendation requires an additional evaluation factor to be included in the process of selecting any item of equipment in a building that consumes electricity. Not only must the product meet the specifi cations, it must also be considered on the basis of its running cost and replacement cycles, not just capital expenditure.
It is particularly diffi cult to estimate energy savings potential of procurement guidelines for future buildings because the amount of future building construction over the next 5 years has not been planned in a long-term capital planning (see B-4). However, energy savings can be predicted on the basis of a comparison against business as usual scenarios, that is procurement on the basis of capital cost alone, for each new development. This recommendation should be implemented along with Advanced EE Procurement recommendation (CC-2).
26
EECI RAF
WW-1: Land provision for reservoirs at high elevation - HIGHLY recommended
This recommendation is for the city administration to support Manila Water and Maynilad to locate critical water infrastructure equipment in the most energy-effi cient locations. Both water companies identifi ed the need for additional storage reservoirs and sewage treatment plants throughout their service territory, but they also identifi ed a lack of available land in desirable locations. Electricity costs for pumping water are over 15% of the total operational costs for both Manila Water and Maynilad, which is their second largest operational expense after staff costs.
For the potable water networks, bringing water into the city from the Angat and Ipo Dams in the Sierra Madre mountains via gravity storage is the current method for transmission. However, distribution throughout the city is currently performed via a pressurized pumped network, which could be improved by developing a network of storage tanks located in hydraulically effi cient locations. Some sewage treatment plants (STP) in Quezon City currently fl ow using an all-gravity network, but these STPs only serve 9% of the population. More STPs will be required in the future, and these will have signifi cant land requirements. Neither water company estimated the level of savings potential for increasing the gravity distribution and collection networks, but they both ranked this issue at the top of their list of things the Mayor could do to help improve energy effi ciency in their water networks.
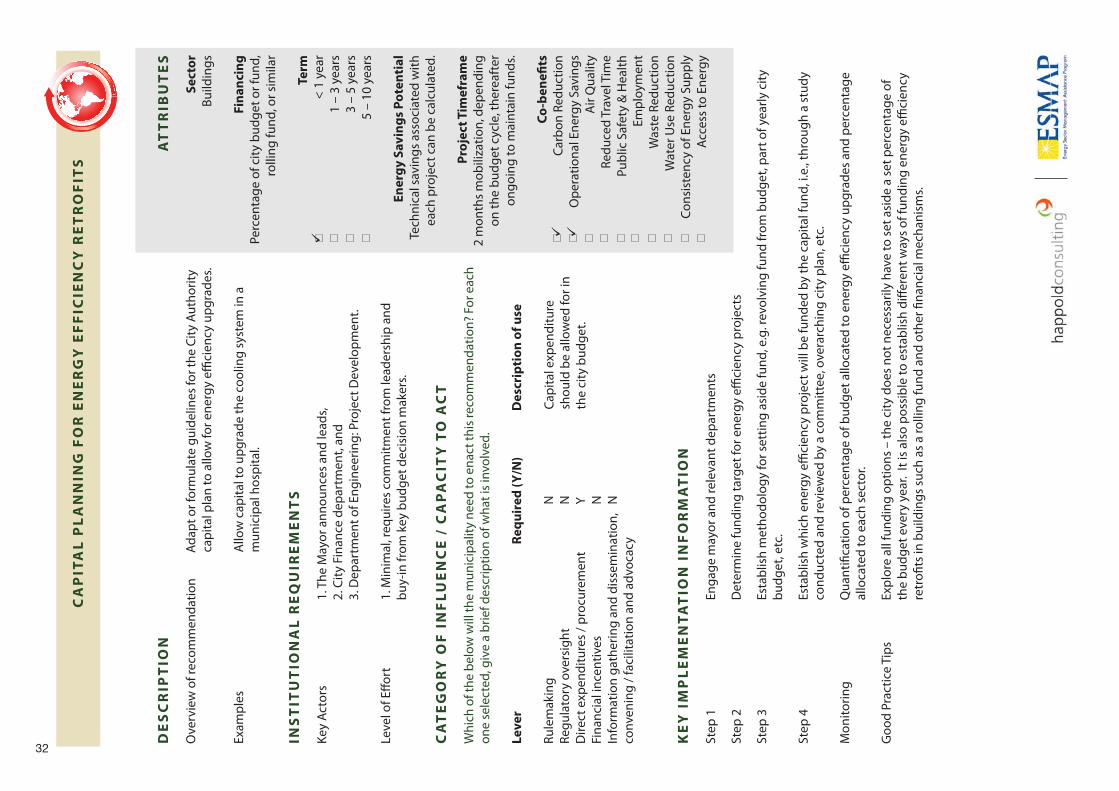
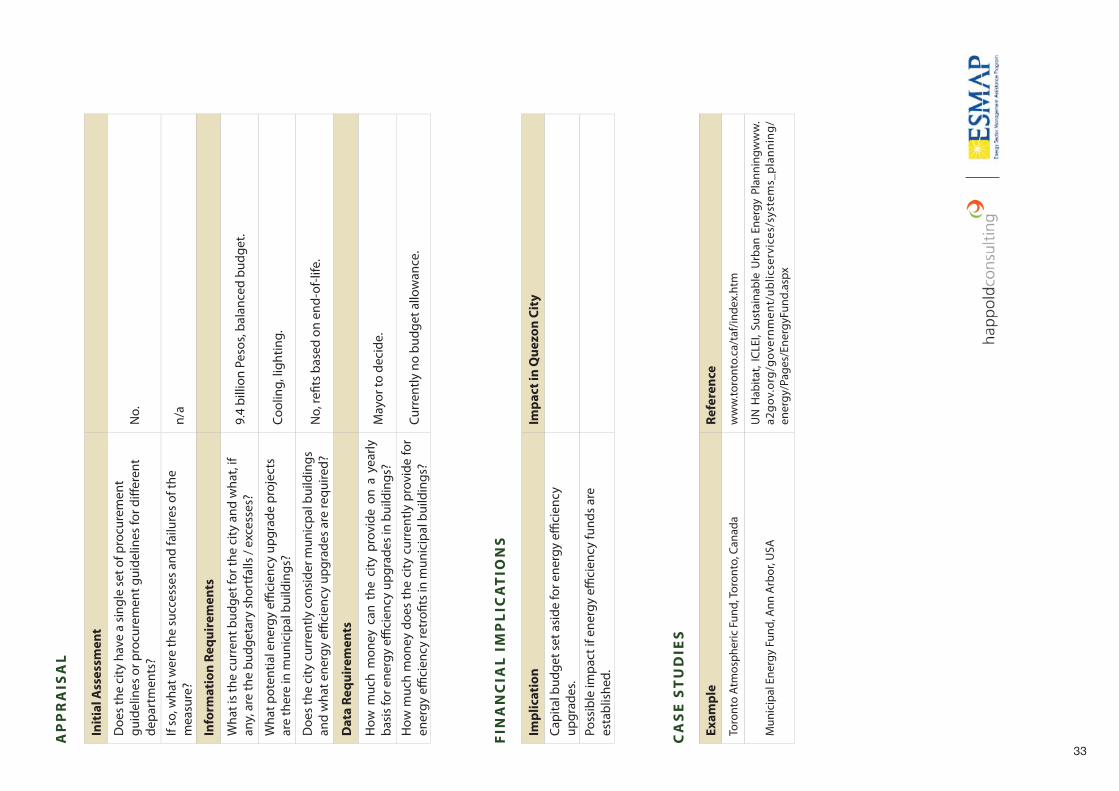
B-4: 5 year capital planning for energy effi ciency retrofi ts - HIGHLY recommended
This recommendation requires the development and approval of a fi ve year planning strategy for upgrading all of the existing building stock for Quezon City government buildings. This recommendation requires that a new ‘line item’ be incorporated into the annual budget that provides for expenditure on building renovation.
During the RAF mission a sample of building walk-through reviews uncovered two principal fi ndings: fi rstly most of the older buildings with central air conditioning systems were still operating old, ineffi cient chillers, fans and lighting; secondly, many buildings such as the school buildings and health clinics did not have suffi cient lighting, ventilation or air conditioning and were under-serviced in terms of quality. Consequently, in time older buildings should be upgraded to include effi cient new lighting and mechanical systems and the under-served buildings should be upgraded to internationally accepted standards for lighting, ventilation and cooling.
With a 5 or 10-year capital planning campaign, proposals for building retrofi ts and upgrades can be brought to the Building Department, General Services Offi ce or the Mayor’s Energy Effi ciencyTask Force (see CC-1) and projects with the greatest energy saving potential can be prioritized and executed as soon as fi nancially possible. Such a long-term plan can be used to attract energy effi ciency funding or capital funds to realize the many opportunities Quezon City has for energy effi ciency.
EECI RAF
27
CC-1: Energy Effi ciency Task Force - HIGHLY recommended
The Mayor’s Task Force on Energy Effi ciency is an important recommendation because it allows for a central driving force to focus the city’s eff orts on energy effi ciency in one team, enabling prioritization of eff orts and resources according to the highest opportunity and lowest costs. This recommendation suggests a 3 to 10 person Task Force with the purpose of coordinating and motivating action on energy effi ciency projects for the city government.
It was clear during the RAF mission that there was no one individual in the city government who was responsible for looking for energy effi ciency opportunities or who would be responsible for poor energy performance.
The group’s performance would be measured on the annual increase in energy effi ciency of the city government (e.g QCG spend on energy/capita served).
CC-2: Advanced Energy Effi ciency Procurement - HIGHLY recommended
This recommendation is an overarching institutional change to include life cycle costing into procurement of any equipment the city purchases which consumes electricity or fuel. The process of procurement was identifi ed as a major procedural gap in encouraging and allowing energy effi cient equipment to be considered on a level playing fi eld with lower capital, but higher operational cost equipment.
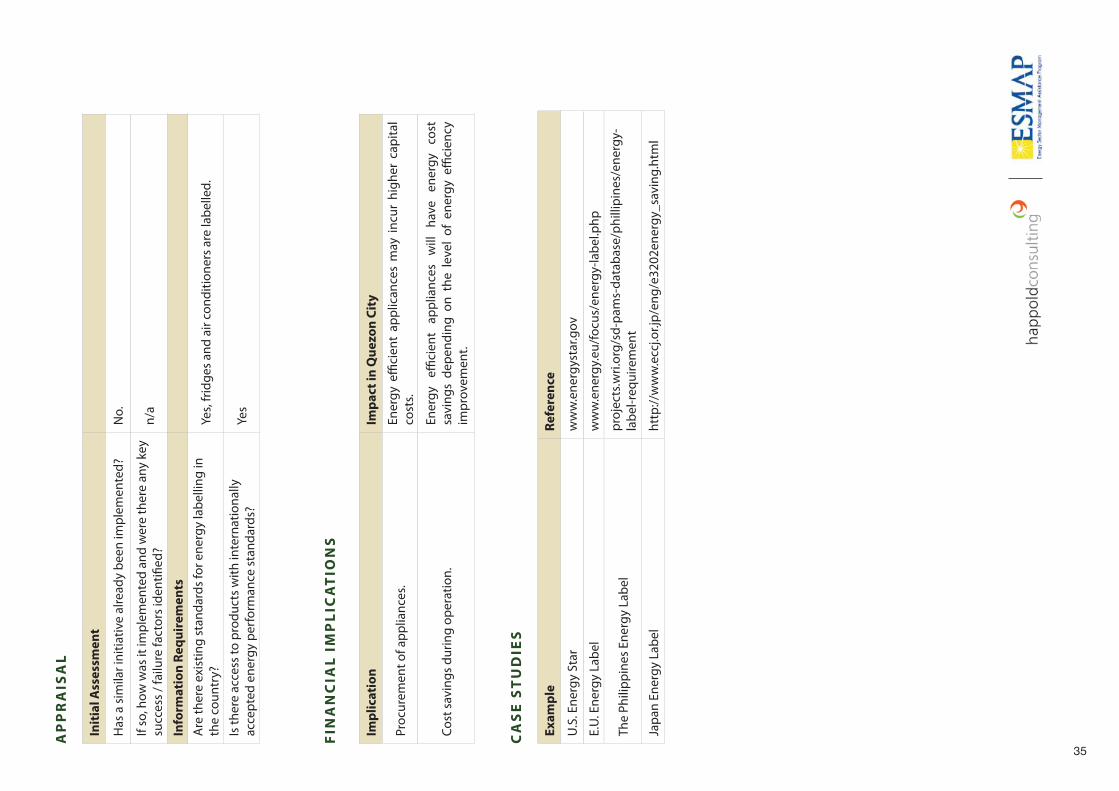
Procurement procedures may be guided by national and international requirements and labelling schemes, such as the US Energy Star label. This approach could radically reduce the whole life costs associated with such consumables and equipment as energy effi cient light bulbs, fans, computers, copiers, refrigerators, street lights and many other items the city government procures for daily operations.
This recommendation requires an additional evaluation factor to be included in the process of selecting any item that consumes electricity. Not only must the product meet the specifi cations, it must also have the lowest ‘life-cycle cost’, not just ‘capital cost’.
It is not possible to estimate energy savings potential of procurement guidelines for the myriad items of equipment the city purchases, as it depends upon a variety of factors such as the standard adopted, incremental capital cost, operational hours and the change in energy consumption between the item selected and the ‘business as usual’ item. This recommendation should be implemented along with Building Procurement guidelines for Life Cycle Costing (B-2).
28
EECI RAFEECI RAF
Recommendation Sector Financing Term Energy Savings Potential Project Timeframe Co-Benefi ts
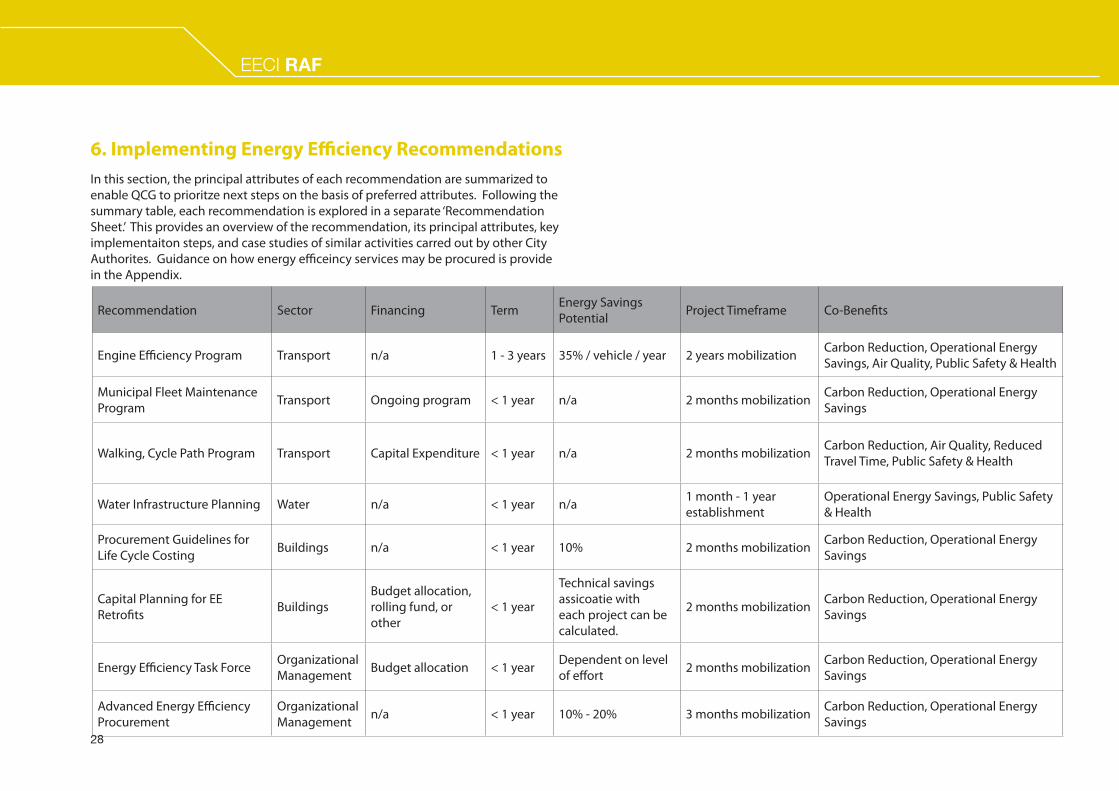
Engine Effi ciency Program Transport n/a 1 - 3 years 35% / vehicle / year 2 years mobilization Carbon Reduction, Operational Energy Savings, Air Quality, Public Safety & Health
Municipal Fleet Maintenance Program Transport Ongoing program < 1 year n/a 2 months mobilization Carbon Reduction, Operational Energy
Savings
Walking, Cycle Path Program Transport Capital Expenditure < 1 year n/a 2 months mobilization Carbon Reduction, Air Quality, Reduced Travel Time, Public Safety & Health
Water Infrastructure Planning Water n/a < 1 year n/a 1 month - 1 year establishment
Operational Energy Savings, Public Safety & Health
Procurement Guidelines for Life Cycle Costing Buildings n/a < 1 year 10% 2 months mobilization Carbon Reduction, Operational Energy
Savings
Capital Planning for EE Retrofi ts Buildings
Budget allocation, rolling fund, or other
< 1 year
Technical savings assicoatie with each project can be calculated.
2 months mobilization Carbon Reduction, Operational Energy Savings
Energy Effi ciency Task Force Organizational Management Budget allocation < 1 year Dependent on level
of eff ort 2 months mobilization Carbon Reduction, Operational Energy Savings
Advanced Energy Effi ciency Procurement
Organizational Management n/a < 1 year 10% - 20% 3 months mobilization Carbon Reduction, Operational Energy
Savings
6. Implementing Energy Effi ciency Recommendations6. Implementing Energy Effi ciency Recommendations
In this section, the principal attributes of each recommendation are summarized to enable QCG to prioritze next steps on the basis of preferred attributes. Following the summary table, each recommendation is explored in a separate ‘Recommendation Sheet.’ This provides an overview of the recommendation, its principal attributes, key implementaiton steps, and case studies of similar activities carred out by other City Authorites. Guidance on how energy effi ceincy services may be procured is provide in the Appendix.

29
30
EECI RAFEECI RAF
7. Findings / Lessons Learned from the Quezon City 7. Findings / Lessons Learned from the Quezon City
MissionMission
General Observations
Quezon City is possibly too advanced, on the basis of existing energy effi ciency programs, to be a typical candidate for the application of the RAF. It already has a number of programs in place assisted by both the World Bank and the Asian Development Bank. As such data was possibly easier to obtain, and recommendations less technical, as many of the major opportunities such as public lighting retro-fi ts and building energy effi ciency measures are already being pursued.
The use of local consultants is highly benefi cial, but many doors remain closed to them. The international consultant fared much better, but it was the presence of World Bank staff that seemed to ensure that both arrangements and access was guaranteed. Future RAF missions must take account of the importance of these observations and try to ensure that representation from the funder is available.
Pre-mission
During the pre-mission information gathering stage, the international and local consultant found diffi culty in communicating eff ectively with Quezon City offi cials. Both parties found that access to both representatives of the QCG and background energy use data diffi cult to obtain. This was largely because:
• QCG representatives wished to deal directly with the World Bank rather than the International Consultant; and
• the local consultant did manage to obtain written authorization (requested by the International Consultant and the World Bank) ahead of the mission, making it impossible for the local consultant to gather essential data.
Allied to this, there was the possibility for confusion amongst QCG representatives as to the exact nature of the study as at least two other World Bank funded programs with similar energy effi ciency aims were underway concurrently.
This challenge highlighted the need in the design and implementation of the RAF to ensure that a clear and prescriptive approach to the pre-mission stage be defi ned. This should include a pre-mission information pack introducing the RAF and the exact nature of the data and information requirements to the city authority; pre-assignment of representatives in the city authority to aid data gathering in specifi c areas; mayoral endorsement of the project and written authorization to galvanize support for the local and international consultant. In addition, it is suggested that a longer schedule of six weeks is allowed for to enable information gathering to take place. The consultant has also reconsidered and pared-back the range and depth of information required pre-mission to concentrate on those elements that are absolutely essential to both city-specifi c context and the benchmarking process.
Energy Performance Benchmarking
Whilst there were challenges, initially, to obtaining energy performance data, enough information was obtained to enable performance comparisons across each of the six sectors (largely due to publicly available information provided on the QCG website). In practice the consultant found that the presentation of performance data in a context that compared ‘home’ performance to those of peer cities to be a particularly eff ective means of engaging QCG representatives. They were keen to review and understand more about benchmarking (where data was derived from, boundaries etc) and its presentation was of evident interest.
Although energy performance benchmarking is a very useful process that provides a high level indication of where, in the context of the RAF, further eff ort and focus should be applied, the results should be interpreted with caution due to the relative scarcity of principal datasets currently. Whilst the database of energy performance in cities is developing it will, during the initial phases of the RAF implementation, provide a mosaic of data. The application of the RAF must therefore ensure that candidate cities agree to the incorporation of their data into the RAF database so that accurate and reliable data is available to grow the database as time moves on.
The response to energy performance benchmarking by QCG representatives leads
31
the consultant to believe that the presentation of energy performance must be carefully considered prior to the delivery of any message to a wider audience. There are potentially signifi cant implications to a demeaning of city performance which may be counterproductive in the remaining phases of the RAF mission. Benchmarking must, therefore, both engage the city authority and garner their support to make the mission productive through the positive and constructive communication.
Identifying Priority Sectors
The identifi cation of priority sectors is required after the consultant has had approximately 4 to 5 days to interview representatives across all six sectors, and assimilated information and observations. Whilst prioritizing sectors can be aided by quantitative information such as ‘city spend’, in practice there is not a straightforward and empirically based formula for deciding upon priority sectors.
During the course of the Quezon City mission, it was clear that the principal factors in prioritization were:
• energy saving potential (i.e. by what sort of percentage could energy demand be reduced across the sector);
• the City Authority’s ability to control or infl uence the issue; and
• spend or proportionate energy use.
Diffi culties were experienced in eff ectively ranking between energy use under the direct purview of the city authority (i.e. QCG government spend) and city-wide energy use.
The Quezon City mission has benefi ted the consultant by focusing attention on the challenges of:
• linking energy performance benchmarking results to the sector prioritization process;
• the defi nition of levels of control or infl uence that a city authority may exercise over a particular issue; and
• the aggregation and relative comparison of two quite separate, but intrinsically linked, components of city energy use: whole city energy use and city authority energy use.
This challenge has been taken-up post mission, and the consultant is working through a number of options to defi ne a logical process that may be consistently applied. This process will assimilate contextual, quantitative and qualitative information to derive a sound means for identifying priority sectors.
In Quezon City, it was apparent that the RAF sector prioritization results were no surprise to QCG representatives. This was benefi cial insofar as it served to confi rm both their actions and prior assumptions, although Quezon City had not compared all the sectors together in the way the RAF compared them on a quantifi able basis.
32
DE
SC
RIP
TIO
N
Ove
rvie
w o
f rec
omm
enda
tion
Adap
t or f
orm
ulat
e gu
idel
ines
for t
he C
ity A
utho
rity
ca
pita
l pla
n to
allo
w fo
r ene
rgy
effi c
ienc
y up
grad
es.
Exam
ples
A
llow
cap
ital t
o up
grad
e th
e co
olin
g sy
stem
in a
m
unic
ipal
hos
pita
l.
INS
TIT
UT
ION
AL
RE
QU
IRE
ME
NT
S
Key
Acto
rs
1.
The
May
or a
nnou
nces
and
lead
s,
2. C
ity F
inan
ce d
epar
tmen
t, an
d
3. D
epar
tmen
t of E
ngin
eerin
g: P
roje
ct D
evel
opm
ent.
Leve
l of E
ff ort
1. M
inim
al, r
equi
res
com
mitm
ent f
rom
lead
ersh
ip a
nd
bu
y-in
from
key
bud
get d
ecis
ion
mak
ers.
CA
TE
GO
RY
OF
IN
FL
UE
NC
E /
CA
PA
CIT
Y T
O A
CT
Whi
ch o
f the
bel
ow w
ill th
e m
unic
ipal
ity n
eed
to e
nact
this
reco
mm
enda
tion?
For
eac
h on
e se
lect
ed, g
ive
a br
ief d
escr
iptio
n of
wha
t is
invo
lved
.
Le
ve
r
R
eq
uir
ed
(Y
/N)
D
esc
rip
tio
n o
f u
se
Rule
mak
ing
N
Re
gula
tory
ove
rsig
ht
N
Dire
ct e
xpen
ditu
res
/ pro
cure
men
t Y
Fi
nanc
ial i
ncen
tives
N
In
form
atio
n ga
ther
ing
and
diss
emin
atio
n,
Nco
nven
ing
/ fac
ilita
tion
and
advo
cacy
KE
Y I
MP
LE
ME
NT
AT
ION
IN
FO
RM
AT
ION
Step
1
Enga
ge m
ayor
and
rele
vant
dep
artm
ents
Step
2
Det
erm
ine
fund
ing
targ
et fo
r ene
rgy
effi c
ienc
y pr
ojec
ts
Step
3
Esta
blis
h m
etho
dolo
gy fo
r set
ting
asid
e fu
nd, e
.g. r
evol
ving
fund
from
bud
get,
part
of y
early
city
budg
et, e
tc.
Step
4
Esta
blis
h w
hich
ene
rgy
effi c
ienc
y pr
ojec
t will
be
fund
ed b
y th
e ca
pita
l fun
d, i.
e., t
hrou
gh a
stu
dy
co
nduc
ted
and
revi
ewed
by
a co
mm
ittee
, ove
rarc
hing
city
pla
n, e
tc.
Mon
itorin
g
Qua
ntifi
catio
n of
per
cent
age
of b
udge
t allo
cate
d to
ene
rgy
effi c
ienc
y up
grad
es a
nd p
erce
ntag
e
al
loca
ted
to e
ach
sect
or.
Goo
d Pr
actic
e Ti
ps
Expl
ore
all f
undi
ng o
ptio
ns –
the
city
doe
s no
t nec
essa
rily
have
to s
et a
side
a s
et p
erce
ntag
e of
the
budg
et e
very
yea
r. It
is a
lso
poss
ible
to e
stab
lish
diff e
rent
way
s of
fund
ing
ener
gy e
ffi ci
ency
retr
ofi ts
in b
uild
ings
suc
h as
a ro
lling
fund
and
oth
er fi
nanc
ial m
echa
nism
s.
AT
TR
IBU
TE
S
Se
cto
r
Build
ings
Fin
an
cin
g
Perc
enta
ge o
f city
bud
get o
r fun
d,
rolli
ng fu
nd, o
r sim
ilar
Te
rm
< 1
year
1 –
3 ye
ars
3 –
5 ye
ars
5 –
10 y
ears
En
erg
y S
av
ing
s P
ote
nti
al
Tech
nica
l sav
ings
ass
ocia
ted
with
ea
ch p
roje
ct c
an b
e ca
lcul
ated
.
Pro
jec
t T
ime
fra
me
2 m
onth
s mob
iliza
tion,
dep
endi
ng
on th
e bu
dget
cyc
le, t
here
afte
r on
goin
g to
mai
ntai
n fu
nds.
Co
-be
ne
fi ts
Carb
on R
educ
tion
Ope
ratio
nal E
nerg
y Sa
ving
s A
ir Q
ualit
yRe
duce
d Tr
avel
Tim
ePu
blic
Saf
ety
& H
ealth
Empl
oym
ent
Was
te R
educ
tion
Wat
er U
se R
educ
tion
Cons
iste
ncy
of E
nerg
y Su
pply
Acce
ss to
Ene
rgy
Capi
tal e
xpen
ditu
re
shou
ld b
e al
low
ed fo
r in
the
city
bud
get.
CA
PIT
AL
PL
AN
NIN
G F
OR
EN
ER
GY
EF
FIC
IEN
CY
RE
TR
OF
ITS
33
FIN
AN
CIA
L I
MP
LIC
AT
ION
S
CA
SE
ST
UD
IES
Ex
am
ple
R
efe
ren
ce
Toro
nto
Atm
osph
eric
Fun
d, To
ront
o, C
anad
aw
ww
.toro
nto.
ca/t
af/in
dex.
htm
Mun
icip
al E
nerg
y Fu
nd, A
nn A
rbor
, USA
UN
Hab
itat,
ICLE
I, Su
stai
nabl
e U
rban
Ene
rgy
Plan
ning
ww
w.
a2go
v.or
g/go
vern
men
t/ub
licse
rvic
es/s
yste
ms_
pla
nnin
g/en
ergy
/Pag
es/E
nerg
yFun
d.as
px
Imp
lic
ati
on
Imp
ac
t in
Qu
ez
on
Cit
y
Capi
tal b
udge
t set
asi
de fo
r ene
rgy
effi c
ienc
y up
grad
es.
Poss
ible
impa
ct if
ene
rgy
effi c
ienc
y fu
nds
are
esta
blis
hed.
Init
ial
Ass
ess
me
nt
Doe
s th
e ci
ty h
ave
a si
ngle
set
of p
rocu
rem
ent
guid
elin
es o
r pro
cure
men
t gui
delin
es fo
r diff
eren
t de
part
men
ts?
No.
If so
, wha
t wer
e th
e su
cces
ses
and
failu
res
of th
e m
easu
re?
n/a
Info
rma
tio
n R
eq
uir
em
en
ts
Wha
t is
the
curr
ent b
udge
t for
the
city
and
wha
t, if
any,
are
the
budg
etar
y sh
ortf
alls
/ ex
cess
es?
9.4
billi
on P
esos
, bal
ance
d bu
dget
.
Wha
t pot
entia
l ene
rgy
effi c
ienc
y up
grad
e pr
ojec
ts
are
ther
e in
mun
icip
al b
uild
ings
?Co
olin
g, li
ghtin
g.
Doe
s th
e ci
ty c
urre
ntly
con
side
r mun
icpa
l bui
ldin
gs
and
wha
t ene
rgy
effi c
ienc
y up
grad
es a
re re
quire
d?N
o, re
fi ts
base
d on
end
-of-l
ife.
Da
ta R
eq
uir
em
en
ts
How
muc
h m
oney
can
the
city
pro
vide
on
a ye
arly
ba
sis
for e
nerg
y effi
cie
ncy
upgr
ades
in b
uild
ings
?M
ayor
to d
ecid
e.
How
muc
h m
oney
doe
s th
e ci
ty c
urre
ntly
pro
vide
for
ener
gy e
ffi ci
ency
retr
ofi ts
in m
unic
ipal
bui
ldin
gs?
Curr
ently
no
budg
et a
llow
ance
.
AP
PR
AIS
AL
34
DE
SC
RIP
TIO
N
Ove
rvie
w o
f rec
omm
enda
tion
Ener
gy la
belli
ng fo
r ene
rgy
cons
umin
g pr
oduc
ts to
sh
ow h
ow e
ffi ci
ent t
he p
rodu
ct is
whe
n co
mpa
rted
to
‘bes
t in
clas
s’ en
ergy
con
sum
ptio
n of
sim
ilar
prod
ucts
.
Exam
ples
U
.S. E
nerg
y St
ar -
appl
ied
to m
ost o
ffi ce
pro
udct
s
such
as
com
pute
rs, p
rinte
rs, p
hoto
copi
ers,
etc
(w
ww
.ene
rgys
tar.g
ov).
INS
TIT
UT
ION
AL
RE
QU
IRE
ME
NT
S
Key
Acto
rs
1.
May
or’s
Offi
ce,
2.
Pro
cure
men
t / B
uyin
g O
ffi ce
.
Leve
l of E
ff ort
Very
low
.
CA
TE
GO
RY
OF
IN
FL
UE
NC
E /
CA
PA
CIT
Y T
O A
CT
Whi
ch o
f the
bel
ow w
ill th
e m
unic
ipal
ity n
eed
to e
nact
this
reco
mm
enda
tion?
For
eac
h on
e se
lect
ed, g
ive
a br
ief d
escr
iptio
n of
wha
t is
invo
lved
.
Le
ve
r
R
eq
uir
ed
(Y
/N)
D
esc
rip
tio
n o
f u
se
Rule
mak
ing
N
Re
gula
tory
ove
rsig
ht
N
Dire
ct e
xpen
ditu
res
/ pro
cure
men
t Y
Fina
ncia
l inc
entiv
es
N
Info
rmat
ion
gath
erin
g an
d di
ssem
inat
ion,
N
conv
enin
g / f
acili
tatio
n an
d ad
voca
cy
AT
TR
IBU
TE
S
Se
cto
r
Org
aniz
atio
nal M
anag
emen
t
Fin
an
cin
g
Unq
uant
ifi ab
le
Te
rm
< 1
year
1 –
3 ye
ars
3 –
5 ye
ars
5 –
10 y
ears
En
erg
y S
av
ing
s P
ote
nti
al
10%
- 20
%
Pro
jec
t T
ime
fra
me
3 m
onth
s fo
r mob
iliza
tion,
on
goin
g to
car
ry o
ut e
ff ort
.
Co
-be
ne
fi ts
Carb
on R
educ
tion
Ope
ratio
nal E
nerg
y Sa
ving
s A
ir Q
ualit
yRe
duce
d Tr
avel
Tim
ePu
blic
Saf
ety
& H
ealth
Empl
oym
ent
Was
te R
educ
tion
Wat
er U
se R
educ
tion
Cons
iste
ncy
of E
nerg
y Su
pply
Acce
ss to
Ene
rgy
Adva
nced
pro
cure
men
t gu
idel
ines
.
KE
Y I
MP
LE
ME
NT
AT
ION
IN
FO
RM
AT
ION
Step
1
Iden
tify
key
offi c
e en
gage
d in
est
ablis
hing
pro
cure
men
t rul
es a
nd g
uide
lines
.
Step
2
Esta
blis
h ra
nge
of e
nerg
y co
nsum
ing
offi c
e eq
uipm
ent.
Step
3
Iden
tify
ener
gy la
belli
ng s
chem
es o
pera
ting
in c
ount
ry (s
ee b
elow
).
Step
4
Esta
blis
h st
anda
r, e.
g., E
nerg
y St
ar, o
r rat
ing,
e.g
., EU
‘A’ R
atin
g, to
be
appl
ied
for e
ach
type
of o
ffi ce
equi
pmen
t.
Mon
itorin
g
Num
ber o
f app
lianc
es /
maj
or e
quip
men
t pro
cure
d us
ing
the
new
sta
ndar
ds.
Goo
d Pr
actic
e Ti
ps
For a
n ov
ervi
ew o
f int
erna
tiona
l sch
emes
, see
ww
w.e
nerg
ylab
el.o
rg.tw
/inde
x_en
.asp
.
AD
VA
NC
ED
EN
ER
GY
EF
FIC
IEN
CY
PR
OC
UR
EM
EN
T
35
Ex
am
ple
R
efe
ren
ce
U.S
. Ene
rgy
Star
ww
w.e
nerg
ysta
r.gov
E.U
. Ene
rgy
Labe
lw
ww
.ene
rgy.
eu/f
ocus
/ene
rgy-
labe
l.php
The
Phili
ppin
es E
nerg
y La
bel
proj
ects
.wri.
org/
sd-p
ams-
data
base
/phi
llipi
nes/
ener
gy-
labe
l-req
uire
men
t
Japa
n En
ergy
Lab
elht
tp://
ww
w.e
ccj.o
r.jp/
eng/
e320
2ene
rgy_
savi
ng.h
tml
FIN
AN
CIA
L I
MP
LIC
AT
ION
S
Imp
lic
ati
on
Imp
ac
t in
Qu
ez
on
Cit
y
Proc
urem
ent o
f app
lianc
es.
Ener
gy e
ffi ci
ent
appl
ican
ces
may
inc
ur h
ighe
r ca
pita
l co
sts.
Cost
sav
ings
dur
ing
oper
atio
n.En
ergy
effi
cie
nt
appl
ianc
es
will
ha
ve
ener
gy
cost
sa
ving
s de
pend
ing
on t
he l
evel
of
ener
gy e
ffi ci
ency
im
prov
emen
t.
Init
ial
Ass
ess
me
nt
Has
a s
imila
r ini
tiativ
e al
read
y be
en im
plem
ente
d?
No.
If so
, how
was
it im
plem
ente
d an
d w
ere
ther
e an
y ke
y su
cces
s / f
ailu
re fa
ctor
s id
entifi
ed?
n/a
Info
rma
tio
n R
eq
uir
em
en
ts
Are
ther
e ex
istin
g st
anda
rds
for e
nerg
y la
belli
ng in
th
e co
untr
y?Ye
s, fr
idge
s an
d ai
r con
ditio
ners
are
labe
lled.
Is th
ere
acce
ss to
pro
duct
s w
ith in
tern
atio
nally
ac
cept
ed e
nerg
y pe
rfor
man
ce s
tand
ards
?Ye
s
CA
SE
ST
UD
IES
AP
PR
AIS
AL
36
DE
SC
RIP
TIO
N
Ove
rvie
w o
f rec
omm
enda
tion
Capi
tal c
ost m
ay b
e a
smal
l com
pone
nt o
f the
life
w
hole
life
cos
t of e
nerg
y co
nsum
ing
equi
pmen
t.
Adop
ting
who
le li
fe c
ostin
g en
able
s a
com
paris
on
of a
ll co
sts
and
expe
nses
ass
ocia
ted
with
the
pu
rcha
se o
nd o
pera
tion
of e
uqip
men
t. It
is
reco
mm
ende
d th
at Q
uezo
n Ci
ty d
evel
op a
nd
impl
emen
t pro
cure
men
t gui
delin
es th
at re
uqire
Li
fe C
ycle
Cos
ting
to a
naly
se th
e fu
ll co
st o
f eac
h
optio
n un
der c
onsi
dera
tion.
Exam
ples
En
ergy
usi
ng p
lan,
mac
hine
ry, fi
xtu
res,
and
eq
uipm
ent c
an a
ll be
ana
lyse
d us
ing
Life
Cyc
le
Cost
ing.
INS
TIT
UT
ION
AL
RE
QU
IRE
ME
NT
S
Key
Acto
rs
1.
The
May
or a
nnou
nces
and
lead
s,
2. A
ll de
part
emnt
s in
volv
ed in
pro
cure
men
t, es
peci
ally
the
B
iddi
ng +
Aw
ards
Com
mitt
ee.
Leve
l of E
ff ort
Low
- re
quire
s in
itial
est
ablis
hmen
t of g
uide
lines
and
prot
ocol
to d
isse
min
ate
acro
ss c
ity d
epar
tmen
ts, d
epen
ding
on n
eeds
.
CA
TE
GO
RY
OF
IN
FL
UE
NC
E /
CA
PA
CIT
Y T
O A
CT
Whi
ch o
f the
bel
ow w
ill th
e m
unic
ipal
ity n
eed
to e
nact
this
reco
mm
enda
tion?
For
eac
h on
e se
lect
ed, g
ive
a br
ief d
escr
iptio
n of
wha
t is
invo
lved
.
Le
ve
r
R
eq
uir
ed
(Y
/N)
D
esc
rip
tio
n o
f u
se
Rule
mak
ing
N
Re
gula
tory
ove
rsig
ht
N
Dire
ct e
xpen
ditu
res
/ pro
cure
men
t Y
Fi
nanc
ial i
ncen
tives
N
In
form
atio
n ga
ther
ing
and
diss
emin
atio
n,
Nco
nven
ing
/ fac
ilita
tion
and
advo
cacy
AT
TR
IBU
TE
S
Se
cto
r
Build
ings
Fin
an
cin
g
n/a
Te
rm
< 1
year
1 –
3 ye
ars
3 –
5 ye
ars
5 –
10 y
ears
Se
cto
r E
ne
rgy
Sa
vin
gs
Po
ten
tia
l
10%
Pro
jec
t T
ime
fra
me
2 m
onth
s m
obili
zatio
n, o
ngoi
ng
ther
eaft
er to
mai
ntai
n pr
ogra
m.
Co
-be
ne
fi ts
Car
bon
Redu
ctio
nO
pera
tiona
l Ene
rgy
Savi
ngs
Air
Qua
lity
Redu
ced
Trav
el T
ime
Publ
ic S
afet
y &
Hea
lthEm
ploy
men
tW
aste
Red
uctio
nW
ater
Use
Red
uctio
nCo
nsis
tenc
y of
Ene
rgy
Supp
lyAc
cess
to E
nerg
y
Will
requ
ire n
ew
proc
urem
ent g
uide
lines
an
d po
ssib
le a
dditi
onal
ex
pend
iture
on
capt
al
whe
re L
CC in
dica
tes
who
le
lifec
ycle
sav
ings
cou
ld b
e m
ade.
KE
Y I
MP
LE
ME
NT
AT
ION
IN
FO
RM
AT
ION
Step
1
Enga
ge th
e M
ayor
and
rele
vant
dep
artm
ents
.
Step
2
Det
erm
ine
how
the
guid
elin
es s
houl
d be
dev
elop
ed:
cent
rally
or s
epar
atel
y fo
r eac
h re
lava
nt
de
part
men
t. St
anda
rd c
alcu
latio
ns s
houl
d be
dev
ised
that
con
side
r: ca
pita
l cos
t, m
aint
enan
ce c
osts
,
repl
acem
ent p
arts
/ co
nsum
able
s, en
ergy
cos
ts, t
otal
life
span
of e
quip
men
t.
Step
3
App
oint
a re
spon
sibl
e pa
rty
for t
he g
uide
lines
and
est
ablis
h a
timef
ram
e fo
r the
ir co
mpl
etio
n an
d
im
plem
enta
tion.
PR
OC
UR
EM
EN
T G
UID
EL
INE
S F
OR
LIF
E C
YC
LE
CO
ST
ING
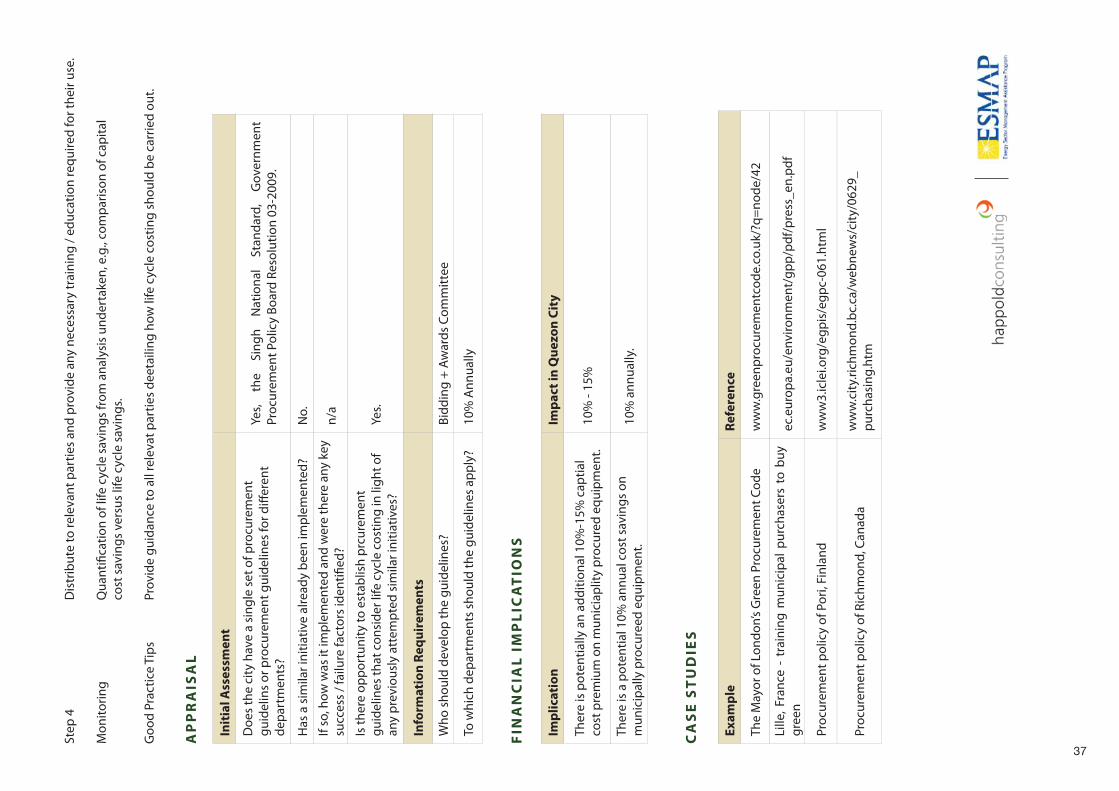
37
Ex
am
ple
R
efe
ren
ce
The
May
or o
f Lon
don’
s G
reen
Pro
cure
men
t Cod
ew
ww
.gre
enpr
ocur
emen
tcod
e.co
.uk/
?q=n
ode/
42
Lille
, Fra
nce
- tr
aini
ng m
unic
ipal
pur
chas
ers
to b
uy
gree
nec
.eur
opa.
eu/e
nviro
nmen
t/gp
p/pd
f/pr
ess_
en.p
df
Proc
urem
ent p
olic
y of
Por
i, Fi
nlan
dw
ww
3.ic
lei.o
rg/e
gpis
/egp
c-06
1.ht
ml
Proc
urem
ent p
olic
y of
Ric
hmon
d, C
anad
aw
ww
.city
.rich
mon
d.bc
.ca/
web
new
s/ci
ty/0
629_
purc
hasi
ng.h
tm
AP
PR
AIS
AL
Init
ial
Ass
ess
me
nt
Doe
s th
e ci
ty h
ave
a si
ngle
set
of p
rocu
rem
ent
guid
elin
s or
pro
cure
men
t gui
delin
es fo
r diff
eren
t de
part
men
ts?
Yes,
the
Sing
h N
atio
nal
Stan
dard
, G
over
nmen
t Pr
ocur
emen
t Pol
icy
Boar
d Re
solu
tion
03-2
009.
Has
a s
imila
r ini
tiativ
e al
read
y be
en im
plem
ente
d?N
o.
If so
, how
was
it im
plem
ente
d an
d w
ere
ther
e an
y ke
y su
cces
s / f
ailu
re fa
ctor
s id
entifi
ed?
n/a
Is th
ere
oppo
rtun
ity to
est
ablis
h pr
cure
men
t gu
idel
ines
that
con
side
r life
cyc
le c
ostin
g in
ligh
t of
any
prev
ious
ly a
ttem
pted
sim
ilar i
nitia
tives
?Ye
s.
Info
rma
tio
n R
eq
uir
em
en
ts
Who
sho
uld
deve
lop
the
guid
elin
es?
Bidd
ing
+ Aw
ards
Com
mitt
ee
To w
hich
dep
artm
ents
sho
uld
the
guid
elin
es a
pply
?10
% A
nnua
lly
FIN
AN
CIA
L I
MP
LIC
AT
ION
S
Imp
lic
ati
on
Imp
ac
t in
Qu
ez
on
Cit
y
Ther
e is
pot
entia
lly a
n ad
ditio
nal 1
0%-1
5% c
aptia
l co
st p
rem
ium
on
mun
icia
plity
pro
cure
d eq
uipm
ent.
10%
- 15
%
Ther
e is
a p
oten
tial 1
0% a
nnua
l cos
t sav
ings
on
mun
icip
ally
pro
cure
ed e
quip
men
t.10
% a
nnua
lly.
CA
SE
ST
UD
IES
Step
4
Dis
trib
ute
to re
leva
nt p
artie
s an
d pr
ovid
e an
y ne
cess
ary
trai
ning
/ ed
ucat
ion
requ
ired
for t
heir
use.
M
onito
ring
Qua
ntifi
catio
n of
life
cyc
le s
avin
gs fr
om a
naly
sis
unde
rtak
en, e
.g.,
com
paris
on o
f cap
ital
cost
sav
ings
ver
sus
life
cycl
e sa
ving
s.
Goo
d Pr
actic
e Ti
ps
Prov
ide
guid
ance
to a
ll re
leva
t par
ties
deet
ailin
g ho
w li
fe c
ycle
cos
ting
shou
ld b
e ca
rrie
d ou
t.
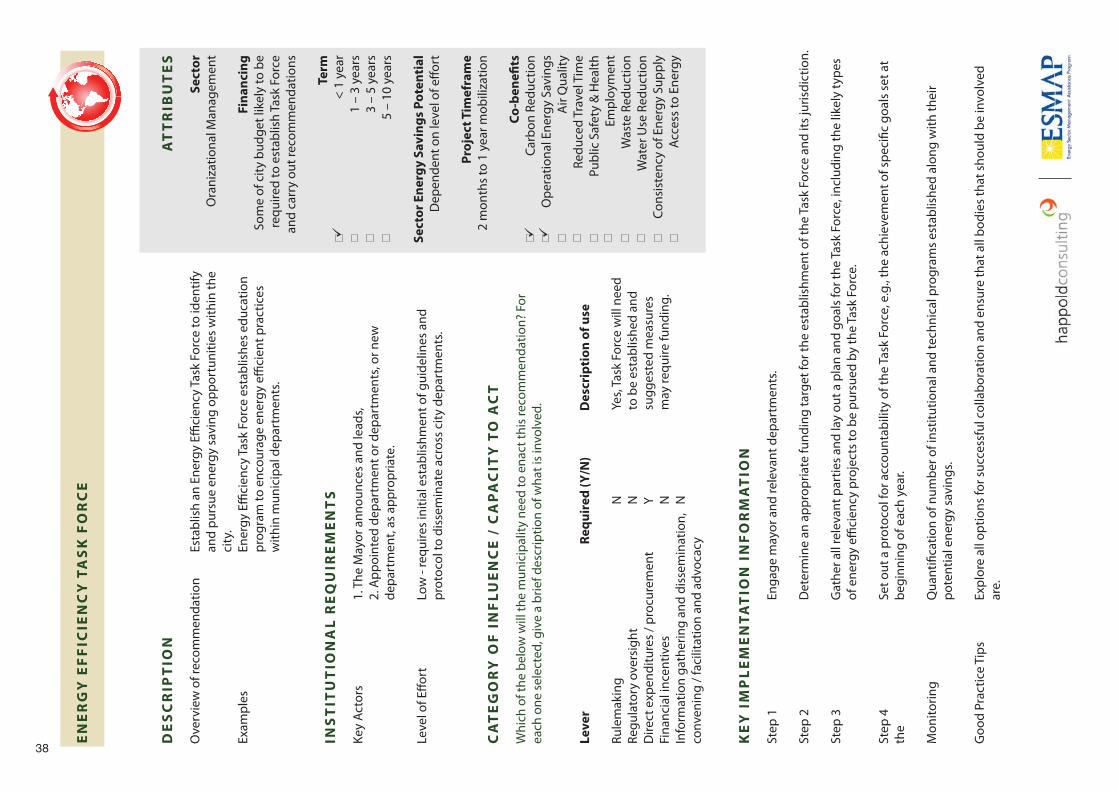
38
DE
SC
RIP
TIO
N
Ove
rvie
w o
f rec
omm
enda
tion
Esta
blis
h an
Ene
rgy
Effi c
ienc
y Ta
sk F
orce
to id
entif
y
and
purs
ue e
nerg
y sa
ving
opp
ortu
nitie
s w
ithin
the
ci
ty.
Exam
ples
En
ergy
Effi
cien
cy T
ask
Forc
e es
tabl
ishe
s ed
ucat
ion
pr
ogra
m to
enc
oura
ge e
nerg
y effi
cie
nt p
ract
ices
w
ithin
mun
icip
al d
epar
tmen
ts.
INS
TIT
UT
ION
AL
RE
QU
IRE
ME
NT
S
Key
Acto
rs
1.
The
May
or a
nnou
nces
and
lead
s,
2. A
ppoi
nted
dep
artm
ent o
r dep
artm
ents
, or n
ew
depa
rtm
ent,
as a
ppro
pria
te.
Leve
l of E
ff ort
Low
- re
quire
s in
itial
est
ablis
hmen
t of g
uide
lines
and
prot
ocol
to d
isse
min
ate
acro
ss c
ity d
epar
tmen
ts.
CA
TE
GO
RY
OF
IN
FL
UE
NC
E /
CA
PA
CIT
Y T
O A
CT
Whi
ch o
f the
bel
ow w
ill th
e m
unic
ipal
ity n
eed
to e
nact
this
reco
mm
enda
tion?
For
ea
ch o
ne s
elec
ted,
giv
e a
brie
f des
crip
tion
of w
hat i
s in
volv
ed.
Le
ve
r
R
eq
uir
ed
(Y
/N)
D
esc
rip
tio
n o
f u
se
Rule
mak
ing
N
Re
gula
tory
ove
rsig
ht
N
Dire
ct e
xpen
ditu
res
/ pro
cure
men
t Y
Fi
nanc
ial i
ncen
tives
N
In
form
atio
n ga
ther
ing
and
diss
emin
atio
n,
Nco
nven
ing
/ fac
ilita
tion
and
advo
cacy
AT
TR
IBU
TE
S
Se
cto
r
Ora
niza
tiona
l Man
agem
ent
Fin
an
cin
g
Som
e of
city
bud
get l
ikel
y to
be
requ
ired
to e
stab
lish
Task
For
ce
and
carr
y ou
t rec
omm
enda
tions
Te
rm
< 1
year
1 –
3 ye
ars
3 –
5 ye
ars
5 –
10 y
ears
Se
cto
r E
ne
rgy
Sa
vin
gs
Po
ten
tia
l
Dep
ende
nt o
n le
vel o
f eff o
rt
Pro
jec
t T
ime
fra
me
2 m
onth
s to
1 y
ear m
obili
zatio
n
Co
-be
ne
fi ts
Car
bon
Redu
ctio
nO
pera
tiona
l Ene
rgy
Savi
ngs
Air
Qua
lity
Redu
ced
Trav
el T
ime
Publ
ic S
afet
y &
Hea
lthEm
ploy
men
tW
aste
Red
uctio
nW
ater
Use
Red
uctio
nCo
nsis
tenc
y of
Ene
rgy
Supp
lyAc
cess
to E
nerg
y
Yes,
Task
For
ce w
ill n
eed
to b
e es
tabl
ishe
d an
d su
gges
ted
mea
sure
s m
ay re
quire
fund
ing.
KE
Y I
MP
LE
ME
NT
AT
ION
IN
FO
RM
AT
ION
Step
1
Enga
ge m
ayor
and
rele
vant
dep
artm
ents
.
Step
2
Det
erm
ine
an a
ppro
pria
te fu
ndin
g ta
rget
for t
he e
stab
lishm
ent o
f the
Tas
k Fo
rce
and
its ju
risdi
ctio
n.
Step
3
Gat
her a
ll re
leva
nt p
artie
s an
d la
y ou
t a p
lan
and
goal
s fo
r the
Tas
k Fo
rce,
incl
udin
g th
e lik
ely
type
s
of
ene
rgy
effi c
ienc
y pr
ojec
ts to
be
purs
ued
by th
e Ta
sk F
orce
.
Step
4
Set o
ut a
pro
toco
l for
acc
ount
abili
ty o
f the
Tas
k Fo
rce,
e.g
., th
e ac
hiev
emen
t of s
peci
fi c g
oals
set
at
the
be
ginn
ing
of e
ach
year
.
Mon
itorin
g
Qua
ntifi
catio
n of
num
ber o
f ins
titut
iona
l and
tech
nica
l pro
gram
s es
tabl
ishe
d al
ong
with
thei
r
po
tent
ial e
nerg
y sa
ving
s.
Goo
d Pr
actic
e Ti
ps
Expl
ore
all o
ptio
ns fo
r suc
cess
ful c
olla
bora
tion
and
ensu
re th
at a
ll bo
dies
that
sho
uld
be in
volv
ed
ar
e.
EN
ER
GY
EF
FIC
IEN
CY
TA
SK
FO
RC
E
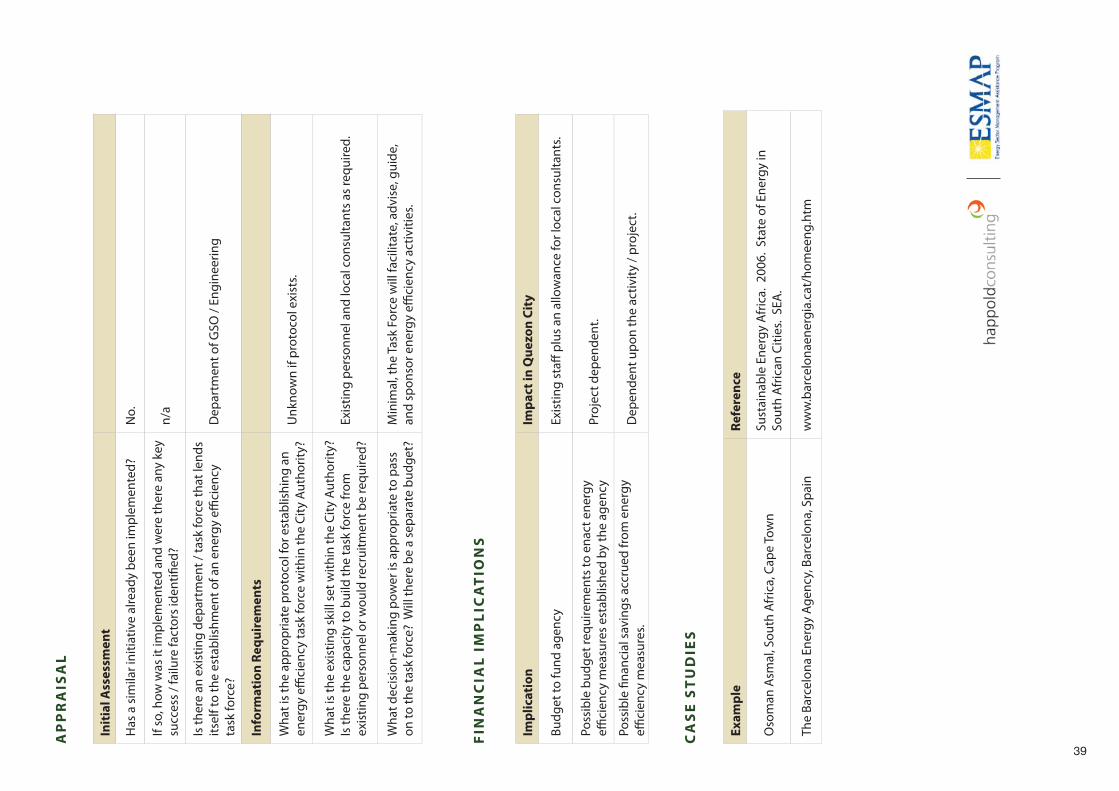
39E
xa
mp
le
Re
fere
nce
Oso
man
Asm
al, S
outh
Afr
ica,
Cap
e To
wn
Sust
aina
ble
Ener
gy A
fric
a. 2
006.
Sta
te o
f Ene
rgy
in
Sout
h A
fric
an C
ities
. SE
A.
The
Barc
elon
a En
ergy
Age
ncy,
Bar
celo
na, S
pain
ww
w.b
arce
lona
ener
gia.
cat/
hom
eeng
.htm
CA
SE
ST
UD
IES
FIN
AN
CIA
L I
MP
LIC
AT
ION
S
Imp
lic
ati
on
Imp
ac
t in
Qu
ez
on
Cit
y
Budg
et to
fund
age
ncy
Exis
ting
staff
plu
s an
allo
wan
ce fo
r loc
al c
onsu
ltant
s.
Poss
ible
bud
get r
equi
rem
ents
to e
nact
ene
rgy
effi c
ienc
y m
easu
res
esta
blis
hed
by th
e ag
ency
Proj
ect d
epen
dent
.
Poss
ible
fi na
ncia
l sav
ings
acc
rued
from
ene
rgy
effi c
ienc
y m
easu
res.
Dep
ende
nt u
pon
the
activ
ity /
proj
ect.
AP
PR
AIS
AL
Init
ial
Ass
ess
me
nt
Has
a s
imila
r ini
tiativ
e al
read
y be
en im
plem
ente
d?N
o.
If so
, how
was
it im
plem
ente
d an
d w
ere
ther
e an
y ke
y su
cces
s / f
ailu
re fa
ctor
s id
entifi
ed?
n/a
Is th
ere
an e
xist
ing
depa
rtm
ent /
task
forc
e th
at le
nds
itsel
f to
the
esta
blis
hmen
t of a
n en
ergy
effi
cien
cy
task
forc
e?D
epar
tmen
t of G
SO /
Engi
neer
ing
Info
rma
tio
n R
eq
uir
em
en
ts
Wha
t is
the
appr
opria
te p
roto
col f
or e
stab
lishi
ng a
n en
ergy
effi
cien
cy ta
sk fo
rce
with
in th
e Ci
ty A
utho
rity?
Unk
now
n if
prot
ocol
exi
sts.
Wha
t is
the
exis
ting
skill
set
with
in th
e Ci
ty A
utho
rity?
Is
ther
e th
e ca
paci
ty to
bui
ld th
e ta
sk fo
rce
from
ex
istin
g pe
rson
nel o
r wou
ld re
crui
tmen
t be
requ
ired?
Exis
ting
pers
onne
l and
loca
l con
sulta
nts
as re
quire
d.
Wha
t dec
isio
n-m
akin
g po
wer
is a
ppro
pria
te to
pas
s on
to th
e ta
sk fo
rce?
Will
ther
e be
a s
epar
ate
budg
et?
Min
imal
, the
Tas
k Fo
rce
will
faci
litat
e, a
dvis
e, g
uide
, an
d sp
onso
r ene
rgy
effi c
ienc
y ac
tiviti
es.
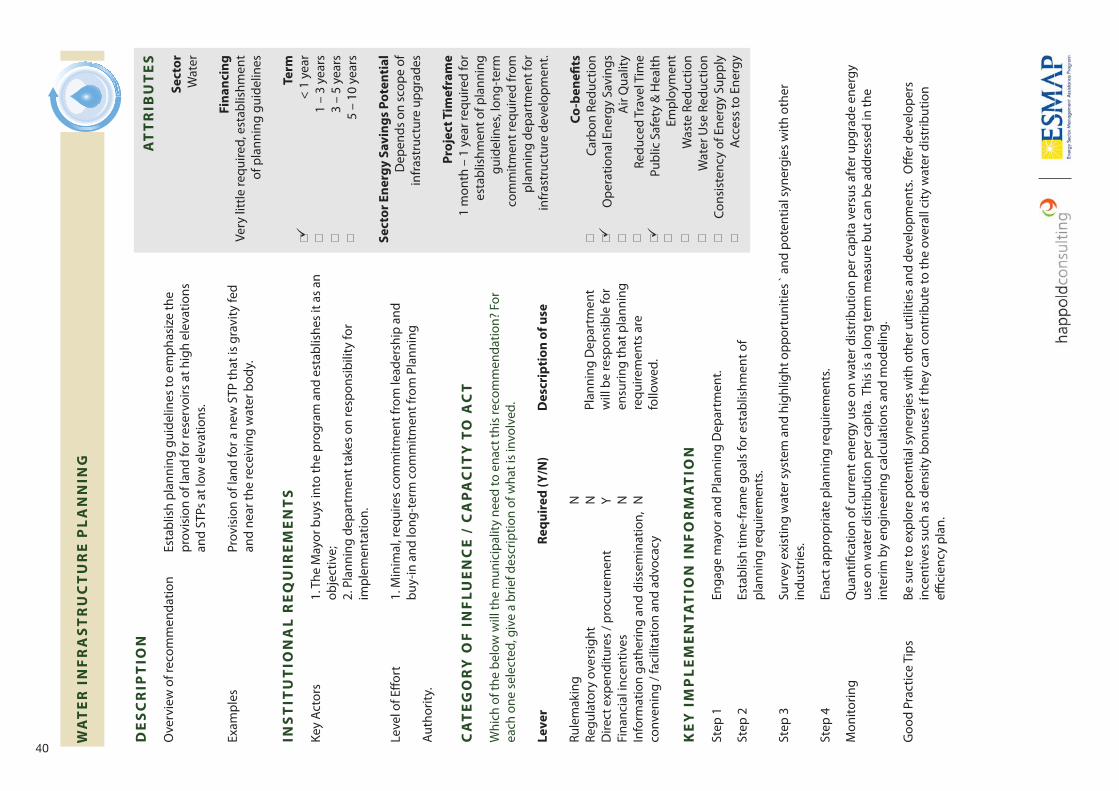
40
DE
SC
RIP
TIO
N
Ove
rvie
w o
f rec
omm
enda
tion
Esta
blis
h pl
anni
ng g
uide
lines
to e
mph
asiz
e th
e
prov
isio
n of
land
for r
eser
voirs
at h
igh
elev
atio
ns
and
STPs
at l
ow e
leva
tions
.
Exam
ples
Pr
ovis
ion
of la
nd fo
r a n
ew S
TP th
at is
gra
vity
fed
an
d ne
ar th
e re
ceiv
ing
wat
er b
ody.
INS
TIT
UT
ION
AL
RE
QU
IRE
ME
NT
S
Key
Acto
rs
1.
The
May
or b
uys
into
the
prog
ram
and
est
ablis
hes
it as
an
obje
ctiv
e;
2. P
lann
ing
depa
rtm
ent t
akes
on
resp
onsi
bilit
y fo
r
im
plem
enta
tion.
Leve
l of E
ff ort
1. M
inim
al, r
equi
res
com
mitm
ent f
rom
lead
ersh
ip a
nd
bu
y-in
and
long
-ter
m c
omm
itmen
t fro
m P
lann
ing
Auth
ority
.
CA
TE
GO
RY
OF
IN
FL
UE
NC
E /
CA
PA
CIT
Y T
O A
CT
Whi
ch o
f the
bel
ow w
ill th
e m
unic
ipal
ity n
eed
to e
nact
this
reco
mm
enda
tion?
For
ea
ch o
ne s
elec
ted,
giv
e a
brie
f des
crip
tion
of w
hat i
s in
volv
ed.
Le
ve
r
R
eq
uir
ed
(Y
/N)
D
esc
rip
tio
n o
f u
se
Rule
mak
ing
N
Re
gula
tory
ove
rsig
ht
N
Dire
ct e
xpen
ditu
res
/ pro
cure
men
t Y
Fina
ncia
l inc
entiv
es
N
Info
rmat
ion
gath
erin
g an
d di
ssem
inat
ion,
Nco
nven
ing
/ fac
ilita
tion
and
advo
cacy
KE
Y I
MP
LE
ME
NT
AT
ION
IN
FO
RM
AT
ION
Step
1
Enga
ge m
ayor
and
Pla
nnin
g D
epar
tmen
t.
Step
2
Esta
blis
h tim
e-fr
ame
goal
s fo
r est
ablis
hmen
t of
pl
anni
ng re
quire
men
ts.
Step
3
Surv
ey e
xist
ing
wat
er s
yste
m a
nd h
ighl
ight
opp
ortu
nitie
s ` a
nd p
oten
tial s
yner
gies
with
oth
er
indu
strie
s.
Step
4
Enac
t app
ropr
iate
pla
nnin
g re
quire
men
ts.
Mon
itorin
g
Qua
ntifi
catio
n of
cur
rent
ene
rgy
use
on w
ater
dis
trib
utio
n pe
r cap
ita v
ersu
s af
ter u
pgra
de e
nerg
y
use
on w
ater
dis
trib
utio
n pe
r cap
ita. T
his
is a
long
term
mea
sure
but
can
be
addr
esse
d in
the
in
terim
by
engi
neer
ing
calc
ulat
ions
and
mod
elin
g.
Goo
d Pr
actic
e Ti
ps
Be s
ure
to e
xplo
re p
oten
tial s
yner
gies
with
oth
er u
tiliti
es a
nd d
evel
opm
ents
. O
ff er d
evel
oper
s
in
cent
ives
suc
h as
den
sity
bon
uses
if th
ey c
an c
ontr
ibut
e to
the
over
all c
ity w
ater
dis
trib
utio
n
effi c
ienc
y pl
an.
AT
TR
IBU
TE
S
Se
cto
r
Wat
er
Fin
an
cin
g
Very
litt
le re
quire
d, e
stab
lishm
ent
of p
lann
ing
guid
elin
es
Te
rm
< 1
year
1 –
3 ye
ars
3 –
5 ye
ars
5 –
10 y
ears
Se
cto
r E
ne
rgy
Sa
vin
gs
Po
ten
tia
l
Dep
ends
on
scop
e of
in
fras
truc
ture
upg
rade
s
Pro
jec
t T
ime
fra
me
1 m
onth
– 1
yea
r req
uire
d fo
r es
tabl
ishm
ent o
f pla
nnin
g gu
idel
ines
, lon
g-te
rm
com
mitm
ent r
equi
red
from
pl
anni
ng d
epar
tmen
t for
in
fras
truc
ture
dev
elop
men
t.
Co
-be
ne
fi ts
Car
bon
Redu
ctio
nO
pera
tiona
l Ene
rgy
Savi
ngs
Air
Qua
lity
Redu
ced
Trav
el T
ime
Publ
ic S
afet
y &
Hea
lthEm
ploy
men
tW
aste
Red
uctio
nW
ater
Use
Red
uctio
nCo
nsis
tenc
y of
Ene
rgy
Supp
lyAc
cess
to E
nerg
y
Plan
ning
Dep
artm
ent
will
be
resp
onsi
ble
for
ensu
ring
that
pla
nnin
g re
quire
men
ts a
re
follo
wed
.
WA
TE
R I
NF
RA
ST
RU
CT
UR
E P
LA
NN
ING
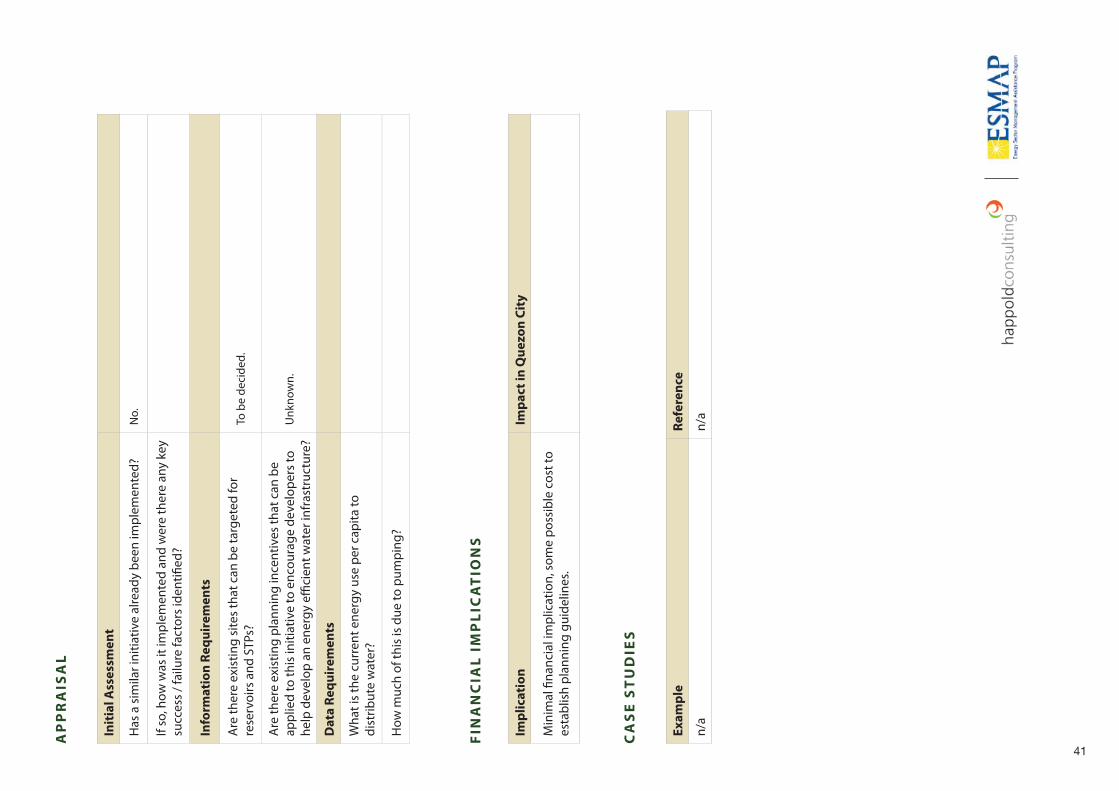
41
Ex
am
ple
R
efe
ren
ce
n/a
n/a
CA
SE
ST
UD
IES
FIN
AN
CIA
L I
MP
LIC
AT
ION
S
Imp
lic
ati
on
Imp
ac
t in
Qu
ez
on
Cit
y
Min
imal
fi na
ncia
l im
plic
atio
n, s
ome
poss
ible
cos
t to
esta
blis
h pl
anni
ng g
uide
lines
.
AP
PR
AIS
AL
Init
ial
Ass
ess
me
nt
Has
a s
imila
r ini
tiativ
e al
read
y be
en im
plem
ente
d?N
o.
If so
, how
was
it im
plem
ente
d an
d w
ere
ther
e an
y ke
y su
cces
s / f
ailu
re fa
ctor
s id
entifi
ed?
Info
rma
tio
n R
eq
uir
em
en
ts
Are
ther
e ex
istin
g si
tes
that
can
be
targ
eted
for
rese
rvoi
rs a
nd S
TPs?
To b
e de
cide
d.
Are
ther
e ex
istin
g pl
anni
ng in
cent
ives
that
can
be
appl
ied
to th
is in
itiat
ive
to e
ncou
rage
dev
elop
ers
to
help
dev
elop
an
ener
gy e
ffi ci
ent w
ater
infr
astr
uctu
re?
Unk
now
n.
Da
ta R
eq
uir
em
en
ts
Wha
t is
the
curr
ent e
nerg
y us
e pe
r cap
ita to
di
strib
ute
wat
er?
How
muc
h of
this
is d
ue to
pum
ping
?
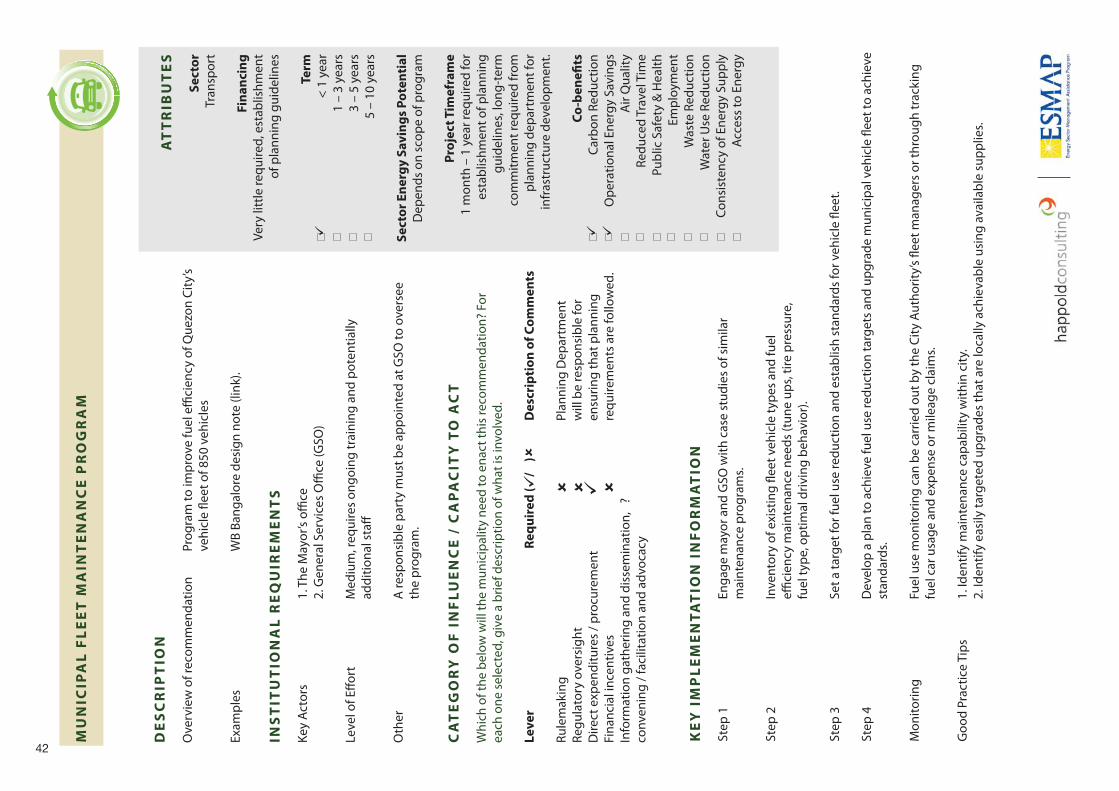
42
DE
SC
RIP
TIO
N
Ove
rvie
w o
f rec
omm
enda
tion
Prog
ram
to im
prov
e fu
el e
ffi ci
ency
of Q
uezo
n Ci
ty’s
ve
hicl
e fl e
et o
f 850
veh
icle
s
Exam
ples
W
B Ba
ngal
ore
desi
gn n
ote
(link
).
INS
TIT
UT
ION
AL
RE
QU
IRE
ME
NT
S
Key
Acto
rs
1.
The
May
or’s
offi c
e
2. G
ener
al S
ervi
ces
Offi
ce (G
SO)
Leve
l of E
ff ort
Med
ium
, req
uire
s on
goin
g tr
aini
ng a
nd p
oten
tially
addi
tiona
l sta
ff
Oth
er
A re
spon
sibl
e pa
rty
mus
t be
appo
inte
d at
GSO
to o
vers
ee
th
e pr
ogra
m.
CA
TE
GO
RY
OF
IN
FL
UE
NC
E /
CA
PA
CIT
Y T
O A
CT
Whi
ch o
f the
bel
ow w
ill th
e m
unic
ipal
ity n
eed
to e
nact
this
reco
mm
enda
tion?
For
ea
ch o
ne s
elec
ted,
giv
e a
brie
f des
crip
tion
of w
hat i
s in
volv
ed.
Le
ve
r
Re
qu
ire
d (
/
)
De
scri
pti
on
of
Co
mm
en
ts
Rule
mak
ing
Regu
lato
ry o
vers
ight
Dire
ct e
xpen
ditu
res
/ pro
cure
men
t Fi
nanc
ial i
ncen
tives
Info
rmat
ion
gath
erin
g an
d di
ssem
inat
ion,
?
conv
enin
g / f
acili
tatio
n an
d ad
voca
cy
AT
TR
IBU
TE
S
Se
cto
r
Tran
spor
t
Fin
an
cin
g
Very
litt
le re
quire
d, e
stab
lishm
ent
of p
lann
ing
guid
elin
es
Te
rm
< 1
year
1 –
3 ye
ars
3 –
5 ye
ars
5 –
10 y
ears
Se
cto
r E
ne
rgy
Sa
vin
gs
Po
ten
tia
l
Dep
ends
on
scop
e of
pro
gram
Pro
jec
t T
ime
fra
me
1 m
onth
– 1
yea
r req
uire
d fo
r es
tabl
ishm
ent o
f pla
nnin
g gu
idel
ines
, lon
g-te
rm
com
mitm
ent r
equi
red
from
pl
anni
ng d
epar
tmen
t for
in
fras
truc
ture
dev
elop
men
t.
Co
-be
ne
fi ts
Car
bon
Redu
ctio
nO
pera
tiona
l Ene
rgy
Savi
ngs
Air
Qua
lity
Redu
ced
Trav
el T
ime
Publ
ic S
afet
y &
Hea
lthEm
ploy
men
tW
aste
Red
uctio
nW
ater
Use
Red
uctio
nCo
nsis
tenc
y of
Ene
rgy
Supp
lyAc
cess
to E
nerg
y
Plan
ning
Dep
artm
ent
will
be
resp
onsi
ble
for
ensu
ring
that
pla
nnin
g re
quire
men
ts a
re fo
llow
ed.
KE
Y I
MP
LE
ME
NT
AT
ION
IN
FO
RM
AT
ION
Step
1
Enga
ge m
ayor
and
GSO
with
cas
e st
udie
s of
sim
ilar
mai
nten
ance
pro
gram
s.
Step
2
Inve
ntor
y of
exi
stin
g fl e
et v
ehic
le ty
pes
and
fuel
effi
cie
ncy
mai
nten
ance
nee
ds (t
une
ups,
tire
pres
sure
,
fuel
type
, opt
imal
driv
ing
beha
vior
).
Step
3
Set a
targ
et fo
r fue
l use
redu
ctio
n an
d es
tabl
ish
stan
dard
s fo
r veh
icle
fl ee
t.
Step
4
Dev
elop
a p
lan
to a
chie
ve fu
el u
se re
duct
ion
targ
ets
and
upgr
ade
mun
icip
al v
ehic
le fl
eet t
o ac
hiev
e
st
anda
rds.
Mon
itorin
g
Fuel
use
mon
itorin
g ca
n be
car
ried
out b
y th
e Ci
ty A
utho
rity’
s fl e
et m
anag
ers
or th
roug
h tr
acki
ng
fu
el c
ar u
sage
and
exp
ense
or m
ileag
e cl
aim
s.
Goo
d Pr
actic
e Ti
ps
1. Id
entif
y m
aint
enan
ce c
apab
ility
with
in c
ity.
2.
Iden
tify
easi
ly ta
rget
ed u
pgra
des
that
are
loca
lly a
chie
vabl
e us
ing
avai
labl
e su
pplie
s.
MU
NIC
IPA
L F
LE
ET
MA
INT
EN
AN
CE
PR
OG
RA
M
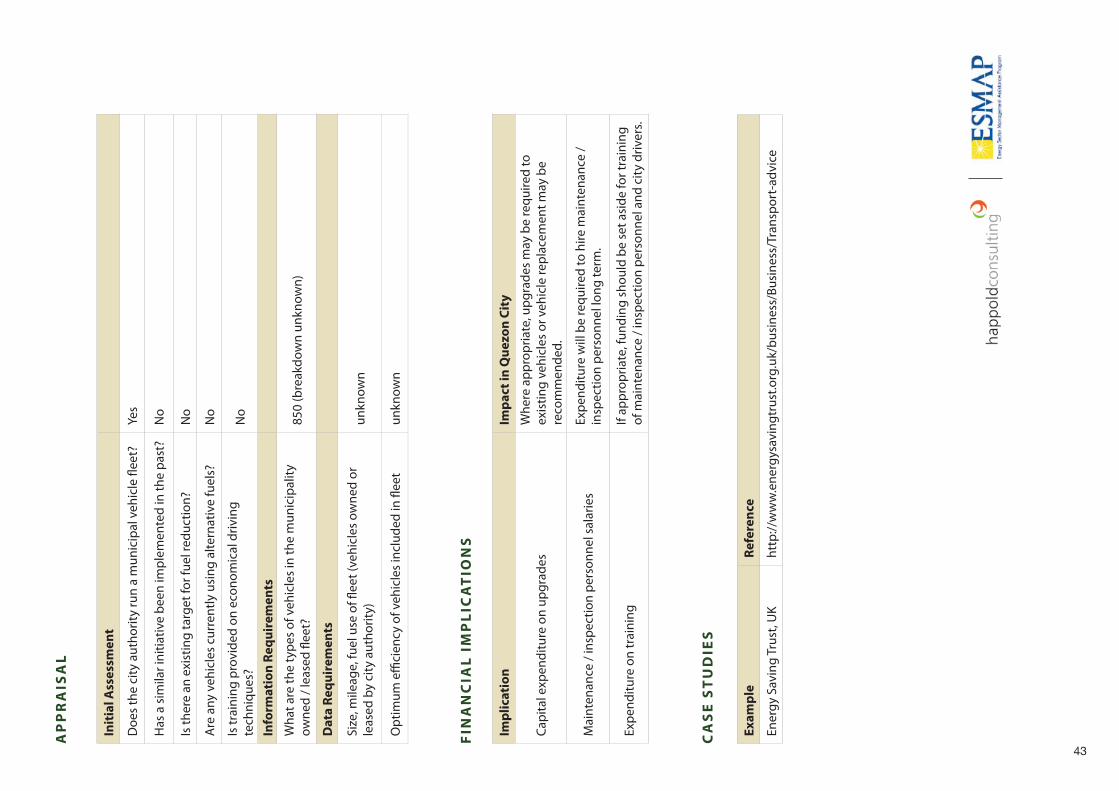
43E
xa
mp
le
Re
fere
nce
Ener
gy S
avin
g Tr
ust,
UK
http
://w
ww
.ene
rgys
avin
gtru
st.o
rg.u
k/bu
sine
ss/B
usin
ess/
Tran
spor
t-ad
vice
CA
SE
ST
UD
IES
FIN
AN
CIA
L I
MP
LIC
AT
ION
S
Imp
lic
ati
on
Im
pa
ct
in Q
ue
zo
n C
ity
Capi
tal e
xpen
ditu
re o
n up
grad
es
Whe
re a
ppro
pria
te, u
pgra
des
may
be
requ
ired
to
exis
ting
vehi
cles
or v
ehic
le re
plac
emen
t may
be
reco
mm
ende
d.
Mai
nten
ance
/ in
spec
tion
pers
onne
l sal
arie
s Ex
pend
iture
will
be
requ
ired
to h
ire m
aint
enan
ce /
insp
ectio
n pe
rson
nel l
ong
term
.
Expe
nditu
re o
n tr
aini
ng
If ap
prop
riate
, fun
ding
sho
uld
be s
et a
side
for t
rain
ing
of m
aint
enan
ce /
insp
ectio
n pe
rson
nel a
nd c
ity d
river
s.
Init
ial
Ass
ess
me
nt
Doe
s th
e ci
ty a
utho
rity
run
a m
unic
ipal
veh
icle
fl ee
t?Ye
s
Has
a s
imila
r ini
tiativ
e be
en im
plem
ente
d in
the
past
?N
o
Is th
ere
an e
xist
ing
targ
et fo
r fue
l red
uctio
n?N
o
Are
any
veh
icle
s cu
rren
tly u
sing
alte
rnat
ive
fuel
s?
No
Is tr
aini
ng p
rovi
ded
on e
cono
mic
al d
rivin
g te
chni
ques
?N
o
Info
rma
tio
n R
eq
uir
em
en
ts
Wha
t are
the
type
s of
veh
icle
s in
the
mun
icip
ality
ow
ned
/ lea
sed
fl eet
?85
0 (b
reak
dow
n un
know
n)
Da
ta R
eq
uir
em
en
ts
Size
, mile
age,
fuel
use
of fl
eet
(veh
icle
s ow
ned
or
leas
ed b
y ci
ty a
utho
rity)
unkn
own
Opt
imum
effi
cien
cy o
f veh
icle
s in
clud
ed in
fl ee
tun
know
n
AP
PR
AIS
AL
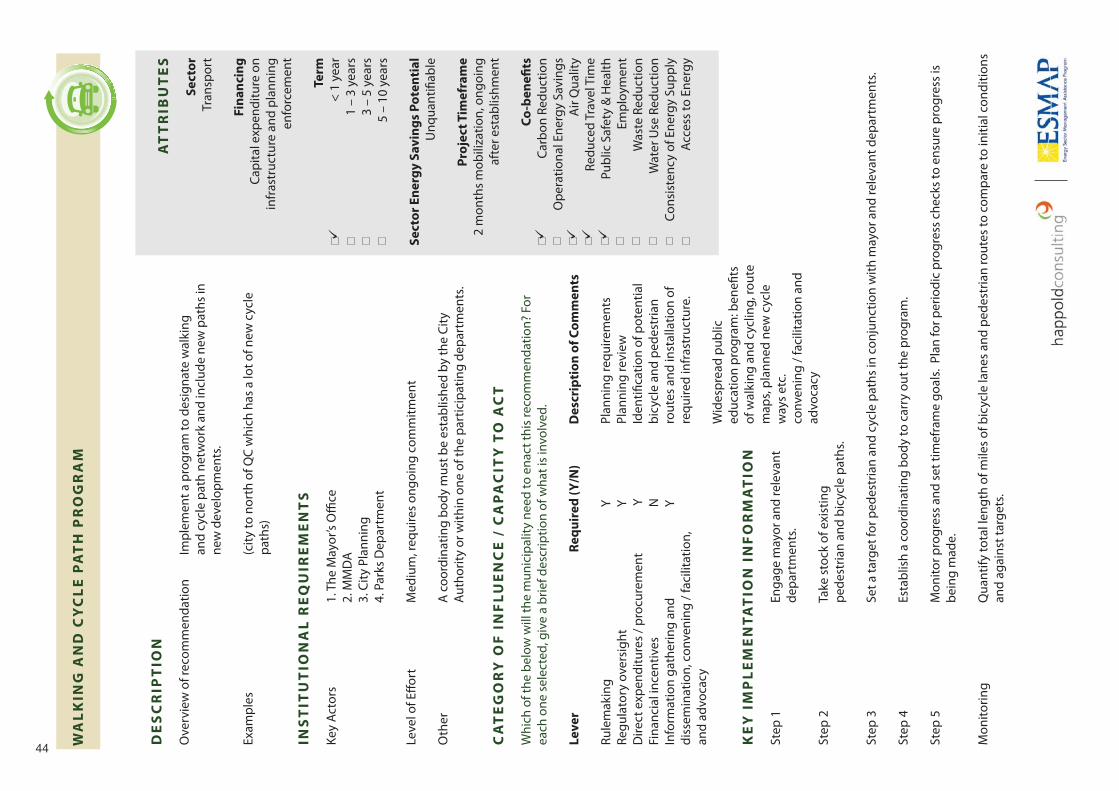
44
DE
SC
RIP
TIO
N
Ove
rvie
w o
f rec
omm
enda
tion
Impl
emen
t a p
rogr
am to
des
igna
te w
alki
ng
and
cycl
e pa
th n
etw
ork
and
incl
ude
new
pat
hs in
ne
w d
evel
opm
ents
.
Exam
ples
(c
ity to
nor
th o
f QC
whi
ch h
as a
lot o
f new
cyc
le
path
s)
INS
TIT
UT
ION
AL
RE
QU
IRE
ME
NT
S
Key
Acto
rs
1.
The
May
or’s
Offi
ce
2. M
MD
A
3. C
ity P
lann
ing
4.
Par
ks D
epar
tmen
t
Leve
l of E
ff ort
Med
ium
, req
uire
s on
goin
g co
mm
itmen
t
Oth
er
A c
oord
inat
ing
body
mus
t be
esta
blis
hed
by th
e Ci
ty
Au
thor
ity o
r with
in o
ne o
f the
par
ticip
atin
g de
part
men
ts.
CA
TE
GO
RY
OF
IN
FL
UE
NC
E /
CA
PA
CIT
Y T
O A
CT
Whi
ch o
f the
bel
ow w
ill th
e m
unic
ipal
ity n
eed
to e
nact
this
reco
mm
enda
tion?
For
ea
ch o
ne s
elec
ted,
giv
e a
brie
f des
crip
tion
of w
hat i
s in
volv
ed.
Le
ve
r
Re
qu
ire
d (
Y/N
)
D
esc
rip
tio
n o
f C
om
me
nts
Rule
mak
ing
Y
Re
gula
tory
ove
rsig
ht
Y
D
irect
exp
endi
ture
s / p
rocu
rem
ent
Y
Fi
nanc
ial i
ncen
tives
N
In
form
atio
n ga
ther
ing
and
Ydi
ssem
inat
ion,
con
veni
ng /
faci
litat
ion,
an
d ad
voca
cy
KE
Y I
MP
LE
ME
NT
AT
ION
IN
FO
RM
AT
ION
Step
1
Enga
ge m
ayor
and
rele
vant
depa
rtm
ents
.
Step
2
Take
sto
ck o
f exi
stin
g
pede
stria
n an
d bi
cycl
e pa
ths.
Step
3
Set a
targ
et fo
r ped
estr
ian
and
cycl
e pa
ths
in c
onju
nctio
n w
ith m
ayor
and
rele
vant
dep
artm
ents
.
Step
4
Esta
blis
h a
coor
dina
ting
body
to c
arry
out
the
prog
ram
.
Step
5
Mon
itor p
rogr
ess
and
set t
imef
ram
e go
als.
Pla
n fo
r per
iodi
c pr
ogre
ss c
heck
s to
ens
ure
prog
ress
is
be
ing
mad
e.
Mon
itorin
g
Qua
ntify
tota
l len
gth
of m
iles
of b
icyc
le la
nes
and
pede
stria
n ro
utes
to c
ompa
re to
initi
al c
ondi
tions
and
agai
nst t
arge
ts.
AT
TR
IBU
TE
S
Se
cto
r
Tran
spor
t
Fin
an
cin
g
Capi
tal e
xpen
ditu
re o
n in
fras
truc
ture
and
pla
nnin
g en
forc
emen
t
Te
rm
< 1
year
1 –
3 ye
ars
3 –
5 ye
ars
5 –
10 y
ears
Se
cto
r E
ne
rgy
Sa
vin
gs
Po
ten
tia
l
Unq
uant
ifi ab
le
Pro
jec
t T
ime
fra
me
2 m
onth
s m
obili
zatio
n, o
ngoi
ng
afte
r est
ablis
hmen
t
Co
-be
ne
fi ts
Car
bon
Redu
ctio
nO
pera
tiona
l Ene
rgy
Savi
ngs
Air
Qua
lity
Redu
ced
Trav
el T
ime
Publ
ic S
afet
y &
Hea
lthEm
ploy
men
tW
aste
Red
uctio
nW
ater
Use
Red
uctio
nCo
nsis
tenc
y of
Ene
rgy
Supp
lyAc
cess
to E
nerg
y
Pl
anni
ng re
quire
men
tsPl
anni
ng re
view
Iden
tifi c
atio
n of
pot
entia
l bi
cycl
e an
d pe
dest
rian
rout
es a
nd in
stal
latio
n of
re
quire
d in
fras
truc
ture
.
Wid
espr
ead
publ
ic
educ
atio
n pr
ogra
m: b
enefi
ts
of w
alki
ng a
nd c
yclin
g, ro
ute
map
s, pl
anne
d ne
w c
ycle
w
ays
etc.
conv
enin
g / f
acili
tatio
n an
d ad
voca
cy
WA
LK
ING
AN
D C
YC
LE
PA
TH
PR
OG
RA
M
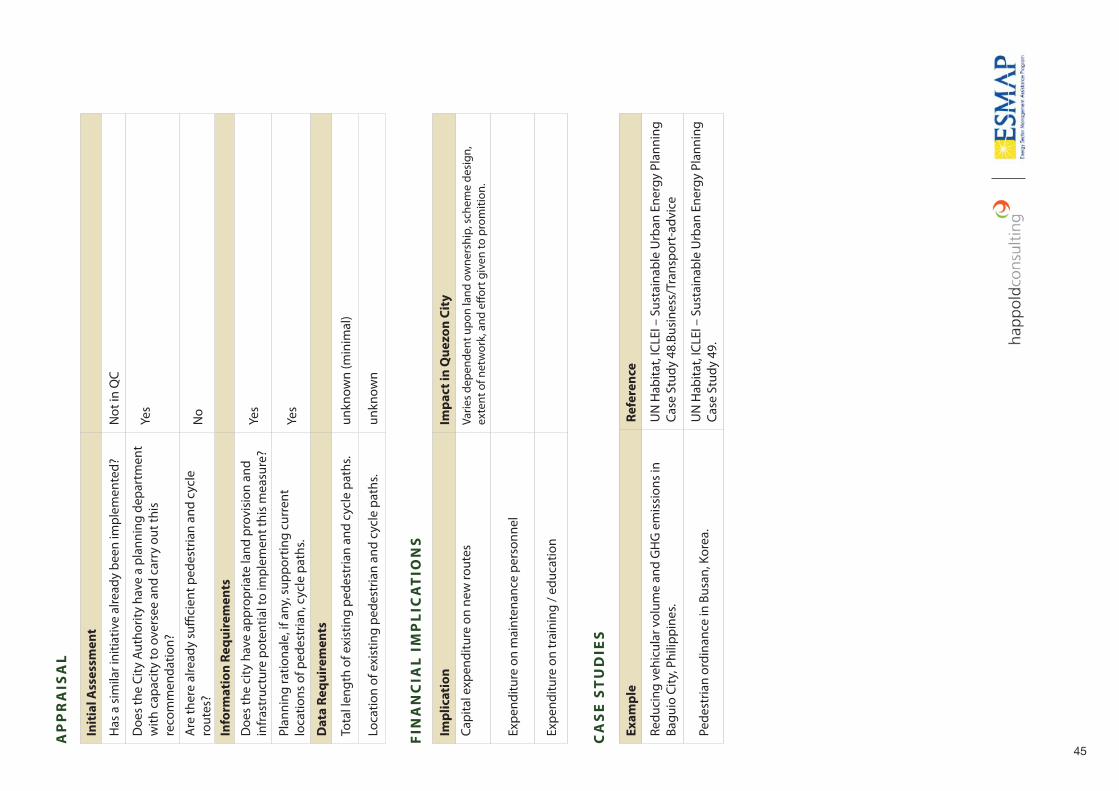
45
Ex
am
ple
R
efe
ren
ce
Redu
cing
veh
icul
ar v
olum
e an
d G
HG
em
issi
ons
in
Bagu
io C
ity, P
hilip
pine
s.U
N H
abita
t, IC
LEI –
Sus
tain
able
Urb
an E
nerg
y Pl
anni
ng
Case
Stu
dy 4
8.Bu
sine
ss/T
rans
port
-adv
ice
Pede
stria
n or
dina
nce
in B
usan
, Kor
ea.
UN
Hab
itat,
ICLE
I – S
usta
inab
le U
rban
Ene
rgy
Plan
ning
Ca
se S
tudy
49.
CA
SE
ST
UD
IES
FIN
AN
CIA
L I
MP
LIC
AT
ION
S
Imp
lic
ati
on
Im
pa
ct
in Q
ue
zo
n C
ity
Capi
tal e
xpen
ditu
re o
n ne
w ro
utes
Varie
s de
pend
ent u
pon
land
ow
ners
hip,
sch
eme
desi
gn,
exte
nt o
f net
wor
k, a
nd e
ff ort
giv
en to
pro
miti
on.
Expe
nditu
re o
n m
aint
enan
ce p
erso
nnel
Expe
nditu
re o
n tr
aini
ng /
educ
atio
n
Init
ial
Ass
ess
me
nt
Has
a s
imila
r ini
tiativ
e al
read
y be
en im
plem
ente
d?
Not
in Q
C
Doe
s th
e Ci
ty A
utho
rity
have
a p
lann
ing
depa
rtm
ent
with
cap
acity
to o
vers
ee a
nd c
arry
out
this
re
com
men
datio
n?
Yes
Are
ther
e al
read
y su
ffi ci
ent p
edes
tria
n an
d cy
cle
rout
es?
No
Info
rma
tio
n R
eq
uir
em
en
ts
Doe
s th
e ci
ty h
ave
appr
opria
te la
nd p
rovi
sion
and
in
fras
truc
ture
pot
entia
l to
impl
emen
t thi
s m
easu
re?
Yes
Plan
ning
ratio
nale
, if a
ny, s
uppo
rtin
g cu
rren
t lo
catio
ns o
f ped
estr
ian,
cyc
le p
aths
.Ye
s
Da
ta R
eq
uir
em
en
ts
Tota
l len
gth
of e
xist
ing
pede
stria
n an
d cy
cle
path
s. un
know
n (m
inim
al)
Loca
tion
of e
xist
ing
pede
stria
n an
d cy
cle
path
s.un
know
n
AP
PR
AIS
AL
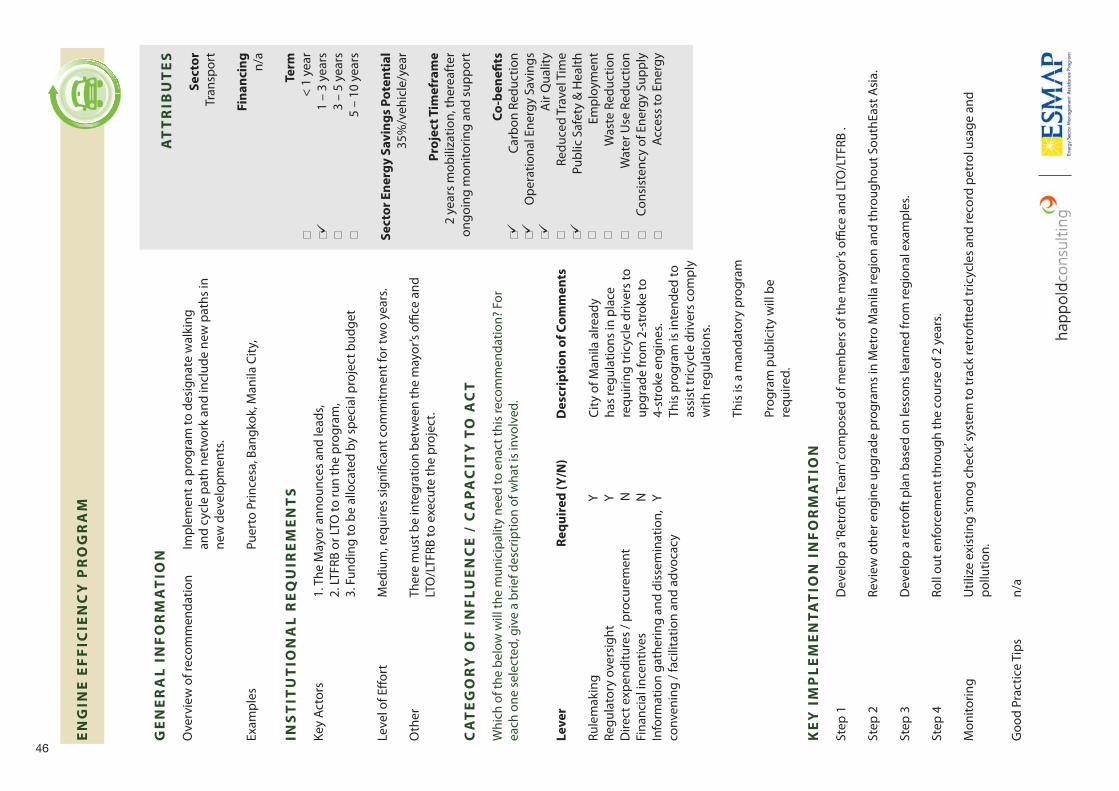
46
City
of M
anila
alre
ady
has
regu
latio
ns in
pla
ce
requ
iring
tric
ycle
driv
ers
to
upgr
ade
from
2-s
trok
e to
4-
stro
ke e
ngin
es.
This
pro
gram
is in
tend
ed to
as
sist
tric
ycle
driv
ers
com
ply
with
regu
latio
ns.
This
is a
man
dato
ry p
rogr
am
Prog
ram
pub
licity
will
be
requ
ired.
AT
TR
IBU
TE
S
Se
cto
r
Tran
spor
t
Fin
an
cin
g
n/a
Te
rm
< 1
year
1 –
3 ye
ars
3 –
5 ye
ars
5 –
10 y
ears
Se
cto
r E
ne
rgy
Sa
vin
gs
Po
ten
tia
l
35%
/veh
icle
/yea
r
Pro
jec
t T
ime
fra
me
2 ye
ars
mob
iliza
tion,
ther
eaft
er
ongo
ing
mon
itorin
g an
d su
ppor
t
Co
-be
ne
fi ts
Car
bon
Redu
ctio
nO
pera
tiona
l Ene
rgy
Savi
ngs
Air
Qua
lity
Redu
ced
Trav
el T
ime
Publ
ic S
afet
y &
Hea
lthEm
ploy
men
tW
aste
Red
uctio
nW
ater
Use
Red
uctio
nCo
nsis
tenc
y of
Ene
rgy
Supp
lyAc
cess
to E
nerg
y
KE
Y I
MP
LE
ME
NT
AT
ION
IN
FO
RM
AT
ION
Step
1
Dev
elop
a ‘R
etro
fi t Te
am’ c
ompo
sed
of m
embe
rs o
f the
may
or’s
offi c
e an
d LT
O/L
TFRB
.
Step
2
Revi
ew o
ther
eng
ine
upgr
ade
prog
ram
s in
Met
ro M
anila
regi
on a
nd th
roug
hout
Sou
thEa
st A
sia.
Step
3
Dev
elop
a re
trofi
t pl
an b
ased
on
less
ons
lear
ned
from
regi
onal
exa
mpl
es.
Step
4
Roll
out e
nfor
cem
ent t
hrou
gh th
e co
urse
of 2
yea
rs.
Mon
itorin
g
Util
ize
exis
ting
‘smog
che
ck’ s
yste
m to
trac
k re
trofi
tted
tric
ycle
s an
d re
cord
pet
rol u
sage
and
po
llutio
n.
Goo
d Pr
actic
e Ti
ps
n/a
EN
GIN
E E
FF
ICIE
NC
Y P
RO
GR
AM
GE
NE
RA
L I
NF
OR
MA
TIO
N
Ove
rvie
w o
f rec
omm
enda
tion
Impl
emen
t a p
rogr
am to
des
igna
te w
alki
ng
and
cycl
e pa
th n
etw
ork
and
incl
ude
new
pat
hs in
ne
w d
evel
opm
ents
.
Exam
ples
Pu
erto
Prin
cesa
, Ban
gkok
, Man
ila C
ity,
INS
TIT
UT
ION
AL
RE
QU
IRE
ME
NT
S
Key
Acto
rs
1.
The
May
or a
nnou
nces
and
lead
s,
2. LT
FRB
or LT
O to
run
the
prog
ram
,
3. F
undi
ng to
be
allo
cate
d by
spe
cial
pro
ject
bud
get
Leve
l of E
ff ort
Med
ium
, req
uire
s si
gnifi
cant
com
mitm
ent f
or tw
o ye
ars.
Oth
er
Ther
e m
ust b
e in
tegr
atio
n be
twee
n th
e m
ayor
’s offi
ce
and
LTO
/LTF
RB to
exe
cute
the
proj
ect.
CA
TE
GO
RY
OF
IN
FL
UE
NC
E /
CA
PA
CIT
Y T
O A
CT
Whi
ch o
f the
bel
ow w
ill th
e m
unic
ipal
ity n
eed
to e
nact
this
reco
mm
enda
tion?
For
ea
ch o
ne s
elec
ted,
giv
e a
brie
f des
crip
tion
of w
hat i
s in
volv
ed.
Le
ve
r
Re
qu
ire
d (
Y/N
)
D
esc
rip
tio
n o
f C
om
me
nts
Rule
mak
ing
Y
Re
gula
tory
ove
rsig
ht
Y
D
irect
exp
endi
ture
s / p
rocu
rem
ent
N
Fina
ncia
l inc
entiv
es
N
Info
rmat
ion
gath
erin
g an
d di
ssem
inat
ion,
Y
conv
enin
g / f
acili
tatio
n an
d ad
voca
cy
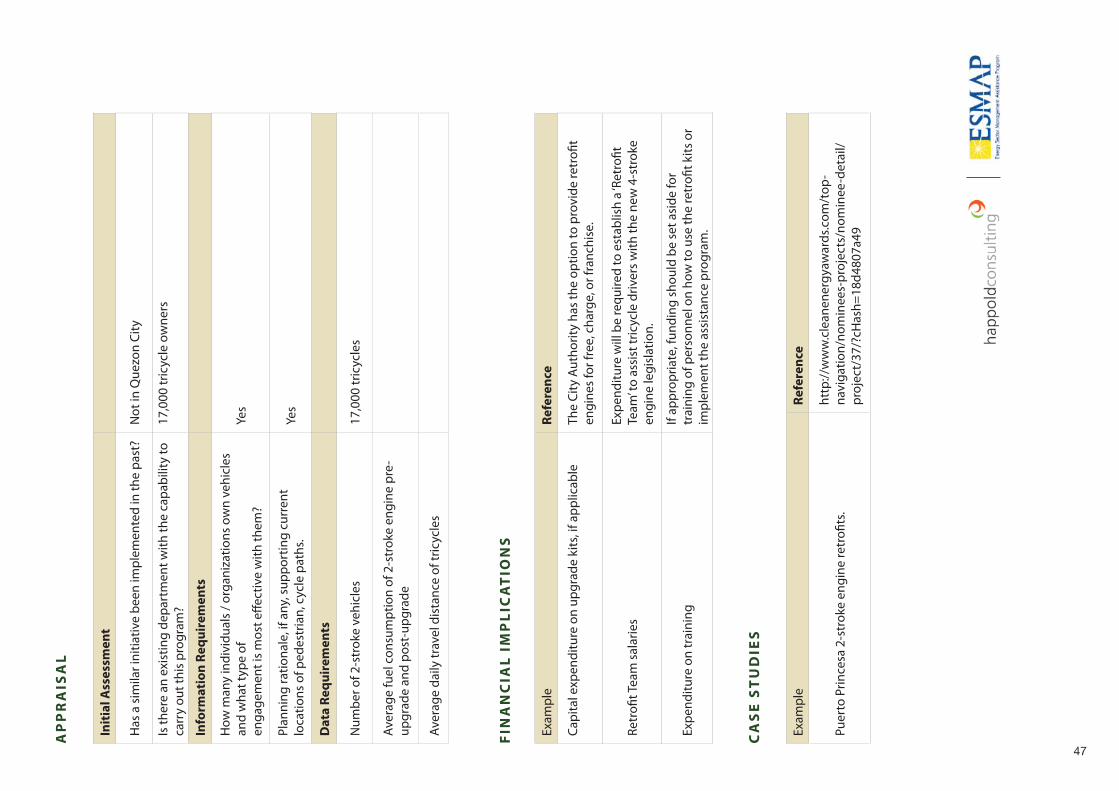
47
Exam
ple
Re
fere
nce
Puer
to P
rince
sa 2
-str
oke
engi
ne re
trofi
ts.
http
://w
ww
.cle
anen
ergy
awar
ds.c
om/t
op-
navi
gatio
n/no
min
ees-
proj
ects
/nom
inee
-det
ail/
proj
ect/
37/?
cHas
h=18
d480
7a49
CA
SE
ST
UD
IES
FIN
AN
CIA
L I
MP
LIC
AT
ION
S
Exam
ple
Re
fere
nce
Capi
tal e
xpen
ditu
re o
n up
grad
e ki
ts, i
f app
licab
le
The
City
Aut
horit
y ha
s th
e op
tion
to p
rovi
de re
trofi
t en
gine
s fo
r fre
e, c
harg
e, o
r fra
nchi
se.
Retr
ofi t
Team
sal
arie
s Ex
pend
iture
will
be
requ
ired
to e
stab
lish
a ‘R
etro
fi t
Team
’ to
assi
st tr
icyc
le d
river
s w
ith th
e ne
w 4
-str
oke
engi
ne le
gisl
atio
n.
Expe
nditu
re o
n tr
aini
ng
If ap
prop
riate
, fun
ding
sho
uld
be s
et a
side
for
trai
ning
of p
erso
nnel
on
how
to u
se th
e re
trofi
t ki
ts o
r im
plem
ent t
he a
ssis
tanc
e pr
ogra
m.
Init
ial
Ass
ess
me
nt
Has
a s
imila
r ini
tiativ
e be
en im
plem
ente
d in
the
past
?N
ot in
Que
zon
City
Is th
ere
an e
xist
ing
depa
rtm
ent w
ith th
e ca
pabi
lity
to
carr
y ou
t thi
s pr
ogra
m?
17
,000
tric
ycle
ow
ners
Info
rma
tio
n R
eq
uir
em
en
ts
How
man
y in
divi
dual
s / o
rgan
izat
ions
ow
n ve
hicl
es
and
wha
t typ
e of
en
gage
men
t is
mos
t eff e
ctiv
e w
ith th
em?
Ye
s
Plan
ning
ratio
nale
, if a
ny, s
uppo
rtin
g cu
rren
t lo
catio
ns o
f ped
estr
ian,
cyc
le p
aths
.Ye
s
Da
ta R
eq
uir
em
en
ts
Num
ber o
f 2-s
trok
e ve
hicl
es17
,000
tric
ycle
s
Aver
age
fuel
con
sum
ptio
n of
2-s
trok
e en
gine
pre
-up
grad
e an
d po
st-u
pgra
de
Aver
age
daily
trav
el d
ista
nce
of tr
icyc
les
AP
PR
AIS
AL
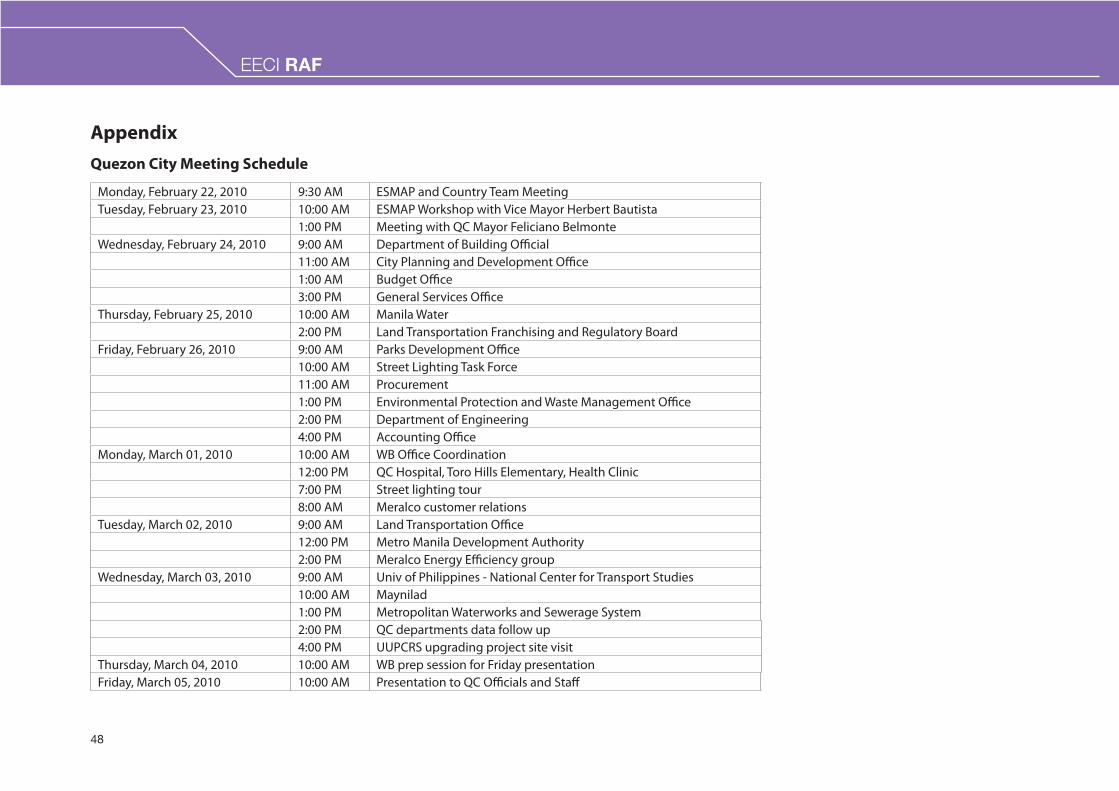
48
EECI RAF
Quezon City Meeting Schedule
Monday, February 22, 2010 9:30 AM ESMAP and Country Team Meeting Tuesday, February 23, 2010 10:00 AM ESMAP Workshop with Vice Mayor Herbert Bautista
1:00 PM Meeting with QC Mayor Feliciano Belmonte Wednesday, February 24, 2010 9:00 AM Department of Building Offi cial
11:00 AM City Planning and Development Offi ce 1:00 AM Budget Offi ce 3:00 PM General Services Offi ce
Thursday, February 25, 2010 10:00 AM Manila Water 2:00 PM Land Transportation Franchising and Regulatory Board
Friday, February 26, 2010 9:00 AM Parks Development Offi ce10:00 AM Street Lighting Task Force11:00 AM Procurement 1:00 PM Environmental Protection and Waste Management Offi ce 2:00 PM Department of Engineering 4:00 PM Accounting Offi ce
Monday, March 01, 2010 10:00 AM WB Offi ce Coordination12:00 PM QC Hospital, Toro Hills Elementary, Health Clinic7:00 PM Street lighting tour8:00 AM Meralco customer relations
Tuesday, March 02, 2010 9:00 AM Land Transportation Offi ce12:00 PM Metro Manila Development Authority2:00 PM Meralco Energy Effi ciency group
Wednesday, March 03, 2010 9:00 AM Univ of Philippines - National Center for Transport Studies10:00 AM Maynilad 1:00 PM Metropolitan Waterworks and Sewerage System2:00 PM QC departments data follow up4:00 PM UUPCRS upgrading project site visit
Thursday, March 04, 2010 10:00 AM WB prep session for Friday presentationFriday, March 05, 2010 10:00 AM Presentation to QC Offi cials and Staff
Appendix
EECI RAF
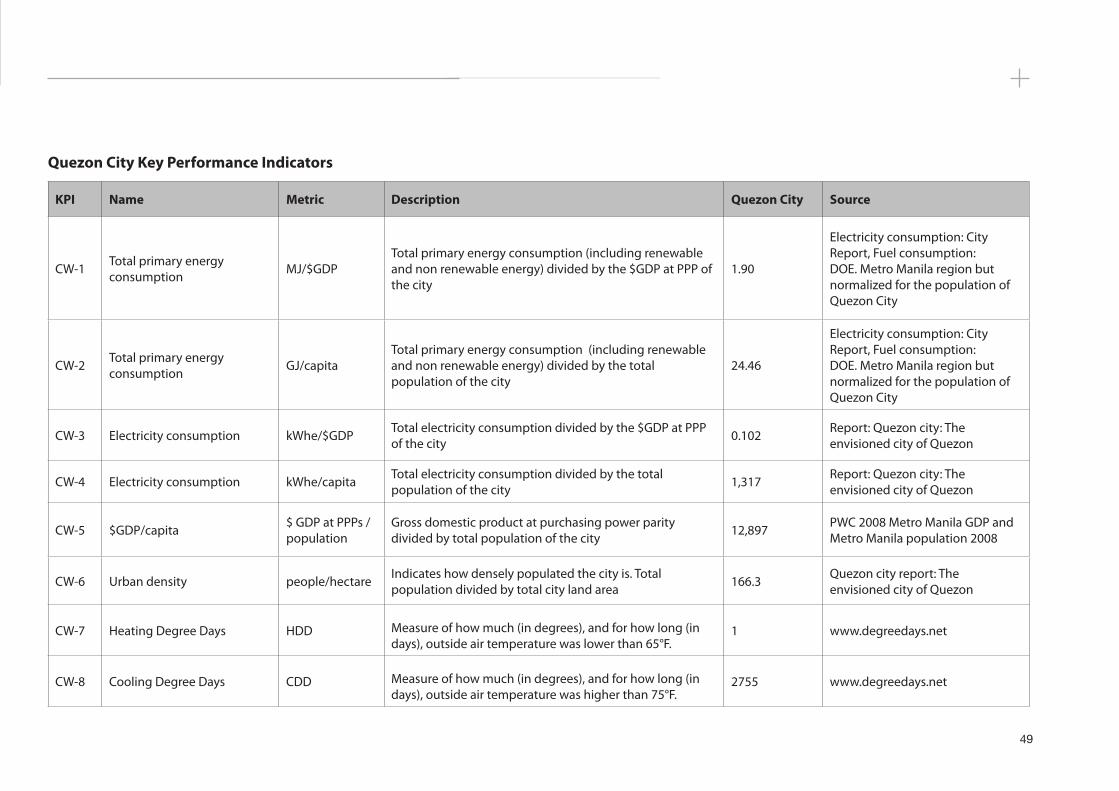
49
Quezon City Key Performance Indicators
KPI Name Metric Description Quezon City Source
CW-1 Total primary energy consumption MJ/$GDP
Total primary energy consumption (including renewable and non renewable energy) divided by the $GDP at PPP of the city
1.90
Electricity consumption: City Report, Fuel consumption: DOE. Metro Manila region but normalized for the population of Quezon City
CW-2 Total primary energy consumption GJ/capita
Total primary energy consumption (including renewable and non renewable energy) divided by the total population of the city
24.46
Electricity consumption: City Report, Fuel consumption: DOE. Metro Manila region but normalized for the population of Quezon City
CW-3 Electricity consumption kWhe/$GDP Total electricity consumption divided by the $GDP at PPP of the city 0.102 Report: Quezon city: The
envisioned city of Quezon
CW-4 Electricity consumption kWhe/capita Total electricity consumption divided by the total population of the city 1,317 Report: Quezon city: The
envisioned city of Quezon
CW-5 $GDP/capita $ GDP at PPPs / population
Gross domestic product at purchasing power parity divided by total population of the city 12,897 PWC 2008 Metro Manila GDP and
Metro Manila population 2008
CW-6 Urban density people/hectare Indicates how densely populated the city is. Total population divided by total city land area 166.3 Quezon city report: The
envisioned city of Quezon
CW-7 Heating Degree Days HDD Measure of how much (in degrees), and for how long (in days), outside air temperature was lower than 65°F.
1 www.degreedays.net
CW-8 Cooling Degree Days CDD Measure of how much (in degrees), and for how long (in days), outside air temperature was higher than 75°F.
2755 www.degreedays.net
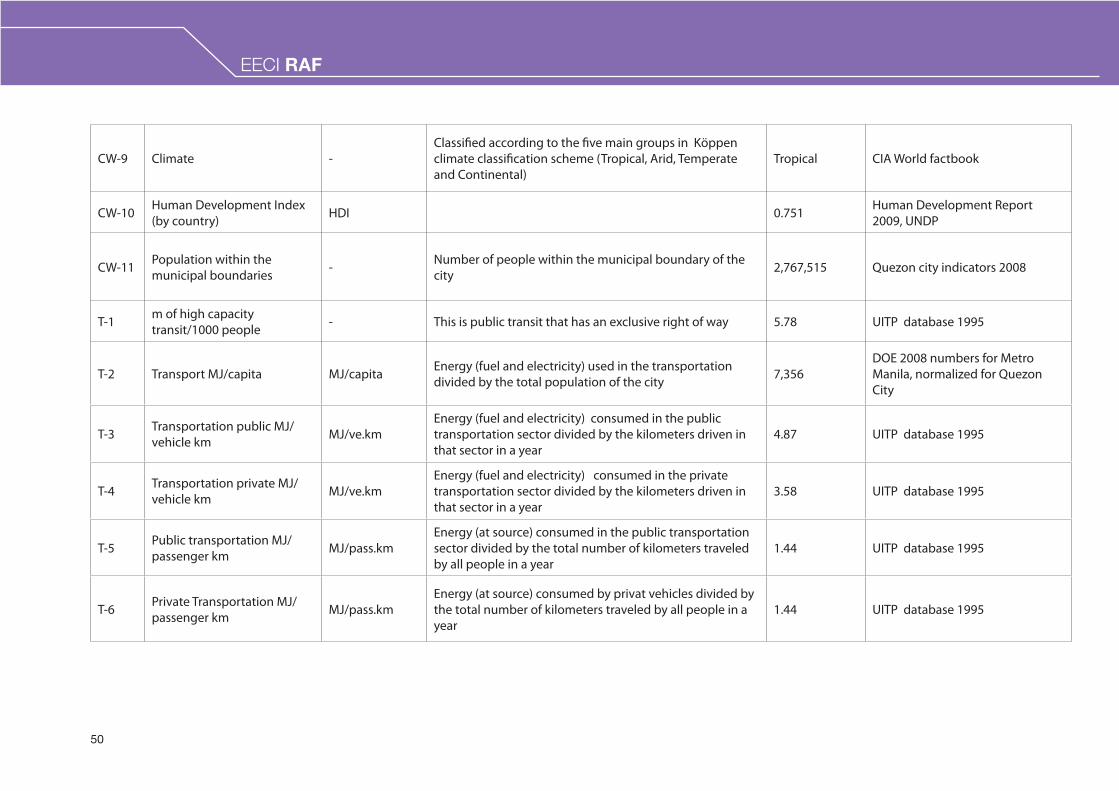
50
EECI RAF
CW-9 Climate -Classifi ed according to the fi ve main groups in Köppen climate classifi cation scheme (Tropical, Arid, Temperate and Continental)
Tropical CIA World factbook
CW-10 Human Development Index (by country) HDI 0.751 Human Development Report
2009, UNDP
CW-11 Population within the municipal boundaries - Number of people within the municipal boundary of the
city 2,767,515 Quezon city indicators 2008
T-1 m of high capacity transit/1000 people - This is public transit that has an exclusive right of way 5.78 UITP database 1995
T-2 Transport MJ/capita MJ/capita Energy (fuel and electricity) used in the transportation divided by the total population of the city 7,356
DOE 2008 numbers for Metro Manila, normalized for Quezon City
T-3 Transportation public MJ/vehicle km MJ/ve.km
Energy (fuel and electricity) consumed in the public transportation sector divided by the kilometers driven in that sector in a year
4.87 UITP database 1995
T-4 Transportation private MJ/vehicle km MJ/ve.km
Energy (fuel and electricity) consumed in the private transportation sector divided by the kilometers driven in that sector in a year
3.58 UITP database 1995
T-5 Public transportation MJ/passenger km MJ/pass.km
Energy (at source) consumed in the public transportation sector divided by the total number of kilometers traveled by all people in a year
1.44 UITP database 1995
T-6 Private Transportation MJ/passenger km MJ/pass.km
Energy (at source) consumed by privat vehicles divided by the total number of kilometers traveled by all people in a year
1.44 UITP database 1995
EECI RAF
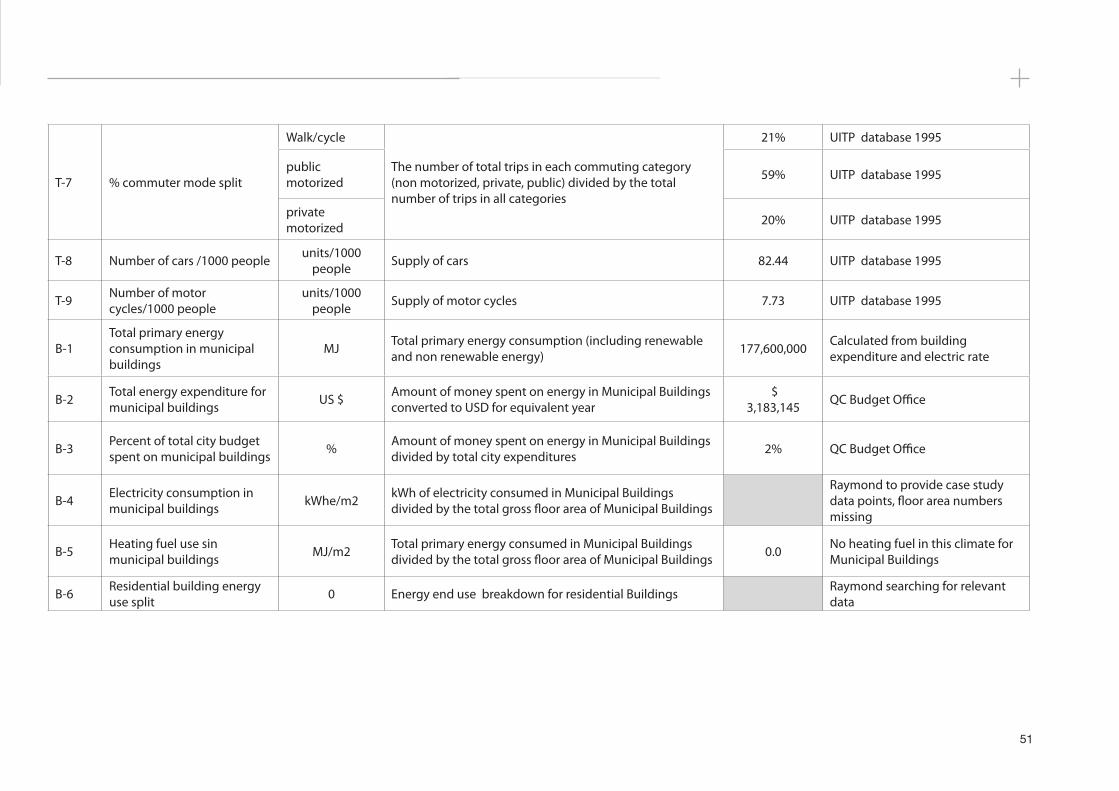
51
T-7 % commuter mode split
Walk/cycle
The number of total trips in each commuting category (non motorized, private, public) divided by the total number of trips in all categories
21% UITP database 1995
public motorized 59% UITP database 1995
private motorized 20% UITP database 1995
T-8 Number of cars /1000 people units/1000 people Supply of cars 82.44 UITP database 1995
T-9 Number of motor cycles/1000 people
units/1000 people Supply of motor cycles 7.73 UITP database 1995
B-1Total primary energy consumption in municipal buildings
MJ Total primary energy consumption (including renewable and non renewable energy) 177,600,000 Calculated from building
expenditure and electric rate
B-2 Total energy expenditure for municipal buildings US $ Amount of money spent on energy in Municipal Buildings
converted to USD for equivalent year $
3,183,145 QC Budget Offi ce
B-3 Percent of total city budget spent on municipal buildings % Amount of money spent on energy in Municipal Buildings
divided by total city expenditures 2% QC Budget Offi ce
B-4 Electricity consumption in municipal buildings kWhe/m2 kWh of electricity consumed in Municipal Buildings
divided by the total gross fl oor area of Municipal Buildings
Raymond to provide case study data points, fl oor area numbers missing
B-5 Heating fuel use sin municipal buildings MJ/m2 Total primary energy consumed in Municipal Buildings
divided by the total gross fl oor area of Municipal Buildings 0.0 No heating fuel in this climate for Municipal Buildings
B-6 Residential building energy use split 0 Energy end use breakdown for residential Buildings Raymond searching for relevant
data
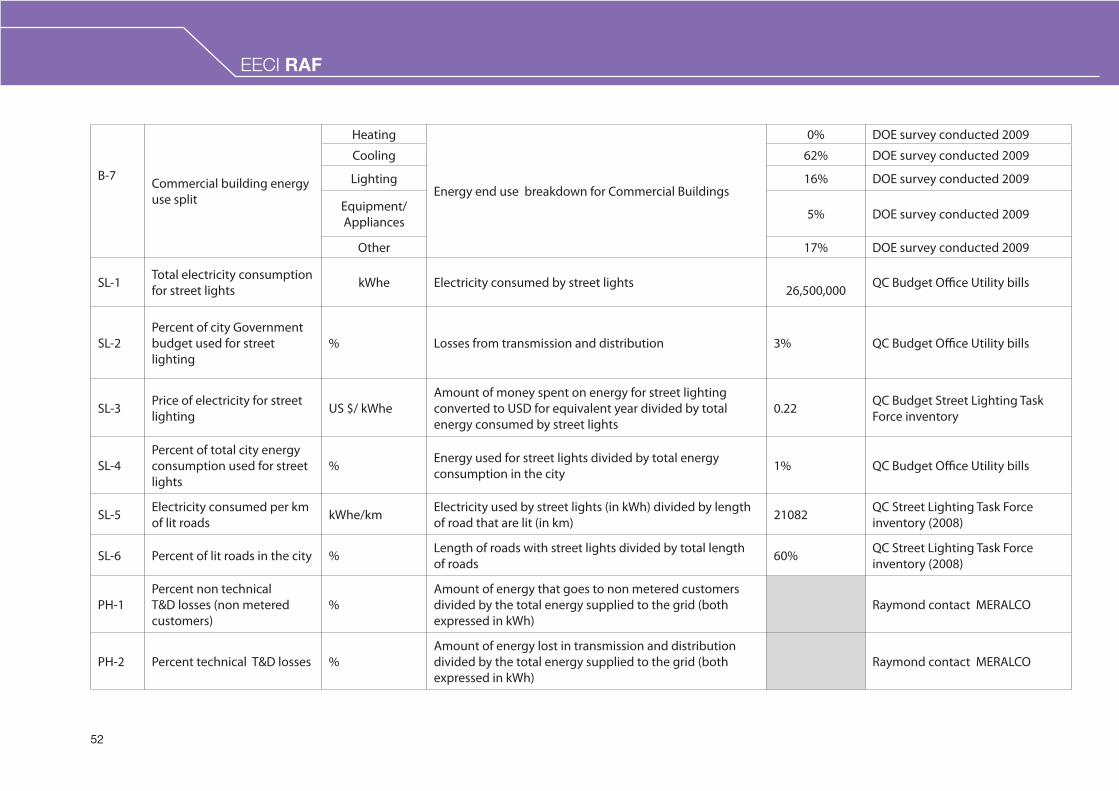
52
EECI RAF
B-7 Commercial building energy use split
Heating
Energy end use breakdown for Commercial Buildings
0% DOE survey conducted 2009
Cooling 62% DOE survey conducted 2009
Lighting 16% DOE survey conducted 2009
Equipment/Appliances 5% DOE survey conducted 2009
Other 17% DOE survey conducted 2009
SL-1 Total electricity consumption for street lights kWhe Electricity consumed by street lights
26,500,000 QC Budget Offi ce Utility bills
SL-2Percent of city Government budget used for street lighting
% Losses from transmission and distribution 3% QC Budget Offi ce Utility bills
SL-3 Price of electricity for street lighting US $/ kWhe
Amount of money spent on energy for street lighting converted to USD for equivalent year divided by total energy consumed by street lights
0.22 QC Budget Street Lighting Task Force inventory
SL-4Percent of total city energy consumption used for street lights
% Energy used for street lights divided by total energy consumption in the city 1% QC Budget Offi ce Utility bills
SL-5 Electricity consumed per km of lit roads kWhe/km Electricity used by street lights (in kWh) divided by length
of road that are lit (in km) 21082 QC Street Lighting Task Force inventory (2008)
SL-6 Percent of lit roads in the city % Length of roads with street lights divided by total length of roads 60% QC Street Lighting Task Force
inventory (2008)
PH-1Percent non technical T&D losses (non metered customers)
%Amount of energy that goes to non metered customers divided by the total energy supplied to the grid (both expressed in kWh)
Raymond contact MERALCO
PH-2 Percent technical T&D losses %Amount of energy lost in transmission and distribution divided by the total energy supplied to the grid (both expressed in kWh)
Raymond contact MERALCO
EECI RAF
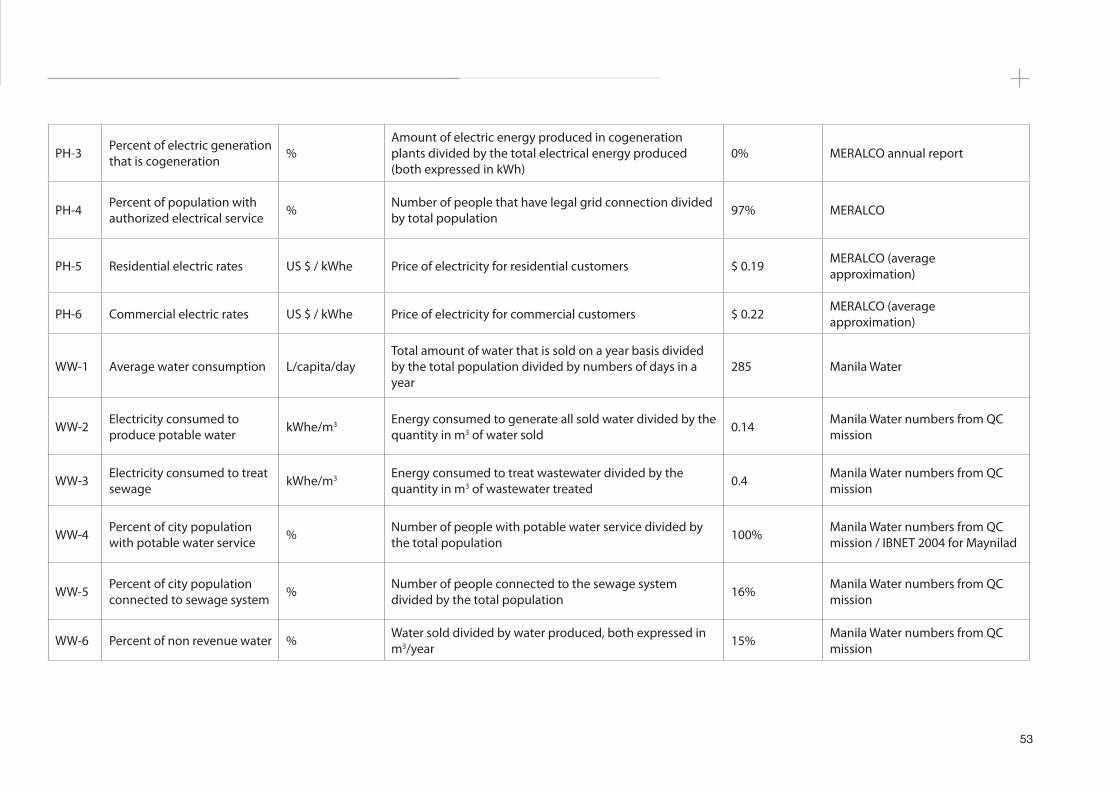
53
PH-3 Percent of electric generation that is cogeneration %
Amount of electric energy produced in cogeneration plants divided by the total electrical energy produced (both expressed in kWh)
0% MERALCO annual report
PH-4 Percent of population with authorized electrical service % Number of people that have legal grid connection divided
by total population 97% MERALCO
PH-5 Residential electric rates US $ / kWhe Price of electricity for residential customers $ 0.19 MERALCO (average approximation)
PH-6 Commercial electric rates US $ / kWhe Price of electricity for commercial customers $ 0.22 MERALCO (average approximation)
WW-1 Average water consumption L/capita/dayTotal amount of water that is sold on a year basis divided by the total population divided by numbers of days in a year
285 Manila Water
WW-2 Electricity consumed to produce potable water kWhe/m3 Energy consumed to generate all sold water divided by the
quantity in m3 of water sold 0.14 Manila Water numbers from QC mission
WW-3 Electricity consumed to treat sewage kWhe/m3 Energy consumed to treat wastewater divided by the
quantity in m3 of wastewater treated 0.4 Manila Water numbers from QC mission
WW-4 Percent of city population with potable water service % Number of people with potable water service divided by
the total population 100% Manila Water numbers from QC mission / IBNET 2004 for Maynilad
WW-5 Percent of city population connected to sewage system % Number of people connected to the sewage system
divided by the total population 16% Manila Water numbers from QC mission
WW-6 Percent of non revenue water % Water sold divided by water produced, both expressed in m3/year 15% Manila Water numbers from QC
mission
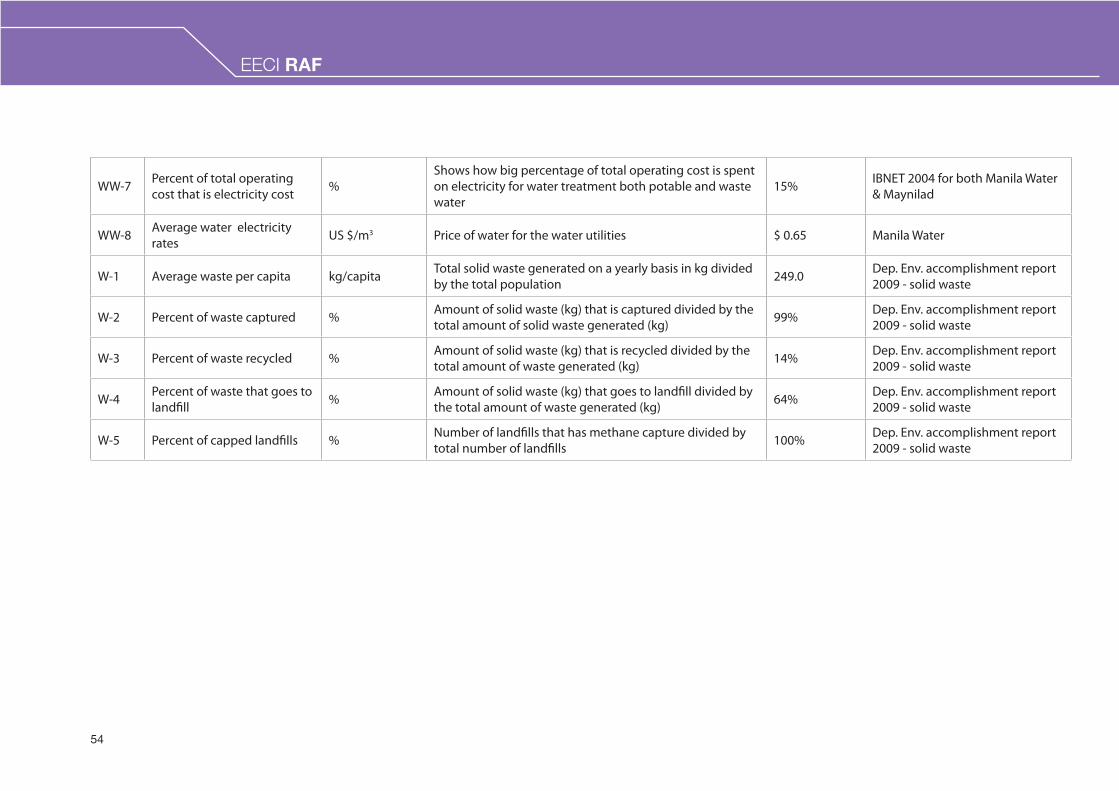
54
EECI RAF
WW-7 Percent of total operating cost that is electricity cost %
Shows how big percentage of total operating cost is spent on electricity for water treatment both potable and waste water
15% IBNET 2004 for both Manila Water & Maynilad
WW-8 Average water electricity rates US $/m3 Price of water for the water utilities $ 0.65 Manila Water
W-1 Average waste per capita kg/capita Total solid waste generated on a yearly basis in kg divided by the total population 249.0 Dep. Env. accomplishment report
2009 - solid waste
W-2 Percent of waste captured % Amount of solid waste (kg) that is captured divided by the total amount of solid waste generated (kg) 99% Dep. Env. accomplishment report
2009 - solid waste
W-3 Percent of waste recycled % Amount of solid waste (kg) that is recycled divided by the total amount of waste generated (kg) 14% Dep. Env. accomplishment report
2009 - solid waste
W-4 Percent of waste that goes to landfi ll % Amount of solid waste (kg) that goes to landfi ll divided by
the total amount of waste generated (kg) 64% Dep. Env. accomplishment report 2009 - solid waste
W-5 Percent of capped landfi lls % Number of landfi lls that has methane capture divided by total number of landfi lls 100% Dep. Env. accomplishment report
2009 - solid waste
EECI RAF
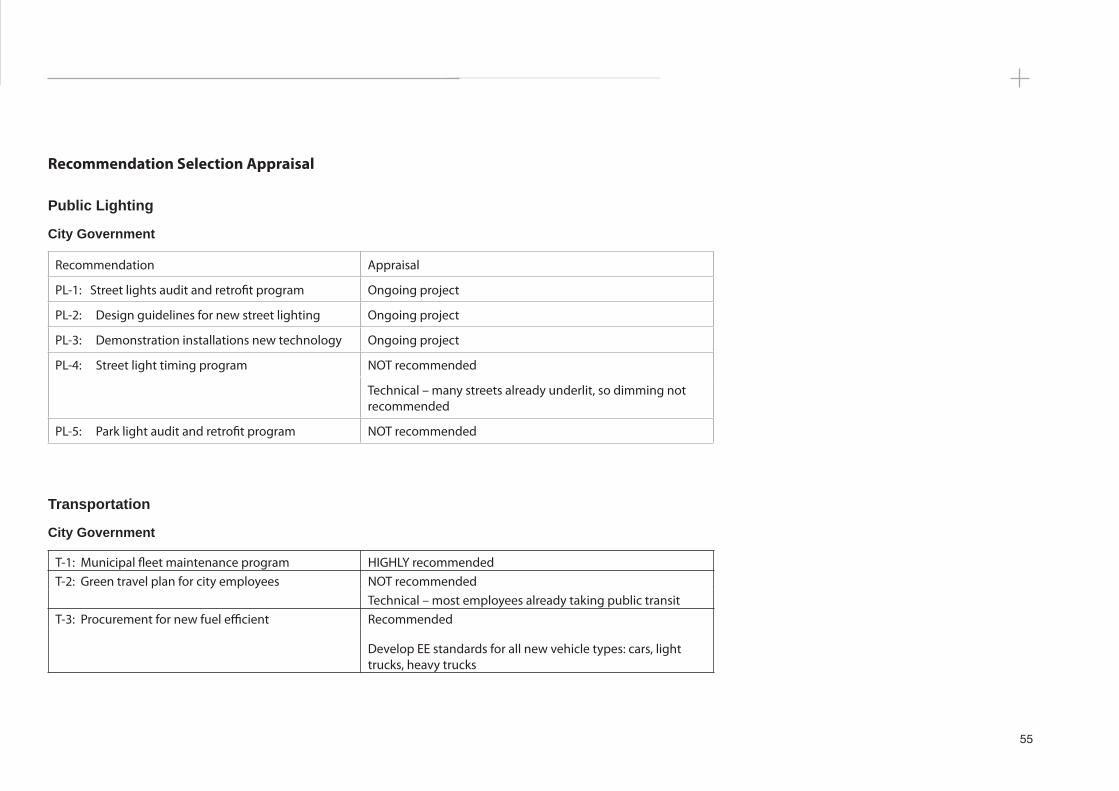
55
Recommendation Selection Appraisal
Public Lighting
City Government
Recommendation Appraisal
PL-1: Street lights audit and retrofi t program Ongoing project
PL-2: Design guidelines for new street lighting Ongoing project
PL-3: Demonstration installations new technology Ongoing project
PL-4: Street light timing program NOT recommended
Technical – many streets already underlit, so dimming not recommended
PL-5: Park light audit and retrofi t program NOT recommended
Transportation
City Government
T-1: Municipal fl eet maintenance program HIGHLY recommended T-2: Green travel plan for city employees NOT recommended Technical – most employees already taking public transitT-3: Procurement for new fuel effi cient Recommended
Develop EE standards for all new vehicle types: cars, light trucks, heavy trucks
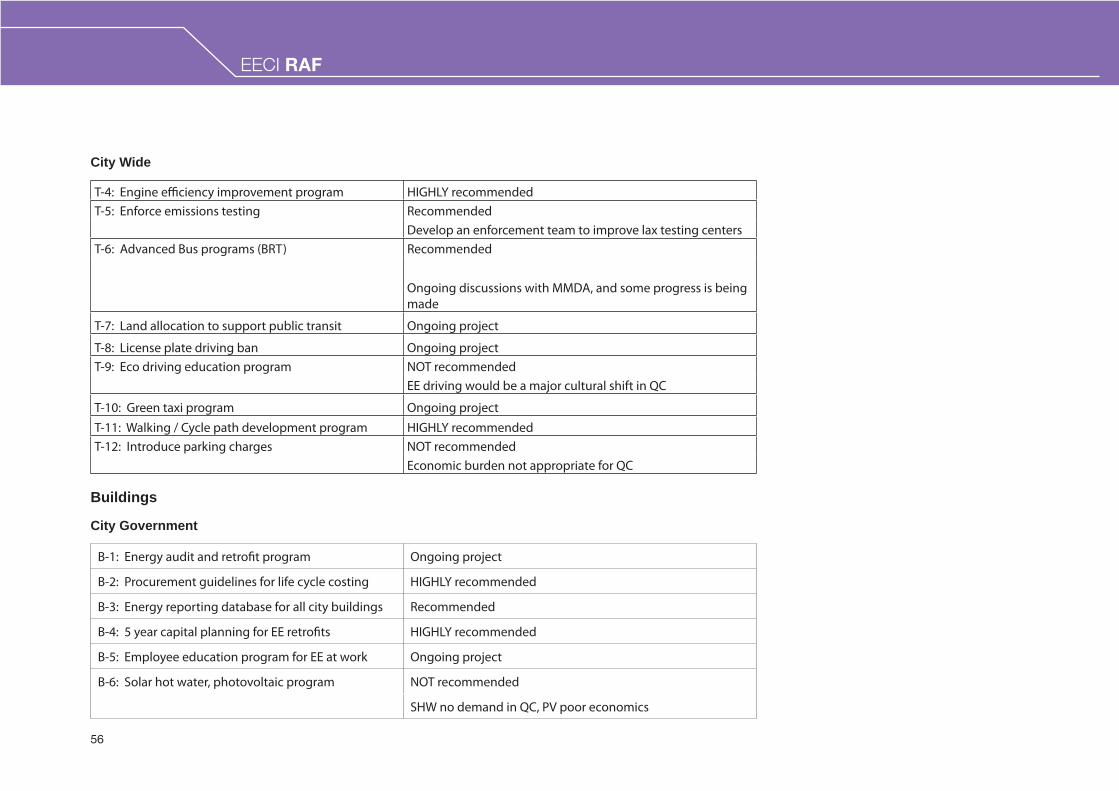
56
EECI RAF
City Wide
T-4: Engine effi ciency improvement program HIGHLY recommendedT-5: Enforce emissions testing Recommended Develop an enforcement team to improve lax testing centersT-6: Advanced Bus programs (BRT) Recommended
Ongoing discussions with MMDA, and some progress is being made
T-7: Land allocation to support public transit Ongoing project
T-8: License plate driving ban Ongoing projectT-9: Eco driving education program NOT recommended EE driving would be a major cultural shift in QC
T-10: Green taxi program Ongoing projectT-11: Walking / Cycle path development program HIGHLY recommendedT-12: Introduce parking charges NOT recommended Economic burden not appropriate for QC
Buildings
City Government
B-1: Energy audit and retrofi t program Ongoing project
B-2: Procurement guidelines for life cycle costing HIGHLY recommended
B-3: Energy reporting database for all city buildings Recommended
B-4: 5 year capital planning for EE retrofi ts HIGHLY recommended
B-5: Employee education program for EE at work Ongoing project
B-6: Solar hot water, photovoltaic program NOT recommended
SHW no demand in QC, PV poor economics
EECI RAF
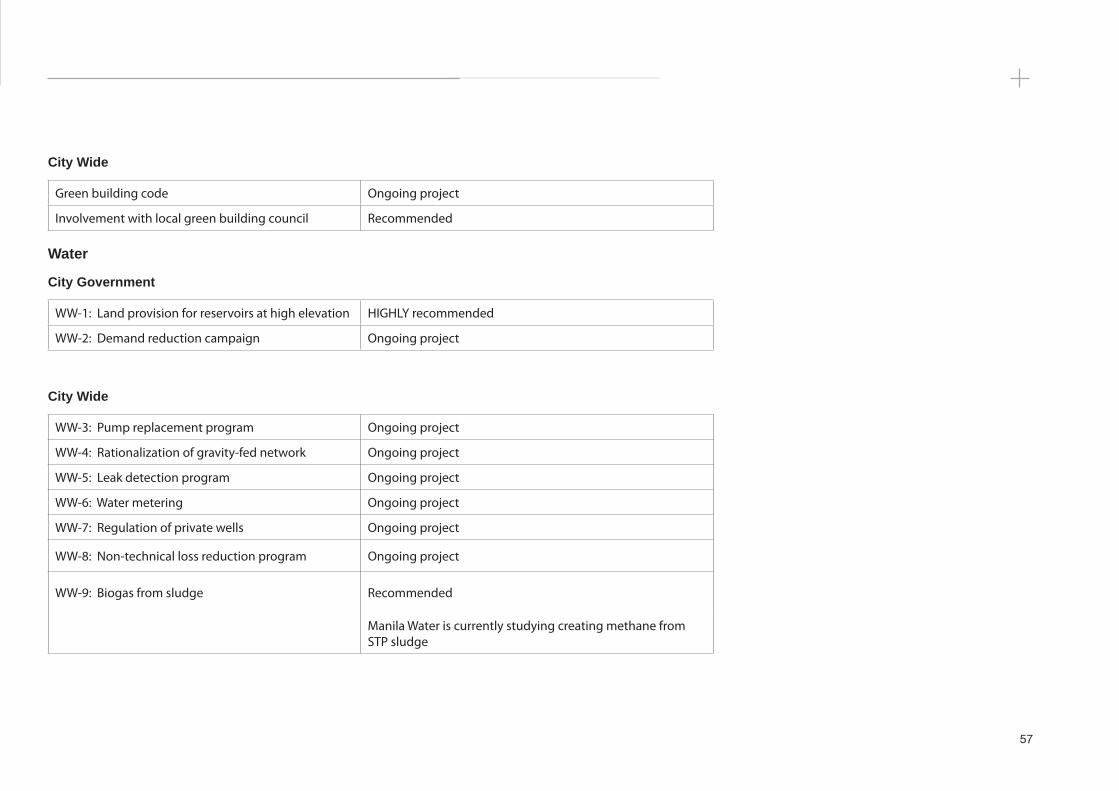
57
City Wide
Green building code Ongoing project
Involvement with local green building council Recommended
Water
City Government
WW-1: Land provision for reservoirs at high elevation HIGHLY recommended
WW-2: Demand reduction campaign Ongoing project
City Wide
WW-3: Pump replacement program Ongoing project
WW-4: Rationalization of gravity-fed network Ongoing project
WW-5: Leak detection program Ongoing project
WW-6: Water metering Ongoing project
WW-7: Regulation of private wells Ongoing project
WW-8: Non-technical loss reduction program Ongoing project
WW-9: Biogas from sludge Recommended
Manila Water is currently studying creating methane from STP sludge
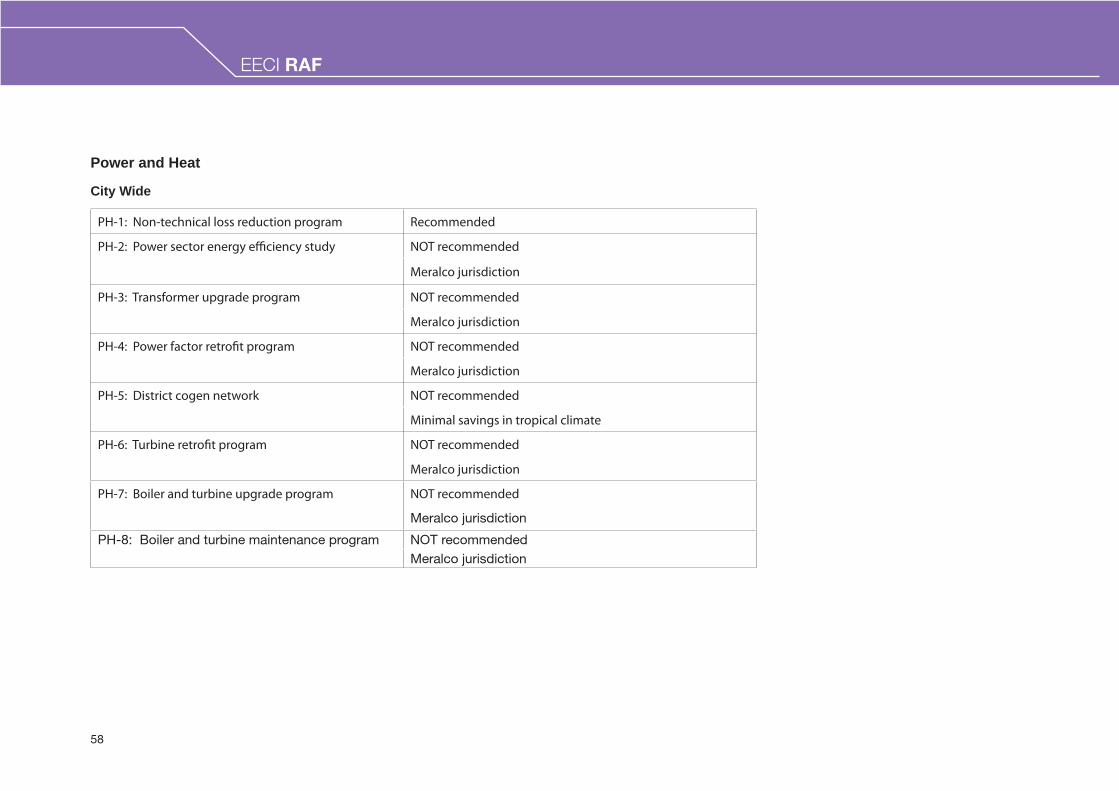
58
EECI RAF
Power and Heat
City Wide
PH-1: Non-technical loss reduction program Recommended
PH-2: Power sector energy effi ciency study NOT recommended
Meralco jurisdiction
PH-3: Transformer upgrade program NOT recommended
Meralco jurisdiction
PH-4: Power factor retrofi t program NOT recommended
Meralco jurisdiction
PH-5: District cogen network NOT recommended
Minimal savings in tropical climate
PH-6: Turbine retrofi t program NOT recommended
Meralco jurisdiction
PH-7: Boiler and turbine upgrade program NOT recommended
Meralco jurisdiction
PH-8: Boiler and turbine maintenance program NOT recommended Meralco jurisdiction
EECI RAF
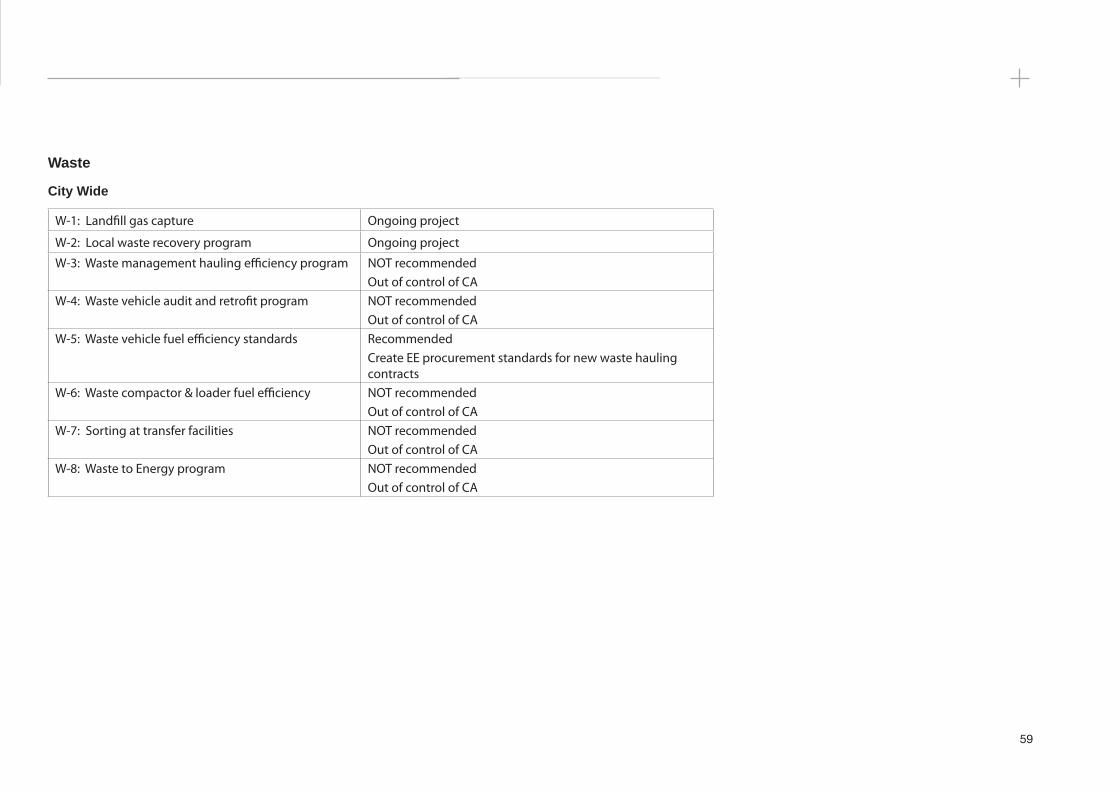
59
Waste
City Wide
W-1: Landfi ll gas capture Ongoing project
W-2: Local waste recovery program Ongoing project
W-3: Waste management hauling effi ciency program NOT recommended Out of control of CAW-4: Waste vehicle audit and retrofi t program NOT recommended Out of control of CAW-5: Waste vehicle fuel effi ciency standards Recommended
Create EE procurement standards for new waste hauling contracts
W-6: Waste compactor & loader fuel effi ciency NOT recommended Out of control of CAW-7: Sorting at transfer facilities NOT recommended Out of control of CAW-8: Waste to Energy program NOT recommended Out of control of CA
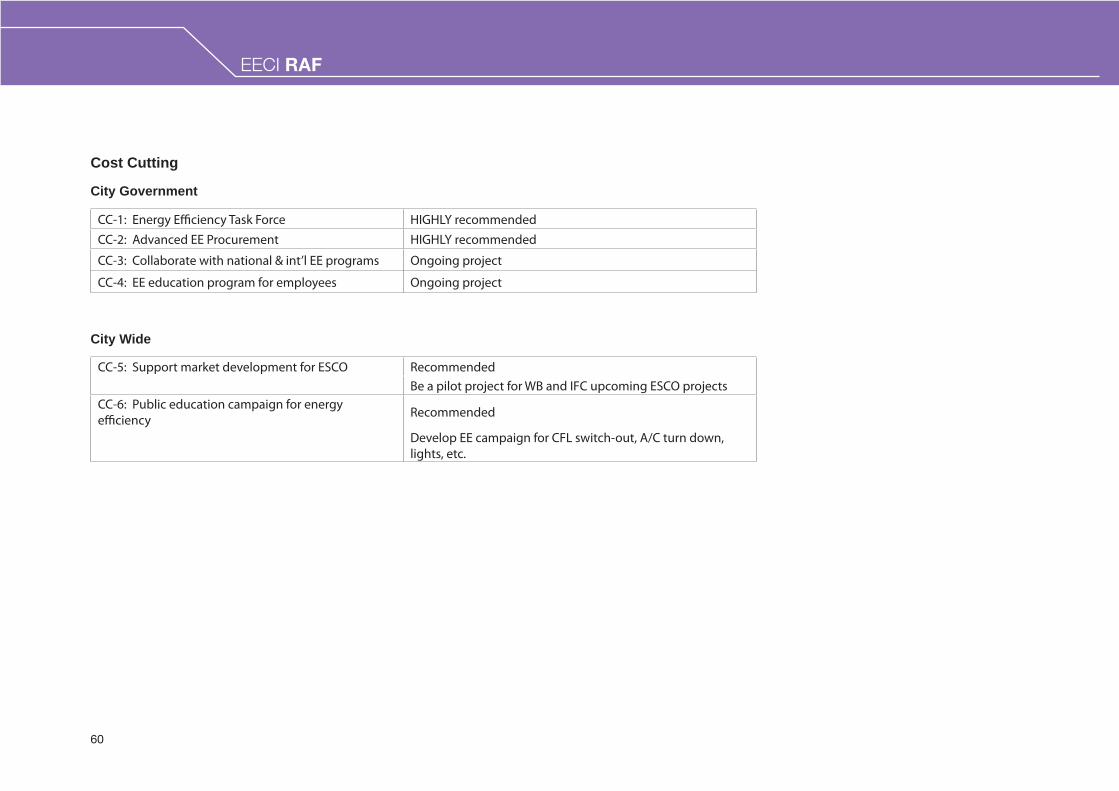
60
EECI RAF
Cost Cutting
City Government
CC-1: Energy Effi ciency Task Force HIGHLY recommendedCC-2: Advanced EE Procurement HIGHLY recommended
CC-3: Collaborate with national & int’l EE programs Ongoing project
CC-4: EE education program for employees Ongoing project
City Wide
CC-5: Support market development for ESCO Recommended Be a pilot project for WB and IFC upcoming ESCO projectsCC-6: Public education campaign for energy effi ciency Recommended
Develop EE campaign for CFL switch-out, A/C turn down, lights, etc.
EECI RAF

61

WORLD BANK ENERGY EFFICIENT CITIES INITIATIVE - RAPID ASSESSMENT FRAMEWORK
Happold Consulting Ltd.17 Newman StreetLondon, W1T 1PDUnited Kingdom
T +44 (0) 207 927 9700F +44 (0) 2007 0787 [email protected]
For further information please contactRobert Carrwww.happoldconsulting.com