Embed Size (px)
Citation preview

Howcanenvironmentalpoliciesbedesignedtobecompatiblewith(green)economicgrowth?Evidencefromfirms
andindustries
AntoineDechezleprêtre
OECDGlobalForumonEnvironment2016


Overplayedcompetitivenessconcernsinfluencepolicydesign
• Environmentalpoliciescanleadtosmallnegativeeffectsontrade,employment,plantlocationandproductivity– Inpollution- &energy-intensive,trade-exposedsectors
• Theseimpactsaresmallcomparedtootherdeterminantsoftradeandinvestmentlocation– Impactsoverplayed,butfirmslegitimatelyvoicetheirconcerns
• Infearofpotentialadversecompetitivenesseffects,recentclimatepoliciesshieldindustrialsectorsfromfullregulatorycosts

TheperverseeffectsofEUETSfreeallocationrule:thecementindustry
Observed cement installationsby activity level
Theoretical distribution
0
10
20
30
40
50
Num
bero
finstalla
tions
2012- LDCountries
0
10
20
30
40
50
Num
bero
fInstalla
tions
2012CF- LDCountries
Ø5.8Mtexcessclinkerproductionin2012(=5.2MtCO2emissions)
Activity level thresholds: free allocation reduced by 50% (resp. 75%) if production falls by 50% (resp. 75%)

Worryingconsequences
• CO2intensityoftheEuropeancementsector+5% 2011-2014!– EU2050objective:-80%CO2emissions
• Cumulativesurplus:450Mcredits(=tonnesCO2)forthecementsector
• Freeallocationsarereceivedbylarge,carbon-intensiveincumbentfirms
• SMEswhohavedevelopedcommerciallyviablelow-carboncements(e.g.Ecocem,EMC,CarbonCure,BanahCEM)getnothing

Designingpoliciescompatiblewitheconomicperformance
• WorryingaboutlosersislegitimateØLeveltheplayingfieldattheconsumptionlevel(eg consumptiontax),withoutcreatingperverseincentivesthatdiscourageefficiencyandareincompatiblewithlongtermobjectives
• Growth-compatibleenvironmentalpoliciesneedtoencourageinnovationØSupportnewtechdevelopment,includingbynewentrants,throughinnovationpolicies
ØProvidestablepollutionpricingmechanisms
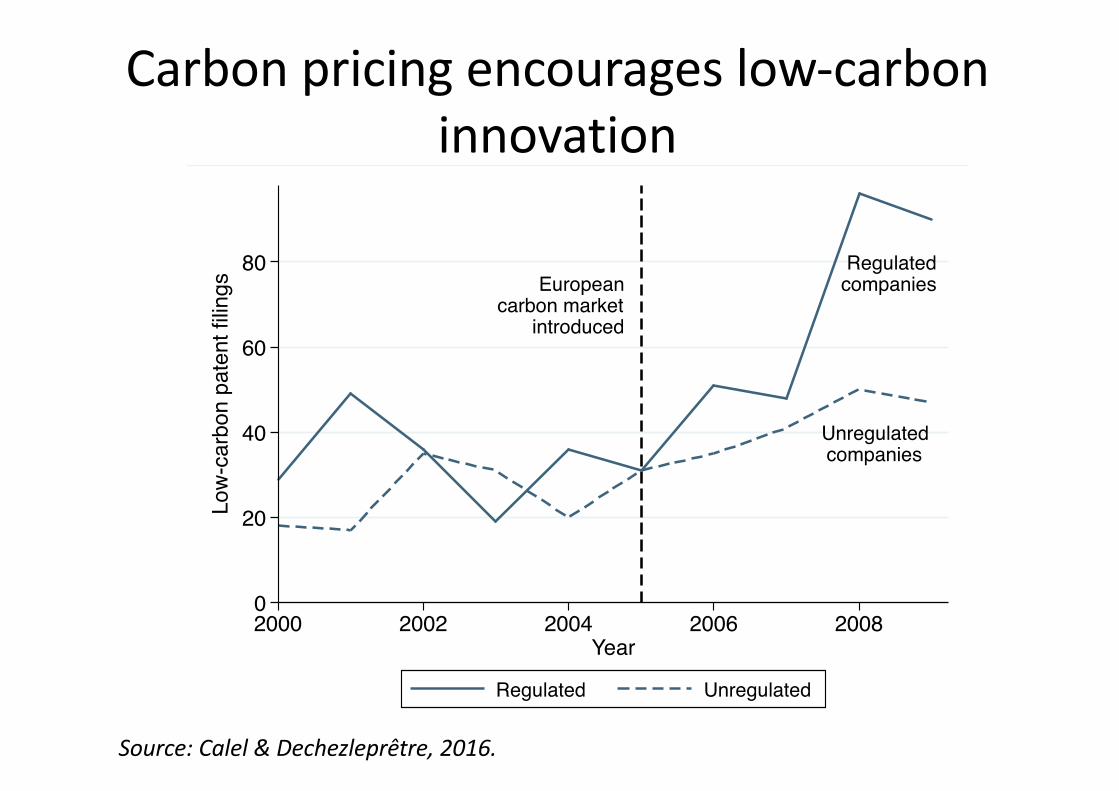
Europeancarbon market
introduced
Regulatedcompanies
Unregulatedcompanies
0
20
40
60
80
Low
-car
bon
pate
nt fi
lings
2000 2002 2004 2006 2008Year
Regulated Unregulated
Source:Calel &Dechezleprêtre,2016.
Carbonpricingencourageslow-carboninnovation

!0.3%
!0.2%
!0.1%
0%
0.1%
0.2%
0.3%
0.4%
0.5%
0.6%
Electricity%%dirty%
Car%%dirty%
Biotechs%
Electricity%clean%
Car%clean% Robot%
IT%Nano% 3D%
Baseline=averagetechnology

Source:author’scalculationsfromEPO’sPATSTATdatabase
Reversing thedangerous decline ingloballow-carbon innovation
20
40
60
80
100
Oil p
rice
(201
5 $)
3%
4%
5%
6%
Shar
e of
clim
ate-
rela
ted
inve
ntio
ns
1985 1990 1995 2000 2005 2010 2015Year
Low-carbon innovation Crude oil price
20
40
60
80
100
Oil p
rice
(201
5 $)
3%
4%
5%
6%
Shar
e of
clim
ate-
rela
ted
inve
ntio
ns
1985 1990 1995 2000 2005 2010 2015Year
Low-carbon innovation Crude oil price