Embed Size (px)
Citation preview

Daewoo Interna-tional Corporation
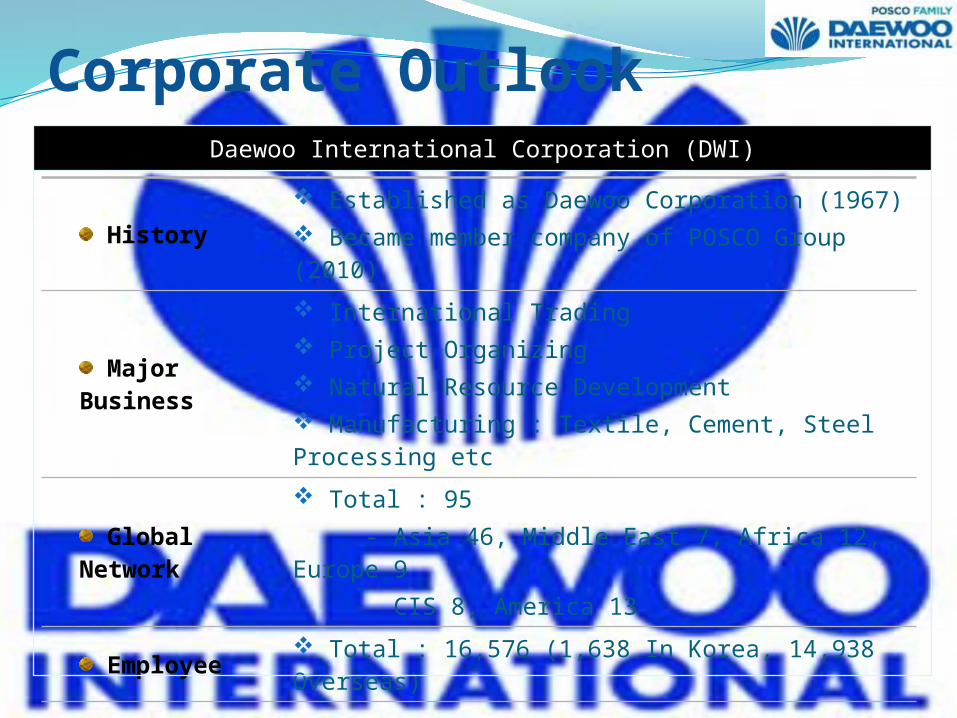
History Established as Daewoo Corporation (1967) Became member company of POSCO Group (2010)
Major Business
International Trading Project Organizing Natural Resource Development Manufacturing : Textile, Cement, Steel Processing etc
Global Network
Total : 95 - Asia 46, Middle East 7, Africa 12, Europe 9 CIS 8, America 13
Employee Total : 16,576 (1,638 In Korea, 14,938 Overseas)
Sales (2011) Sales USD 15.0 b
Corporate OutlookDaewoo International Corporation (DWI)
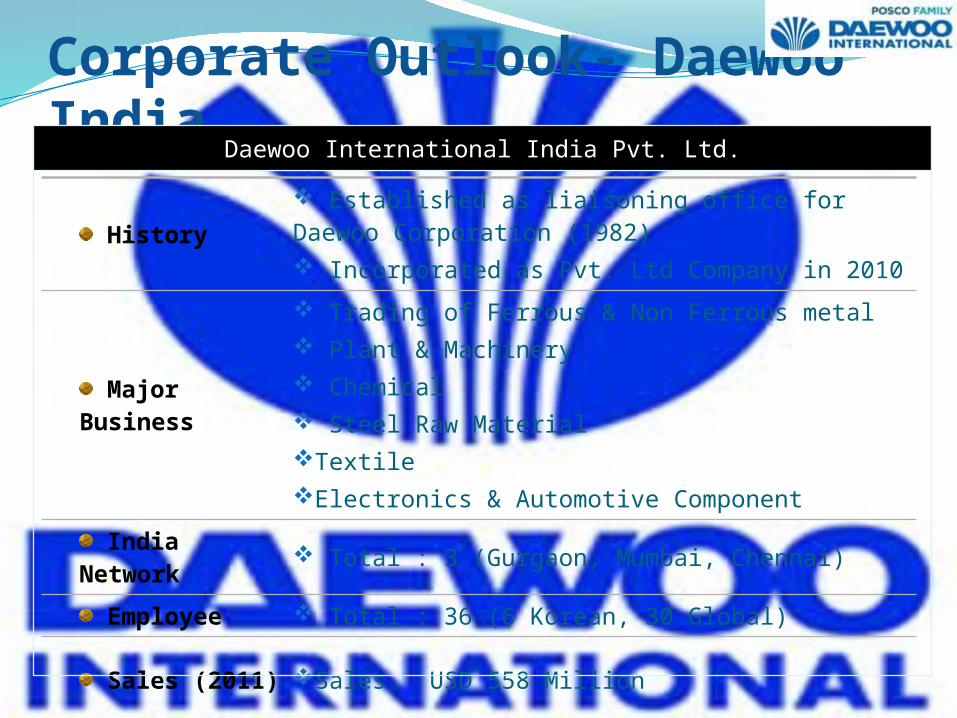
History Established as liaisoning office for Daewoo Corporation (1982) Incorporated as Pvt. Ltd Company in 2010
Major Business
Trading of Ferrous & Non Ferrous metal Plant & Machinery Chemical Steel Raw Material Textile Electronics & Automotive Component
India Network Total : 3 (Gurgaon, Mumbai, Chennai)
Employee Total : 36 (6 Korean, 30 Global)
Sales (2011) Sales USD 558 Million
Corporate Outlook- Daewoo India
Daewoo International India Pvt. Ltd.
Steel/Metal
Chemical
Raw
Machinery/Automotive
Textile
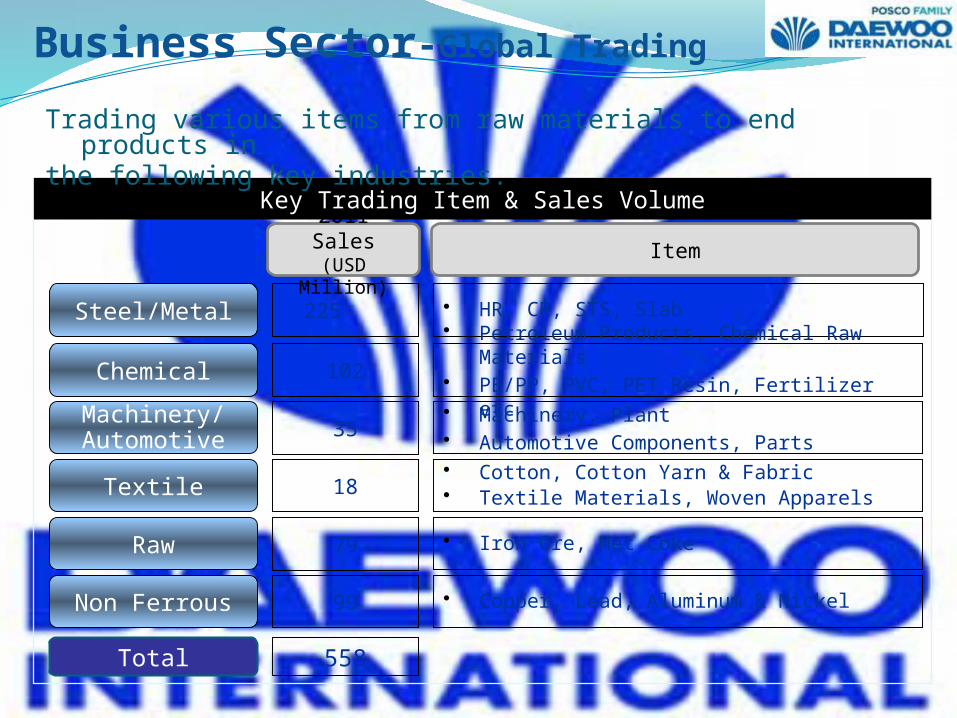
• HR, CR, STS, Slab
Non Ferrous
• Petroleum Products, Chemical Raw Materials• PE/PP, PVC, PET Resin, Fertilizer etc
• Iron Ore, Met Coke
Item2011 Sales(USD Million)
225
102
79
• Machinery, Plant• Automotive Components, Parts
35
• Cotton, Cotton Yarn & Fabric• Textile Materials, Woven Apparels18
• Copper, Lead, Aluminum & Nickel 99
Business Sector-Global Trading
Key Trading Item & Sales Volume
Trading various items from raw materials to end products in the following key industries.
Total 558
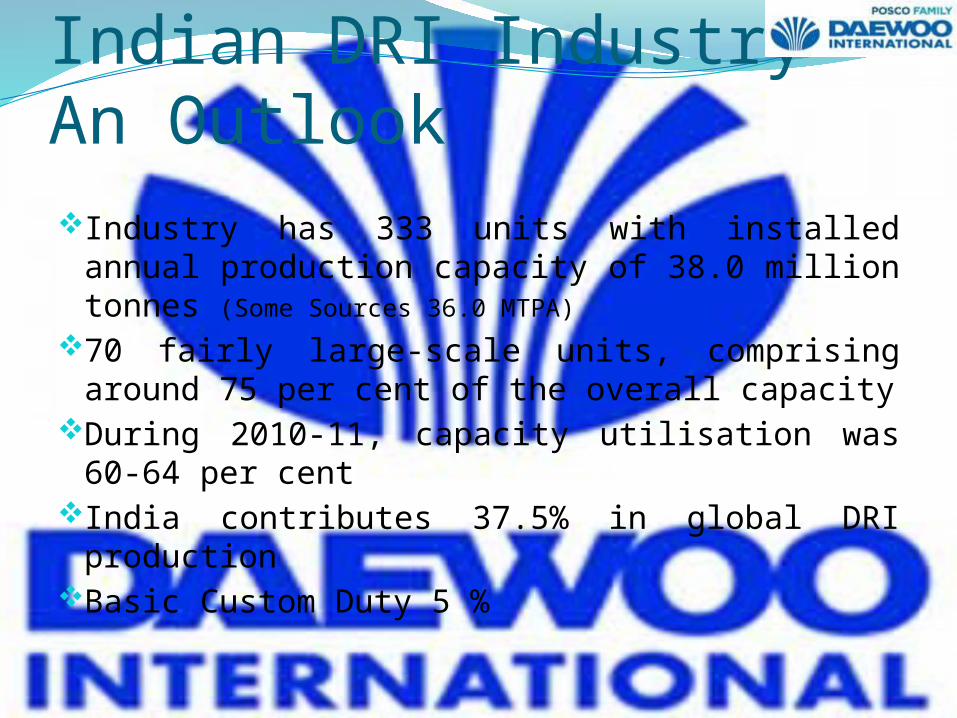
Indian DRI Industry- An OutlookIndustry has 333 units with installed annual
production capacity of 38.0 million tonnes (Some Sources 36.0 MTPA)
70 fairly large-scale units, comprising around 75 per cent of the overall capacity
During 2010-11, capacity utilisation was 60-64 per cent
India contributes 37.5% in global DRI productionBasic Custom Duty 5 %
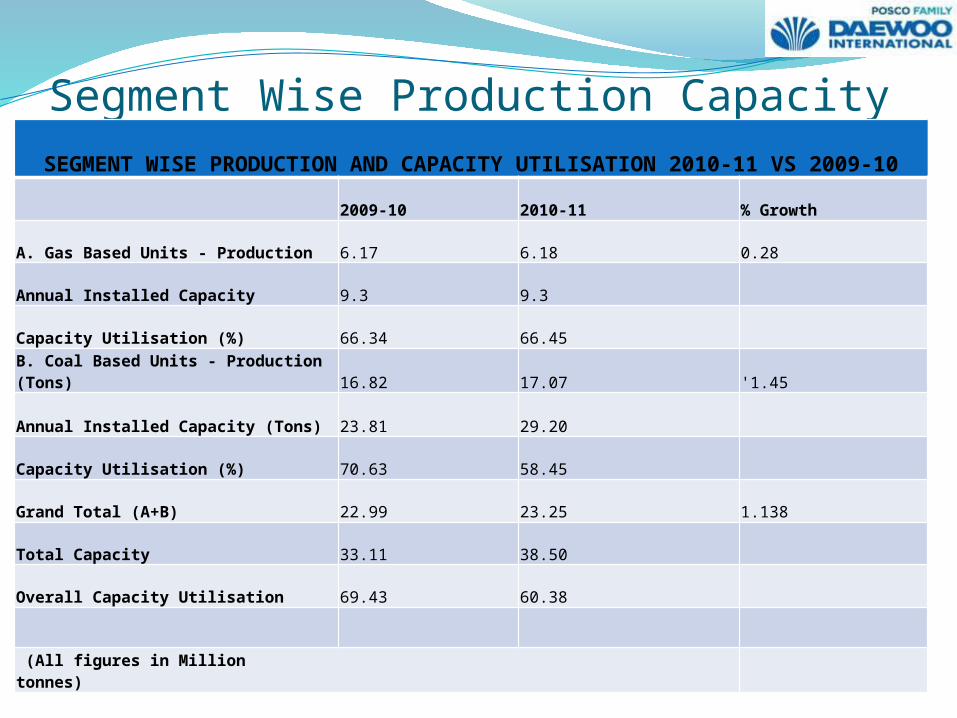
Segment Wise Production CapacitySEGMENT WISE PRODUCTION AND CAPACITY UTILISATION 2010-11 VS 2009-
10
2009-10 2010-11 % Growth
A. Gas Based Units - Production 6.17 6.18 0.28
Annual Installed Capacity 9.3 9.3
Capacity Utilisation (%) 66.34 66.45
B. Coal Based Units - Production (Tons) 16.82 17.07 '1.45
Annual Installed Capacity (Tons) 23.81 29.20
Capacity Utilisation (%) 70.63 58.45
Grand Total (A+B) 22.99 23.25 1.138
Total Capacity 33.11 38.50
Overall Capacity Utilisation 69.43 60.38
(All figures in Million tonnes)
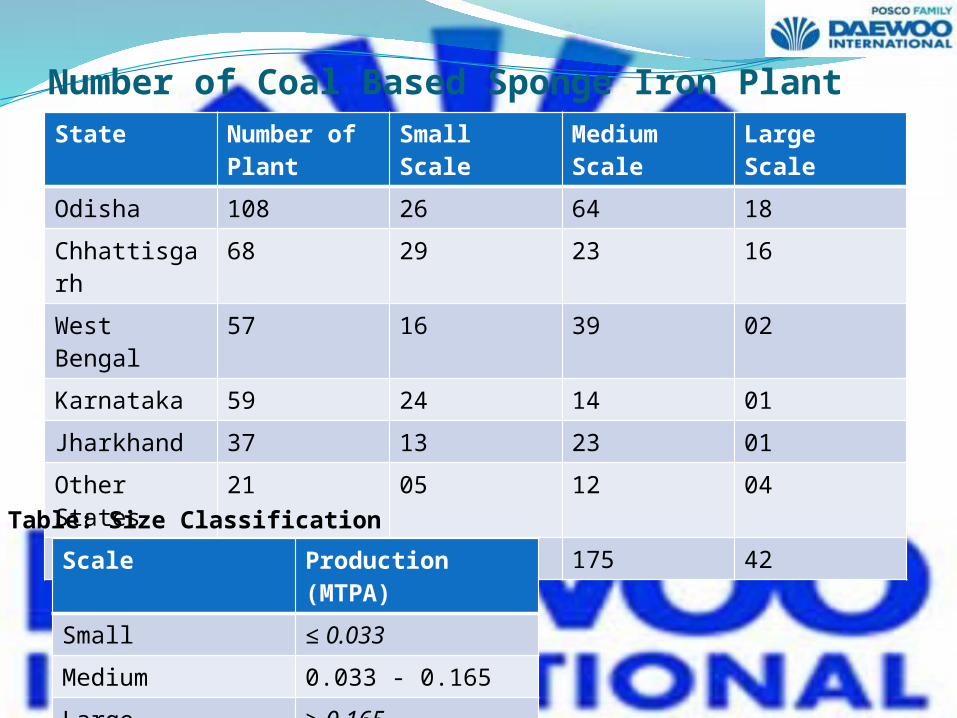
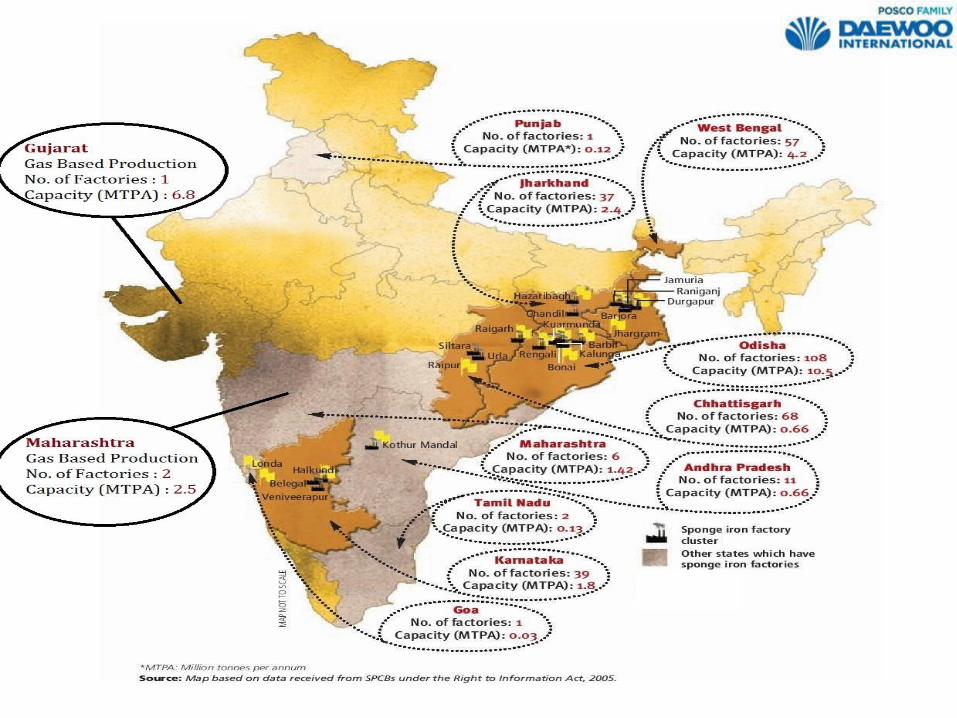
Number of Coal Based Sponge Iron PlantState Number of
PlantSmall Scale
Medium Scale
Large Scale
Odisha 108 26 64 18
Chhattisgarh
68 29 23 16
West Bengal 57 16 39 02
Karnataka 59 24 14 01
Jharkhand 37 13 23 01
Other States
21 05 12 04
Total 330 113 175 42
Scale Production (MTPA)Small ≤ 0.033Medium 0.033 - 0.165Large ≥ 0.165
Table: Size Classification
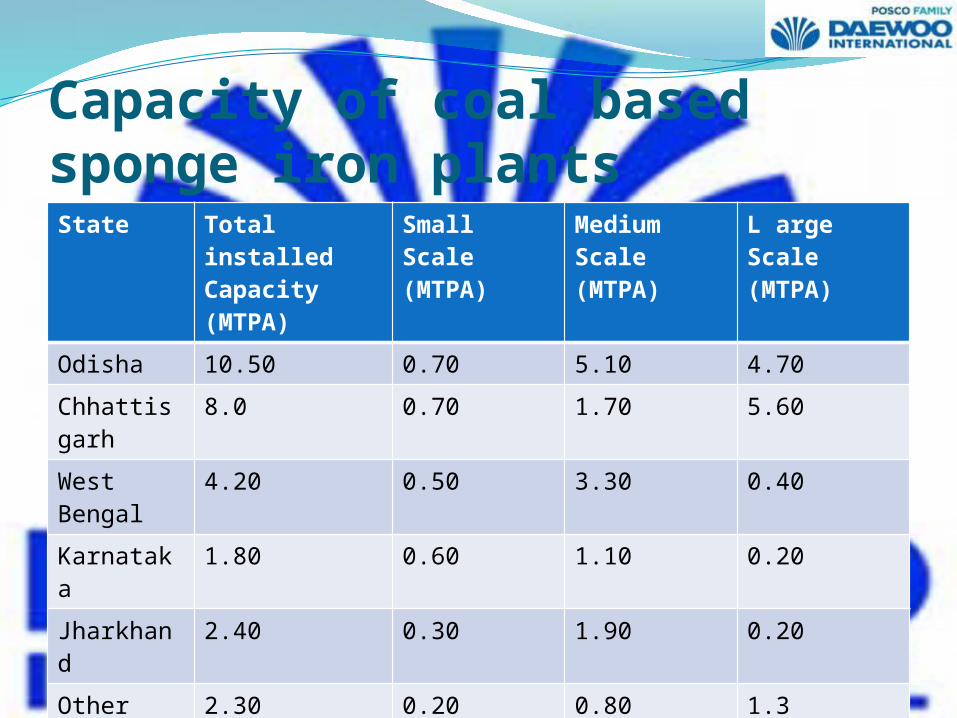
Capacity of coal based sponge iron plantsState Total
installed Capacity (MTPA)
Small Scale(MTPA)
Medium Scale (MTPA)
L arge Scale (MTPA)
Odisha 10.50 0.70 5.10 4.70
Chhattisgarh
8.0 0.70 1.70 5.60
West Bengal
4.20 0.50 3.30 0.40
Karnataka 1.80 0.60 1.10 0.20
Jharkhand 2.40 0.30 1.90 0.20
Other States
2.30 0.20 0.80 1.3
Total 29.2 3.00 13.90 12.4
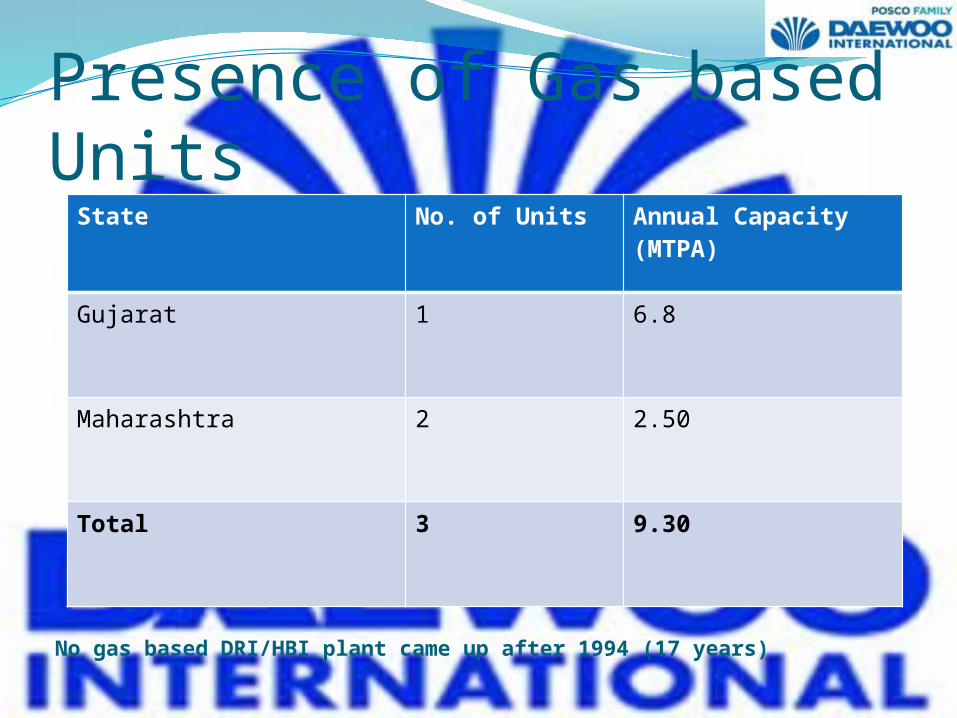
No gas based DRI/HBI plant came up after 1994 (17 years)
State No. of Units Annual Capacity (MTPA)
Gujarat 1 6.8
Maharashtra 2 2.50
Total 3 9.30
Presence of Gas based Units
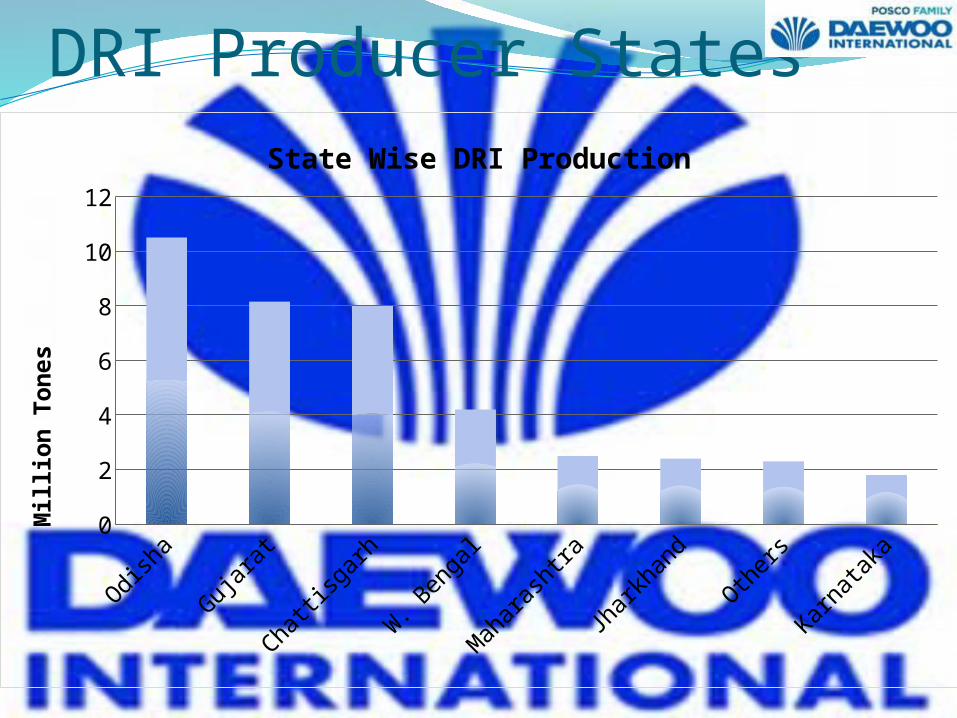
DRI Producer States
Odisha Gu-jarat
Chat-tisgarh
W. Bengal
Maha-rashtra
Jhark-hand
Others Kar-nataka
MTPA
10.5 8.15 8 4.2 2.5 2.4 2.3 1.8
1
3
5
7
9
11
State Wise DRI Production
Mil
lion
Ton
es
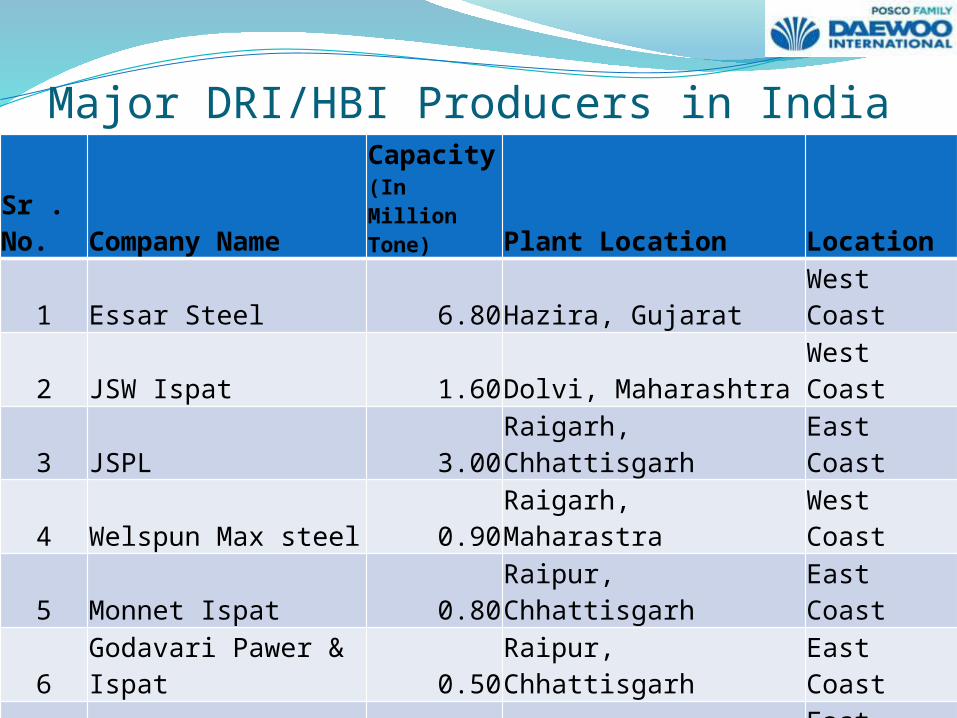
Major DRI/HBI Producers in India
Sr . No. Company NameCapacity(In Million Tone) Plant Location Location
1 Essar Steel 6.80Hazira, Gujarat West Coast
2 JSW Ispat 1.60Dolvi, Maharashtra West Coast
3 JSPL 3.00Raigarh, Chhattisgarh East Coast
4 Welspun Max steel 0.90Raigarh, Maharastra West Coast
5 Monnet Ispat 0.80Raipur, Chhattisgarh East Coast
6 Godavari Pawer & Ispat 0.50Raipur, Chhattisgarh East Coast
7 Tata Sponge 0.39 Keonjhar, Odisha East Coast
8 Rungta Mines 0.38Keonjhar, Odisha East Coast
8 Visa Steel 0.30Jajpur, Odisha East Coast
9 Lloyds Metals 0.27Chandrapur, Maharashtra West Coast
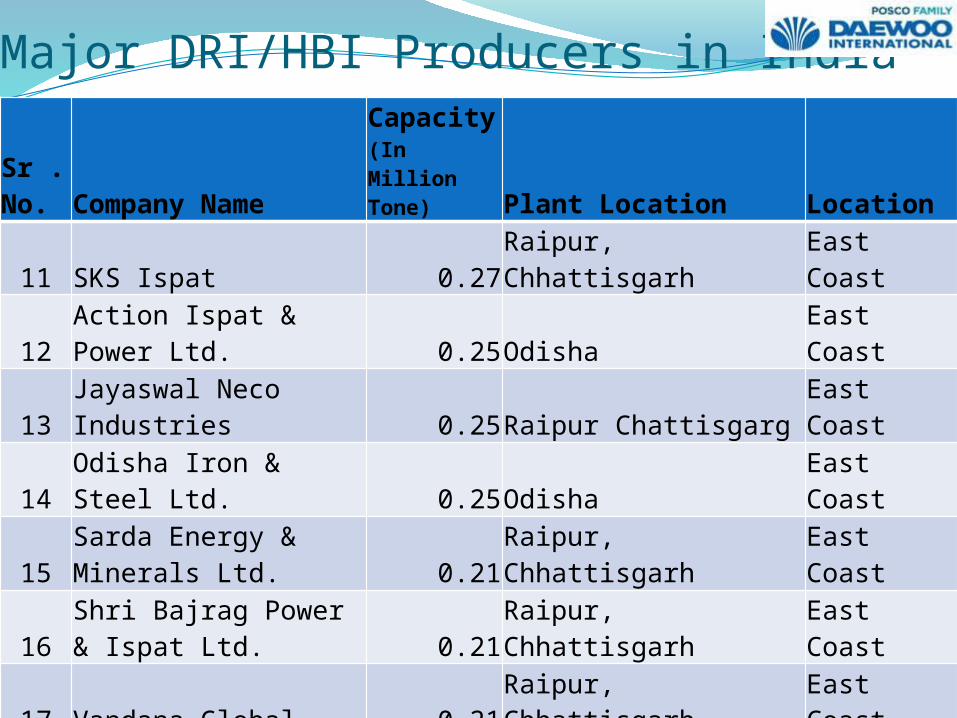
Major DRI/HBI Producers in IndiaSr . No. Company Name
Capacity(In Million Tone) Plant Location Location
11 SKS Ispat 0.27Raipur, Chhattisgarh East Coast
12 Action Ispat & Power Ltd. 0.25Odisha East Coast
13 Jayaswal Neco Industries 0.25Raipur Chattisgarg East Coast
14 Odisha Iron & Steel Ltd. 0.25Odisha East Coast
15Sarda Energy & Minerals Ltd. 0.21Raipur, Chhattisgarh East Coast
16Shri Bajrag Power & Ispat Ltd. 0.21Raipur, Chhattisgarh East Coast
17 Vandana Global 0.21Raipur, Chhattisgarh East Coast
18 SMC Power Generation 0.20Odisha East Coast
19 Nalwa Steel & Power Ltd. 0.20Raigarh, MaharashtraWest Coast
20 Janki Corporation Ltd. 0.20Bellary, Karnataka West Coast
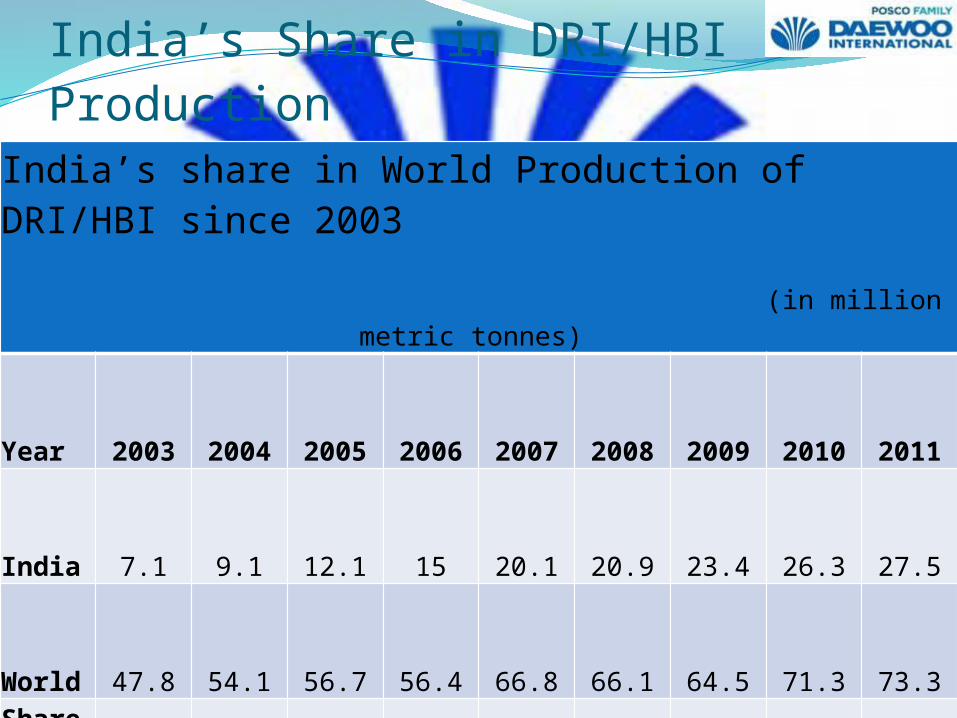
India’s Share in DRI/HBI Production
India’s share in World Production of DRI/HBI since 2003 (in million metric tonnes)
Year 2003 2004 2005 2006 2007 2008 2009 2010 2011
India 7.1 9.1 12.1 15 20.1 20.9 23.4 26.3 27.5
World 47.8 54.1 56.7 56.4 66.8 66.1 64.5 71.3 73.3Share of India 14.90% 16.80% 21.30% 26.60% 30.10% 31.60% 36.30% 36.90% 37.5%
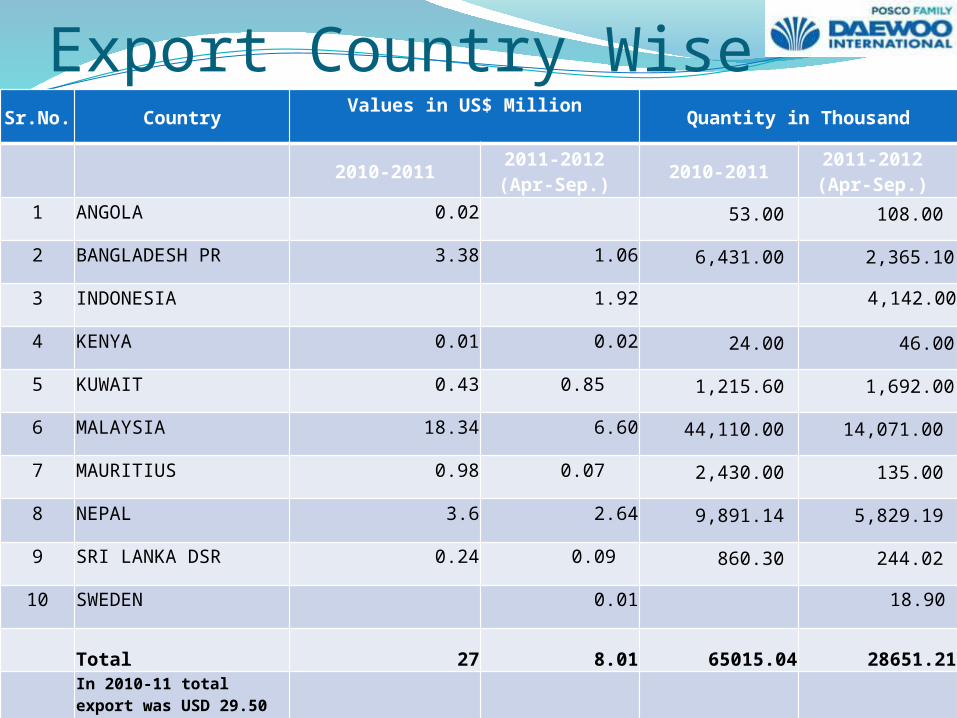
Export Country WiseSr.No. Country
Values in US$ Million
Quantity in Thousand
2010-20112011-2012 (Apr-Sep.)
2010-20112011-2012 (Apr-Sep.)
1 ANGOLA 0.02 53.00 108.00
2 BANGLADESH PR 3.38 1.06 6,431.00 2,365.10
3 INDONESIA 1.92 4,142.00
4 KENYA 0.01 0.02 24.00 46.00
5 KUWAIT 0.43 0.85 1,215.60 1,692.00
6 MALAYSIA 18.34 6.60 44,110.00 14,071.00
7 MAURITIUS 0.98 0.07 2,430.00 135.00
8 NEPAL 3.6 2.64 9,891.14 5,829.19
9 SRI LANKA DSR 0.24 0.09 860.30 244.02
10 SWEDEN 0.01 18.90
Total 27 8.01 65015.04 28651.21
In 2010-11 total export was USD 29.50 Million
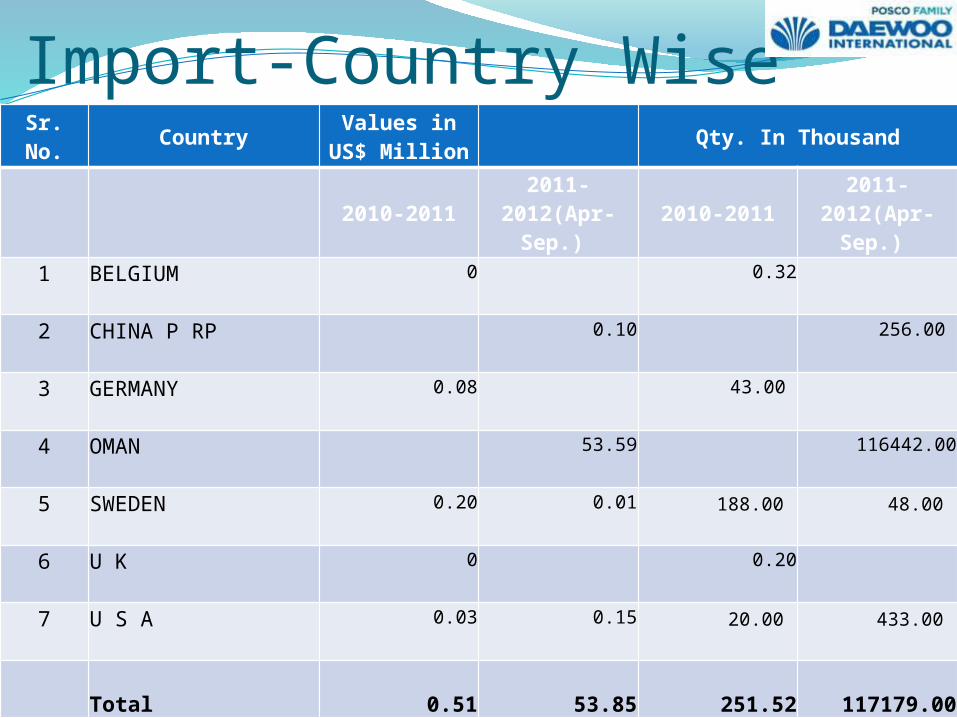
Import-Country WiseSr. No. Country Values in
US$ Million Qty. In Thousand
2010-20112011-
2012(Apr-Sep.)
2010-20112011-
2012(Apr-Sep.)
1 BELGIUM 0 0.32
2 CHINA P RP 0.10 256.00
3 GERMANY 0.08 43.00
4 OMAN 53.59 116442.00
5 SWEDEN 0.20 0.01 188.00 48.00
6 U K 0 0.20
7 U S A 0.03 0.15 20.00 433.00
Total 0.51 53.85 251.52 117179.00
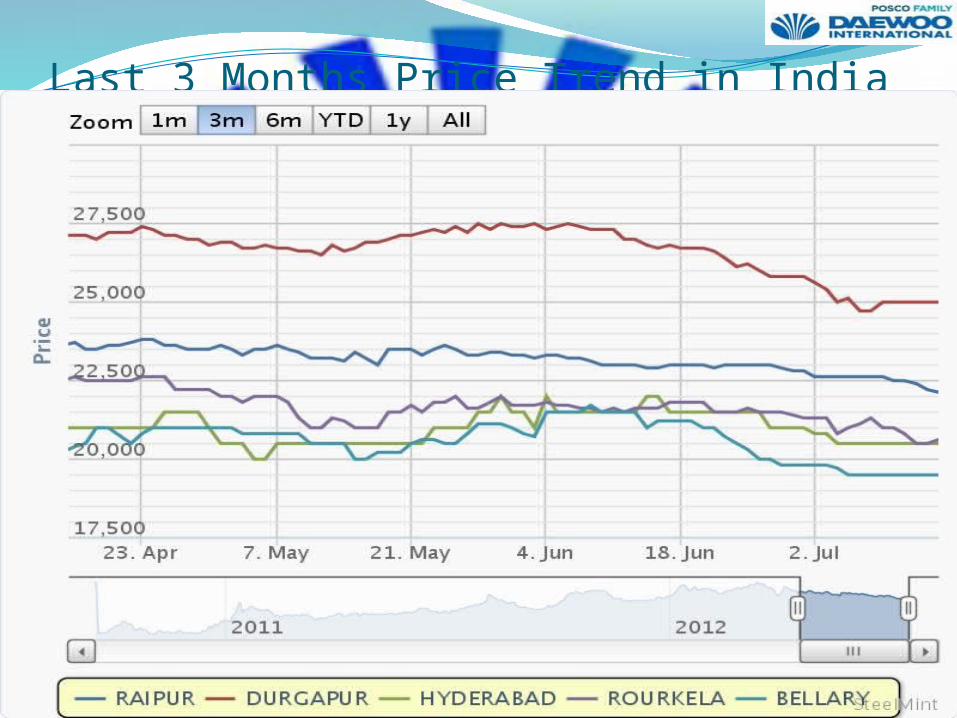
Last 3 Months Price Trend in India

LAST ONE MONTH PRICE TREND OF DRI
IN INDIAN MAJOR MARKETS
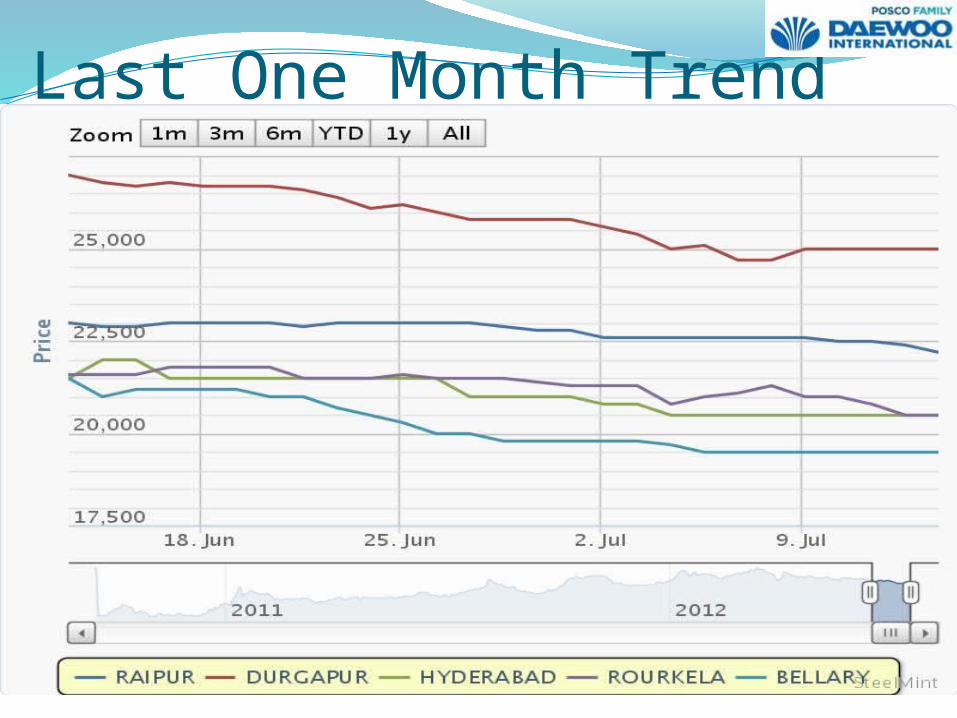
Last One Month Trend
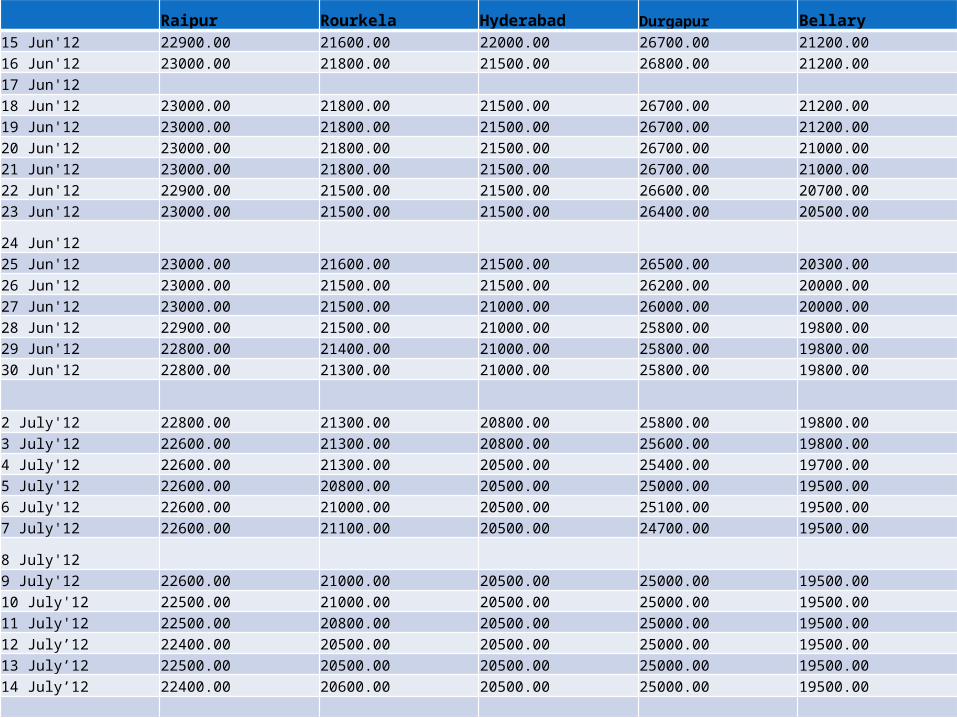
Raipur Rourkela Hyderabad Durgapur Bellary15 Jun'12 22900.00 21600.00 22000.00 26700.00 21200.0016 Jun'12 23000.00 21800.00 21500.00 26800.00 21200.0017 Jun'1218 Jun'12 23000.00 21800.00 21500.00 26700.00 21200.0019 Jun'12 23000.00 21800.00 21500.00 26700.00 21200.0020 Jun'12 23000.00 21800.00 21500.00 26700.00 21000.0021 Jun'12 23000.00 21800.00 21500.00 26700.00 21000.0022 Jun'12 22900.00 21500.00 21500.00 26600.00 20700.0023 Jun'12 23000.00 21500.00 21500.00 26400.00 20500.00
24 Jun'1225 Jun'12 23000.00 21600.00 21500.00 26500.00 20300.0026 Jun'12 23000.00 21500.00 21500.00 26200.00 20000.0027 Jun'12 23000.00 21500.00 21000.00 26000.00 20000.0028 Jun'12 22900.00 21500.00 21000.00 25800.00 19800.0029 Jun'12 22800.00 21400.00 21000.00 25800.00 19800.0030 Jun'12 22800.00 21300.00 21000.00 25800.00 19800.00
2 July'12 22800.00 21300.00 20800.00 25800.00 19800.003 July'12 22600.00 21300.00 20800.00 25600.00 19800.004 July'12 22600.00 21300.00 20500.00 25400.00 19700.005 July'12 22600.00 20800.00 20500.00 25000.00 19500.006 July'12 22600.00 21000.00 20500.00 25100.00 19500.007 July'12 22600.00 21100.00 20500.00 24700.00 19500.00
8 July'129 July'12 22600.00 21000.00 20500.00 25000.00 19500.0010 July'12 22500.00 21000.00 20500.00 25000.00 19500.0011 July'12 22500.00 20800.00 20500.00 25000.00 19500.0012 July’12 22400.00 20500.00 20500.00 25000.00 19500.0013 July’12 22500.00 20500.00 20500.00 25000.00 19500.0014 July’12 22400.00 20600.00 20500.00 25000.00 19500.00
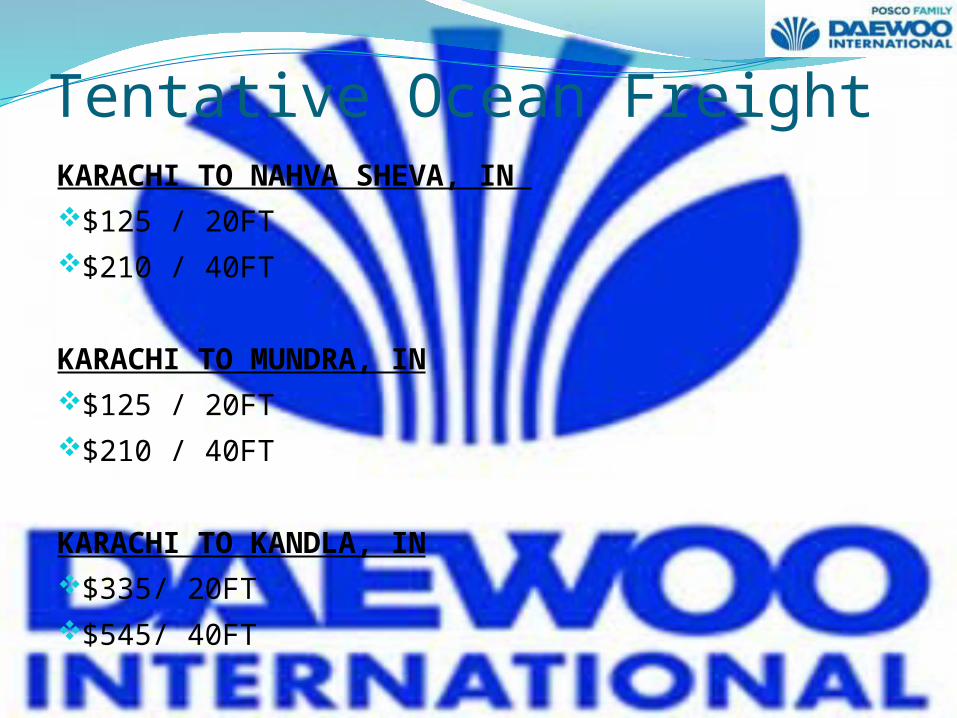
Tentative Ocean FreightKARACHI TO NAHVA SHEVA, IN $125 / 20FT$210 / 40FT
KARACHI TO MUNDRA, IN$125 / 20FT$210 / 40FT
KARACHI TO KANDLA, IN$335/ 20FT$545/ 40FT
Why Daewoo India ?Long time relationship with some of the
major consumers.Though India doesn’t import much DRI,
because of good relationship with some of big DRI consumers, we have managed to sale some good Q’ty.
May provide necessary financial support to consumers.
Possibility of stock sale to North India based customers.
Possible StrategyImport DRI through Wagah border and cater
to Punjab and Jammu based steel mills either on JIT basis or stock sale basis.
Cater to West Coast based end users like National Steel, Llyods steel, Kalyani Carpenter, Musco, etc.