Embed Size (px)
Citation preview
SEA LEVEL RISE:
TRANSPORTATION
ASSET VULNERABILITY
Chris Witt, acting Supervising Planner
RI Statewide Planning Program
• Provide an overview for state, local staff, and the public of the exposure of our transportation assets to sea level rise inundation
• Provide transportation stakeholders with best estimation of the exposure of specific roads
Project Objectives
• Develop desktop vulnerability method for ranking adaptation priorities
• ID state transportation assets at highest risk
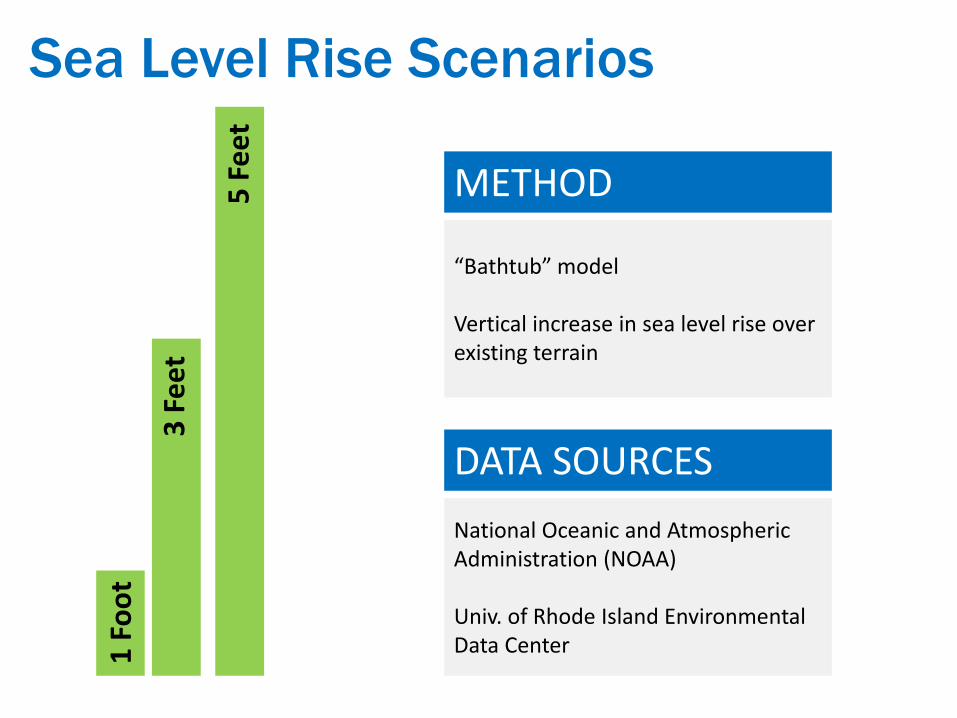
Sea Level Rise Scenarios
3 F
ee
t
1 F
oo
t
5 F
ee
t
DATA SOURCES
National Oceanic and Atmospheric Administration (NOAA) Univ. of Rhode Island Environmental Data Center
METHOD
“Bathtub” model Vertical increase in sea level rise over existing terrain
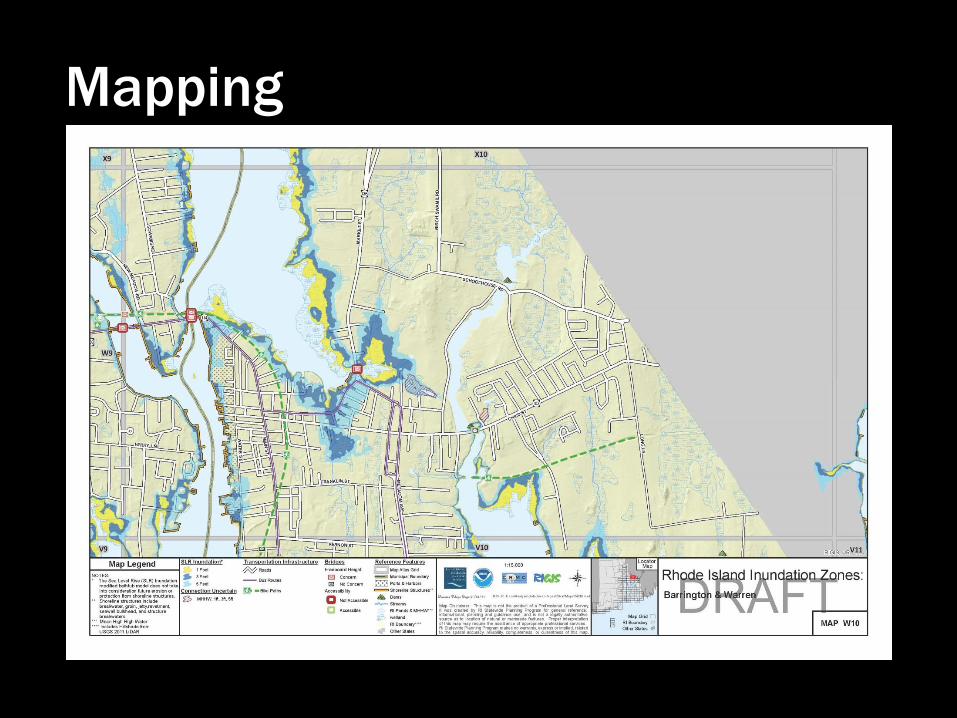
Mapping
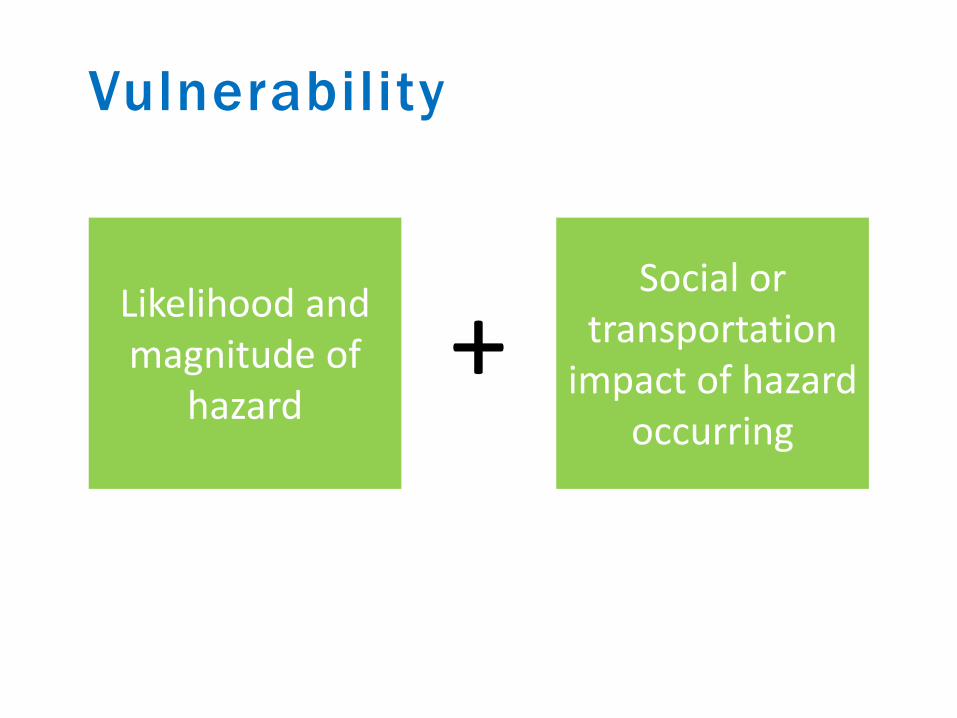
Vulnerability
Likelihood and magnitude of
hazard
Social or transportation
impact of hazard occurring
+
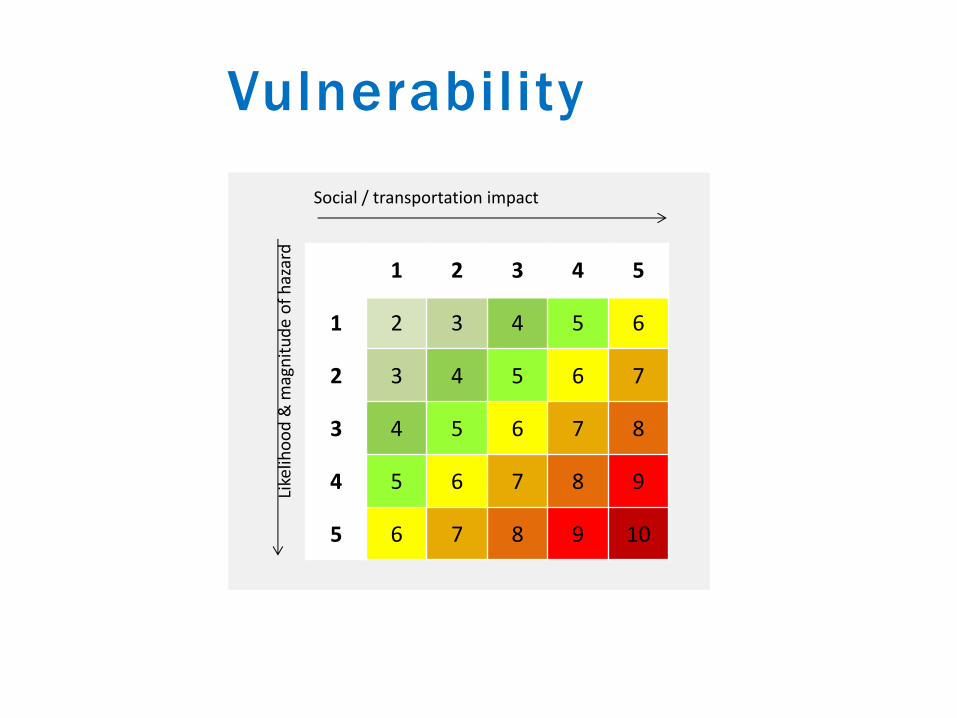
Social / transportation impact
Like
liho
od
& m
agn
itu
de
of
haz
ard
Vulnerability
1 2 3 4 5
1 2 3 4 5 6
2 3 4 5 6 7
3 4 5 6 7 8
4 5 6 7 8 9
5 6 7 8 9 10
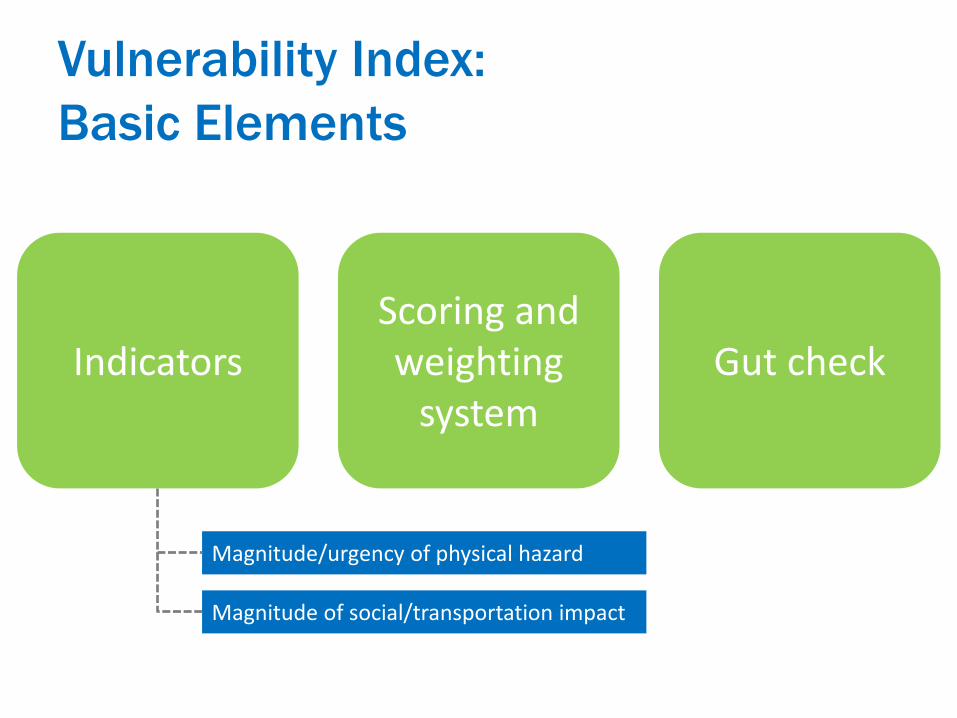
Vulnerability Index:
Basic Elements
Indicators Scoring and weighting
system Gut check
Magnitude/urgency of physical hazard
Magnitude of social/transportation impact
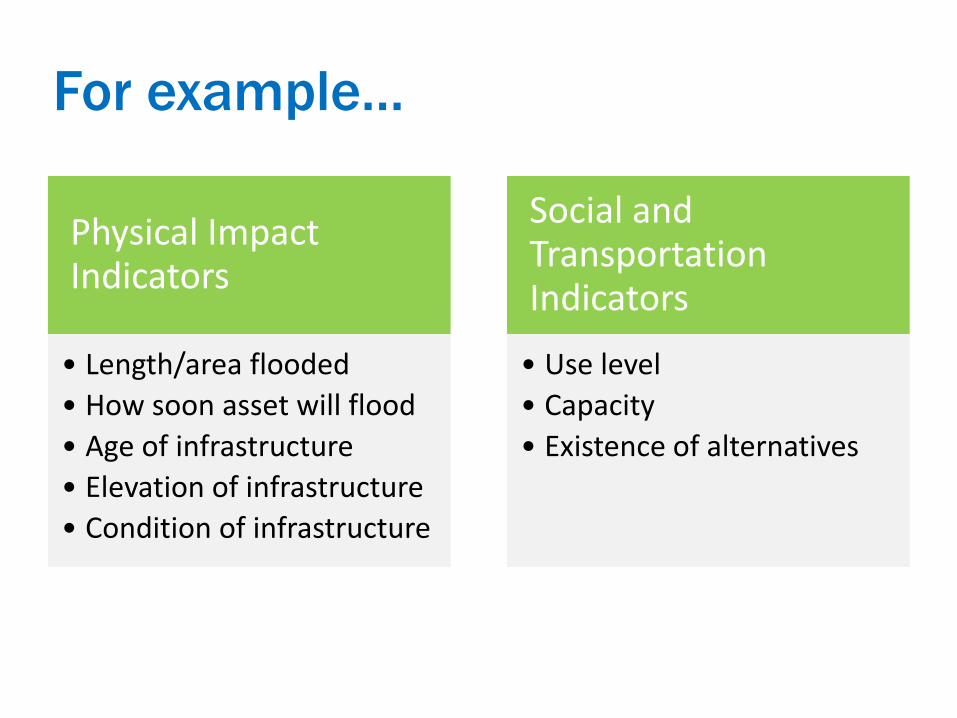
For example…
Physical Impact Indicators
• Length/area flooded
• How soon asset will flood
• Age of infrastructure
• Elevation of infrastructure
• Condition of infrastructure
Social and Transportation Indicators
• Use level
• Capacity
• Existence of alternatives
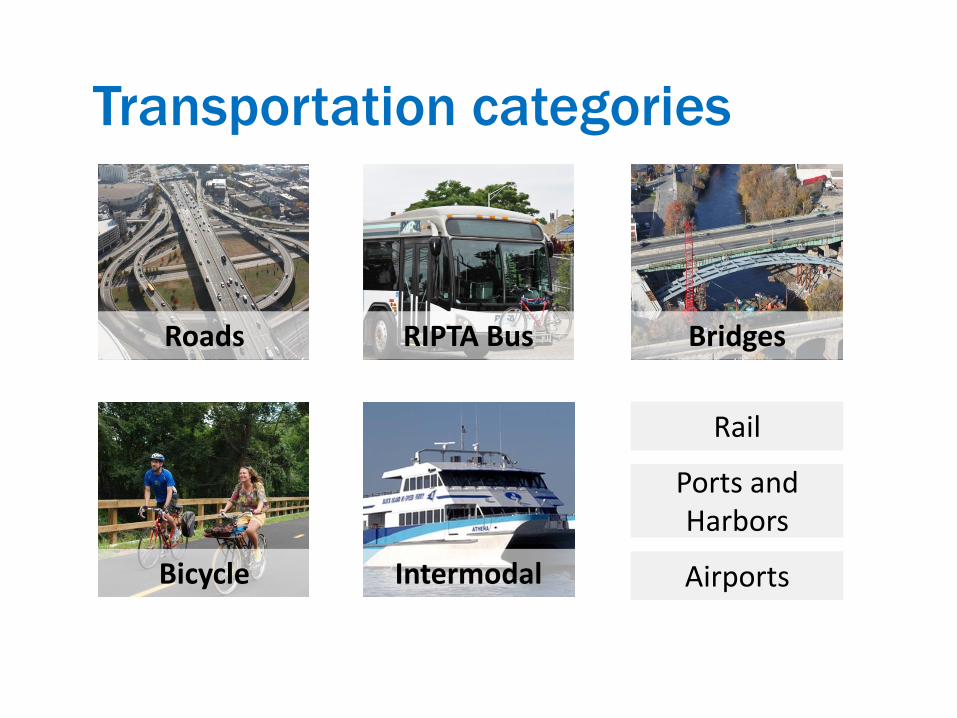
Transportation categories
Roads RIPTA Bus Bridges
Bicycle Intermodal
Rail
Ports and Harbors
Airports
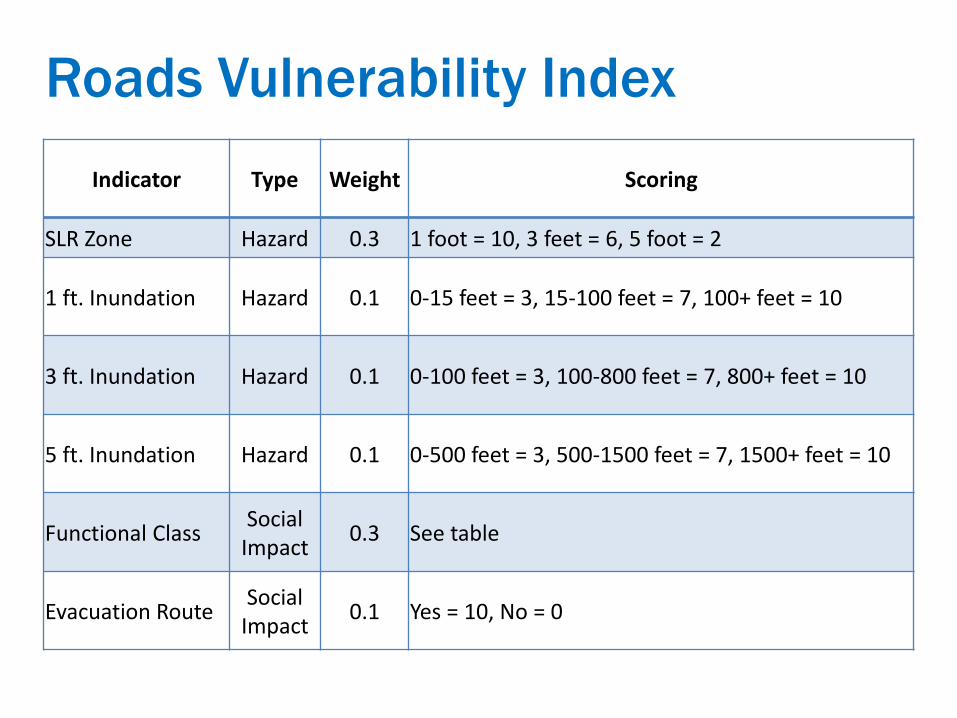
Roads Vulnerability Index
Indicator Type Weight Scoring
SLR Zone Hazard 0.3 1 foot = 10, 3 feet = 6, 5 foot = 2
1 ft. Inundation Hazard 0.1 0-15 feet = 3, 15-100 feet = 7, 100+ feet = 10
3 ft. Inundation Hazard 0.1 0-100 feet = 3, 100-800 feet = 7, 800+ feet = 10
5 ft. Inundation Hazard 0.1 0-500 feet = 3, 500-1500 feet = 7, 1500+ feet = 10
Functional Class Social
Impact 0.3 See table
Evacuation Route Social
Impact 0.1 Yes = 10, No = 0
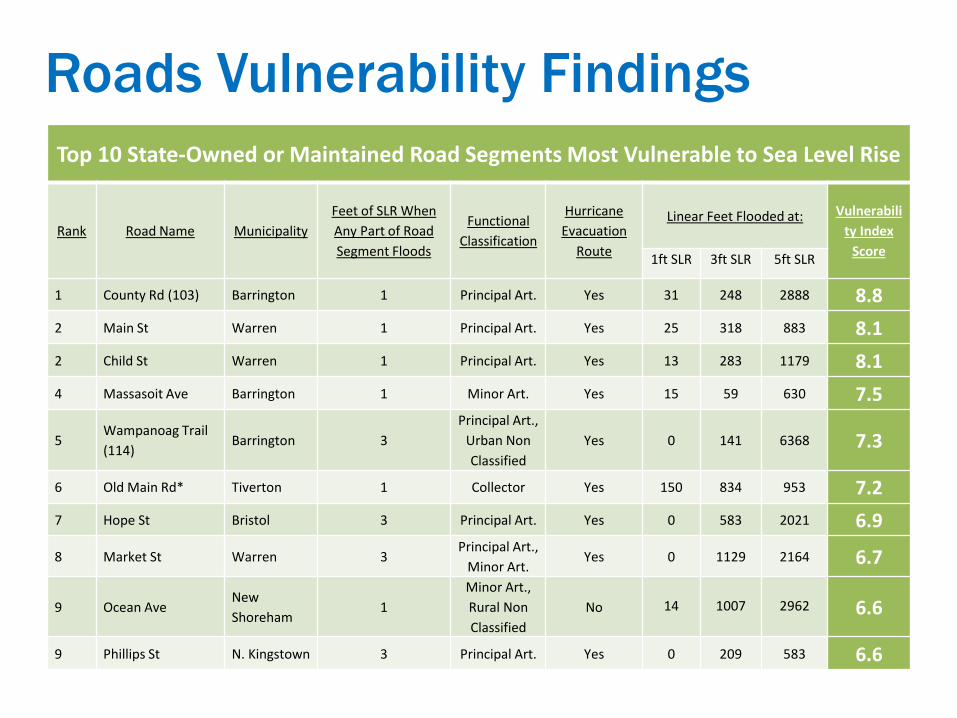
Roads Vulnerability Findings
Top 10 State-Owned or Maintained Road Segments Most Vulnerable to Sea Level Rise
Rank Road Name Municipality
Feet of SLR When
Any Part of Road
Segment Floods
Functional
Classification
Hurricane
Evacuation
Route
Linear Feet Flooded at: Vulnerabili
ty Index
Score 1ft SLR 3ft SLR 5ft SLR
1 County Rd (103) Barrington 1 Principal Art. Yes 31 248 2888 8.8
2 Main St Warren 1 Principal Art. Yes 25 318 883 8.1
2 Child St Warren 1 Principal Art. Yes 13 283 1179 8.1
4 Massasoit Ave Barrington 1 Minor Art. Yes 15 59 630 7.5
5 Wampanoag Trail
(114) Barrington 3
Principal Art.,
Urban Non
Classified
Yes 0 141 6368 7.3
6 Old Main Rd* Tiverton 1 Collector Yes 150 834 953 7.2
7 Hope St Bristol 3 Principal Art. Yes 0 583 2021 6.9
8 Market St Warren 3 Principal Art.,
Minor Art. Yes 0 1129 2164 6.7
9 Ocean Ave New
Shoreham 1
Minor Art.,
Rural Non
Classified
No 14 1007 2962 6.6
9 Phillips St N. Kingstown 3 Principal Art. Yes 0 209 583 6.6
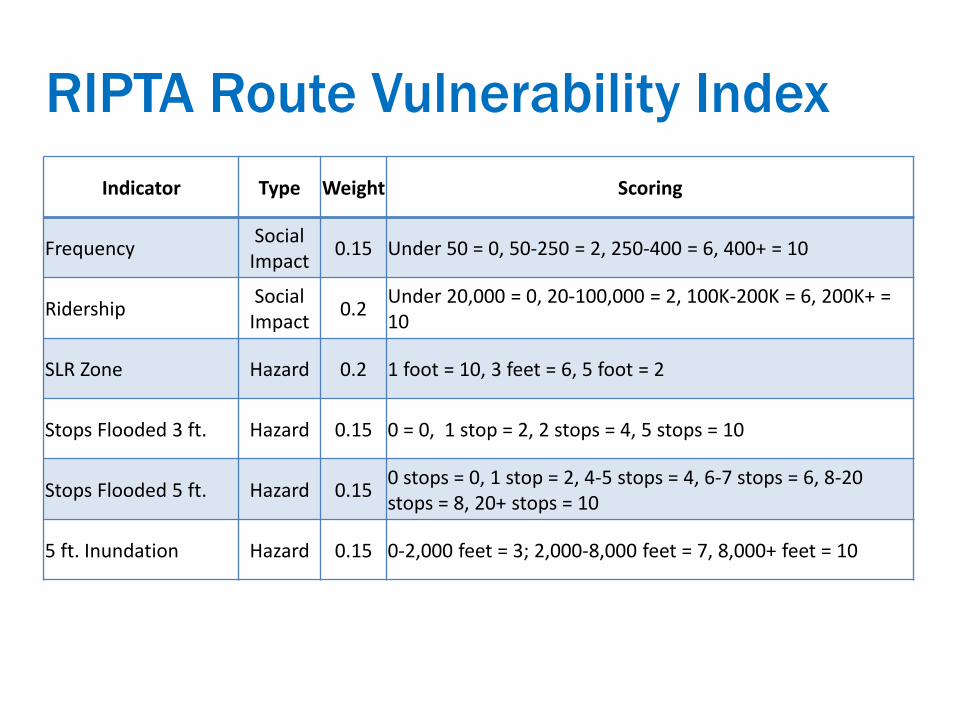
RIPTA Route Vulnerability Index
Indicator Type Weight Scoring
Frequency Social
Impact 0.15 Under 50 = 0, 50-250 = 2, 250-400 = 6, 400+ = 10
Ridership Social
Impact 0.2
Under 20,000 = 0, 20-100,000 = 2, 100K-200K = 6, 200K+ = 10
SLR Zone Hazard 0.2 1 foot = 10, 3 feet = 6, 5 foot = 2
Stops Flooded 3 ft. Hazard 0.15 0 = 0, 1 stop = 2, 2 stops = 4, 5 stops = 10
Stops Flooded 5 ft. Hazard 0.15 0 stops = 0, 1 stop = 2, 4-5 stops = 4, 6-7 stops = 6, 8-20 stops = 8, 20+ stops = 10
5 ft. Inundation Hazard 0.15 0-2,000 feet = 3; 2,000-8,000 feet = 7, 8,000+ feet = 10
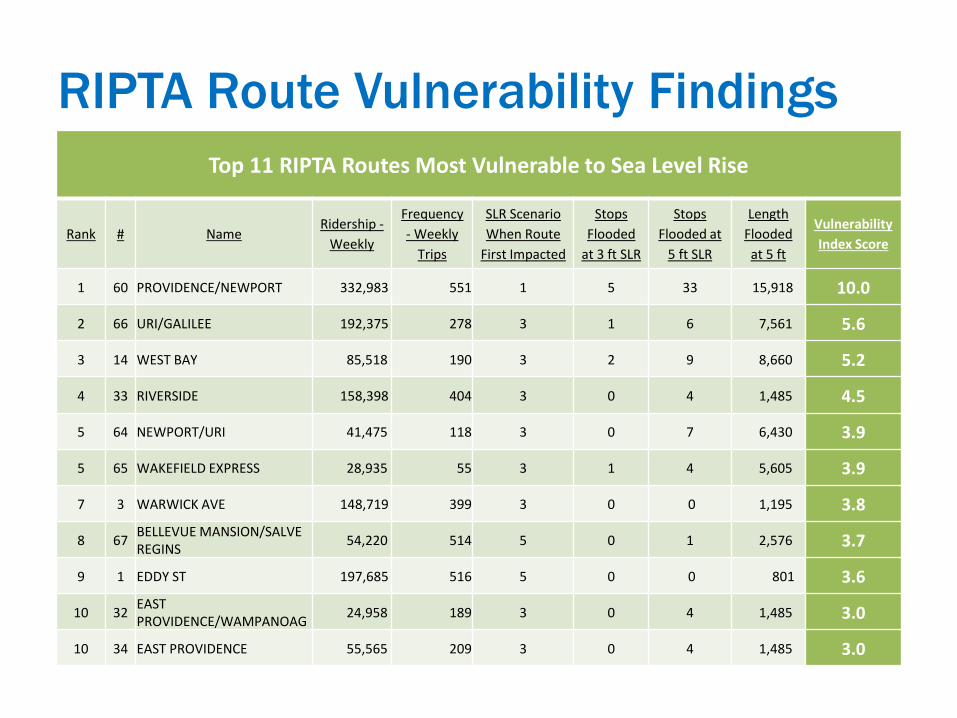
RIPTA Route Vulnerability Findings
Top 11 RIPTA Routes Most Vulnerable to Sea Level Rise
Rank # Name Ridership -
Weekly
Frequency
- Weekly
Trips
SLR Scenario
When Route
First Impacted
Stops
Flooded
at 3 ft SLR
Stops
Flooded at
5 ft SLR
Length
Flooded
at 5 ft
Vulnerability
Index Score
1 60 PROVIDENCE/NEWPORT 332,983 551 1 5 33 15,918 10.0
2 66 URI/GALILEE 192,375 278 3 1 6 7,561 5.6
3 14 WEST BAY 85,518 190 3 2 9 8,660 5.2
4 33 RIVERSIDE 158,398 404 3 0 4 1,485 4.5
5 64 NEWPORT/URI 41,475 118 3 0 7 6,430 3.9
5 65 WAKEFIELD EXPRESS 28,935 55 3 1 4 5,605 3.9
7 3 WARWICK AVE 148,719 399 3 0 0 1,195 3.8
8 67 BELLEVUE MANSION/SALVE REGINS
54,220 514 5 0 1 2,576 3.7
9 1 EDDY ST 197,685 516 5 0 0 801 3.6
10 32 EAST PROVIDENCE/WAMPANOAG
24,958 189 3 0 4 1,485 3.0
10 34 EAST PROVIDENCE 55,565 209 3 0 4 1,485 3.0
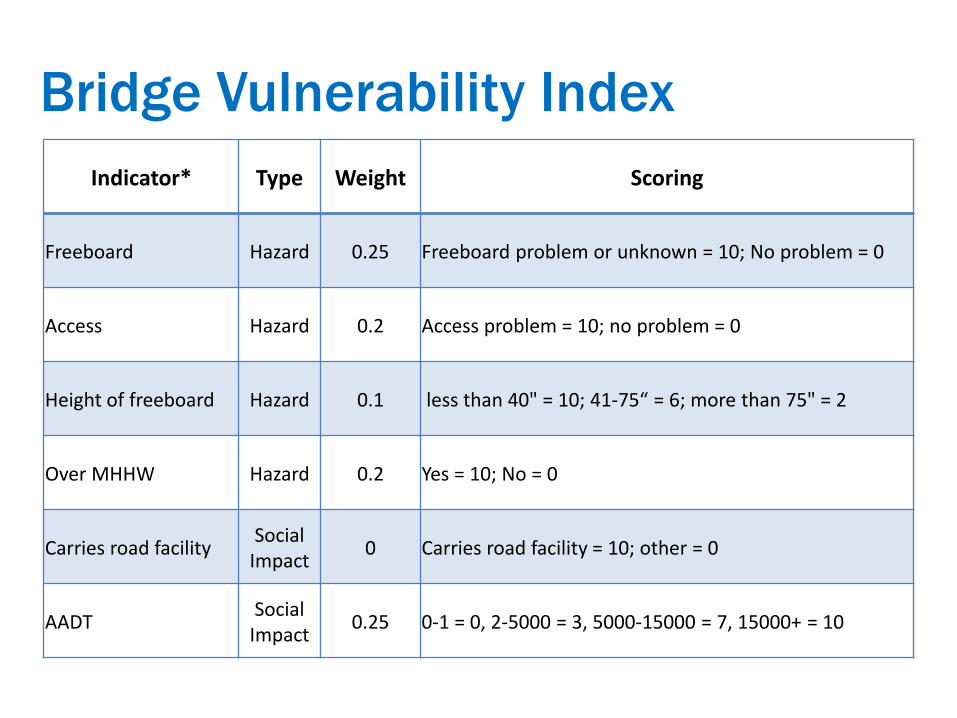
Bridge Vulnerability Index
Indicator* Type Weight Scoring
Freeboard Hazard 0.25 Freeboard problem or unknown = 10; No problem = 0
Access Hazard 0.2 Access problem = 10; no problem = 0
Height of freeboard Hazard 0.1 less than 40" = 10; 41-75“ = 6; more than 75" = 2
Over MHHW Hazard 0.2 Yes = 10; No = 0
Carries road facility Social
Impact 0 Carries road facility = 10; other = 0
AADT Social
Impact 0.25 0-1 = 0, 2-5000 = 3, 5000-15000 = 7, 15000+ = 10
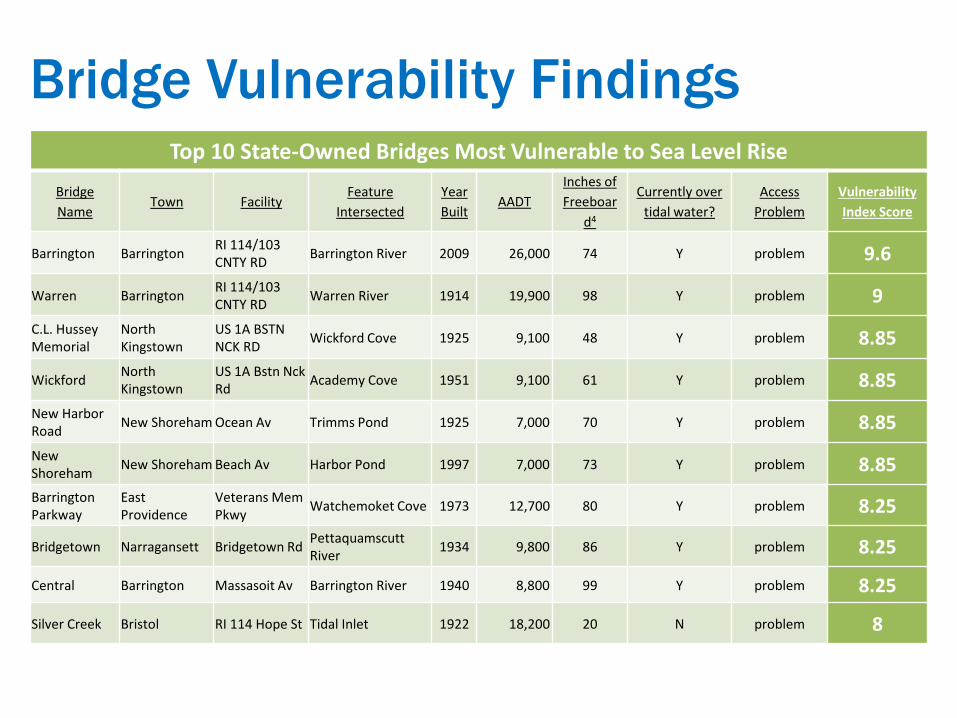
Bridge Vulnerability Findings Top 10 State-Owned Bridges Most Vulnerable to Sea Level Rise
Bridge
Name Town Facility
Feature
Intersected
Year
Built AADT
Inches of
Freeboar
d4
Currently over
tidal water?
Access
Problem
Vulnerability
Index Score
Barrington Barrington RI 114/103 CNTY RD
Barrington River 2009 26,000 74 Y problem 9.6
Warren Barrington RI 114/103 CNTY RD
Warren River 1914 19,900 98 Y problem 9
C.L. Hussey Memorial
North Kingstown
US 1A BSTN NCK RD
Wickford Cove 1925 9,100 48 Y problem 8.85
Wickford North Kingstown
US 1A Bstn Nck Rd
Academy Cove 1951 9,100 61 Y problem 8.85
New Harbor Road
New Shoreham Ocean Av Trimms Pond 1925 7,000 70 Y problem 8.85
New Shoreham
New Shoreham Beach Av Harbor Pond 1997 7,000 73 Y problem 8.85
Barrington Parkway
East Providence
Veterans Mem Pkwy
Watchemoket Cove 1973 12,700 80 Y problem 8.25
Bridgetown Narragansett Bridgetown Rd Pettaquamscutt River
1934 9,800 86 Y problem 8.25
Central Barrington Massasoit Av Barrington River 1940 8,800 99 Y problem 8.25
Silver Creek Bristol RI 114 Hope St Tidal Inlet 1922 18,200 20 N problem 8
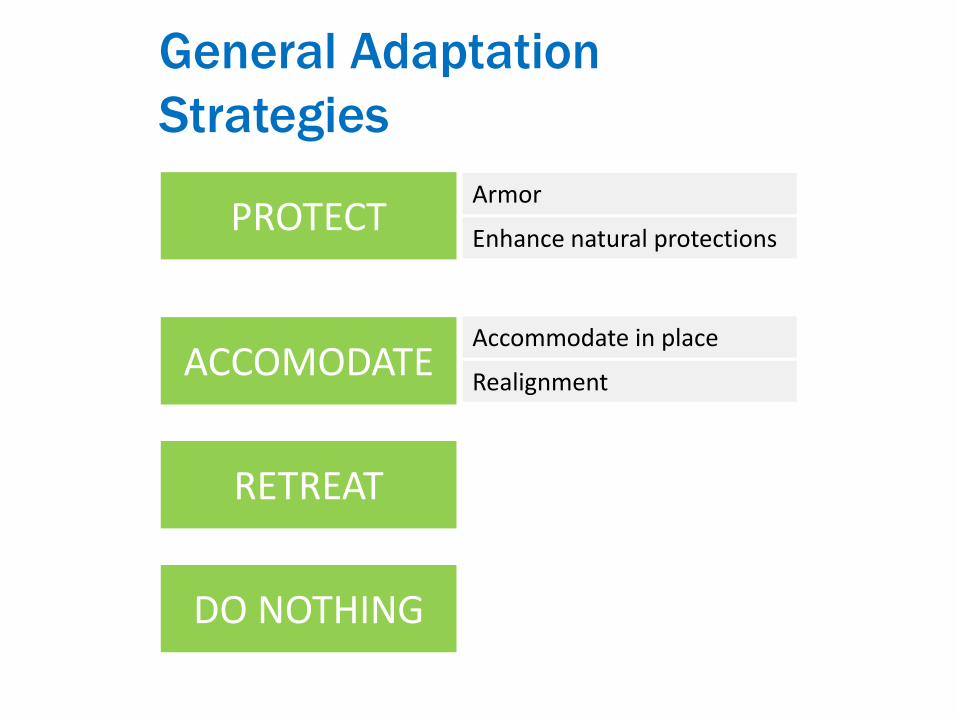
General Adaptation
Strategies
PROTECT
ACCOMODATE
RETREAT
DO NOTHING
Armor
Enhance natural protections
Accommodate in place
Realignment
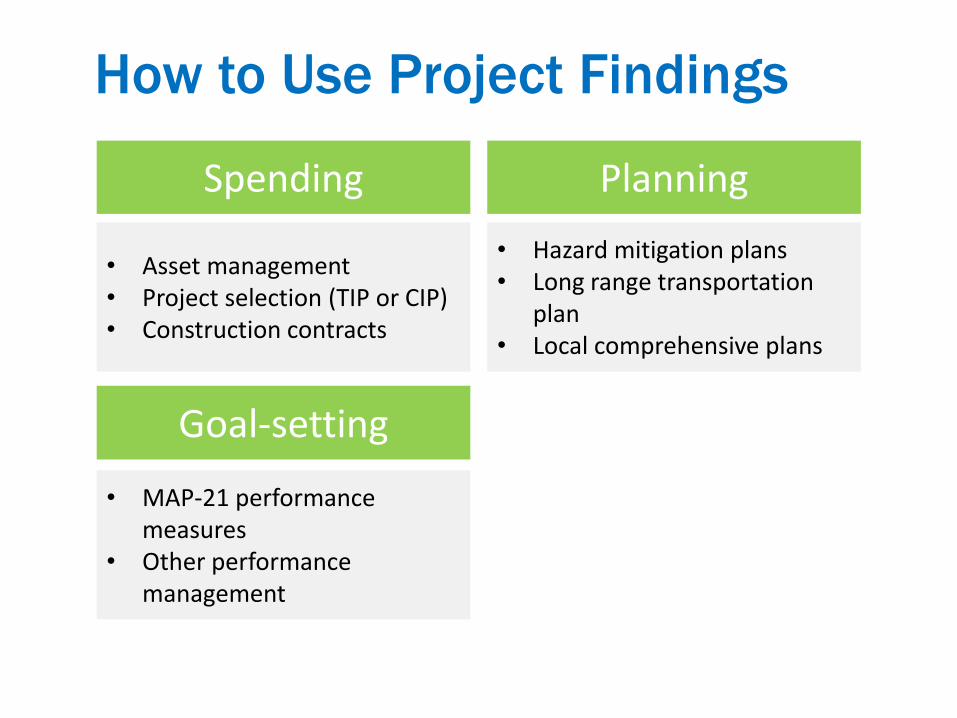
How to Use Project Findings
Spending
• Asset management • Project selection (TIP or CIP) • Construction contracts
Planning
• Hazard mitigation plans • Long range transportation
plan • Local comprehensive plans
Goal-setting
• MAP-21 performance measures
• Other performance management
Questions and Discussion