Embed Size (px)
Citation preview
Survey of North Carolina Voters Survey of North Carolina Voters
Prepared for Conservatives for Clean EnergyFebruary 16, 2015
• Methodology• Voter Intensity and Ideological Overview• Issue Overview• Clean Energy/Competition• Renewable Energy Standard• Third-Party Sales/Tax Incentives• Ballot Test• Demographic Overview
Table of Contents
• This poll of 800 registered voters living in North Carolina was conducted via telephone by Diversified Research, Inc. using professional interviewers over the course of two nights, February 2 –3, 2015. Interview selection was random within predetermined election units. These units were structured to correlate with actual voter participation from past elections.
• The poll of 800 likely general election voters has an accuracy of +/- 3.46% at a 95% confidence interval.
• Paul Shumaker served as project manager for the survey.
Methodology
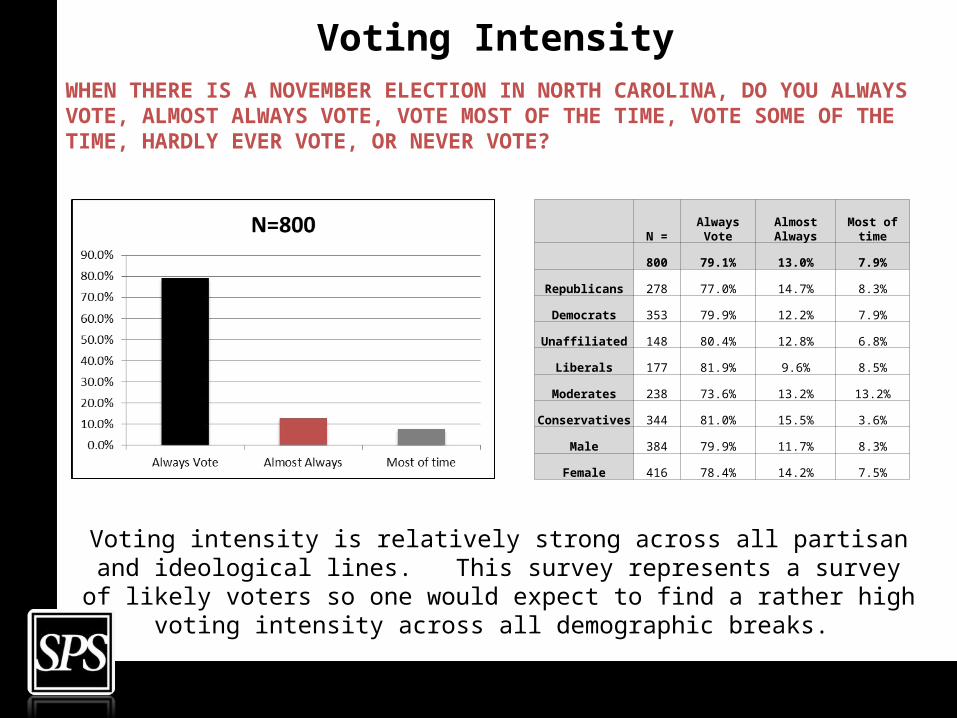
Voting Intensity WHEN THERE IS A NOVEMBER ELECTION IN NORTH CAROLINA, DO YOU ALWAYS VOTE, ALMOST ALWAYS VOTE, VOTE MOST OF THE TIME, VOTE SOME OF THE TIME, HARDLY EVER VOTE, OR NEVER VOTE?
Voting intensity is relatively strong across all partisan and ideological lines. This survey represents a survey of likely voters so one would expect to find a rather high
voting intensity across all demographic breaks.
N =Always Vote
Almost Always
Most of time
800 79.1% 13.0% 7.9%
Republicans 278 77.0% 14.7% 8.3%
Democrats 353 79.9% 12.2% 7.9%
Unaffiliated 148 80.4% 12.8% 6.8%
Liberals 177 81.9% 9.6% 8.5%
Moderates 238 73.6% 13.2% 13.2%
Conservatives 344 81.0% 15.5% 3.6%
Male 384 79.9% 11.7% 8.3%
Female 416 78.4% 14.2% 7.5%
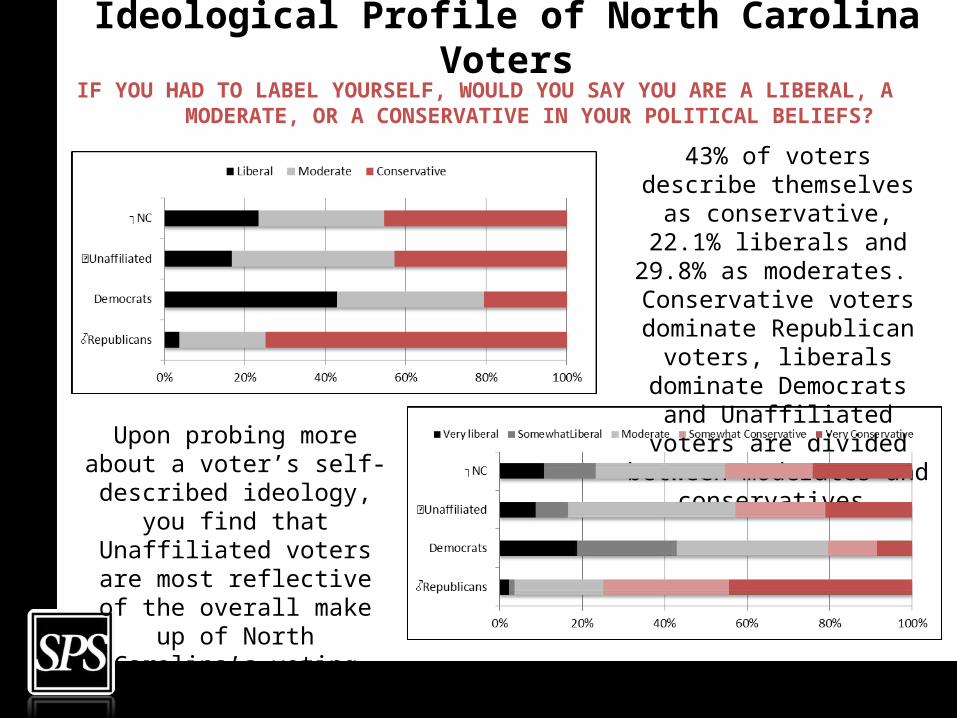
Ideological Profile of North Carolina Voters
IF YOU HAD TO LABEL YOURSELF, WOULD YOU SAY YOU ARE A LIBERAL, A MODERATE, OR A CONSERVATIVE IN YOUR POLITICAL BELIEFS?
43% of voters describe themselves as conservative, 22.1% liberals and 29.8% as moderates. Conservative
voters dominate Republican voters, liberals dominate
Democrats and Unaffiliated voters are divided between
moderates and conservatives.
Upon probing more about a voter’s self-described ideology,
you find that Unaffiliated voters are most reflective of the overall make up of North Carolina’s voting population.
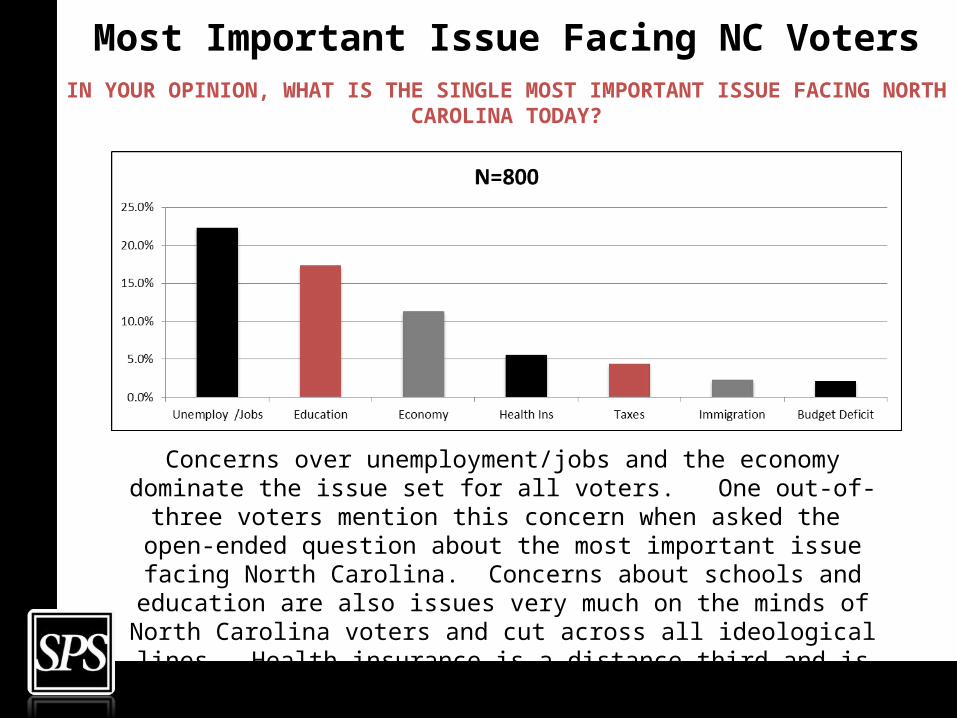
Most Important Issue Facing NC VotersIN YOUR OPINION, WHAT IS THE SINGLE MOST IMPORTANT ISSUE FACING
NORTH CAROLINA TODAY?
Concerns over unemployment/jobs and the economy dominate the issue set for all voters. One out-of-three voters mention this concern when asked the open-ended question about the most important issue facing North Carolina.
Concerns about schools and education are also issues very much on the minds of North Carolina voters and cut across all ideological lines. Health insurance is
a distance third and is seated with voters on the ideological left.
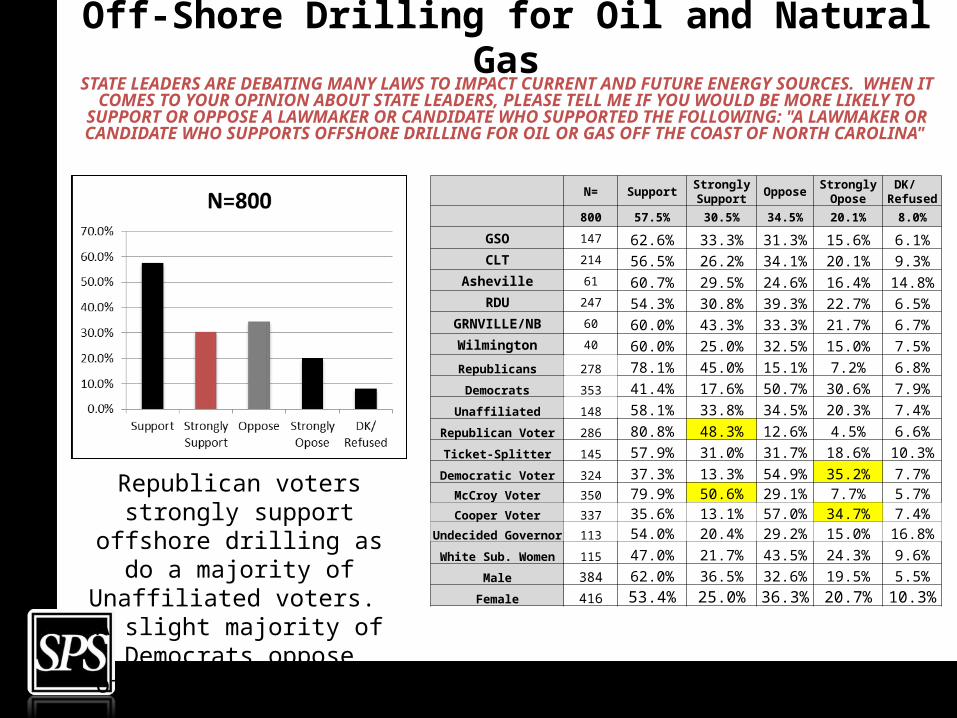
Off-Shore Drilling for Oil and Natural GasSTATE LEADERS ARE DEBATING MANY LAWS TO IMPACT CURRENT AND FUTURE ENERGY
SOURCES. WHEN IT COMES TO YOUR OPINION ABOUT STATE LEADERS, PLEASE TELL ME IF YOU WOULD BE MORE LIKELY TO SUPPORT OR OPPOSE A LAWMAKER OR CANDIDATE WHO SUPPORTED THE FOLLOWING: "A LAWMAKER OR CANDIDATE WHO SUPPORTS OFFSHORE
DRILLING FOR OIL OR GAS OFF THE COAST OF NORTH CAROLINA"
N= SupportStrongly Support
OpposeStrongly Opose
DK/ Refused
800 57.5% 30.5% 34.5% 20.1% 8.0%
GSO 147 62.6% 33.3% 31.3% 15.6% 6.1%CLT 214 56.5% 26.2% 34.1% 20.1% 9.3%
Asheville 61 60.7% 29.5% 24.6% 16.4% 14.8%RDU 247 54.3% 30.8% 39.3% 22.7% 6.5%
GRNVILLE/NB 60 60.0% 43.3% 33.3% 21.7% 6.7%Wilmington 40 60.0% 25.0% 32.5% 15.0% 7.5%Republicans 278 78.1% 45.0% 15.1% 7.2% 6.8%Democrats 353 41.4% 17.6% 50.7% 30.6% 7.9%Unaffiliated 148 58.1% 33.8% 34.5% 20.3% 7.4%
Republican Voter 286 80.8% 48.3% 12.6% 4.5% 6.6%Ticket-Splitter 145 57.9% 31.0% 31.7% 18.6% 10.3%
Democratic Voter 324 37.3% 13.3% 54.9% 35.2% 7.7%McCroy Voter 350 79.9% 50.6% 29.1% 7.7% 5.7%Cooper Voter 337 35.6% 13.1% 57.0% 34.7% 7.4%
Undecided Governor 113 54.0% 20.4% 29.2% 15.0% 16.8%
White Sub. Women 115 47.0% 21.7% 43.5% 24.3% 9.6%Male 384 62.0% 36.5% 32.6% 19.5% 5.5%
Female 416 53.4% 25.0% 36.3% 20.7% 10.3%
Republican voters strongly support offshore drilling as do a majority of Unaffiliated voters. A slight majority of Democrats
oppose offshore drilling.
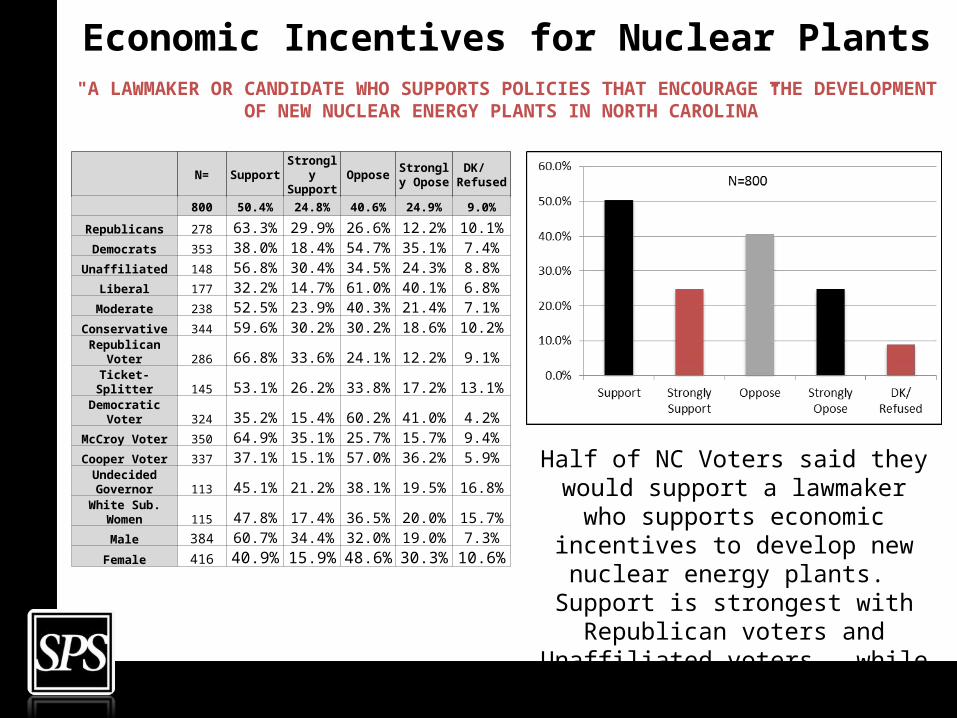
Economic Incentives for Nuclear Plants"A LAWMAKER OR CANDIDATE WHO SUPPORTS POLICIES THAT ENCOURAGE THE
DEVELOPMENT OF NEW NUCLEAR ENERGY PLANTS IN NORTH CAROLINA”
N= SupportStrongl
y Support
OpposeStrongl
y Opose
DK/ Refused
800 50.4% 24.8% 40.6% 24.9% 9.0%
Republicans 278 63.3% 29.9% 26.6% 12.2% 10.1%Democrats 353 38.0% 18.4% 54.7% 35.1% 7.4%Unaffiliated 148 56.8% 30.4% 34.5% 24.3% 8.8%
Liberal 177 32.2% 14.7% 61.0% 40.1% 6.8%Moderate 238 52.5% 23.9% 40.3% 21.4% 7.1%
Conservative 344 59.6% 30.2% 30.2% 18.6% 10.2%Republican
Voter 286 66.8% 33.6% 24.1% 12.2% 9.1%Ticket-Splitter 145 53.1% 26.2% 33.8% 17.2% 13.1%
Democratic Voter 324 35.2% 15.4% 60.2% 41.0% 4.2%
McCroy Voter 350 64.9% 35.1% 25.7% 15.7% 9.4%Cooper Voter 337 37.1% 15.1% 57.0% 36.2% 5.9%
Undecided Governor 113 45.1% 21.2% 38.1% 19.5% 16.8%
White Sub. Women 115 47.8% 17.4% 36.5% 20.0% 15.7%
Male 384 60.7% 34.4% 32.0% 19.0% 7.3%Female 416 40.9% 15.9% 48.6% 30.3% 10.6%
Half of NC Voters said they would support a lawmaker who supports
economic incentives to develop new nuclear energy plants. Support is
strongest with Republican voters and Unaffiliated voters, while a majority of
Democratic voters are opposed.
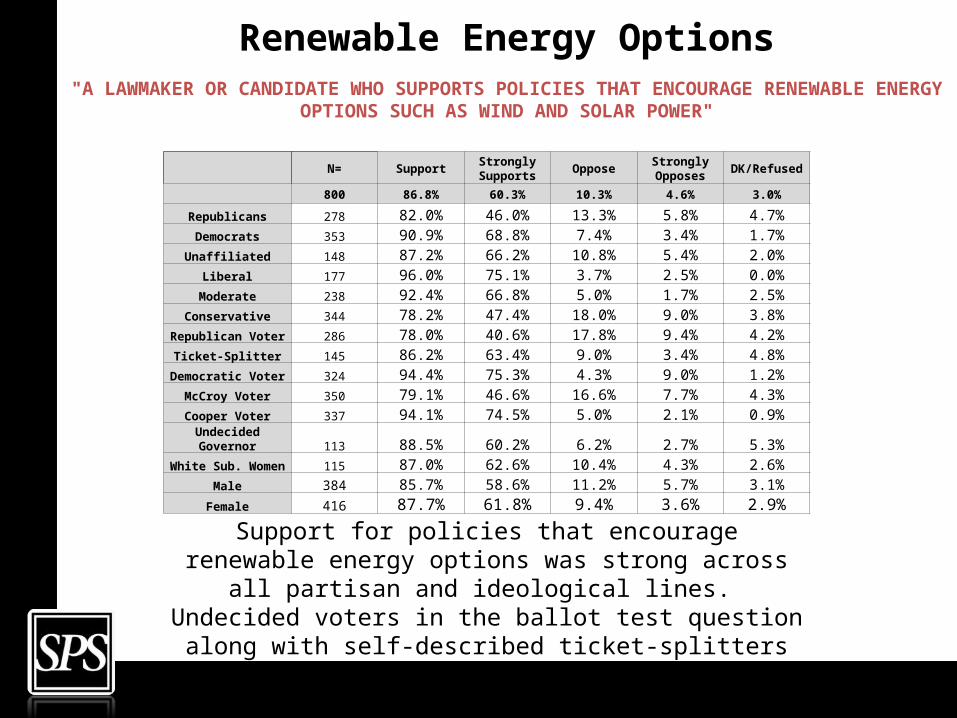
Renewable Energy Options"A LAWMAKER OR CANDIDATE WHO SUPPORTS POLICIES THAT ENCOURAGE
RENEWABLE ENERGY OPTIONS SUCH AS WIND AND SOLAR POWER"
Support for policies that encourage renewable energy options was strong across all partisan and ideological lines. Undecided
voters in the ballot test question along with self-described ticket-splitters were among the strongest support groups.
N= SupportStrongly Supports
OpposeStrongly Opposes
DK/Refused
800 86.8% 60.3% 10.3% 4.6% 3.0%
Republicans 278 82.0% 46.0% 13.3% 5.8% 4.7%Democrats 353 90.9% 68.8% 7.4% 3.4% 1.7%Unaffiliated 148 87.2% 66.2% 10.8% 5.4% 2.0%
Liberal 177 96.0% 75.1% 3.7% 2.5% 0.0%Moderate 238 92.4% 66.8% 5.0% 1.7% 2.5%
Conservative 344 78.2% 47.4% 18.0% 9.0% 3.8%Republican Voter 286 78.0% 40.6% 17.8% 9.4% 4.2%
Ticket-Splitter 145 86.2% 63.4% 9.0% 3.4% 4.8%Democratic Voter 324 94.4% 75.3% 4.3% 9.0% 1.2%
McCroy Voter 350 79.1% 46.6% 16.6% 7.7% 4.3%Cooper Voter 337 94.1% 74.5% 5.0% 2.1% 0.9%
Undecided Governor 113 88.5% 60.2% 6.2% 2.7% 5.3%
White Sub. Women 115 87.0% 62.6% 10.4% 4.3% 2.6%
Male 384 85.7% 58.6% 11.2% 5.7% 3.1%Female 416 87.7% 61.8% 9.4% 3.6% 2.9%
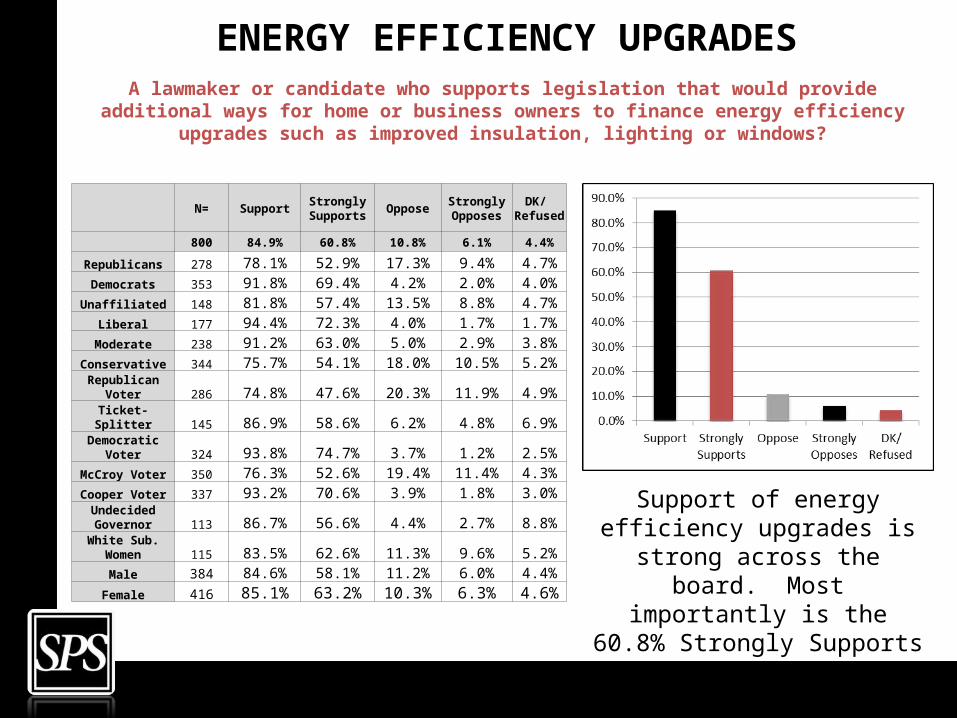
ENERGY EFFICIENCY UPGRADESA lawmaker or candidate who supports legislation that would provide additional ways for home or business owners to finance energy efficiency upgrades such as
improved insulation, lighting or windows?
N= SupportStrongly Supports
OpposeStrongly Opposes
DK/ Refuse
d
800 84.9% 60.8% 10.8% 6.1% 4.4%
Republicans 278 78.1% 52.9% 17.3% 9.4% 4.7%Democrats 353 91.8% 69.4% 4.2% 2.0% 4.0%Unaffiliated 148 81.8% 57.4% 13.5% 8.8% 4.7%
Liberal 177 94.4% 72.3% 4.0% 1.7% 1.7%Moderate 238 91.2% 63.0% 5.0% 2.9% 3.8%
Conservative 344 75.7% 54.1% 18.0% 10.5% 5.2%Republican
Voter 286 74.8% 47.6% 20.3% 11.9% 4.9%Ticket-Splitter 145 86.9% 58.6% 6.2% 4.8% 6.9%
Democratic Voter 324 93.8% 74.7% 3.7% 1.2% 2.5%
McCroy Voter 350 76.3% 52.6% 19.4% 11.4% 4.3%Cooper Voter 337 93.2% 70.6% 3.9% 1.8% 3.0%
Undecided Governor 113 86.7% 56.6% 4.4% 2.7% 8.8%
White Sub. Women 115 83.5% 62.6% 11.3% 9.6% 5.2%
Male 384 84.6% 58.1% 11.2% 6.0% 4.4%Female 416 85.1% 63.2% 10.3% 6.3% 4.6%
Support of energy efficiency upgrades is strong across the
board. Most importantly is the 60.8% Strongly Supports for the
policy initiative.
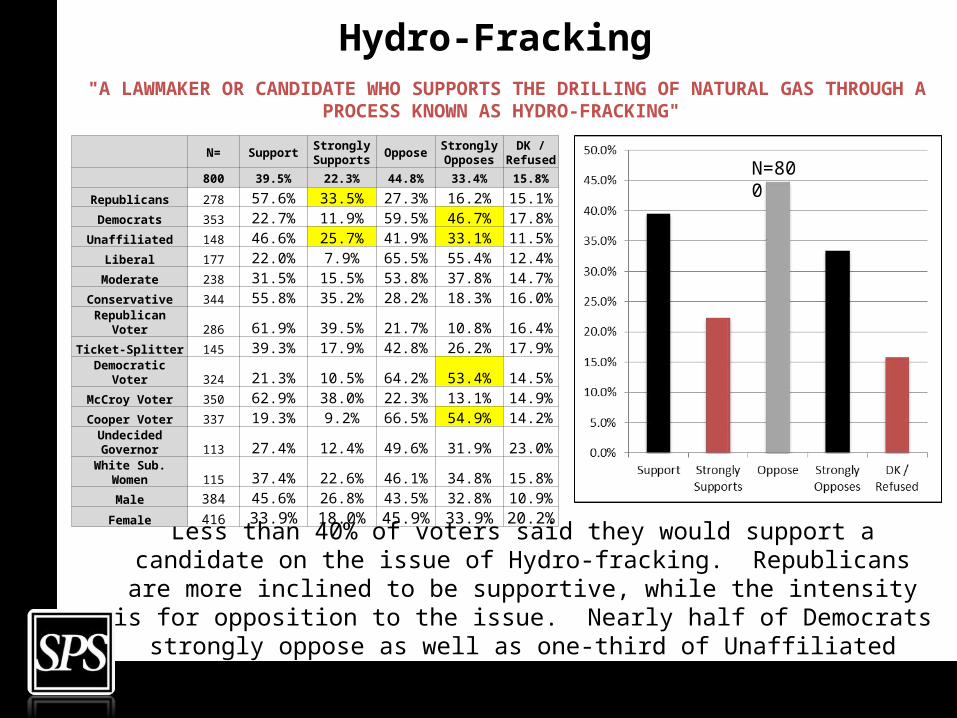
Hydro-Fracking "A LAWMAKER OR CANDIDATE WHO SUPPORTS THE DRILLING OF NATURAL GAS
THROUGH A PROCESS KNOWN AS HYDRO-FRACKING"
Less than 40% of voters said they would support a candidate on the issue of Hydro-fracking. Republicans are more inclined to be supportive, while the intensity is for opposition to the issue. Nearly half of Democrats strongly oppose as well as one-
third of Unaffiliated voters.
N= SupportStrongly Supports
OpposeStrongly Opposes
DK / Refuse
d 800 39.5% 22.3% 44.8% 33.4% 15.8%
Republicans 278 57.6% 33.5% 27.3% 16.2% 15.1%Democrats 353 22.7% 11.9% 59.5% 46.7% 17.8%Unaffiliated 148 46.6% 25.7% 41.9% 33.1% 11.5%
Liberal 177 22.0% 7.9% 65.5% 55.4% 12.4%Moderate 238 31.5% 15.5% 53.8% 37.8% 14.7%
Conservative 344 55.8% 35.2% 28.2% 18.3% 16.0%Republican
Voter 286 61.9% 39.5% 21.7% 10.8% 16.4%Ticket-Splitter 145 39.3% 17.9% 42.8% 26.2% 17.9%
Democratic Voter 324 21.3% 10.5% 64.2% 53.4% 14.5%
McCroy Voter 350 62.9% 38.0% 22.3% 13.1% 14.9%Cooper Voter 337 19.3% 9.2% 66.5% 54.9% 14.2%
Undecided Governor 113 27.4% 12.4% 49.6% 31.9% 23.0%
White Sub. Women 115 37.4% 22.6% 46.1% 34.8% 15.8%
Male 384 45.6% 26.8% 43.5% 32.8% 10.9%Female 416 33.9% 18.0% 45.9% 33.9% 20.2%
N=800
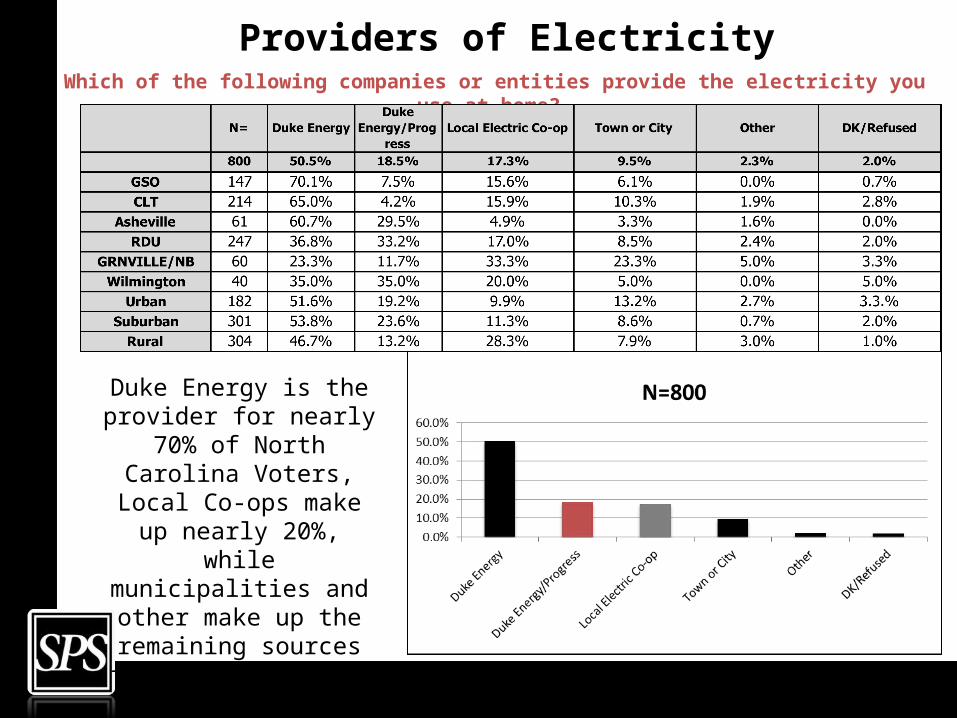
Providers of ElectricityWhich of the following companies or entities provide the electricity you use at
home?
Duke Energy is the provider for nearly 70% of North
Carolina Voters, Local Co-ops make up nearly 20%, while
municipalities and other make up the remaining
sources for North Carolina voters.
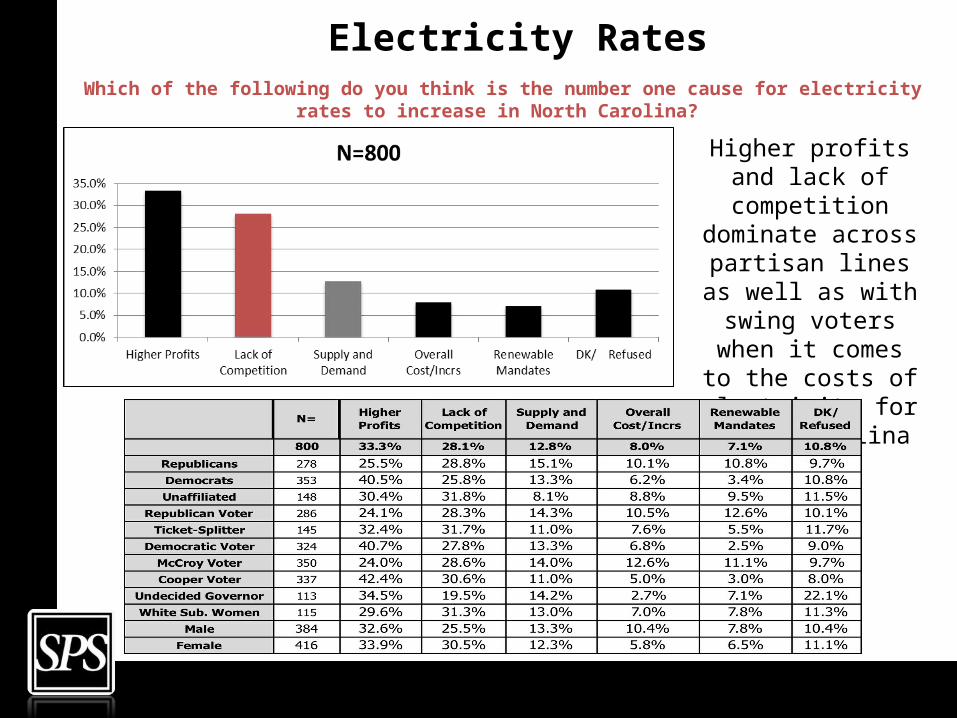
Electricity RatesWhich of the following do you think is the number one cause for electricity rates to
increase in North Carolina?
Higher profits and lack of competition
dominate across partisan lines as well as
with swing voters when it comes to the costs of electricity for
North Carolina voters.
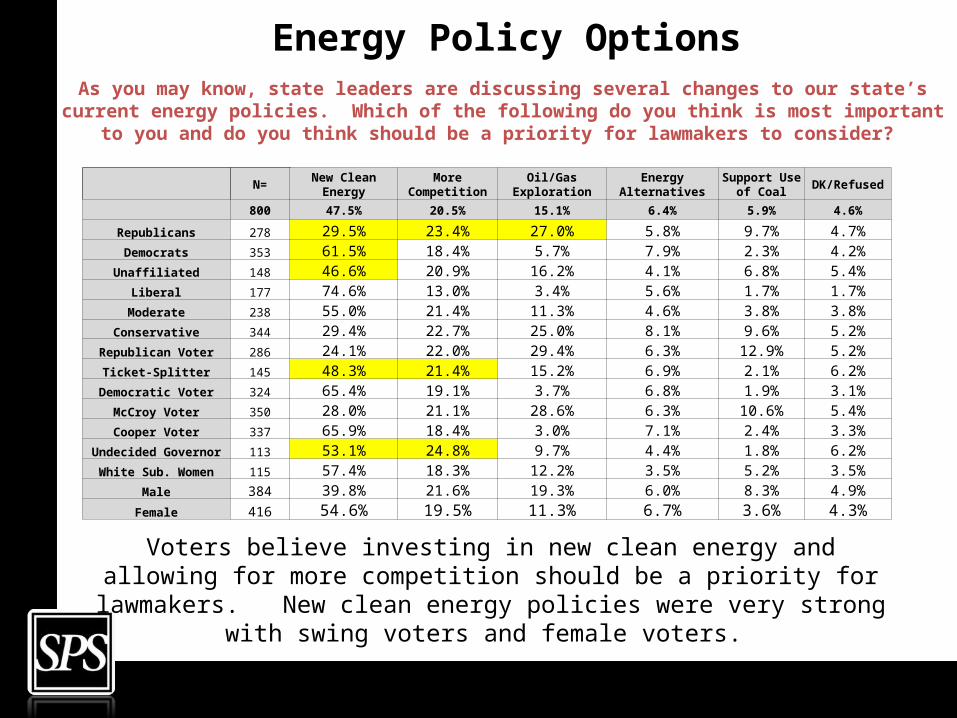
Energy Policy OptionsAs you may know, state leaders are discussing several changes to our state’s
current energy policies. Which of the following do you think is most important to you and do you think should be a priority for lawmakers to consider?
Voters believe investing in new clean energy and allowing for more competition should be a priority for lawmakers. New clean energy policies were very strong
with swing voters and female voters.
N=New Clean
EnergyMore
CompetitionOil/Gas
ExplorationEnergy
AlternativesSupport Use
of CoalDK/Refused
800 47.5% 20.5% 15.1% 6.4% 5.9% 4.6%
Republicans 278 29.5% 23.4% 27.0% 5.8% 9.7% 4.7%Democrats 353 61.5% 18.4% 5.7% 7.9% 2.3% 4.2%Unaffiliated 148 46.6% 20.9% 16.2% 4.1% 6.8% 5.4%
Liberal 177 74.6% 13.0% 3.4% 5.6% 1.7% 1.7%Moderate 238 55.0% 21.4% 11.3% 4.6% 3.8% 3.8%
Conservative 344 29.4% 22.7% 25.0% 8.1% 9.6% 5.2%Republican Voter 286 24.1% 22.0% 29.4% 6.3% 12.9% 5.2%
Ticket-Splitter 145 48.3% 21.4% 15.2% 6.9% 2.1% 6.2%Democratic Voter 324 65.4% 19.1% 3.7% 6.8% 1.9% 3.1%
McCroy Voter 350 28.0% 21.1% 28.6% 6.3% 10.6% 5.4%Cooper Voter 337 65.9% 18.4% 3.0% 7.1% 2.4% 3.3%
Undecided Governor 113 53.1% 24.8% 9.7% 4.4% 1.8% 6.2%White Sub. Women 115 57.4% 18.3% 12.2% 3.5% 5.2% 3.5%
Male 384 39.8% 21.6% 19.3% 6.0% 8.3% 4.9%Female 416 54.6% 19.5% 11.3% 6.7% 3.6% 4.3%
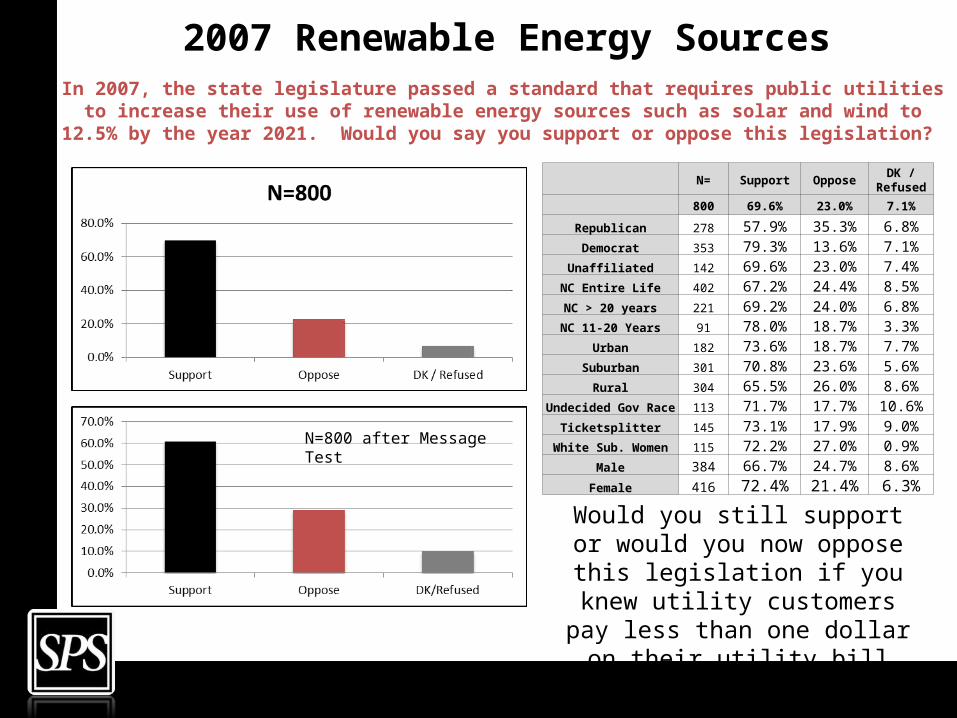
2007 Renewable Energy SourcesIn 2007, the state legislature passed a standard that requires public utilities to
increase their use of renewable energy sources such as solar and wind to 12.5% by the year 2021. Would you say you support or oppose this legislation?
N= Support OpposeDK /
Refused 800 69.6% 23.0% 7.1%
Republican 278 57.9% 35.3% 6.8%Democrat 353 79.3% 13.6% 7.1%
Unaffiliated 142 69.6% 23.0% 7.4%NC Entire Life 402 67.2% 24.4% 8.5%NC > 20 years 221 69.2% 24.0% 6.8%NC 11-20 Years 91 78.0% 18.7% 3.3%
Urban 182 73.6% 18.7% 7.7%Suburban 301 70.8% 23.6% 5.6%
Rural 304 65.5% 26.0% 8.6%Undecided Gov
Race 113 71.7% 17.7% 10.6%Ticketsplitter 145 73.1% 17.9% 9.0%
White Sub. Women 115 72.2% 27.0% 0.9%Male 384 66.7% 24.7% 8.6%
Female 416 72.4% 21.4% 6.3%
N=800 after Message Test
Would you still support or would you now oppose this legislation if you
knew utility customers pay less than one dollar on their utility bill each
month to pay for this requirement?
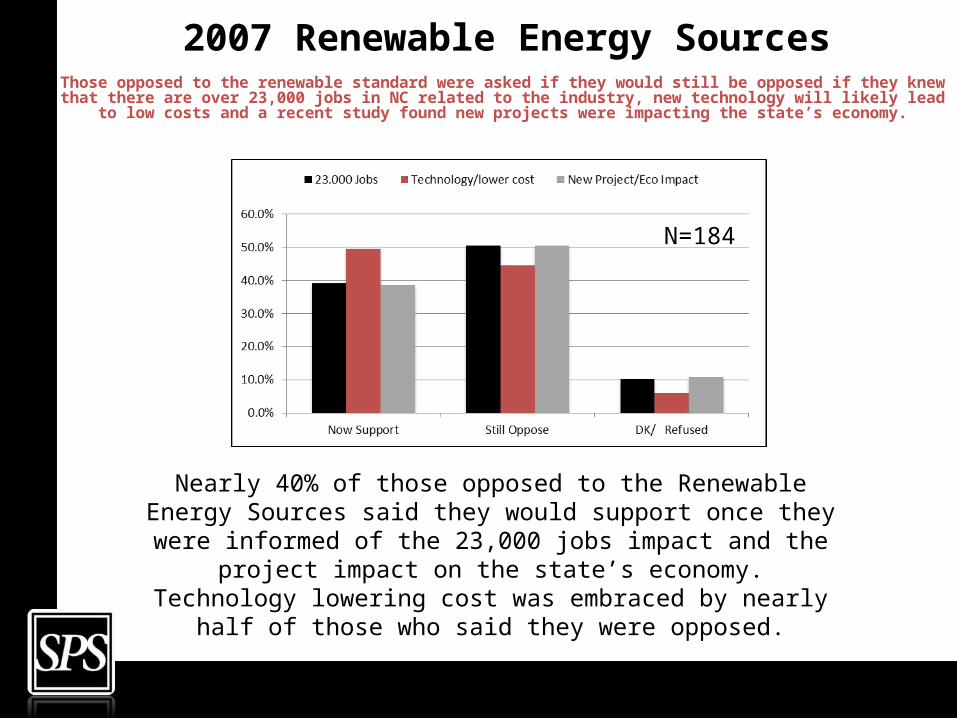
2007 Renewable Energy SourcesThose opposed to the renewable standard were asked if they would still be opposed if they knew
that there are over 23,000 jobs in NC related to the industry, new technology will likely lead to low costs and a recent study found new projects were impacting the state’s economy.
Nearly 40% of those opposed to the Renewable Energy Sources said they would support once they were informed of the 23,000 jobs
impact and the project impact on the state’s economy. Technology lowering cost was embraced by nearly half of those who said they
were opposed.
N=184
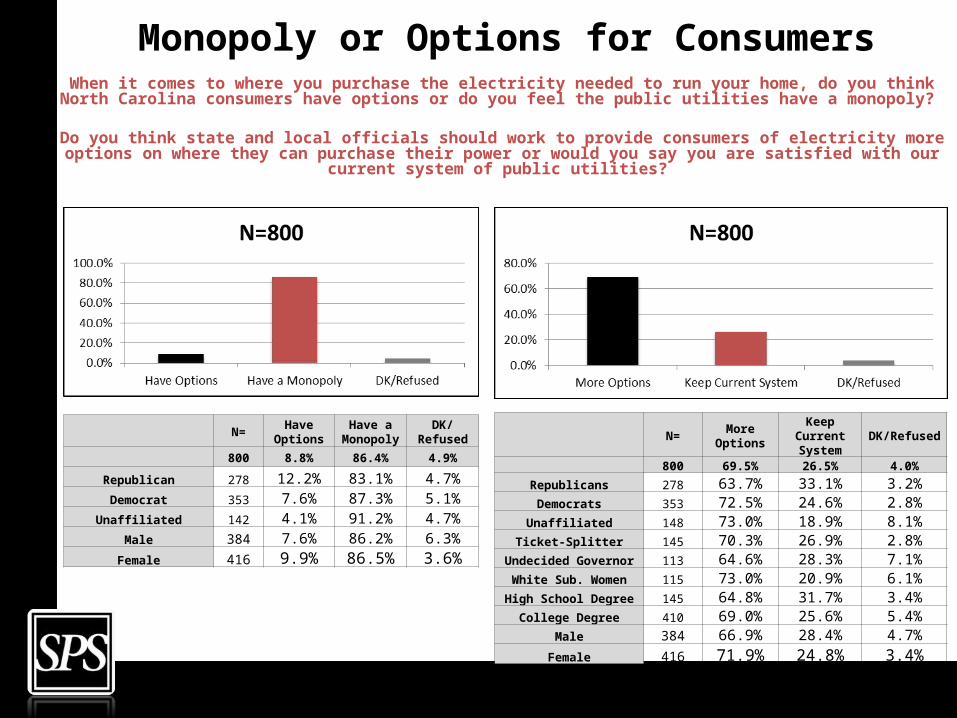
Monopoly or Options for ConsumersWhen it comes to where you purchase the electricity needed to run your home, do you think North Carolina consumers have options or do you feel the public utilities have a monopoly?
Do you think state and local officials should work to provide consumers of electricity more options on where they can purchase their power or would you say you are satisfied with our
current system of public utilities?
N=Have
OptionsHave a
MonopolyDK/
Refused
800 8.8% 86.4% 4.9%
Republican 278 12.2% 83.1% 4.7%Democrat 353 7.6% 87.3% 5.1%
Unaffiliated 142 4.1% 91.2% 4.7%Male 384 7.6% 86.2% 6.3%
Female 416 9.9% 86.5% 3.6%
N=More
Options
Keep Current System
DK/Refused
800 69.5% 26.5% 4.0%
Republicans 278 63.7% 33.1% 3.2%Democrats 353 72.5% 24.6% 2.8%Unaffiliated 148 73.0% 18.9% 8.1%
Ticket-Splitter 145 70.3% 26.9% 2.8%Undecided Governor 113 64.6% 28.3% 7.1%White Sub. Women 115 73.0% 20.9% 6.1%High School Degree 145 64.8% 31.7% 3.4%
College Degree 410 69.0% 25.6% 5.4%Male 384 66.9% 28.4% 4.7%
Female 416 71.9% 24.8% 3.4%
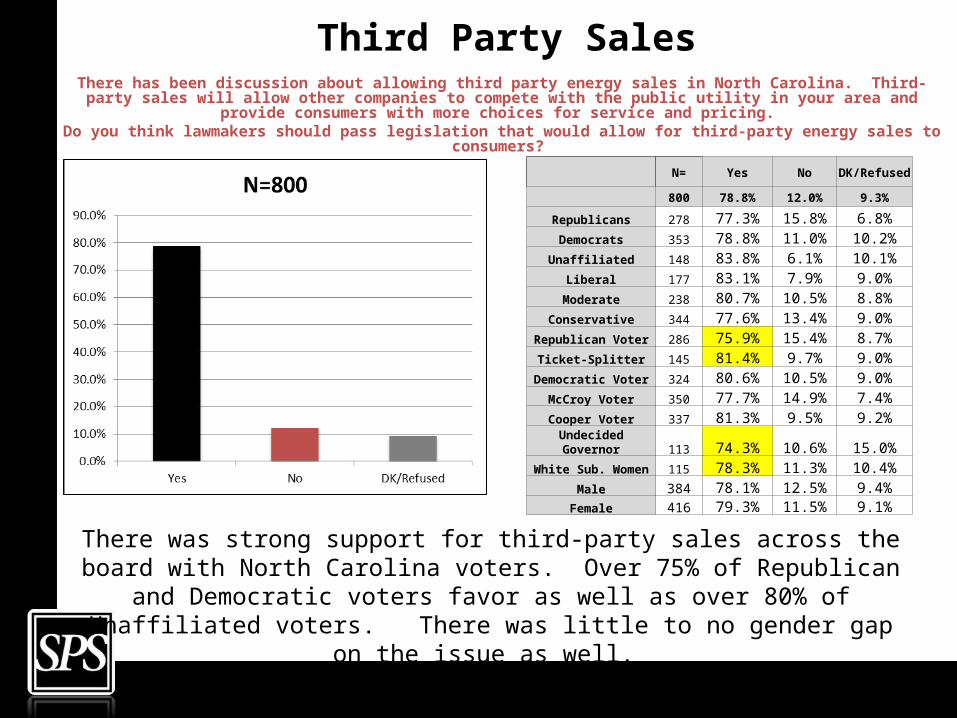
Third Party SalesThere has been discussion about allowing third party energy sales in North Carolina. Third-party
sales will allow other companies to compete with the public utility in your area and provide consumers with more choices for service and pricing.
Do you think lawmakers should pass legislation that would allow for third-party energy sales to consumers?
N= Yes NoDK/
Refused 800 78.8% 12.0% 9.3%
Republicans 278 77.3% 15.8% 6.8%Democrats 353 78.8% 11.0% 10.2%Unaffiliated 148 83.8% 6.1% 10.1%
Liberal 177 83.1% 7.9% 9.0%Moderate 238 80.7% 10.5% 8.8%
Conservative 344 77.6% 13.4% 9.0%Republican Voter 286 75.9% 15.4% 8.7%
Ticket-Splitter 145 81.4% 9.7% 9.0%Democratic Voter 324 80.6% 10.5% 9.0%
McCroy Voter 350 77.7% 14.9% 7.4%Cooper Voter 337 81.3% 9.5% 9.2%
Undecided Governor 113 74.3% 10.6% 15.0%
White Sub. Women 115 78.3% 11.3% 10.4%
Male 384 78.1% 12.5% 9.4%Female 416 79.3% 11.5% 9.1%
There was strong support for third-party sales across the board with North Carolina voters. Over 75% of Republican and Democratic voters favor as well as over 80% of
Unaffiliated voters. There was little to no gender gap on the issue as well.
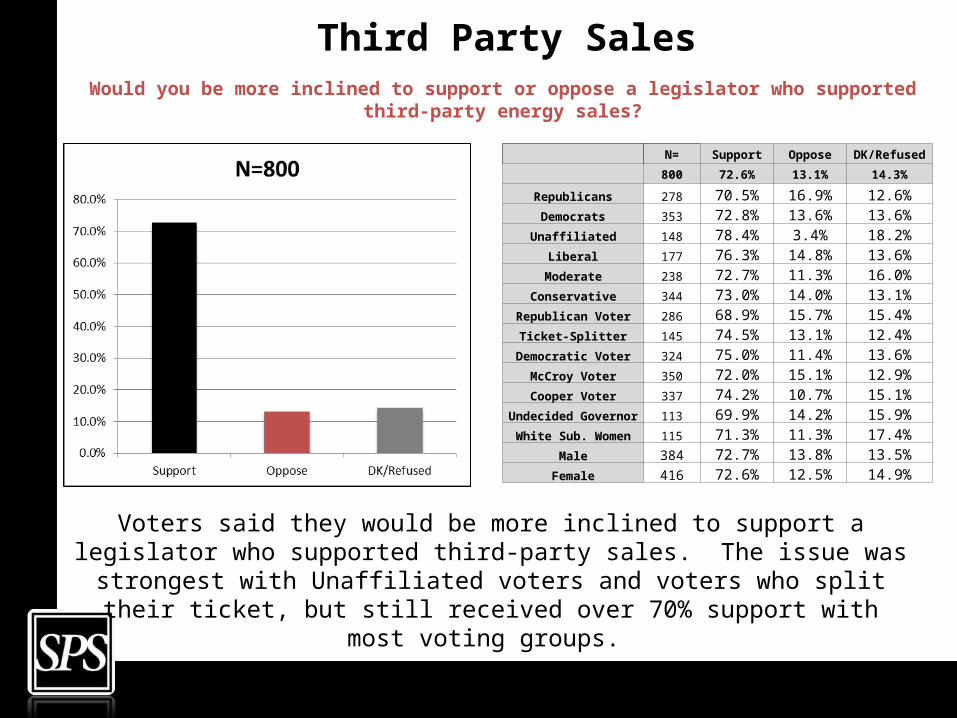
Third Party SalesWould you be more inclined to support or oppose a legislator who supported
third-party energy sales?
Voters said they would be more inclined to support a legislator who supported third-party sales. The issue was strongest with Unaffiliated voters and voters who split
their ticket, but still received over 70% support with most voting groups.
N= Support Oppose DK/Refused 800 72.6% 13.1% 14.3%
Republicans 278 70.5% 16.9% 12.6%Democrats 353 72.8% 13.6% 13.6%Unaffiliated 148 78.4% 3.4% 18.2%
Liberal 177 76.3% 14.8% 13.6%Moderate 238 72.7% 11.3% 16.0%
Conservative 344 73.0% 14.0% 13.1%Republican Voter 286 68.9% 15.7% 15.4%
Ticket-Splitter 145 74.5% 13.1% 12.4%Democratic Voter 324 75.0% 11.4% 13.6%
McCroy Voter 350 72.0% 15.1% 12.9%Cooper Voter 337 74.2% 10.7% 15.1%
Undecided Governor 113 69.9% 14.2% 15.9%
White Sub. Women 115 71.3% 11.3% 17.4%Male 384 72.7% 13.8% 13.5%
Female 416 72.6% 12.5% 14.9%
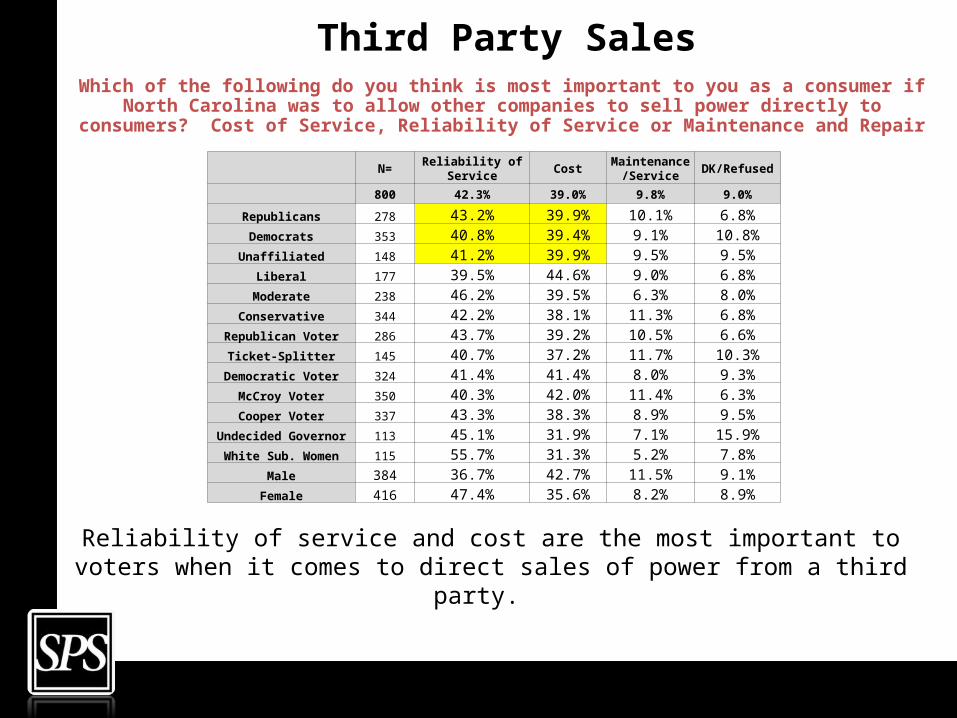
Third Party SalesWhich of the following do you think is most important to you as a consumer if
North Carolina was to allow other companies to sell power directly to consumers? Cost of Service, Reliability of Service or Maintenance and Repair
Reliability of service and cost are the most important to voters when it comes to direct sales of power from a third party.
N=Reliability of
ServiceCost
Maintenance/Service
DK/Refused
800 42.3% 39.0% 9.8% 9.0%
Republicans 278 43.2% 39.9% 10.1% 6.8%Democrats 353 40.8% 39.4% 9.1% 10.8%Unaffiliated 148 41.2% 39.9% 9.5% 9.5%
Liberal 177 39.5% 44.6% 9.0% 6.8%Moderate 238 46.2% 39.5% 6.3% 8.0%
Conservative 344 42.2% 38.1% 11.3% 6.8%Republican Voter 286 43.7% 39.2% 10.5% 6.6%
Ticket-Splitter 145 40.7% 37.2% 11.7% 10.3%Democratic Voter 324 41.4% 41.4% 8.0% 9.3%
McCroy Voter 350 40.3% 42.0% 11.4% 6.3%Cooper Voter 337 43.3% 38.3% 8.9% 9.5%
Undecided Governor 113 45.1% 31.9% 7.1% 15.9%White Sub. Women 115 55.7% 31.3% 5.2% 7.8%
Male 384 36.7% 42.7% 11.5% 9.1%Female 416 47.4% 35.6% 8.2% 8.9%
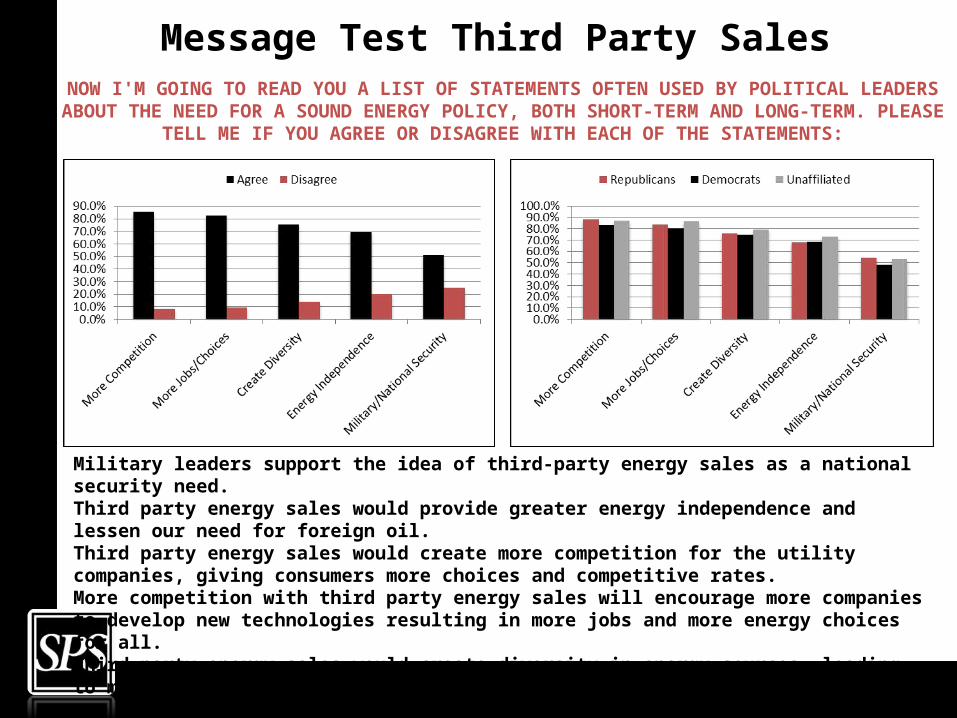
Message Test Third Party Sales NOW I'M GOING TO READ YOU A LIST OF STATEMENTS OFTEN USED BY POLITICAL LEADERS
ABOUT THE NEED FOR A SOUND ENERGY POLICY, BOTH SHORT-TERM AND LONG-TERM. PLEASE TELL ME IF YOU AGREE OR DISAGREE WITH EACH OF THE STATEMENTS:
Military leaders support the idea of third-party energy sales as a national security need.Third party energy sales would provide greater energy independence and lessen our need for foreign oil. Third party energy sales would create more competition for the utility companies, giving consumers more choices and competitive rates.More competition with third party energy sales will encourage more companies to develop new technologies resulting in more jobs and more energy choices for all. Third party energy sales would create diversity in energy sources, leading to more stable energy costs.
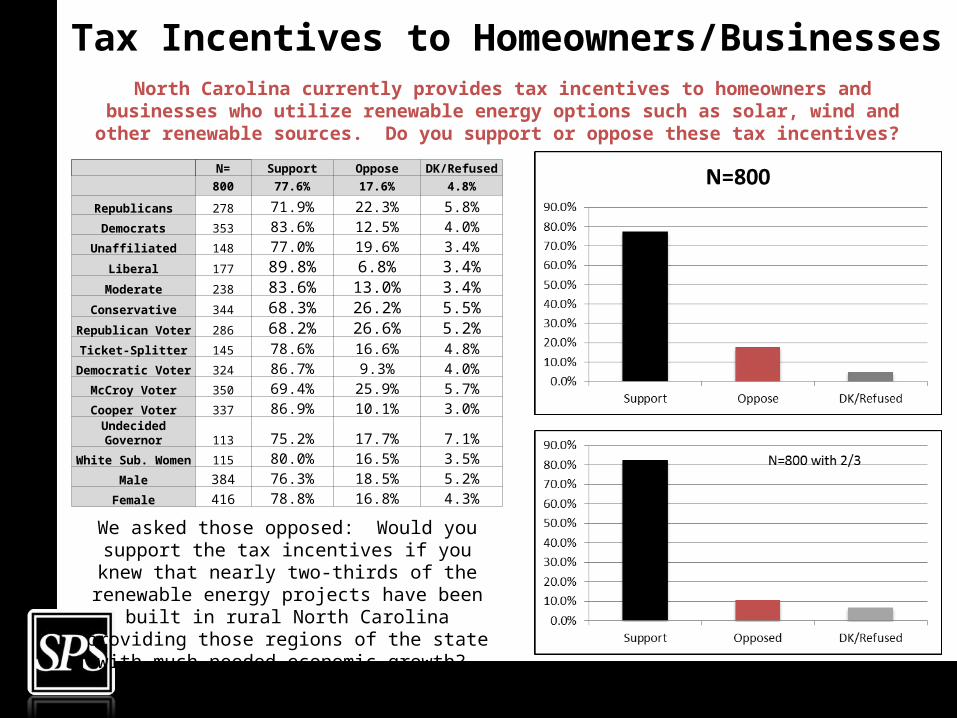
Tax Incentives to Homeowners/Businesses
North Carolina currently provides tax incentives to homeowners and businesses who utilize renewable energy options such as solar, wind and other renewable
sources. Do you support or oppose these tax incentives?
N= Support Oppose DK/Refused 800 77.6% 17.6% 4.8%
Republicans 278 71.9% 22.3% 5.8%Democrats 353 83.6% 12.5% 4.0%Unaffiliated 148 77.0% 19.6% 3.4%
Liberal 177 89.8% 6.8% 3.4%Moderate 238 83.6% 13.0% 3.4%
Conservative 344 68.3% 26.2% 5.5%Republican Voter 286 68.2% 26.6% 5.2%
Ticket-Splitter 145 78.6% 16.6% 4.8%Democratic Voter 324 86.7% 9.3% 4.0%
McCroy Voter 350 69.4% 25.9% 5.7%Cooper Voter 337 86.9% 10.1% 3.0%
Undecided Governor 113 75.2% 17.7% 7.1%
White Sub. Women 115 80.0% 16.5% 3.5%
Male 384 76.3% 18.5% 5.2%Female 416 78.8% 16.8% 4.3%
We asked those opposed: Would you support the tax incentives if you knew that nearly two-thirds of the renewable energy projects have been built in rural North Carolina providing those regions of the state
with much needed economic growth?
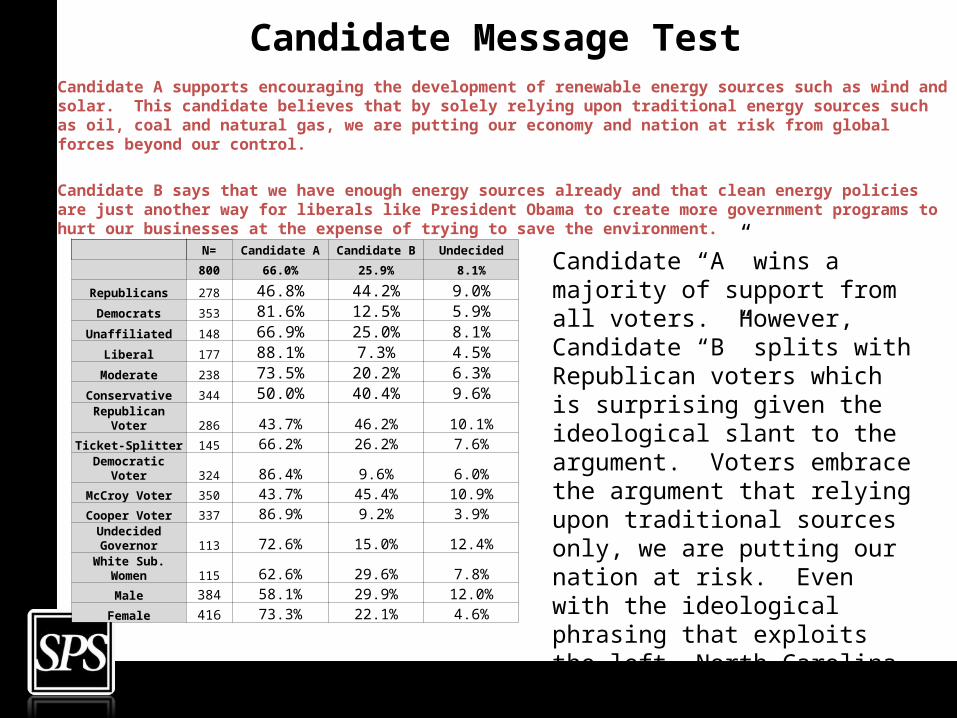
Candidate Message Test Candidate A supports encouraging the development of renewable energy sources such as wind and solar. This candidate believes that by solely relying upon traditional energy sources such as oil, coal and natural gas, we are putting our economy and nation at risk from global forces beyond our control.
Candidate B says that we have enough energy sources already and that clean energy policies are just another way for liberals like President Obama to create more government programs to hurt our businesses at the expense of trying to save the environment.
Candidate “A” wins a majority of support from all voters. However, Candidate “B” splits with Republican voters which is surprising given the ideological slant to the argument. Voters embrace the argument that relying upon traditional sources only, we are putting our nation at risk. Even with the ideological phrasing that exploits the left, North Carolina voters show strong support for renewable energy sources.
N= Candidate A Candidate B Undecided 800 66.0% 25.9% 8.1%
Republicans 278 46.8% 44.2% 9.0%Democrats 353 81.6% 12.5% 5.9%Unaffiliated 148 66.9% 25.0% 8.1%
Liberal 177 88.1% 7.3% 4.5%Moderate 238 73.5% 20.2% 6.3%
Conservative 344 50.0% 40.4% 9.6%Republican
Voter 286 43.7% 46.2% 10.1%Ticket-Splitter 145 66.2% 26.2% 7.6%
Democratic Voter 324 86.4% 9.6% 6.0%
McCroy Voter 350 43.7% 45.4% 10.9%Cooper Voter 337 86.9% 9.2% 3.9%
Undecided Governor 113 72.6% 15.0% 12.4%
White Sub. Women 115 62.6% 29.6% 7.8%
Male 384 58.1% 29.9% 12.0%Female 416 73.3% 22.1% 4.6%
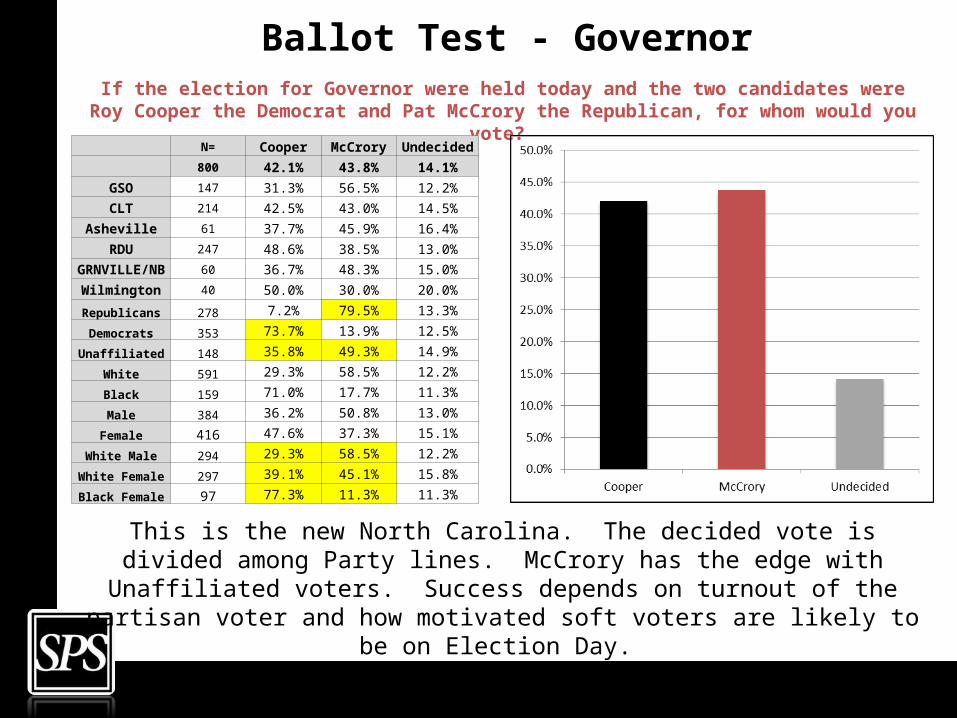
Ballot Test - GovernorIf the election for Governor were held today and the two candidates were Roy Cooper the Democrat and Pat McCrory the Republican, for whom would you
vote? N= Cooper McCrory Undecided 800 42.1% 43.8% 14.1%
GSO 147 31.3% 56.5% 12.2%
CLT 214 42.5% 43.0% 14.5%
Asheville 61 37.7% 45.9% 16.4%
RDU 247 48.6% 38.5% 13.0%GRNVILLE/
NB60 36.7% 48.3% 15.0%
Wilmington 40 50.0% 30.0% 20.0%
Republicans 278 7.2% 79.5% 13.3%
Democrats 353 73.7% 13.9% 12.5%
Unaffiliated 148 35.8% 49.3% 14.9%
White 591 29.3% 58.5% 12.2%
Black 159 71.0% 17.7% 11.3%
Male 384 36.2% 50.8% 13.0%
Female 416 47.6% 37.3% 15.1%
White Male 294 29.3% 58.5% 12.2%
White Female 297 39.1% 45.1% 15.8%
Black Female 97 77.3% 11.3% 11.3%
This is the new North Carolina. The decided vote is divided among Party lines. McCrory has the edge with Unaffiliated voters. Success depends on turnout of the
partisan voter and how motivated soft voters are likely to be on Election Day.
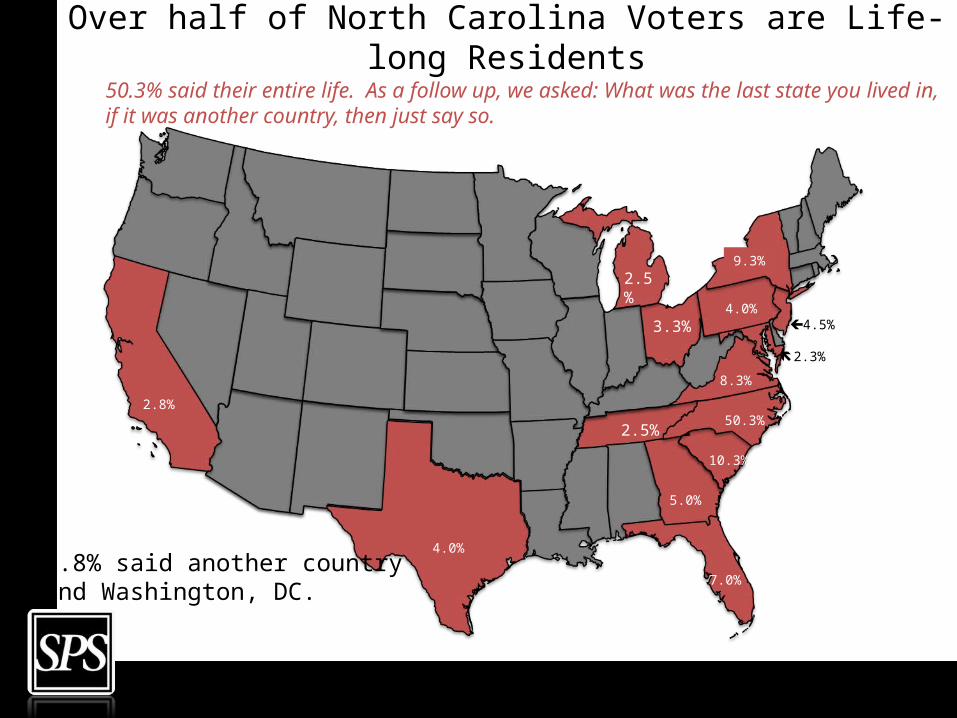
Over half of North Carolina Voters are Life-long Residents
50.3% said their entire life. As a follow up, we asked: What was the last state you lived in, if it was another country, then just say so.
9.3%
8.3%
7.0%
5.0%
4.5%
10.3%
50.3%
4.0%
2.8%
2.3%
4.0%
2.5%
3.3%
2.5%
2.8% said another countryand Washington, DC.
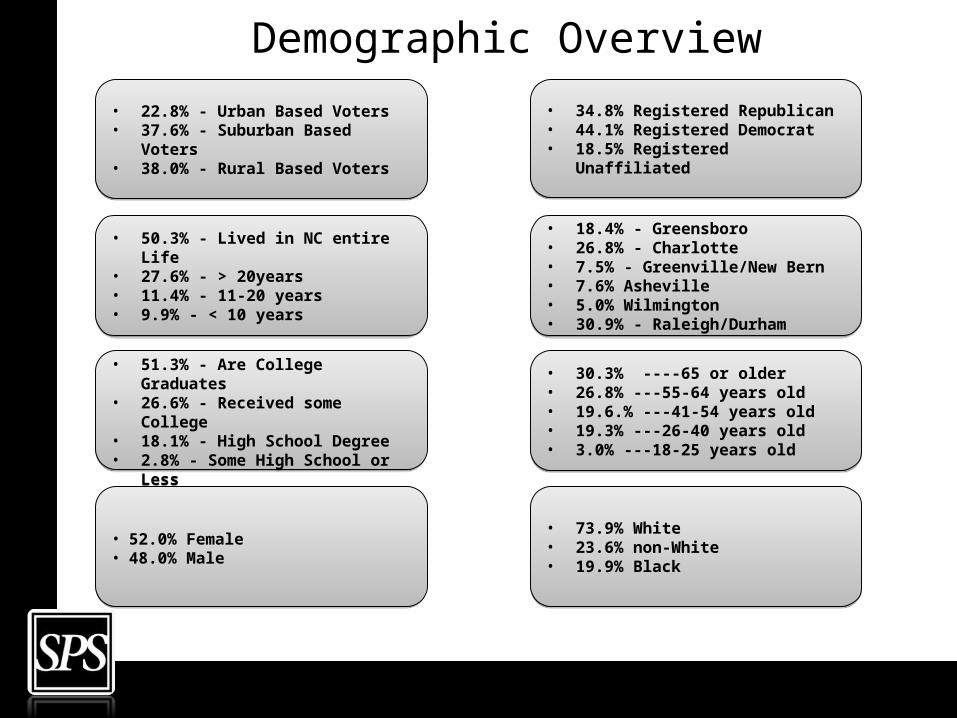
Demographic Overview
• 22.8% - Urban Based Voters• 37.6% - Suburban Based Voters• 38.0% - Rural Based Voters
• 22.8% - Urban Based Voters• 37.6% - Suburban Based Voters• 38.0% - Rural Based Voters
• 50.3% - Lived in NC entire Life• 27.6% - > 20years• 11.4% - 11-20 years• 9.9% - < 10 years
• 50.3% - Lived in NC entire Life• 27.6% - > 20years• 11.4% - 11-20 years• 9.9% - < 10 years
• 51.3% - Are College Graduates• 26.6% - Received some College• 18.1% - High School Degree• 2.8% - Some High School or Less
• 51.3% - Are College Graduates• 26.6% - Received some College• 18.1% - High School Degree• 2.8% - Some High School or Less
• 52.0% Female• 48.0% Male• 52.0% Female• 48.0% Male
• 34.8% Registered Republican• 44.1% Registered Democrat• 18.5% Registered Unaffiliated
• 34.8% Registered Republican• 44.1% Registered Democrat• 18.5% Registered Unaffiliated
• 18.4% - Greensboro• 26.8% - Charlotte• 7.5% - Greenville/New Bern• 7.6% Asheville• 5.0% Wilmington• 30.9% - Raleigh/Durham
• 18.4% - Greensboro• 26.8% - Charlotte• 7.5% - Greenville/New Bern• 7.6% Asheville• 5.0% Wilmington• 30.9% - Raleigh/Durham
• 30.3% ----65 or older• 26.8% ---55-64 years old• 19.6.% ---41-54 years old• 19.3% ---26-40 years old• 3.0% ---18-25 years old
• 30.3% ----65 or older• 26.8% ---55-64 years old• 19.6.% ---41-54 years old• 19.3% ---26-40 years old• 3.0% ---18-25 years old
• 73.9% White• 23.6% non-White• 19.9% Black
• 73.9% White• 23.6% non-White• 19.9% Black