Embed Size (px)
Citation preview
Page 1 Page 1
Iron Ore Production Costs
Michael Dixon
AME Group
March 2014
Page 2 Page 2
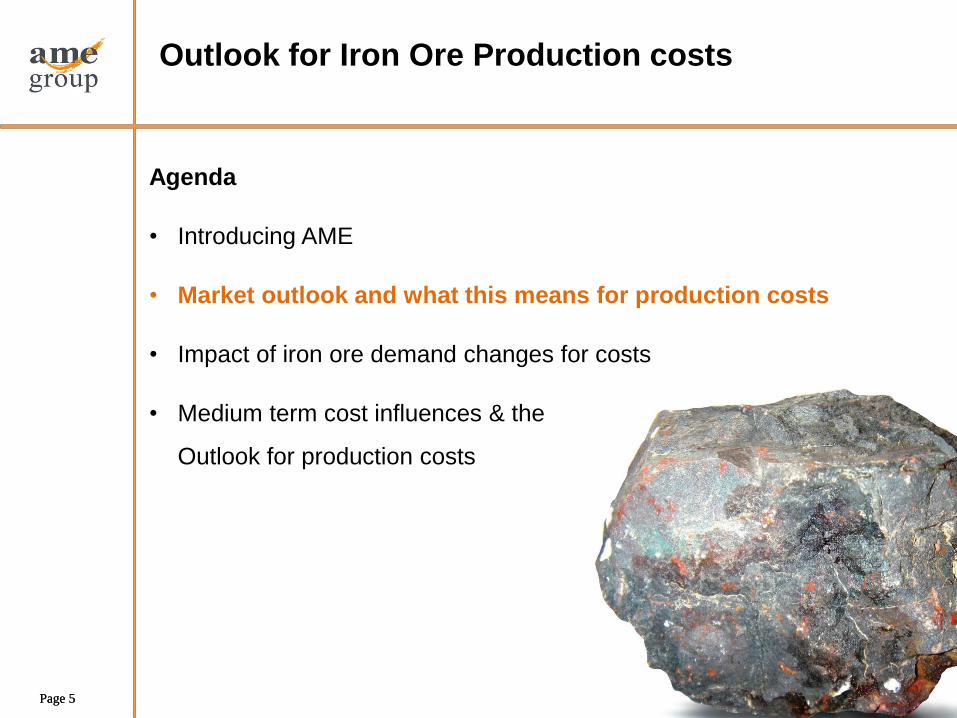
Outlook for Iron Ore Production Costs
Agenda
• Introducing AME
• Market outlook and what this means for production costs
• Impact of iron ore demand changes for costs
• Medium term cost influences & the
Outlook for production costs
Page 3 Page 3
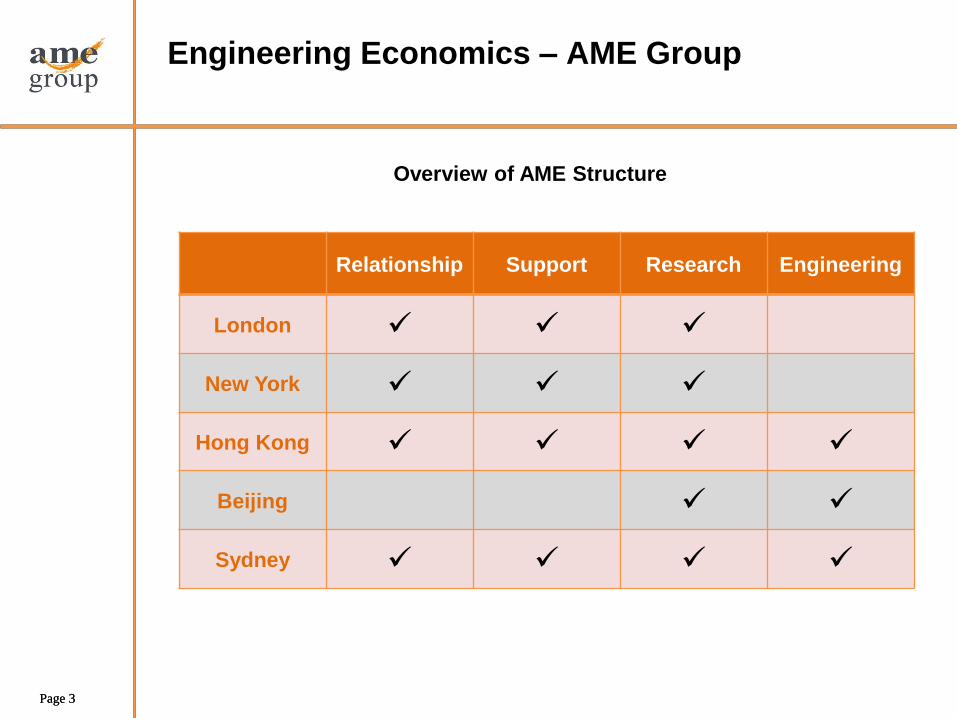
Relationship Support Research Engineering
London
New York
Hong Kong
Beijing
Sydney
Engineering Economics – AME Group
Overview of AME Structure
Page 4 Page 4
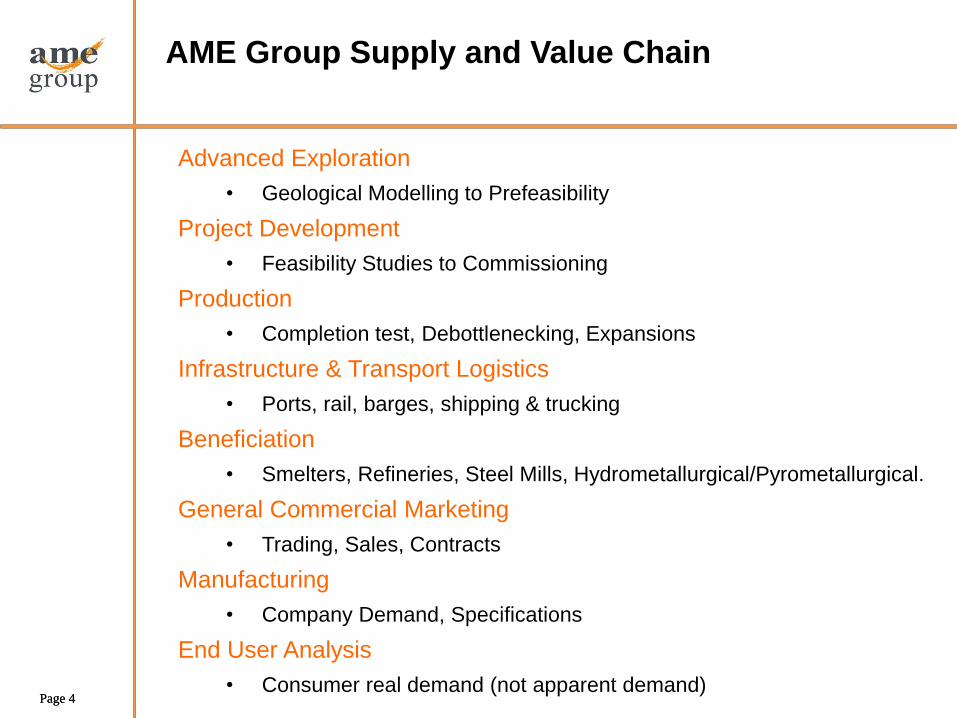
Advanced Exploration
• Geological Modelling to Prefeasibility
Project Development
• Feasibility Studies to Commissioning
Production
• Completion test, Debottlenecking, Expansions
Infrastructure & Transport Logistics
• Ports, rail, barges, shipping & trucking
Beneficiation
• Smelters, Refineries, Steel Mills, Hydrometallurgical/Pyrometallurgical.
General Commercial Marketing
• Trading, Sales, Contracts
Manufacturing
• Company Demand, Specifications
End User Analysis
• Consumer real demand (not apparent demand)
AME Group Supply and Value Chain
Page 5 Page 5
Outlook for Iron Ore Production costs
Agenda
• Introducing AME
• Market outlook and what this means for production costs
• Impact of iron ore demand changes for costs
• Medium term cost influences & the
Outlook for production costs
Page 6 Page 6
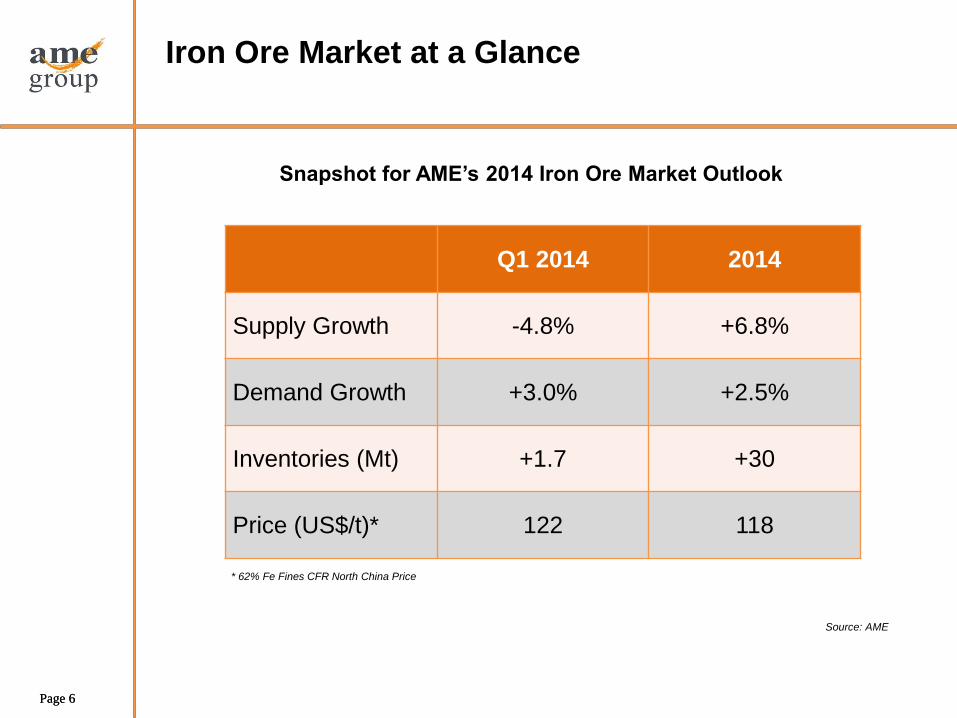
Iron Ore Market at a Glance
Q1 2014 2014
Supply Growth -4.8% +6.8%
Demand Growth +3.0% +2.5%
Inventories (Mt) +1.7 +30
Price (US$/t)* 122 118
Snapshot for AME’s 2014 Iron Ore Market Outlook
Source: AME
* 62% Fe Fines CFR North China Price
Page 7 Page 7
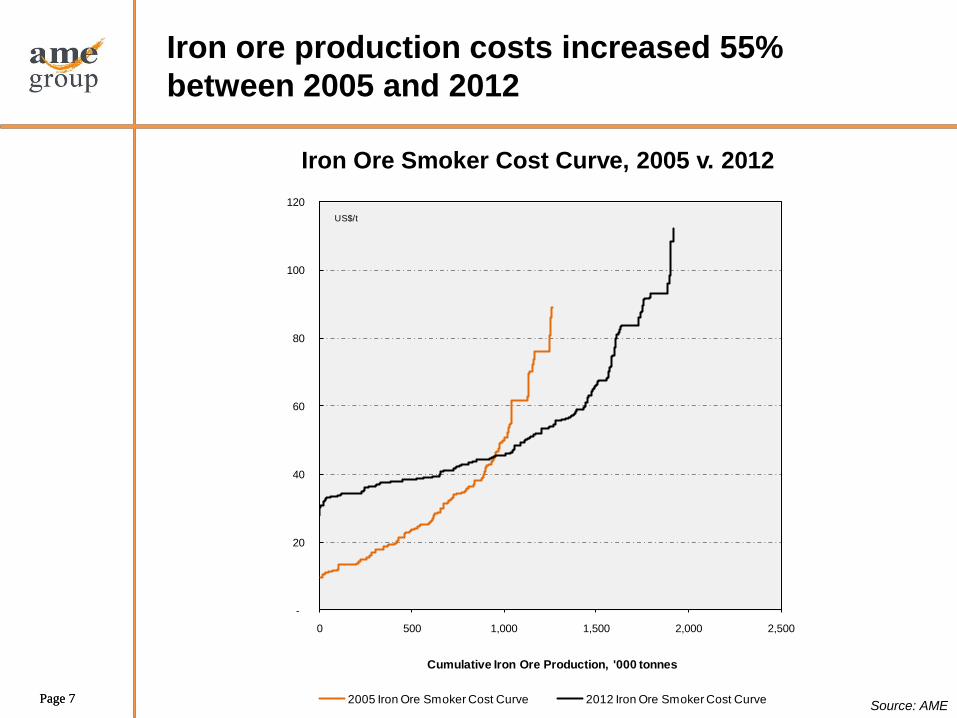
Iron ore production costs increased 55%
between 2005 and 2012
Iron Ore Smoker Cost Curve, 2005 v. 2012
Source: AME
-
20
40
60
80
100
120
0 500 1,000 1,500 2,000 2,500
Cumulative Iron Ore Production, '000 tonnes
2005 Iron Ore Smoker Cost Curve 2012 Iron Ore Smoker Cost Curve
US$/t
Page 8 Page 8
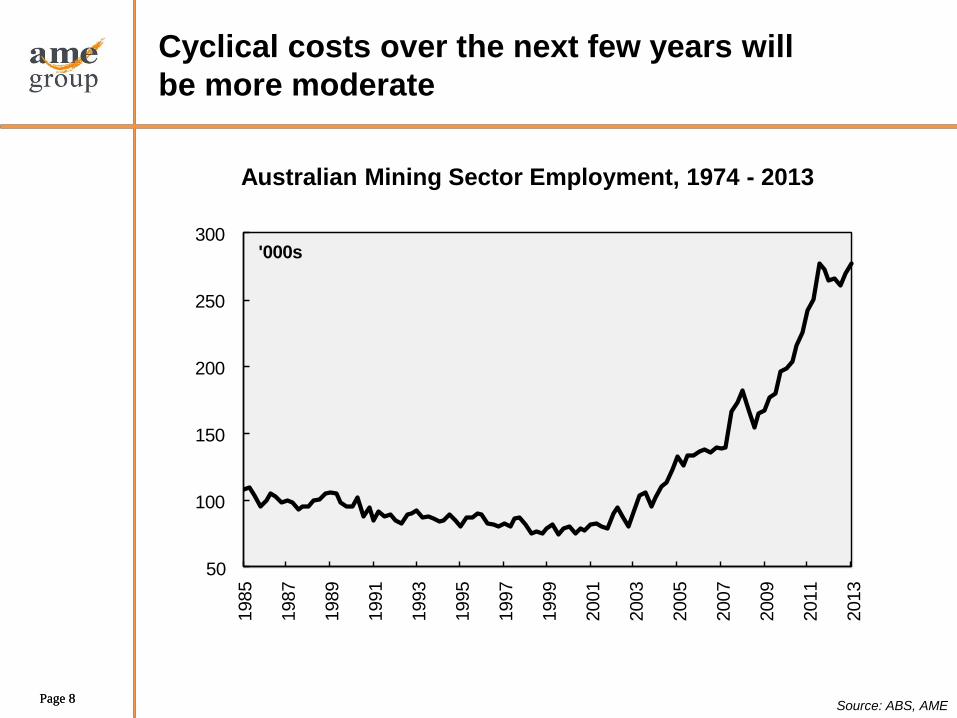
Cyclical costs over the next few years will
be more moderate
Australian Mining Sector Employment, 1974 - 2013
Source: ABS, AME
50
100
150
200
250
3001985
1987
1989
1991
1993
1995
1997
1999
2001
2003
2005
2007
2009
2011
2013
'000s
Page 9 Page 9
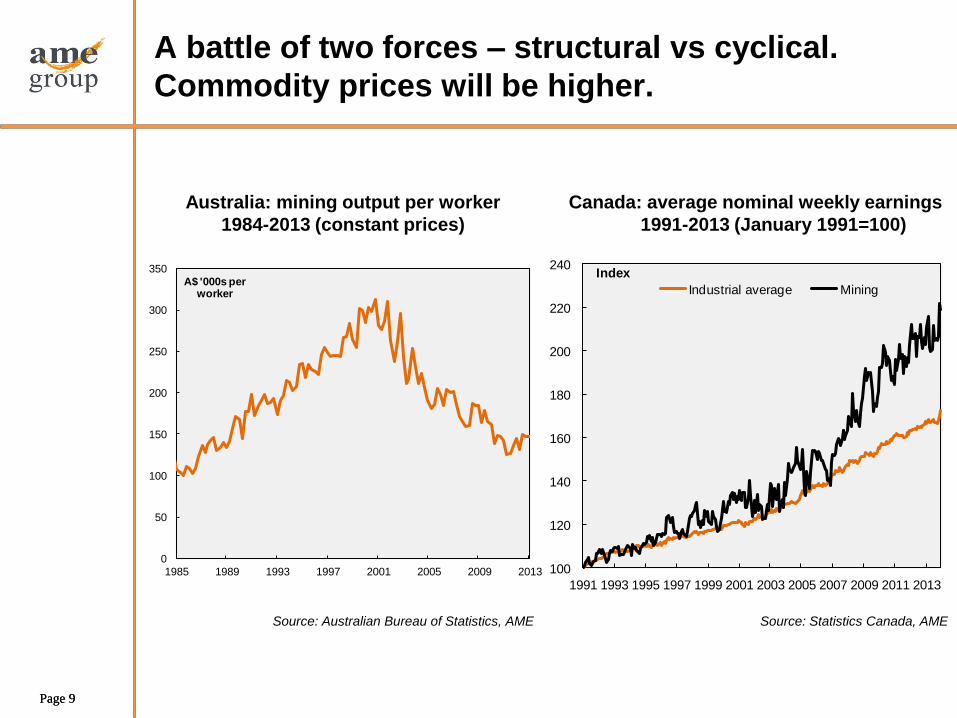
A battle of two forces – structural vs cyclical.
Commodity prices will be higher.
Canada: average nominal weekly earnings
1991-2013 (January 1991=100)
Source: Australian Bureau of Statistics, AME
Australia: mining output per worker
1984-2013 (constant prices)
Source: Statistics Canada, AME
0
50
100
150
200
250
300
350
1985 1989 1993 1997 2001 2005 2009 2013
A$ '000s per worker
100
120
140
160
180
200
220
240
1991 1993 1995 1997 1999 2001 2003 2005 2007 2009 2011 2013
Index
Industrial average Mining
Page 10 Page 10
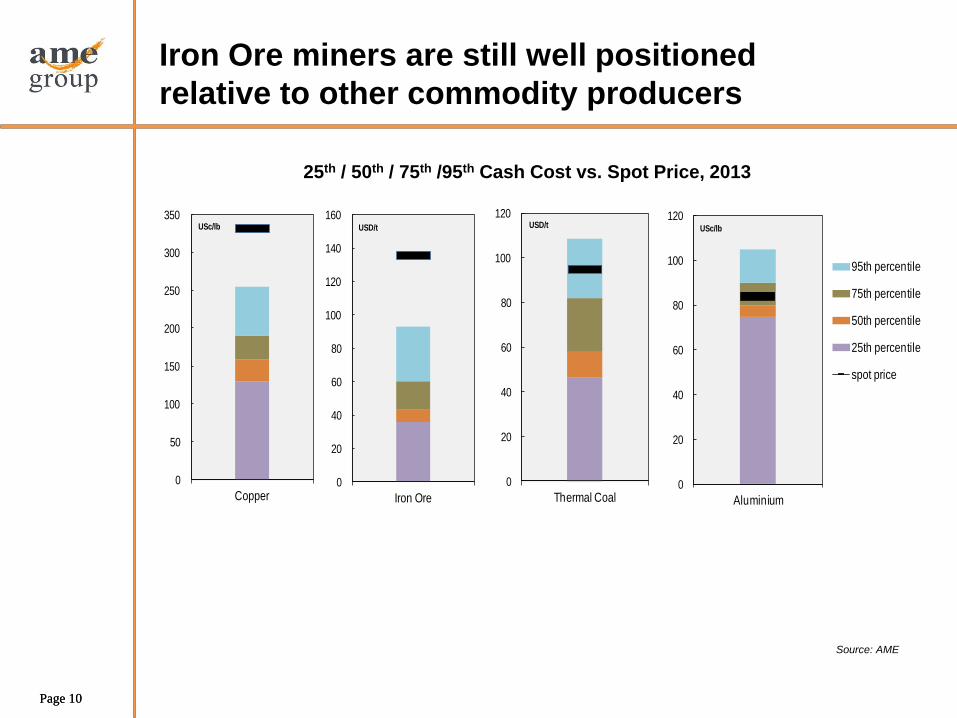
Iron Ore miners are still well positioned
relative to other commodity producers
25th / 50th / 75th /95th Cash Cost vs. Spot Price, 2013
Source: AME
0
50
100
150
200
250
300
350
Copper
USc/lb
0
20
40
60
80
100
120
140
160
Iron Ore
USD/t
0
20
40
60
80
100
120
Thermal Coal
USD/t
0
20
40
60
80
100
120
Aluminium
USc/lb
95th percentile
75th percentile
50th percentile
25th percentile
spot price
Page 11 Page 11
• Supply growth is regional, China up ~9% y-o-y for the ~9 months to September, slowing 2014. Japan up ~2%.
• Supply has contracted in many regions, South Korea down 4.5% for the year squeezed by China (production) and Japan (lower Yen).
• Demand in China remains strong, EU remains weak, US on an upswing, 2.6% 2014.
• Inventories are relatively unimportant to steel market dynamics, less spot selling and more product made to order.
• A continued pickup in demand in the short term will support prices, even as cash costs ease through 2014.
Steel Production Outlook
We are entering a new stage of the steel demand cycle
Page 12 Page 12
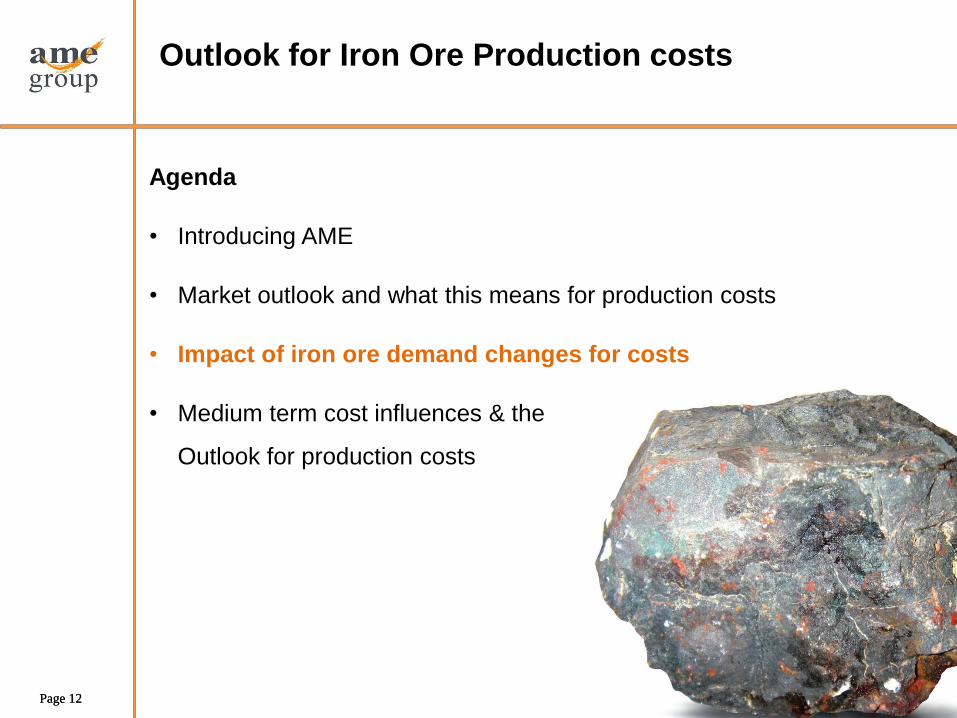
Outlook for Iron Ore Production costs
Agenda
• Introducing AME
• Market outlook and what this means for production costs
• Impact of iron ore demand changes for costs
• Medium term cost influences & the
Outlook for production costs
Page 13 Page 13
Source: AME, WSA
0
100
200
300
400
500
600
700
800
900
1000
1970 1980 1990 2000 2010 2020
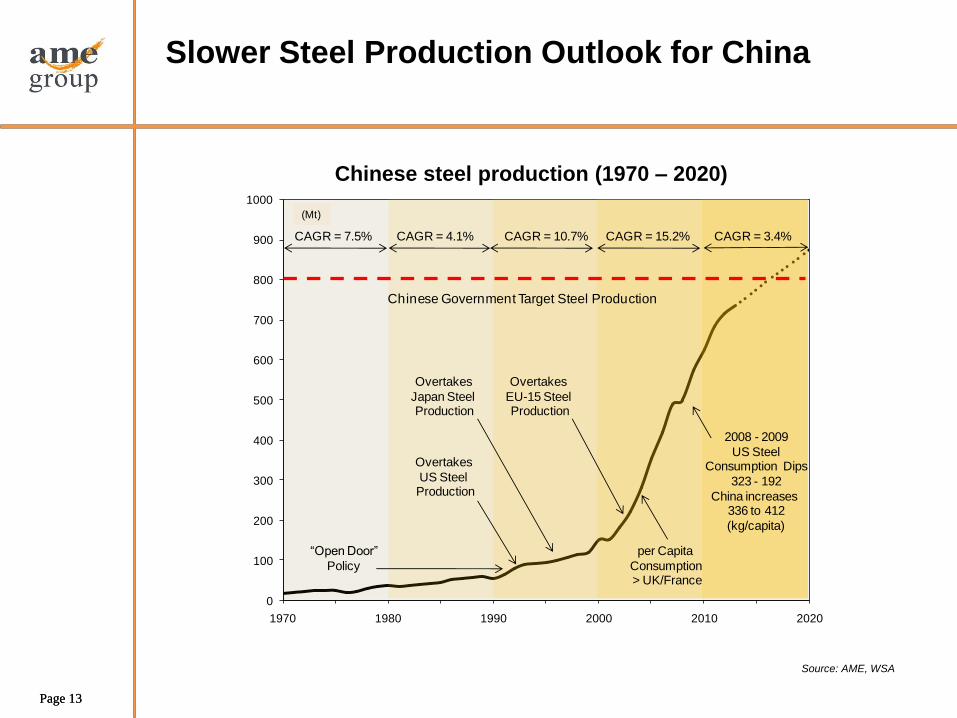
Overtakes
US Steel Production
Overtakes
Japan Steel Production
Overtakes
EU-15 Steel Production
per Capita
Consumption > UK/France
2008 - 2009
US SteelConsumption Dips
323 - 192
China increases 336 to 412
(kg/capita)
Chinese Government Target Steel Production
CAGR = 7.5% CAGR = 4.1% CAGR = 10.7% CAGR = 15.2% CAGR = 3.4%
(Mt)
“Open Door”
Policy
Chinese steel production (1970 – 2020)
Slower Steel Production Outlook for China
Page 14 Page 14
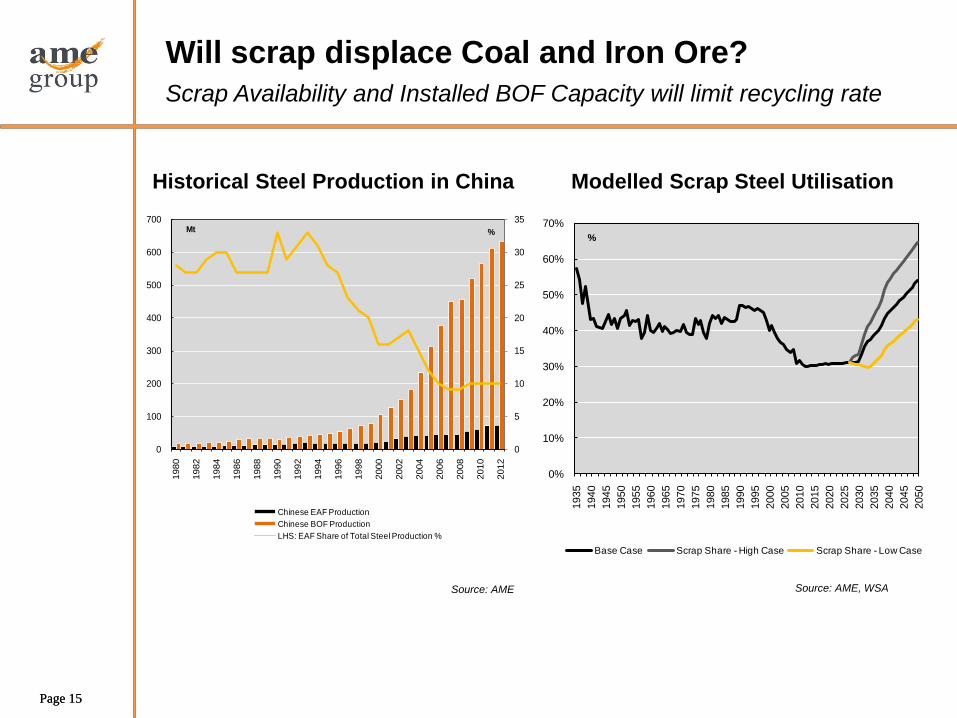
• Historically, EAF production in China averaged around 30% of production until the early 1990’s.
• When steel production boomed from the early 90’s until the present the share of EAF production declined to less than 10%.
• The current share of scrap utilisation will be maintained over the next two decades.
• Dominance of BOF steelmaking route over EAF means Chinese steel producers can only use a limited portion of scrap in their feed.
• Chinese steelmaking will remain mainly blast furnace as there is a structural shift towards higher quality steels, by Government policy.
Will scrap displace Coal and Iron Ore?
Mini-mills do not pose a threat to demand over the next 20 years
Page 15 Page 15
Historical Steel Production in China
0%
10%
20%
30%
40%
50%
60%
70%
1935
1940
1945
1950
1955
1960
1965
1970
1975
1980
1985
1990
1995
2000
2005
2010
2015
2020
2025
2030
2035
2040
2045
2050
Base Case Scrap Share - High Case Scrap Share - Low Case
%
Modelled Scrap Steel Utilisation
Source: AME, WSA
(Mt) (%)
0
5
10
15
20
25
30
35
0
100
200
300
400
500
600
700
1980
1982
1984
1986
1988
1990
1992
1994
1996
1998
2000
2002
2004
2006
2008
2010
2012
Chinese EAF Production
Chinese BOF Production
LHS: EAF Share of Total Steel Production %
Mt %
Will scrap displace Coal and Iron Ore?
Scrap Availability and Installed BOF Capacity will limit recycling rate
Source: AME
Page 16 Page 16
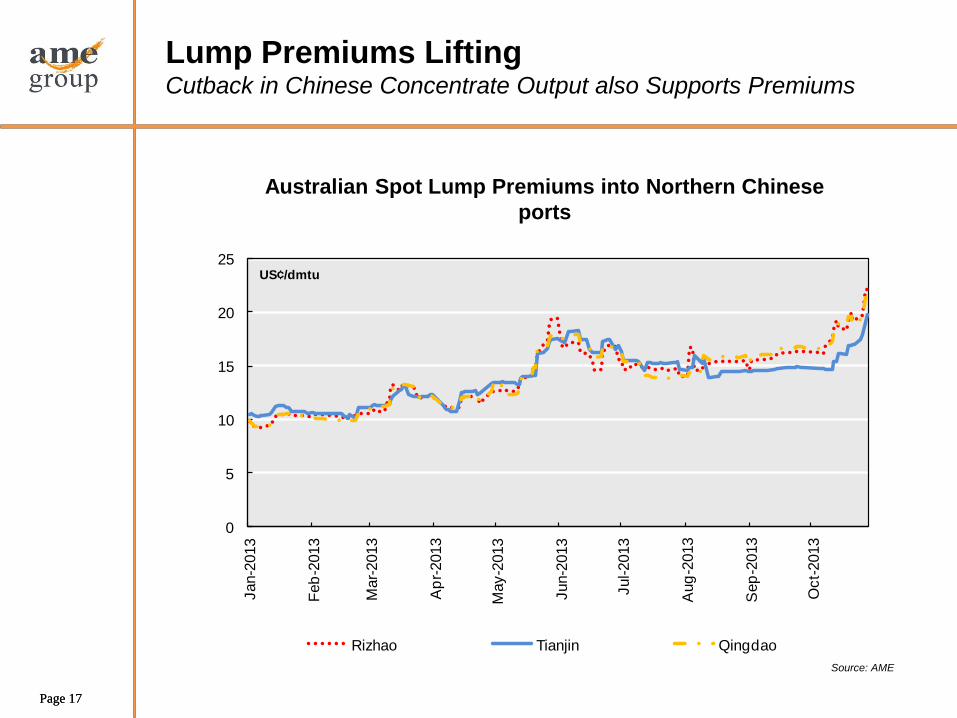
• Rio and BHP agreed on lump premiums with Chinese steelmakers for Q4 at 18- 19¢/dmtu – higher than 3Q premiums of 13- 14¢/dmtu.
• Japanese steelmakers negotiated lump premiums at 16¢/dmtu with one miner and 19¢/dmtu with another for the December quarter.
• North Asian mills were offered higher premiums in previous quarters with miners citing different demand conditions from China.
• Spot premiums have lifted above 20¢/dmtu as conc. output in China’s NE mines dropped, operating at 70% capacity due to colder weather.
• Higher concentrate prices, driven by lower supply, have prompted stronger lump demand.
Lump Premiums Lifting Shortage of Cargoes and Strengthening Demand as Sinter Plants Stop
Page 17 Page 17
0
5
10
15
20
25Jan-2
013
Feb
-2013
Mar-
2013
Ap
r-2013
May-2
013
Jun-2
013
Jul-2013
Aug
-2013
Sep
-2013
Oct-
2013
Rizhao Tianjin Qingdao
US¢/dmtu
Australian Spot Lump Premiums into Northern Chinese
ports
Source: AME
Lump Premiums Lifting Cutback in Chinese Concentrate Output also Supports Premiums
Page 18 Page 18
Outlook for Iron Ore Production costs
Agenda
• Introducing AME
• Market outlook and what this means for production costs
• Impact of iron ore demand changes for costs
• Medium term cost influences & the
Outlook for production costs
Page 19 Page 19
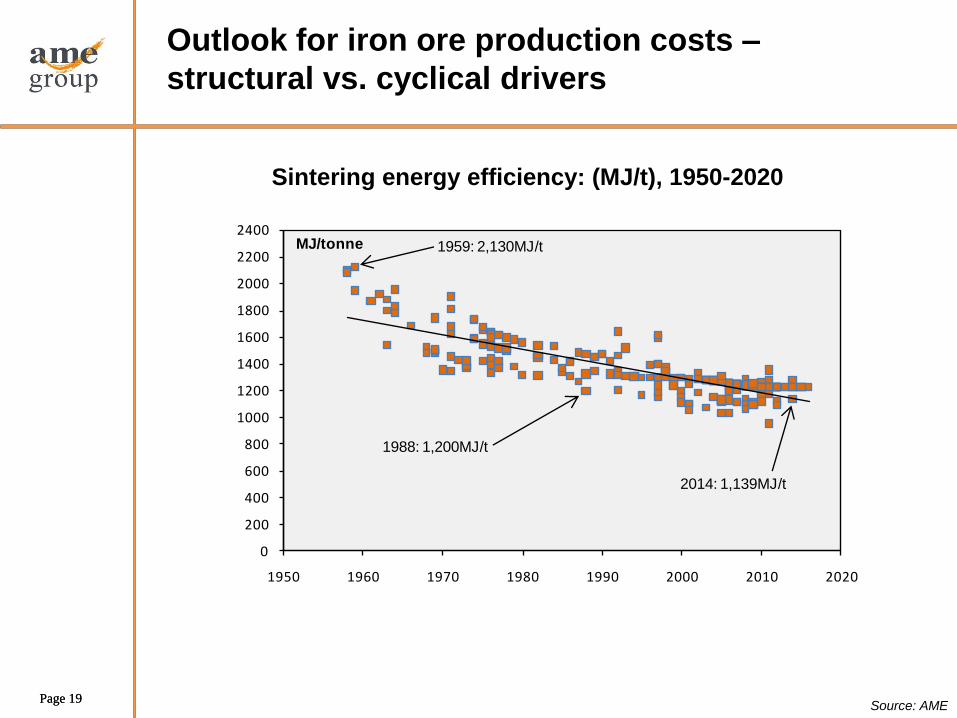
Outlook for iron ore production costs –
structural vs. cyclical drivers
0
200
400
600
800
1000
1200
1400
1600
1800
2000
2200
2400
1950 1960 1970 1980 1990 2000 2010 2020
MJ/tonne 1959: 2,130MJ/t
1988: 1,200MJ/t
2014: 1,139MJ/t
Sintering energy efficiency: (MJ/t), 1950-2020
Source: AME
Page 20 Page 20
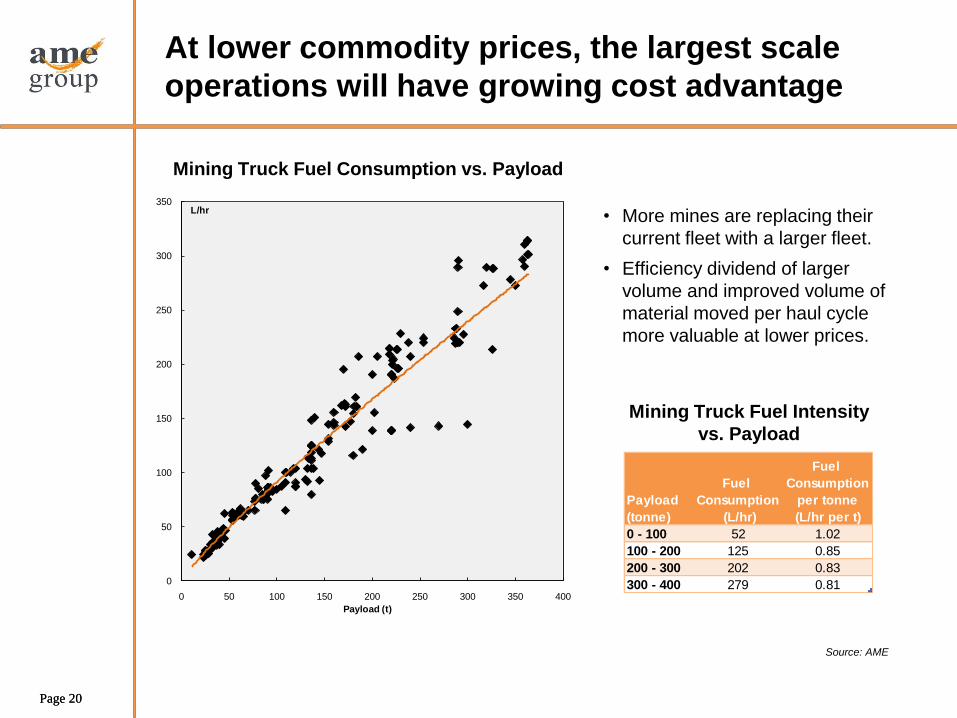
At lower commodity prices, the largest scale
operations will have growing cost advantage
Mining Truck Fuel Consumption vs. Payload
• More mines are replacing their
current fleet with a larger fleet.
• Efficiency dividend of larger
volume and improved volume of
material moved per haul cycle
more valuable at lower prices.
Source: AME
Mining Truck Fuel Intensity
vs. Payload
0
50
100
150
200
250
300
350
0 50 100 150 200 250 300 350 400
L/hr
Payload (t)
Payload
(tonne)
Fuel
Consumption
(L/hr)
Fuel
Consumption
per tonne
(L/hr per t)
0 - 100 52 1.02
100 - 200 125 0.85
200 - 300 202 0.83
300 - 400 279 0.81
Page 21 Page 21
A large proportion of Chinese Iron Ore mines are
uncompetitive
• Increasing strip ratios are forcing many Chinese iron ore mines to
go underground
• The majority of Chinese supply sits in the fourth quartile of the
cash cost curve.
• In 2013, 10-15% of Chinese capacity operating at $110/t-$140/t.
• Higher cost Chinese production will be displaced by additional
tonnes from Brazil, Australia and India
Page 22 Page 22
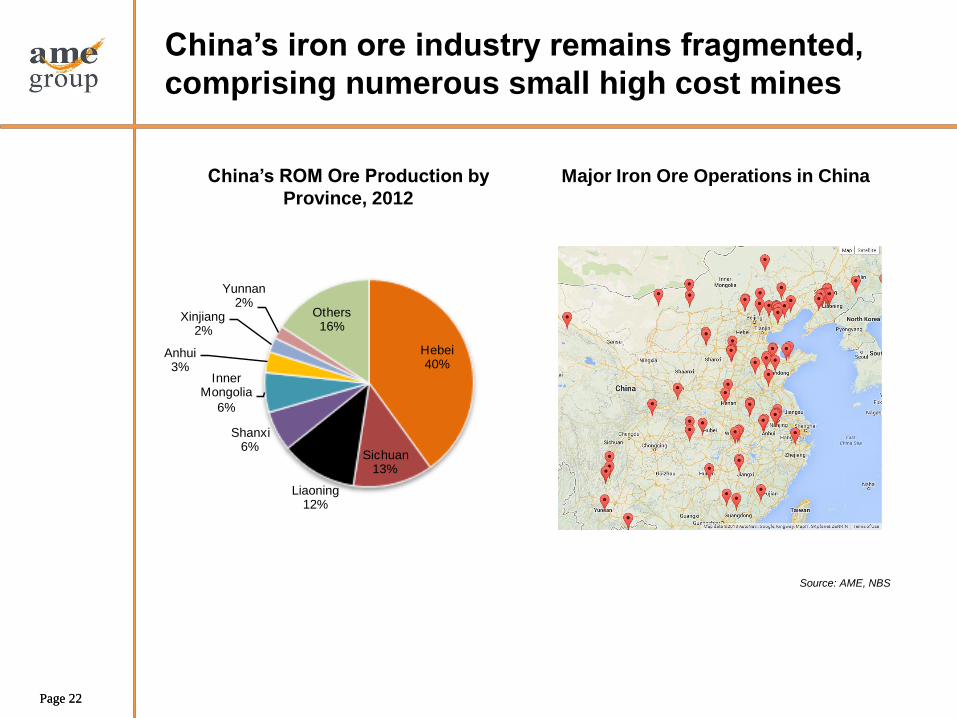
China’s iron ore industry remains fragmented,
comprising numerous small high cost mines
Hebei40%
Sichuan13%
Liaoning12%
Shanxi6%
Inner Mongolia
6%
Anhui3%
Xinjiang2%
Yunnan2%
Others16%
China’s ROM Ore Production by
Province, 2012
Source: AME, NBS
Major Iron Ore Operations in China
Page 23 Page 23
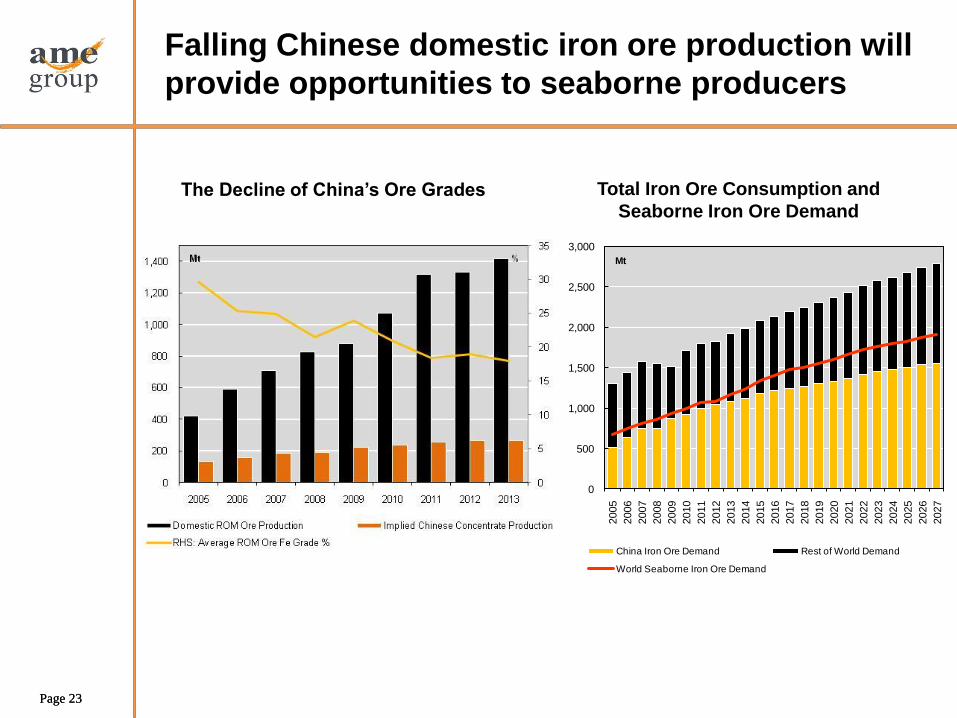
Falling Chinese domestic iron ore production will
provide opportunities to seaborne producers
The Decline of China’s Ore Grades Total Iron Ore Consumption and
Seaborne Iron Ore Demand
0
500
1,000
1,500
2,000
2,500
3,000
2005
2006
2007
2008
2009
2010
2011
2012
2013
2014
2015
2016
2017
2018
2019
2020
2021
2022
2023
2024
2025
2026
2027
China Iron Ore Demand Rest of World Demand
World Seaborne Iron Ore Demand
Mt
Page 24 Page 24
Declining grade necessitates higher processing
cost for production
• Low ore grade in China necessitates additional beneficiation such
as multiple stage grinding and screening and magnetic separation,
which drives production costs higher.
• Iron ore deposits in China are generally low grade deposits with
high impurities, with deposit grade of as low as 5-15% Fe being
mined.
• The aggressive decline of China’s domestic ore grades will mean
Chinese seaborne demand will outpace China’s total consumption
over the short term.
Page 25 Page 25
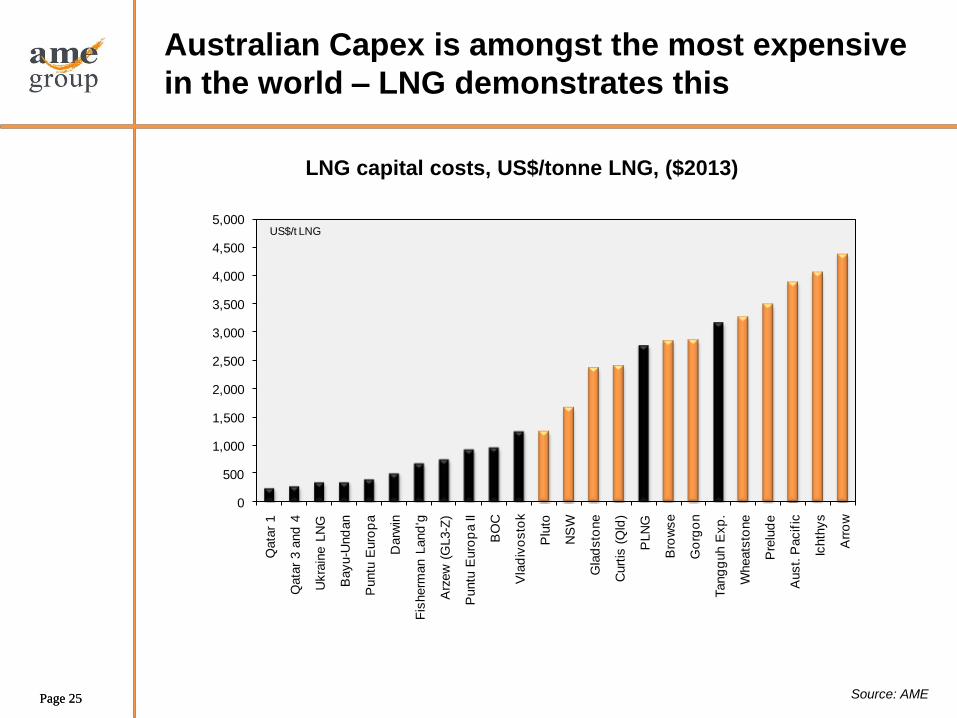
Australian Capex is amongst the most expensive
in the world – LNG demonstrates this
Source: AME
0
500
1,000
1,500
2,000
2,500
3,000
3,500
4,000
4,500
5,000
Qata
r 1
Qata
r 3 a
nd
4
Ukra
ine L
NG
Bayu-U
nd
an
Puntu
Euro
pa
Darw
in
Fis
herm
an L
and
'g
Arz
ew
(G
L3-Z
)
Puntu
Euro
pa II
BO
C
Vla
div
osto
k
Plu
to
NS
W
Gla
dsto
ne
Curt
is (
Qld
)
PLN
G
Bro
wse
Go
rgo
n
Tang
guh E
xp
.
Wheats
tone
Pre
lud
e
Aust.
Pacif
ic
Ichth
ys
Arr
ow
US$/t LNG
LNG capital costs, US$/tonne LNG, ($2013)

Page 26 Page 26
Forward looking information Certain statements and graphics contained in this presentation may contain forward-looking information within the meaning of various securities laws. Such forward-looking
information are identified by words such as "estimates", "intends", "expects", "believes", "may", "will" and included, without limitation, statements regarding the company's plan of
business operations, production levels and costs, potential contractual arrangements and the delivery of equipment, receipt of working capital, anticipated revenues, mineral reserve and
mineral resource estimates, and projected expenditures. There can be no assurance that such statements will prove to be accurate; actual results and future events could differ
materially from such statements. Factors that could cause actual results to differ materially include, among others, metal prices, risks inherent in the mining industry, financing risks,
labour risks, uncertainty of mineral reserve and resource estimates, equipment and supply risks, regulatory risks and environmental concerns. Most of these factors are outside the
control of the company. Investors are cautioned not to put undue reliance on forward-looking information. Except as otherwise required by applicable securities statutes or regulation,
the company expressly disclaims any intent or obligation to update publicly forward-looking information, whether as a result of new information, future events or otherwise.
Copyright @ AME Group 2014
Contact Details and Important Information
For further details, please visit our website at www.amegroup.com
Hong Kong Sydney London New York
4/F Lucky Building
39 Wellington Street
Central, Hong Kong
AME House
342 Kent Street
Sydney NSW 2000
32 Hanover Square
London W1S 1JB
United Kingdom
Level 16, 733 3rd Avenue
New York NY 10017
United States
T: +852 2846 8220
F: +852 2801 5337
T: +61 2 9262 2264
F: +61 2 9262 2587
T: +44 203 714 8725
T: +1 646 790 5770