Embed Size (px)
DESCRIPTION
A new report issued as part of an ongoing Marcellus Education Fact Sheet series from Penn State University Cooperative Extension. This report analyzes the impacts of revenue and costs to school districts where there is active Marcellus Shale drilling activity. With some surprising conclusions.
Citation preview
Marcellus Shale Gas Development and Pennsylvania School Districts: What Are the Implications for School Expenditures and Tax Revenues?
MarcellusEducationFact Sheet
Department of Education (PDE) data, in 2009–2010 Pennsylvania schools drew 56 percent of their revenues from local sources—the eighth highest rate among all 50 states.2 The poorest school districts in Pennsylvania are also far more likely to experience drilling activity associated with Marcellus natural gas. For example, only one of the 50 wealthiest school districts had a single Marcellus well by the middle of 2010.3 However, during the same time period, 18 of the poorest 50 school districts had experienced Marcellus drilling, accounting for a total of 364 wells. At the same time, the Marcellus shale gas indus-try may result in extra and perhaps unanticipated costs and challenges for school districts, including new traffic congestion and road condi-tions that disrupt bus schedules, changes in student populations, and tightened housing markets.4 To what extent does new eco-nomic activity associated with Marcellus shale gas extraction ex-tend to benefits for Pennsylvania schools? What are the current tax regulations in Pennsylvania per-taining to school districts, and what evidence is there to suggest eco-nomic impacts for school districts? What evidence exists to suggest that increased costs to school dis-tricts are associated with Marcellus
Introduction
In 2005, when the first gas wells were drilled into the Marcellus shale in Pennsylvania, very few
people across the state were aware of the existence of Marcellus shale, let alone its economic development potential and the significant impacts for people and communities across much of the Commonwealth. By early 2012, however, almost 5,000 wells had been drilled into Penn-sylvania’s Marcellus shale layer. With estimates of 60,000 or more Marcellus gas wells projected in the coming decades, new economic studies began to suggest significant employment and income gains, and Governor Tom Corbett declared his intent to make Pennsylvania “the Texas of the natural gas boom.”1 The Marcellus shale gas develop-ment has been heralded by many as an unprecedented economic oppor-tunity for Pennsylvania, especially since much of the drilling activity in the state has been located in eco-nomically lagging and often rural areas with, until recently, relatively few employment opportunities. These developments raise many questions, including what the growing Marcellus industry means for school districts. Pennsylvania school districts rely heavily on lo-cal funding to support their opera-tions. According to Pennsylvania
development? In examining these questions in this fact sheet we take a particular look at Act 1 of Special Session 2005–2006 and the implica-tions this legislation may have for augmenting school revenues.
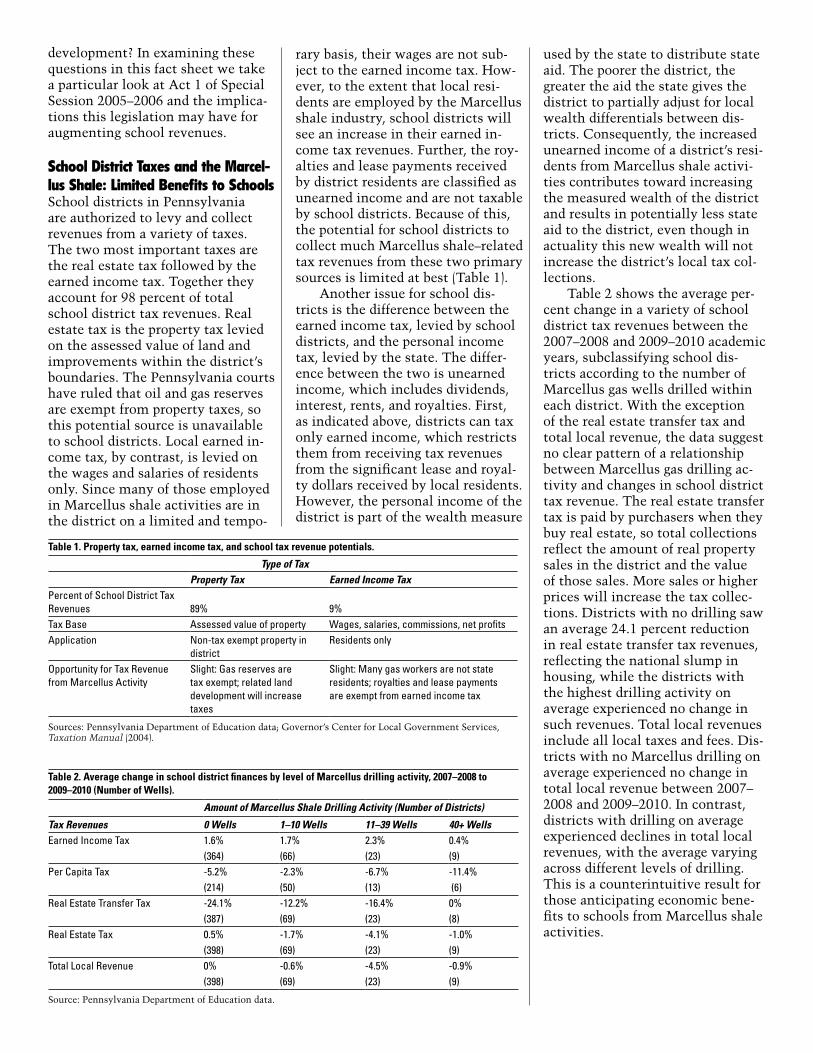
School District Taxes and the Marcel-lus Shale: Limited Benefits to SchoolsSchool districts in Pennsylvania are authorized to levy and collect revenues from a variety of taxes. The two most important taxes are the real estate tax followed by the earned income tax. Together they account for 98 percent of total school district tax revenues. Real estate tax is the property tax levied on the assessed value of land and improvements within the district’s boundaries. The Pennsylvania courts have ruled that oil and gas reserves are exempt from property taxes, so this potential source is unavailable to school districts. Local earned in-come tax, by contrast, is levied on the wages and salaries of residents only. Since many of those employed in Marcellus shale activities are in the district on a limited and tempo-
rary basis, their wages are not sub-ject to the earned income tax. How-ever, to the extent that local resi-dents are employed by the Marcellus shale industry, school districts will see an increase in their earned in-come tax revenues. Further, the roy-alties and lease payments received by district residents are classified as unearned income and are not taxable by school districts. Because of this, the potential for school districts to collect much Marcellus shale–related tax revenues from these two primary sources is limited at best (Table 1). Another issue for school dis-tricts is the difference between the earned income tax, levied by school districts, and the personal income tax, levied by the state. The differ-ence between the two is unearned income, which includes dividends, interest, rents, and royalties. First, as indicated above, districts can tax only earned income, which restricts them from receiving tax revenues from the significant lease and royal-ty dollars received by local residents. However, the personal income of the district is part of the wealth measure
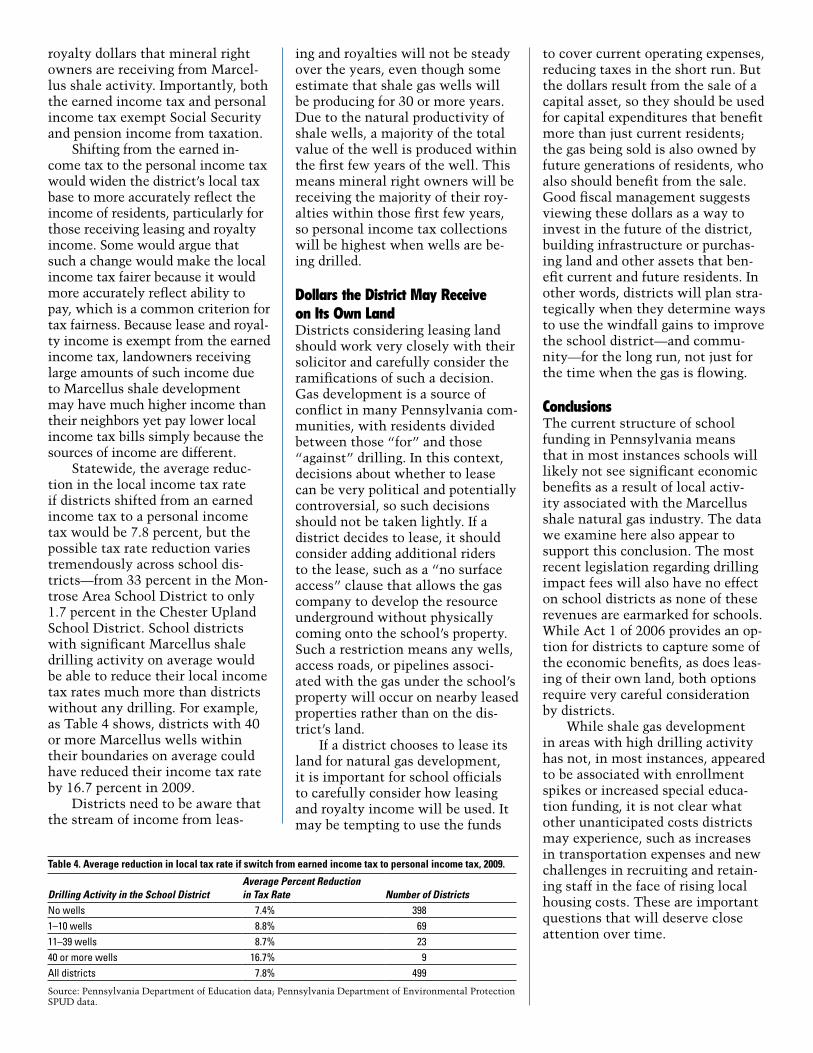
used by the state to distribute state aid. The poorer the district, the greater the aid the state gives the district to partially adjust for local wealth differentials between dis-tricts. Consequently, the increased unearned income of a district’s resi-dents from Marcellus shale activi-ties contributes toward increasing the measured wealth of the district and results in potentially less state aid to the district, even though in actuality this new wealth will not increase the district’s local tax col-lections. Table 2 shows the average per-cent change in a variety of school district tax revenues between the 2007–2008 and 2009–2010 academic years, subclassifying school dis-tricts according to the number of Marcellus gas wells drilled within each district. With the exception of the real estate transfer tax and total local revenue, the data suggest no clear pattern of a relationship between Marcellus gas drilling ac-tivity and changes in school district tax revenue. The real estate transfer tax is paid by purchasers when they buy real estate, so total collections reflect the amount of real property sales in the district and the value of those sales. More sales or higher prices will increase the tax collec-tions. Districts with no drilling saw an average 24.1 percent reduction in real estate transfer tax revenues, reflecting the national slump in housing, while the districts with the highest drilling activity on average experienced no change in such revenues. Total local revenues include all local taxes and fees. Dis-tricts with no Marcellus drilling on average experienced no change in total local revenue between 2007–2008 and 2009–2010. In contrast, districts with drilling on average experienced declines in total local revenues, with the average varying across different levels of drilling. This is a counterintuitive result for those anticipating economic bene-fits to schools from Marcellus shale activities.
Table 1. Property tax, earned income tax, and school tax revenue potentials.
Type of TaxProperty Tax Earned Income Tax
Percent of School District Tax Revenues 89% 9%Tax Base Assessed value of property Wages, salaries, commissions, net profitsApplication Non-tax exempt property in
districtResidents only
Opportunity for Tax Revenue from Marcellus Activity
Slight: Gas reserves are tax exempt; related land development will increase taxes
Slight: Many gas workers are not state residents; royalties and lease payments are exempt from earned income tax
Sources: Pennsylvania Department of Education data; Governor’s Center for Local Government Services, Taxation Manual (2004).
Table 2. Average change in school district finances by level of Marcellus drilling activity, 2007–2008 to 2009–2010 (Number of Wells).
Amount of Marcellus Shale Drilling Activity (Number of Districts)
Tax Revenues 0 Wells 1–10 Wells 11–39 Wells 40+ WellsEarned Income Tax 1.6% 1.7% 2.3% 0.4%
(364) (66) (23) (9)Per Capita Tax -5.2% -2.3% -6.7% -11.4%
(214) (50) (13) (6)Real Estate Transfer Tax -24.1% -12.2% -16.4% 0%
(387) (69) (23) (8)Real Estate Tax 0.5% -1.7% -4.1% -1.0%
(398) (69) (23) (9)Total Local Revenue 0% -0.6% -4.5% -0.9%
(398) (69) (23) (9)
Source: Pennsylvania Department of Education data.
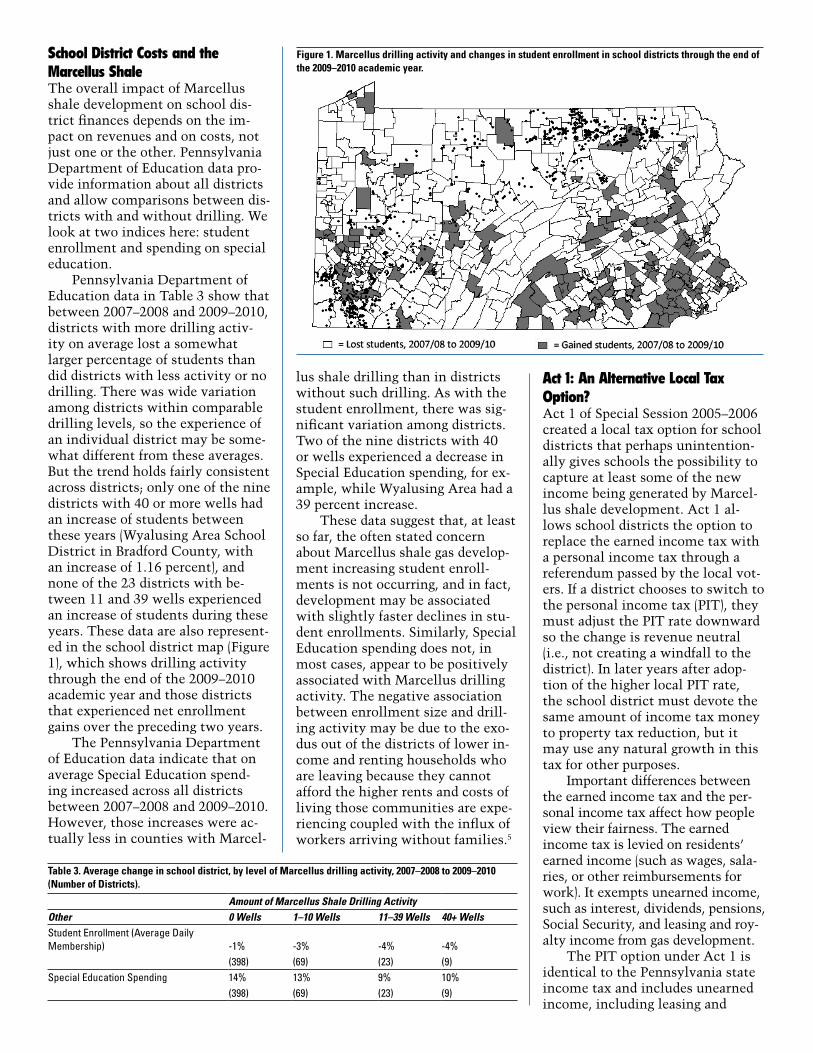
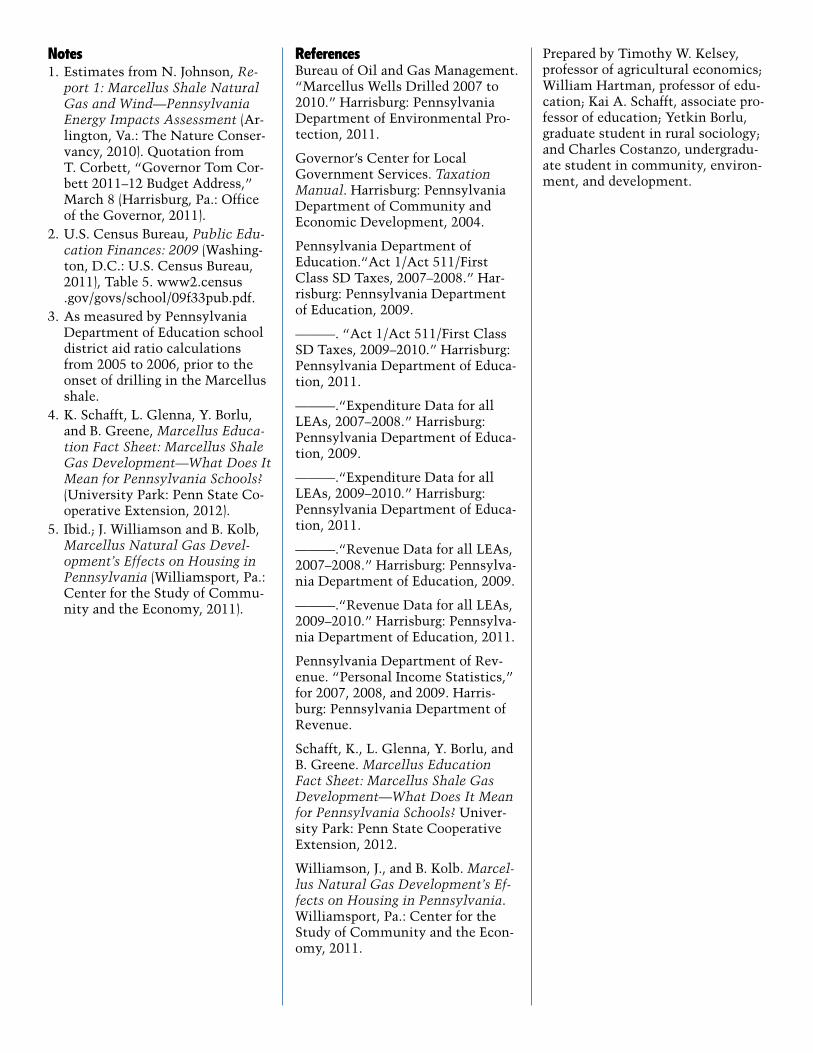
School District Costs and the Marcellus ShaleThe overall impact of Marcellus shale development on school dis-trict finances depends on the im-pact on revenues and on costs, not just one or the other. Pennsylvania Department of Education data pro-vide information about all districts and allow comparisons between dis-tricts with and without drilling. We look at two indices here: student enrollment and spending on special education. Pennsylvania Department of Education data in Table 3 show that between 2007–2008 and 2009–2010, districts with more drilling activ-ity on average lost a somewhat larger percentage of students than did districts with less activity or no drilling. There was wide variation among districts within comparable drilling levels, so the experience of an individual district may be some-what different from these averages. But the trend holds fairly consistent across districts; only one of the nine districts with 40 or more wells had an increase of students between these years (Wyalusing Area School District in Bradford County, with an increase of 1.16 percent), and none of the 23 districts with be-tween 11 and 39 wells experienced an increase of students during these years. These data are also represent-ed in the school district map (Figure 1), which shows drilling activity through the end of the 2009–2010 academic year and those districts that experienced net enrollment gains over the preceding two years. The Pennsylvania Department of Education data indicate that on average Special Education spend-ing increased across all districts between 2007–2008 and 2009–2010. However, those increases were ac-tually less in counties with Marcel-
Act 1: An Alternative Local Tax Option?Act 1 of Special Session 2005–2006 created a local tax option for school districts that perhaps unintention-ally gives schools the possibility to capture at least some of the new income being generated by Marcel-lus shale development. Act 1 al-lows school districts the option to replace the earned income tax with a personal income tax through a referendum passed by the local vot-ers. If a district chooses to switch to the personal income tax (PIT), they must adjust the PIT rate downward so the change is revenue neutral (i.e., not creating a windfall to the district). In later years after adop-tion of the higher local PIT rate, the school district must devote the same amount of income tax money to property tax reduction, but it may use any natural growth in this tax for other purposes. Important differences between the earned income tax and the per-sonal income tax affect how people view their fairness. The earned income tax is levied on residents’ earned income (such as wages, sala-ries, or other reimbursements for work). It exempts unearned income, such as interest, dividends, pensions, Social Security, and leasing and roy-alty income from gas development. The PIT option under Act 1 is identical to the Pennsylvania state income tax and includes unearned income, including leasing and
lus shale drilling than in districts without such drilling. As with the student enrollment, there was sig-nificant variation among districts. Two of the nine districts with 40 or wells experienced a decrease in Special Education spending, for ex-ample, while Wyalusing Area had a 39 percent increase. These data suggest that, at least so far, the often stated concern about Marcellus shale gas develop-ment increasing student enroll-ments is not occurring, and in fact, development may be associated with slightly faster declines in stu-dent enrollments. Similarly, Special Education spending does not, in most cases, appear to be positively associated with Marcellus drilling activity. The negative association between enrollment size and drill-ing activity may be due to the exo-dus out of the districts of lower in-come and renting households who are leaving because they cannot afford the higher rents and costs of living those communities are expe-riencing coupled with the influx of workers arriving without families.5
Table 3. Average change in school district, by level of Marcellus drilling activity, 2007–2008 to 2009–2010 (Number of Districts).
Amount of Marcellus Shale Drilling ActivityOther 0 Wells 1–10 Wells 11–39 Wells 40+ WellsStudent Enrollment (Average Daily Membership) -1% -3% -4% -4%
(398) (69) (23) (9)Special Education Spending 14% 13% 9% 10%
(398) (69) (23) (9)
Figure 1. Marcellus drilling activity and changes in student enrollment in school districts through the end of the 2009–2010 academic year.
royalty dollars that mineral right owners are receiving from Marcel-lus shale activity. Importantly, both the earned income tax and personal income tax exempt Social Security and pension income from taxation. Shifting from the earned in-come tax to the personal income tax would widen the district’s local tax base to more accurately reflect the income of residents, particularly for those receiving leasing and royalty income. Some would argue that such a change would make the local income tax fairer because it would more accurately reflect ability to pay, which is a common criterion for tax fairness. Because lease and royal-ty income is exempt from the earned income tax, landowners receiving large amounts of such income due to Marcellus shale development may have much higher income than their neighbors yet pay lower local income tax bills simply because the sources of income are different. Statewide, the average reduc-tion in the local income tax rate if districts shifted from an earned income tax to a personal income tax would be 7.8 percent, but the possible tax rate reduction varies tremendously across school dis-tricts—from 33 percent in the Mon-trose Area School District to only 1.7 percent in the Chester Upland School District. School districts with significant Marcellus shale drilling activity on average would be able to reduce their local income tax rates much more than districts without any drilling. For example, as Table 4 shows, districts with 40 or more Marcellus wells within their boundaries on average could have reduced their income tax rate by 16.7 percent in 2009. Districts need to be aware that the stream of income from leas-
ing and royalties will not be steady over the years, even though some estimate that shale gas wells will be producing for 30 or more years. Due to the natural productivity of shale wells, a majority of the total value of the well is produced within the first few years of the well. This means mineral right owners will be receiving the majority of their roy-alties within those first few years, so personal income tax collections will be highest when wells are be-ing drilled.
Dollars the District May Receive on Its Own Land Districts considering leasing land should work very closely with their solicitor and carefully consider the ramifications of such a decision. Gas development is a source of conflict in many Pennsylvania com-munities, with residents divided between those “for” and those “against” drilling. In this context, decisions about whether to lease can be very political and potentially controversial, so such decisions should not be taken lightly. If a district decides to lease, it should consider adding additional riders to the lease, such as a “no surface access” clause that allows the gas company to develop the resource underground without physically coming onto the school’s property. Such a restriction means any wells, access roads, or pipelines associ-ated with the gas under the school’s property will occur on nearby leased properties rather than on the dis-trict’s land. If a district chooses to lease its land for natural gas development, it is important for school officials to carefully consider how leasing and royalty income will be used. It may be tempting to use the funds
to cover current operating expenses, reducing taxes in the short run. But the dollars result from the sale of a capital asset, so they should be used for capital expenditures that benefit more than just current residents; the gas being sold is also owned by future generations of residents, who also should benefit from the sale. Good fiscal management suggests viewing these dollars as a way to invest in the future of the district, building infrastructure or purchas-ing land and other assets that ben-efit current and future residents. In other words, districts will plan stra-tegically when they determine ways to use the windfall gains to improve the school district—and commu-nity—for the long run, not just for the time when the gas is flowing.
ConclusionsThe current structure of school funding in Pennsylvania means that in most instances schools will likely not see significant economic benefits as a result of local activ-ity associated with the Marcellus shale natural gas industry. The data we examine here also appear to support this conclusion. The most recent legislation regarding drilling impact fees will also have no effect on school districts as none of these revenues are earmarked for schools. While Act 1 of 2006 provides an op-tion for districts to capture some of the economic benefits, as does leas-ing of their own land, both options require very careful consideration by districts. While shale gas development in areas with high drilling activity has not, in most instances, appeared to be associated with enrollment spikes or increased special educa-tion funding, it is not clear what other unanticipated costs districts may experience, such as increases in transportation expenses and new challenges in recruiting and retain-ing staff in the face of rising local housing costs. These are important questions that will deserve close attention over time.
Table 4. Average reduction in local tax rate if switch from earned income tax to personal income tax, 2009.
Drilling Activity in the School DistrictAverage Percent Reduction in Tax Rate Number of Districts
No wells 7.4% 3981–10 wells 8.8% 6911–39 wells 8.7% 2340 or more wells 16.7% 9All districts 7.8% 499
Source: Pennsylvania Department of Education data; Pennsylvania Department of Environmental Protection SPUD data.
Notes1. Estimates from N. Johnson, Re-
port 1: Marcellus Shale Natural Gas and Wind—Pennsylvania Energy Impacts Assessment (Ar-lington, Va.: The Nature Conser-vancy, 2010). Quotation from T. Corbett, “Governor Tom Cor-bett 2011–12 Budget Address,” March 8 (Harrisburg, Pa.: Office of the Governor, 2011).
2. U.S. Census Bureau, Public Edu-cation Finances: 2009 (Washing-ton, D.C.: U.S. Census Bureau, 2011), Table 5. www2.census .gov/govs/school/09f33pub.pdf.
3. As measured by Pennsylvania Department of Education school district aid ratio calculations from 2005 to 2006, prior to the onset of drilling in the Marcellus shale.
4. K. Schafft, L. Glenna, Y. Borlu, and B. Greene, Marcellus Educa-tion Fact Sheet: Marcellus Shale Gas Development—What Does It Mean for Pennsylvania Schools? (University Park: Penn State Co-operative Extension, 2012).
5. Ibid.; J. Williamson and B. Kolb, Marcellus Natural Gas Devel-opment’s Effects on Housing in Pennsylvania (Williamsport, Pa.: Center for the Study of Commu-nity and the Economy, 2011).
ReferencesBureau of Oil and Gas Management. “Marcellus Wells Drilled 2007 to 2010.” Harrisburg: Pennsylvania Department of Environmental Pro-tection, 2011.
Governor’s Center for Local Government Services. Taxation Manual. Harrisburg: Pennsylvania Department of Community and Economic Development, 2004.
Pennsylvania Department of Education.“Act 1/Act 511/First Class SD Taxes, 2007–2008.” Har-risburg: Pennsylvania Department of Education, 2009.
———. “Act 1/Act 511/First Class SD Taxes, 2009–2010.” Harrisburg: Pennsylvania Department of Educa-tion, 2011.
———.“Expenditure Data for all LEAs, 2007–2008.” Harrisburg: Pennsylvania Department of Educa-tion, 2009.
———.“Expenditure Data for all LEAs, 2009–2010.” Harrisburg: Pennsylvania Department of Educa-tion, 2011.
———.“Revenue Data for all LEAs, 2007–2008.” Harrisburg: Pennsylva-nia Department of Education, 2009.
———.“Revenue Data for all LEAs, 2009–2010.” Harrisburg: Pennsylva-nia Department of Education, 2011.
Pennsylvania Department of Rev-enue. “Personal Income Statistics,” for 2007, 2008, and 2009. Harris-burg: Pennsylvania Department of Revenue.
Schafft, K., L. Glenna, Y. Borlu, and B. Greene. Marcellus Education Fact Sheet: Marcellus Shale Gas Development—What Does It Mean for Pennsylvania Schools? Univer-sity Park: Penn State Cooperative Extension, 2012.
Williamson, J., and B. Kolb. Marcel-lus Natural Gas Development’s Ef-fects on Housing in Pennsylvania. Williamsport, Pa.: Center for the Study of Community and the Econ-omy, 2011.
Prepared by Timothy W. Kelsey, professor of agricultural economics; William Hartman, professor of edu-cation; Kai A. Schafft, associate pro-fessor of education; Yetkin Borlu, graduate student in rural sociology; and Charles Costanzo, undergradu-ate student in community, environ-ment, and development.
Penn State College of Agricultural Sciences research and extension programs are funded in part by Pennsylvania counties, the Commonwealth of Pennsylvania, and the U.S. Department of Agriculture.
Visit Penn State Extension on the web: extension.psu.edu
This publication is available from the Publications Distribution Center, The Pennsylvania State University, 112 Agricultural Administration Building, University Park, PA 16802. For information, telephone 814-865-6713.
This publication is available in alternative media on request.
Penn State is committed to affirmative action, equal opportunity, and the diversity of its workforce.
Produced by Ag Communications and Marketing
© The Pennsylvania State University 2012
CODE# EE0022 2M3/12mpc 4937
Put Our Experience to Work for Your CommunityThe Penn State Extension Marcellus Edu-cation Team strives to bring you accurate, up-to-date information on natural gas ex-ploration and drilling in Pennsylvania. Learn about your rights and choices as a land-owner, a businessperson, a local official, or a concerned citizen. Discover the resources available to you.
Visit naturalgas.psu.edu.
Penn State ExtensionPenn State Extension has a special mission—to enable individuals, families, communities, agri-culture, businesses, industries, and organizations to make informed decisions. Through a system of county-based offices, we extend technical ex-pertise and practical, how-to education based on land-grant university research to help Pennsylva-nians address important issues, solve problems, and create a better quality of life. From improving agriculture and building stronger communities, to developing skills with today’s youth, we are dedicated to giving Pennsylvanians the means to grow, achieve, compete, go farther, and do more. Learn what extension can do for you. Contact your local extension office or visit extension.psu.edu.
The Agricultural Law Resource and Reference CenterThe Agricultural Law Resource and Reference Center is a collaboration between Penn State’s Dickinson School of Law and Penn State’s Col-lege of Agricultural Sciences. Located at both the University Park and Carlisle facilities and funded in part by the Pennsylvania Department of Agriculture, the center is designed to provide the highest-quality educational programs, informa-tion, and materials to those involved or interested in agricultural law and policy.