Embed Size (px)
Citation preview
CONSISTENT COMPOUNDERS
Private & Confidential. 1
AN INVESTMENT STRATEGY BY
MARCELLUS INVESTMENT MANAGERS
2
Private & Confidential. ABOUT MARCELLUS
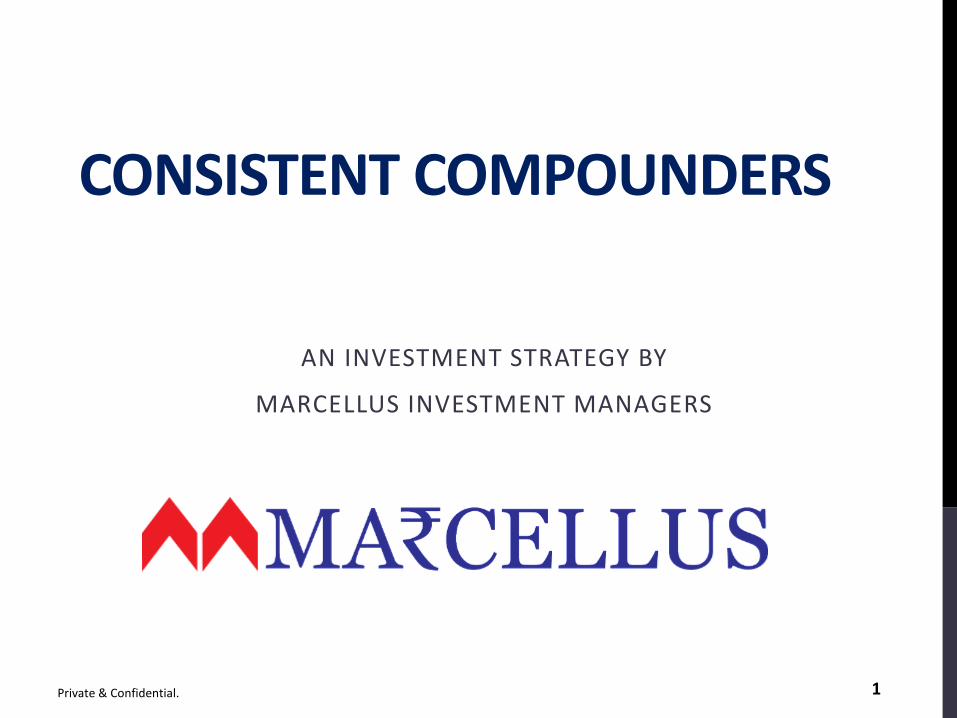
Rakshit Ranjan, CFA – Portfolio
Manager
- Formerly, Portfolio manager of
Ambit Capital's Coffee Can PMS,
which was one of India's top
performing equity products
during 2018
- Ambit's consumer research
head, voted as No.1 for
Discretionary Consumer and
top-3 for Consumer Staples
- At Clear Capital, ranked amongst
the top-3 UK Insurance analysts
- B.Tech from IIT (Delhi)
Pramod Gubbi, CFA - Head of Sales
- Formerly, MD & Head of Institutional
Equities at Ambit Capital
- CEO of Ambit Singapore
- Tech analyst at Clear Capital and also
worked in the tech industry - HCL
Technologies and Philips
Semiconductors
- Post-graduate in Management from
IIM – Ahmedabad.
- B.Tech from Regional Engineering
College, Surathkal (NIT, Karnataka)
Saurabh Mukherjea, CFA – ChiefInvestment Officer
- former CEO of Ambit Capital, assetsunder advisory were $800mn.
- Author of three bestselling books:Gurus of Chaos (2014), The UnusualBillionaires (2016) and “Coffee CanInvesting (2018).
- Co-founder of Clear Capital, a Londonbased small-cap equity research firmwhich he and his co-founders created in2003 and sold in 2008.
- MSc in Economics from London Schoolof Economics
- Member of SEBI’s Asset ManagementAdvisory Committee.
Marcellus Investment Managers was founded in 2018 and currently has c.US$950m in assets under management and advisory. The founders have worked together for the past 15years
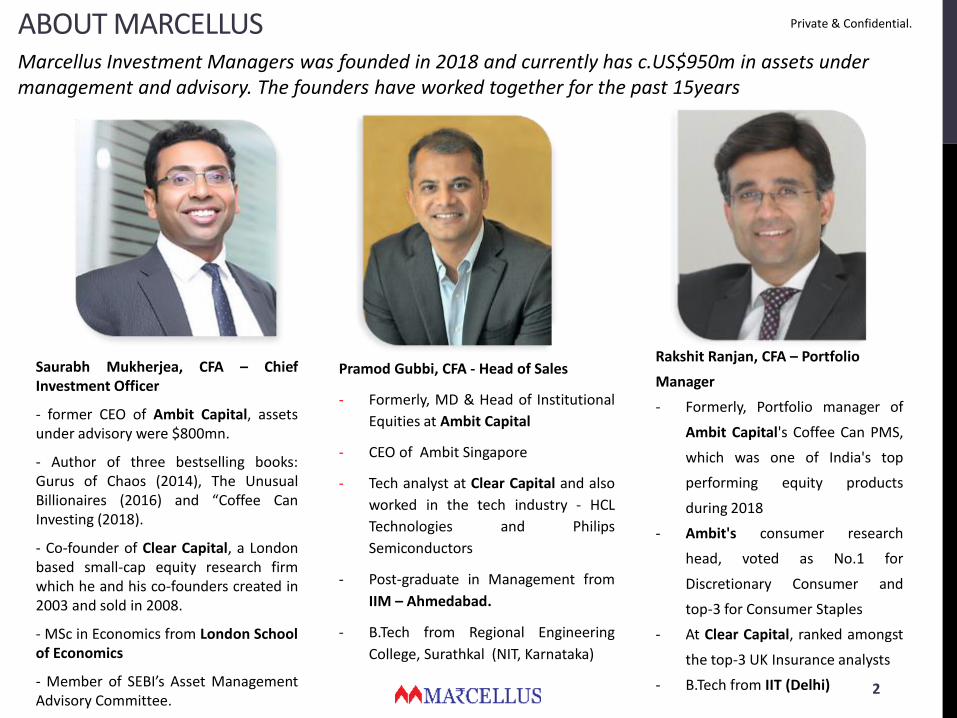
KEY STEPS FOR IDENTIFYING CONSISTENT COMPOUNDERS
Private & Confidential. 3
1. Identify companies with clean accounts
2. Identify companies with track record of superior
capital allocation
3. Amongst companies which pass steps 1 & 2,
identify those with high barriers to entry
STEP 1: IDENTIFY COMPANIES WITH CLEAN ACCOUNTING
Private & Confidential. 4
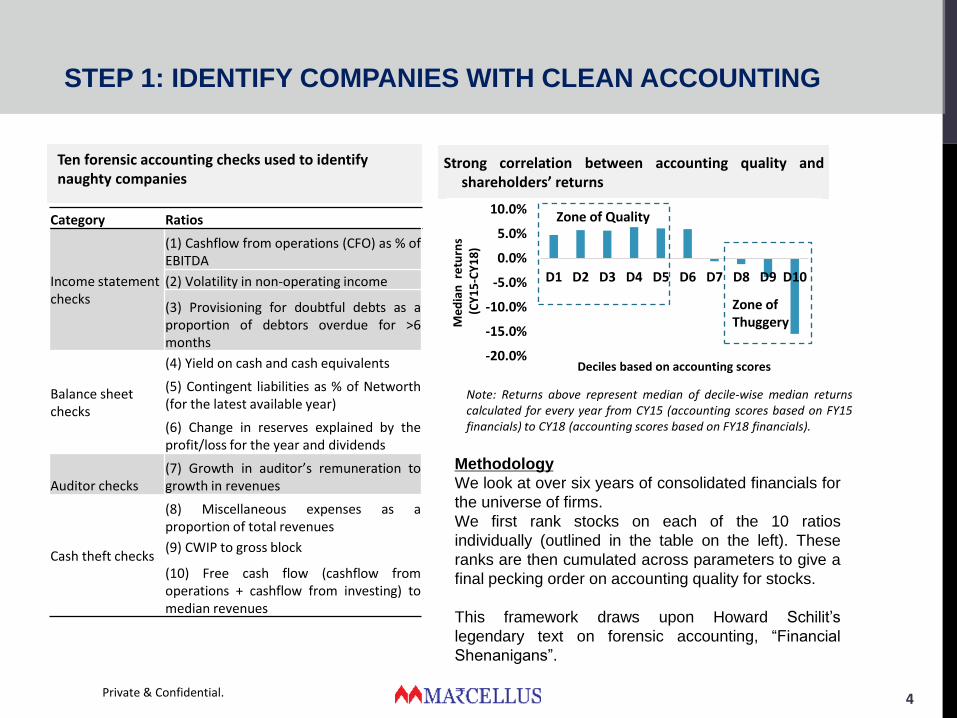
Strong correlation between accounting quality andshareholders’ returns
Ten forensic accounting checks used to identify naughty companies
Methodology
We look at over six years of consolidated financials for
the universe of firms.
We first rank stocks on each of the 10 ratios
individually (outlined in the table on the left). These
ranks are then cumulated across parameters to give a
final pecking order on accounting quality for stocks.
This framework draws upon Howard Schilit’s
legendary text on forensic accounting, “Financial
Shenanigans”.
Note: Returns above represent median of decile-wise median returnscalculated for every year from CY15 (accounting scores based on FY15financials) to CY18 (accounting scores based on FY18 financials).
Category Ratios
Income statement checks
(1) Cashflow from operations (CFO) as % ofEBITDA
(2) Volatility in non-operating income
(3) Provisioning for doubtful debts as aproportion of debtors overdue for >6months
Balance sheet checks
(4) Yield on cash and cash equivalents
(5) Contingent liabilities as % of Networth(for the latest available year)
(6) Change in reserves explained by theprofit/loss for the year and dividends
Auditor checks(7) Growth in auditor’s remuneration togrowth in revenues
Cash theft checks
(8) Miscellaneous expenses as aproportion of total revenues
(9) CWIP to gross block
(10) Free cash flow (cashflow fromoperations + cashflow from investing) tomedian revenues
-20.0%
-15.0%
-10.0%
-5.0%
0.0%
5.0%
10.0%
D1 D2 D3 D4 D5 D6 D7 D8 D9 D10
Me
dia
n r
etu
rns
(CY
15
-CY
18
)
Deciles based on accounting scores
Zone of Thuggery
Zone of Quality
STEP 2: IDENTIFY COMPANIES WITH SUPERIOR CAPITAL
ALLOCATION
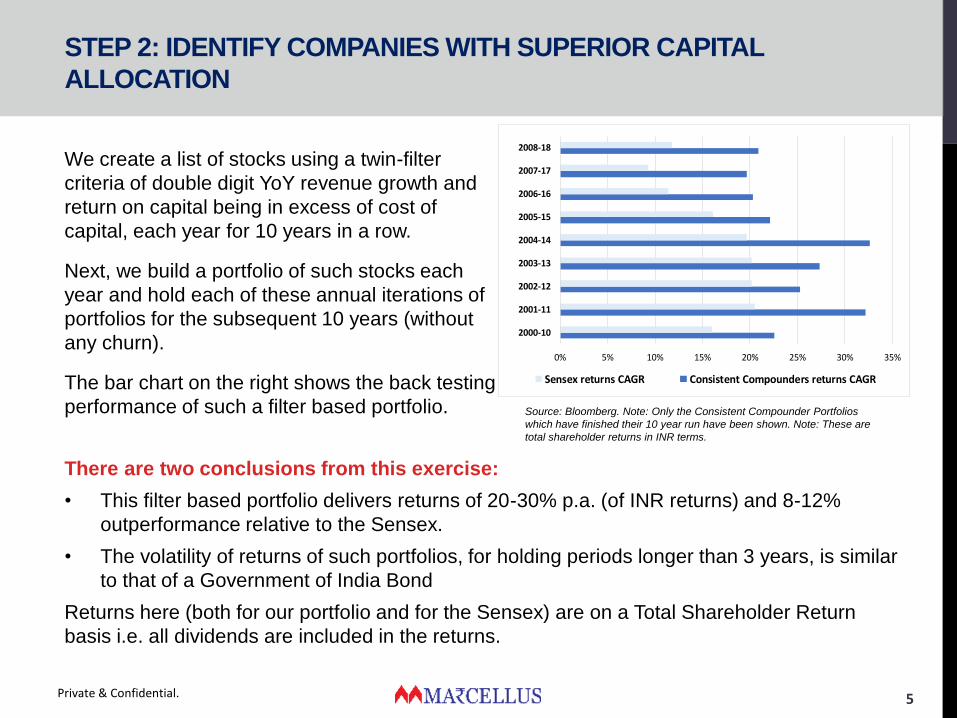
We create a list of stocks using a twin-filter
criteria of double digit YoY revenue growth and
return on capital being in excess of cost of
capital, each year for 10 years in a row.
Next, we build a portfolio of such stocks each
year and hold each of these annual iterations of
portfolios for the subsequent 10 years (without
any churn).
The bar chart on the right shows the back testing
performance of such a filter based portfolio.
Private & Confidential. 5
0% 5% 10% 15% 20% 25% 30% 35%
2000-10
2001-11
2002-12
2003-13
2004-14
2005-15
2006-16
2007-17
2008-18
Sensex returns CAGR Consistent Compounders returns CAGR
Source: Bloomberg. Note: Only the Consistent Compounder Portfolios
which have finished their 10 year run have been shown. Note: These are
total shareholder returns in INR terms.
There are two conclusions from this exercise:
• This filter based portfolio delivers returns of 20-30% p.a. (of INR returns) and 8-12%
outperformance relative to the Sensex.
• The volatility of returns of such portfolios, for holding periods longer than 3 years, is similar
to that of a Government of India Bond
Returns here (both for our portfolio and for the Sensex) are on a Total Shareholder Return
basis i.e. all dividends are included in the returns.
STEP 3: IDENTIFY COMPANIES WITH HIGH BARRIERS TO
ENTRY
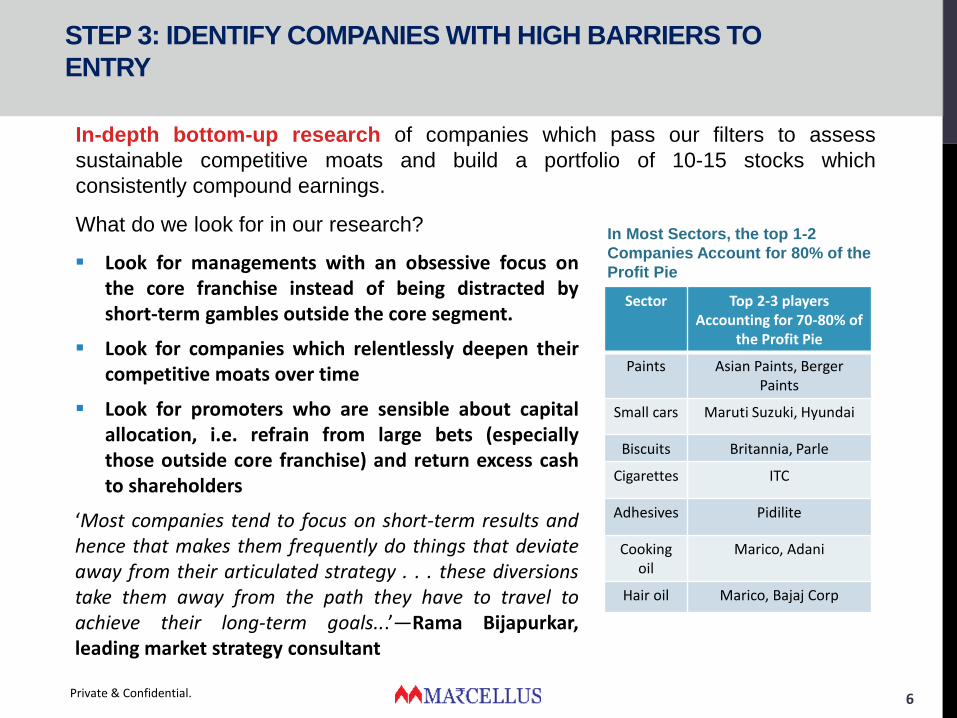
In-depth bottom-up research of companies which pass our filters to assess
sustainable competitive moats and build a portfolio of 10-15 stocks which
consistently compound earnings.
What do we look for in our research?
Private & Confidential. 6
In Most Sectors, the top 1-2
Companies Account for 80% of the
Profit Pie
Sector Top 2-3 players Accounting for 70-80% of
the Profit Pie
Paints Asian Paints, Berger Paints
Small cars Maruti Suzuki, Hyundai
Biscuits Britannia, Parle
Cigarettes ITC
Adhesives Pidilite
Cooking oil
Marico, Adani
Hair oil Marico, Bajaj Corp
▪ Look for managements with an obsessive focus onthe core franchise instead of being distracted byshort-term gambles outside the core segment.
▪ Look for companies which relentlessly deepen theircompetitive moats over time
▪ Look for promoters who are sensible about capitalallocation, i.e. refrain from large bets (especiallythose outside core franchise) and return excess cashto shareholders
‘Most companies tend to focus on short-term results andhence that makes them frequently do things that deviateaway from their articulated strategy . . . these diversionstake them away from the path they have to travel toachieve their long-term goals...’—Rama Bijapurkar,leading market strategy consultant
THE POWER OF A FILTER BASED APPROACH
Unique DNA of these companies: By “filtering in” companies with a history of very
consistent fundamentals over very long time periods, the portfolio is skewed towards
companies with a DNA built around relentlessly deepening their competitive moats
despite disruptive changes taking place both inside as well as outside the organization.
More often than not, such DNA sustains over the subsequent 5-10 years investment
horizon of the filter based approach.
Power of compounding: Holding a portfolio of stocks untouched for 10 years allows the
power of compounding to play out, such that the portfolio becomes dominated by the
winning stocks while losing stocks keep declining to eventually become inconsequential.
Avoiding the pitfalls of psychology and reducing transaction costs: Being patient
with a portfolio helps cut out ‘noise’ of trying to time entry / exit decisions. With no churn,
this filter based approach also reduces transaction costs. Consider two data points: (a) In
a portfolio with 70% churn (average churn of large cap mutual funds), 20bps broking cost
and 30bps impact cost, churn reduces the terminal value of the portfolio (after 10 years)
by 10% (i.e. a drag of 120bps on the 10-year CAGR); and (b) deferring the 10% long
term capital gains tax payable on the portfolio by 10 years enhances the terminal value
of the portfolio by 8% (i.e. 100bps increase in the 10-year CAGR) vs a portfolio where
capital gains are paid each year.
Private & Confidential. 7
CASE STUDY: ASIAN PAINTS
Private & Confidential. 8
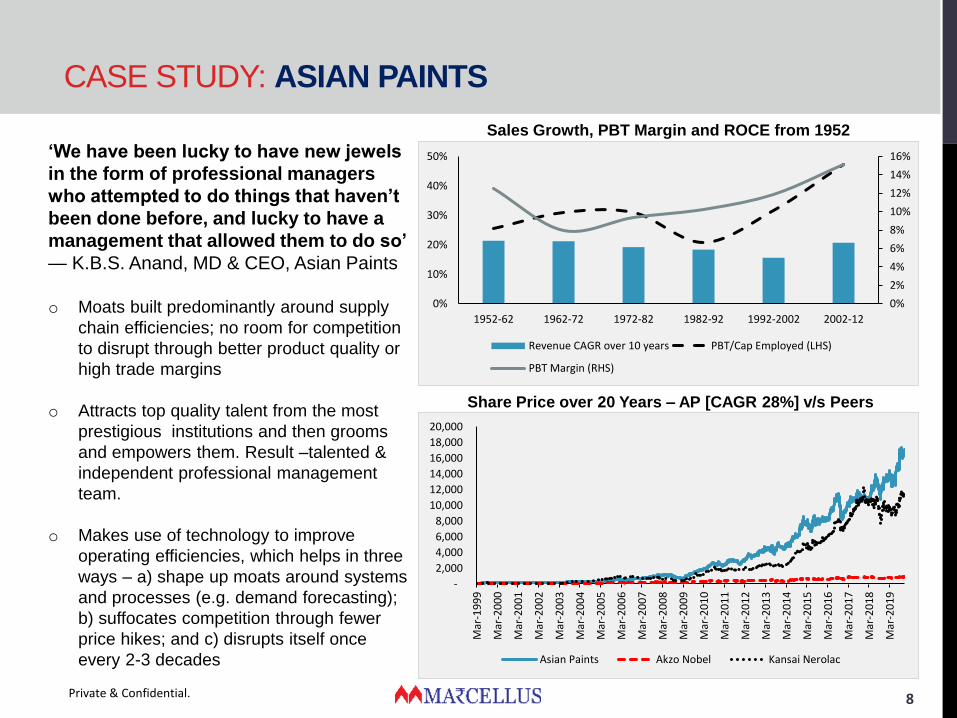
‘We have been lucky to have new jewels
in the form of professional managers
who attempted to do things that haven’t
been done before, and lucky to have a
management that allowed them to do so’
— K.B.S. Anand, MD & CEO, Asian Paints
o Moats built predominantly around supply
chain efficiencies; no room for competition
to disrupt through better product quality or
high trade margins
o Attracts top quality talent from the most
prestigious institutions and then grooms
and empowers them. Result –talented &
independent professional management
team.
o Makes use of technology to improve
operating efficiencies, which helps in three
ways – a) shape up moats around systems
and processes (e.g. demand forecasting);
b) suffocates competition through fewer
price hikes; and c) disrupts itself once
every 2-3 decades
Sales Growth, PBT Margin and ROCE from 1952
0%
2%
4%
6%
8%
10%
12%
14%
16%
0%
10%
20%
30%
40%
50%
1952-62 1962-72 1972-82 1982-92 1992-2002 2002-12
Revenue CAGR over 10 years PBT/Cap Employed (LHS)
PBT Margin (RHS)
Share Price over 20 Years – AP [CAGR 28%] v/s Peers
-
2,000
4,000
6,000
8,000
10,000
12,000
14,000
16,000
18,000
20,000
Mar
-19
99
Mar
-20
00
Mar
-20
01
Mar
-20
02
Mar
-20
03
Mar
-20
04
Mar
-20
05
Mar
-20
06
Mar
-20
07
Mar
-20
08
Mar
-20
09
Mar
-20
10
Mar
-20
11
Mar
-20
12
Mar
-20
13
Mar
-20
14
Mar
-20
15
Mar
-20
16
Mar
-20
17
Mar
-20
18
Mar
-20
19
Asian Paints Akzo Nobel Kansai Nerolac
CASE STUDY: HDFC BANK
Private & Confidential. 9
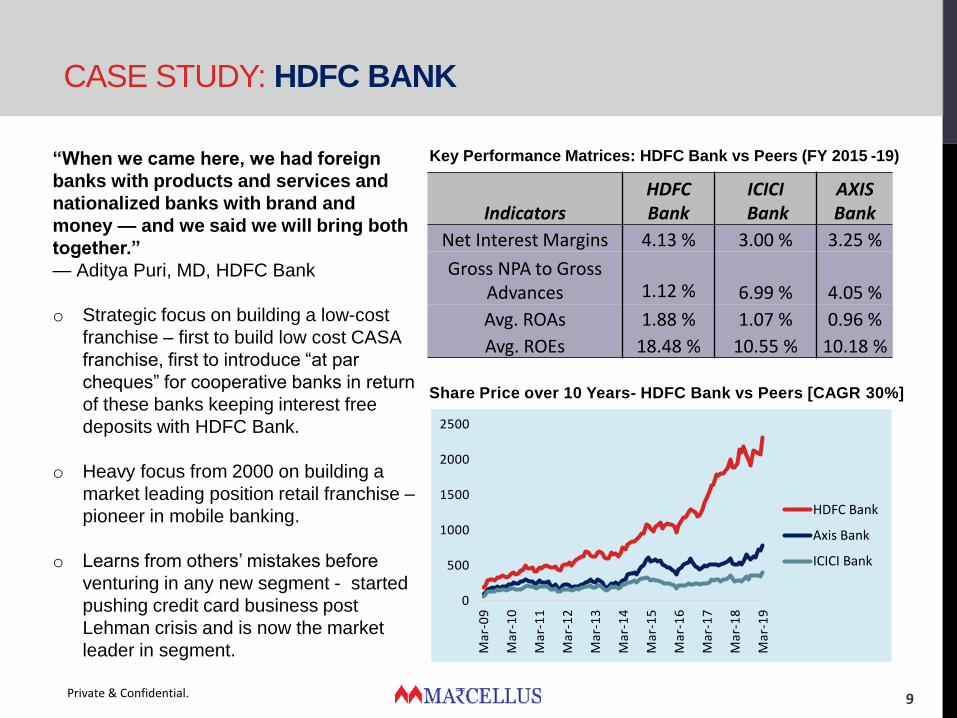
“When we came here, we had foreign
banks with products and services and
nationalized banks with brand and
money — and we said we will bring both
together.”
— Aditya Puri, MD, HDFC Bank
o Strategic focus on building a low-cost
franchise – first to build low cost CASA
franchise, first to introduce “at par
cheques” for cooperative banks in return
of these banks keeping interest free
deposits with HDFC Bank.
o Heavy focus from 2000 on building a
market leading position retail franchise –
pioneer in mobile banking.
o Learns from others’ mistakes before
venturing in any new segment - started
pushing credit card business post
Lehman crisis and is now the market
leader in segment.
IndicatorsHDFC Bank
ICICIBank
AXIS Bank
Net Interest Margins 4.13 % 3.00 % 3.25 %
Gross NPA to Gross Advances 1.12 % 6.99 % 4.05 %
Avg. ROAs 1.88 % 1.07 % 0.96 %
Avg. ROEs 18.48 % 10.55 % 10.18 %
Key Performance Matrices: HDFC Bank vs Peers (FY 2015 -19)
0
500
1000
1500
2000
2500
Mar
-09
Mar
-10
Mar
-11
Mar
-12
Mar
-13
Mar
-14
Mar
-15
Mar
-16
Mar
-17
Mar
-18
Mar
-19
HDFC Bank
Axis Bank
ICICI Bank
Share Price over 10 Years- HDFC Bank vs Peers [CAGR 30%]
FUND PERFORMANCE (AS ON 31ST MAR’2021)
Private & Confidential. 10
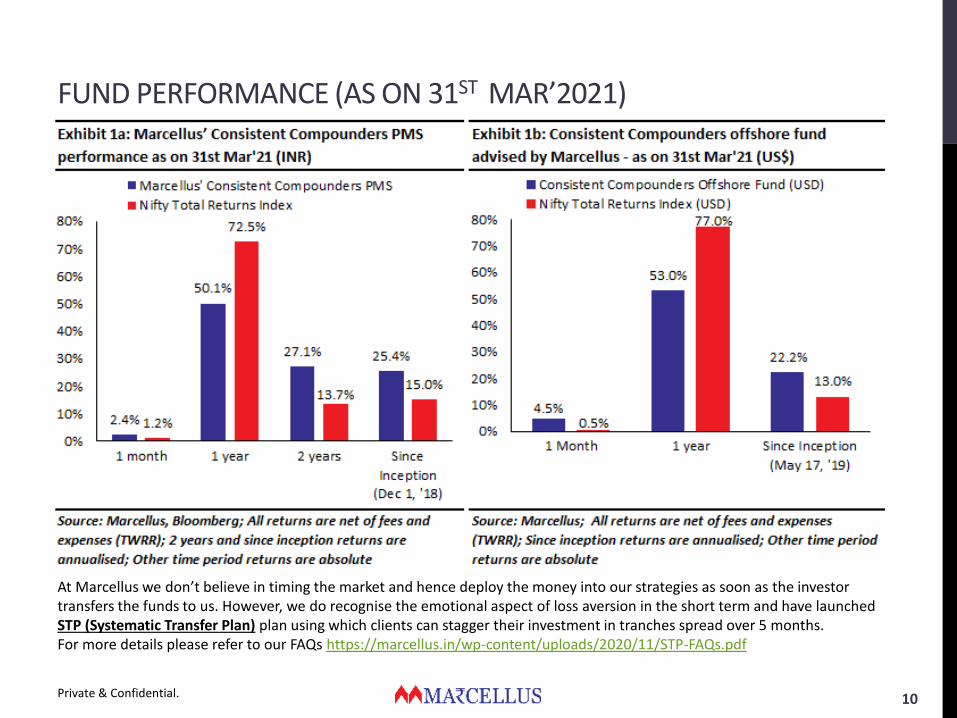
At Marcellus we don’t believe in timing the market and hence deploy the money into our strategies as soon as the investor transfers the funds to us. However, we do recognise the emotional aspect of loss aversion in the short term and have launchedSTP (Systematic Transfer Plan) plan using which clients can stagger their investment in tranches spread over 5 months. For more details please refer to our FAQs https://marcellus.in/wp-content/uploads/2020/11/STP-FAQs.pdf
FUND STRUCTURE
11
Marcellus offers Consistent Compounders Portfolio with a zero fixed fees option
The Consistent Compounders PMS comes with ZERO entry load/exit load and with no lock-in. Our clients can
choose any of the following fee structures:
1. a fixed fees model (2% p.a. fixed fees + zero performance fees) or
2. a variable fees model (zero fixed fees + performance fees of 20% profit share above a hurdle of 8%, no catch-
up)*
3. a hybrid model (1% p.a. fixed fees + performance fees of 15% profit share above a hurdle of 12%, no catch-up).
High water mark applies for performance fees
Minimum investment: INR 50 lacs
***Clients also have the option to be onboarded directly (Direct Fee Code).
Marcellus is delighted to offer its clients a Systematic Investment Plan (SIP). Investors now have the option to save and invest regularly
in Marcellus Funds. For more details please read our FAQs https://marcellus.helpscoutdocs.com/article/100-systematic-investment-plan-
sip-faqs
At Marcellus we don’t believe in timing the market and hence deploy the money into our strategies as soon as the investor transfers the
funds to us. However, we do recognise the emotional aspect of loss aversion in the short term and have launched STP (Systematic
Transfer Plan) plan using which clients can stagger their investment in tranches spread over 5 months. For more details please refer to
our FAQs https://marcellus.helpscoutdocs.com/article/96-stp
Private & Confidential.
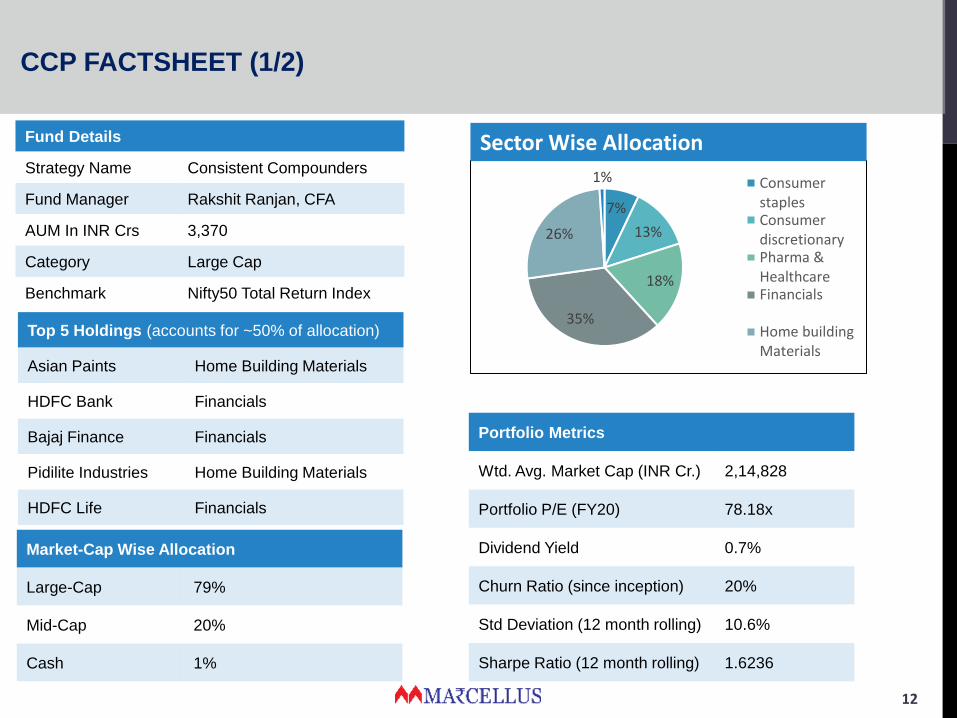
CCP FACTSHEET (1/2)
12
Top 5 Holdings (accounts for ~50% of allocation)
Asian Paints Home Building Materials
HDFC Bank Financials
Bajaj Finance Financials
Pidilite Industries Home Building Materials
HDFC Life Financials
Market-Cap Wise Allocation
Large-Cap 79%
Mid-Cap 20%
Cash 1%
7%
13%
18%
35%
26%
1% ConsumerstaplesConsumerdiscretionaryPharma &HealthcareFinancials
Home buildingMaterials
Sector Wise Allocation
Portfolio Metrics
Wtd. Avg. Market Cap (INR Cr.) 2,14,828
Portfolio P/E (FY20) 78.18x
Dividend Yield 0.7%
Churn Ratio (since inception) 20%
Std Deviation (12 month rolling) 10.6%
Sharpe Ratio (12 month rolling) 1.6236
Fund Details
Strategy Name Consistent Compounders
Fund Manager Rakshit Ranjan, CFA
AUM In INR Crs 3,370
Category Large Cap
Benchmark Nifty50 Total Return Index
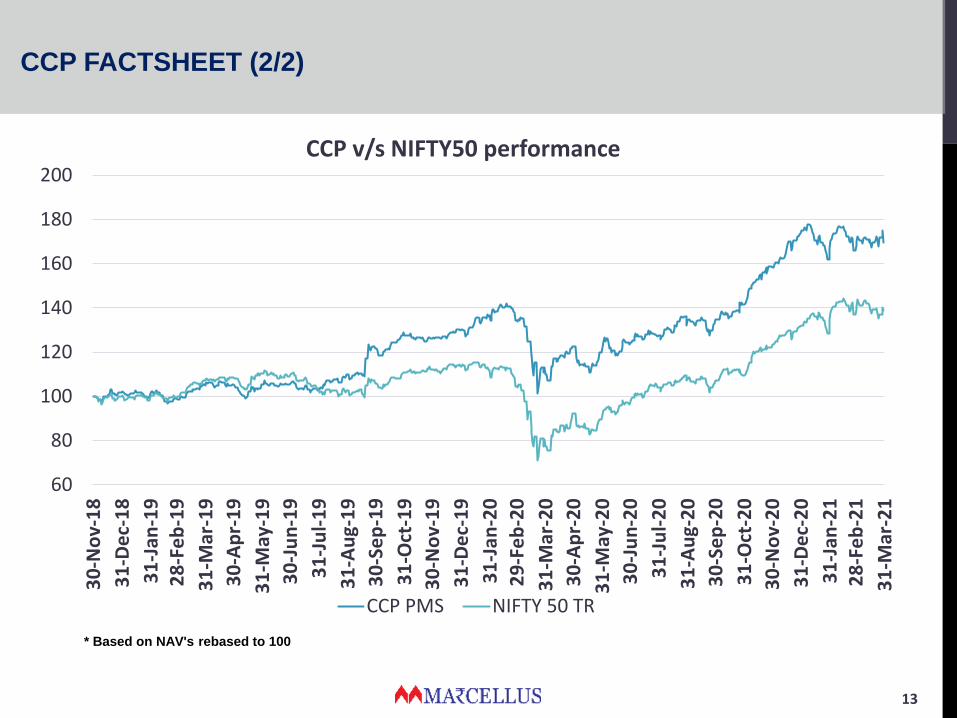
CCP FACTSHEET (2/2)
13
* Based on NAV's rebased to 100
60
80
100
120
140
160
180
200
30
-No
v-1
8
31
-De
c-1
8
31
-Jan
-19
28
-Fe
b-1
9
31
-Mar
-19
30
-Ap
r-1
9
31
-May
-19
30
-Ju
n-1
9
31
-Ju
l-1
9
31
-Au
g-1
9
30
-Se
p-1
9
31
-Oct
-19
30
-No
v-1
9
31
-De
c-1
9
31
-Jan
-20
29
-Fe
b-2
0
31
-Mar
-20
30
-Ap
r-2
0
31
-May
-20
30
-Ju
n-2
0
31
-Ju
l-2
0
31
-Au
g-2
0
30
-Se
p-2
0
31
-Oct
-20
30
-No
v-2
0
31
-De
c-2
0
31
-Jan
-21
28
-Fe
b-2
1
31
-Mar
-21
CCP v/s NIFTY50 performance
CCP PMS NIFTY 50 TR
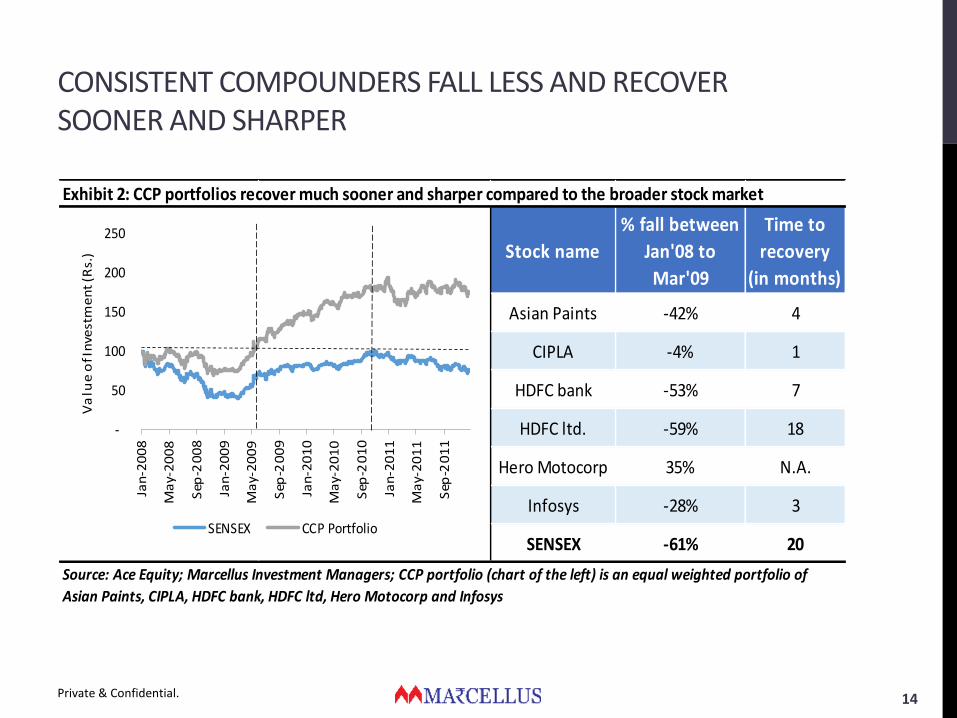
CONSISTENT COMPOUNDERS FALL LESS AND RECOVER SOONER AND SHARPER
Private & Confidential. 14
Stock name
% fall between
Jan'08 to
Mar'09
Time to
recovery
(in months)
Asian Paints -42% 4
CIPLA -4% 1
HDFC bank -53% 7
HDFC ltd. -59% 18
Hero Motocorp 35% N.A.
Infosys -28% 3
SENSEX -61% 20
Source: Ace Equity; Marcellus Investment Managers; CCP portfolio (chart of the left) is an equal weighted portfolio of
Asian Paints, CIPLA, HDFC bank, HDFC ltd, Hero Motocorp and Infosys
Exhibit 2: CCP portfolios recover much sooner and sharper compared to the broader stock market
-
50
100
150
200
250
Jan
-20
08
Ma
y-2
00
8
Sep
-20
08
Jan
-20
09
Ma
y-2
00
9
Sep
-20
09
Jan
-20
10
Ma
y-2
01
0
Sep
-20
10
Jan
-20
11
Ma
y-2
01
1
Sep
-20
11
Va
lue
of I
nve
stm
en
t (R
s.)
SENSEX CCP Portfolio
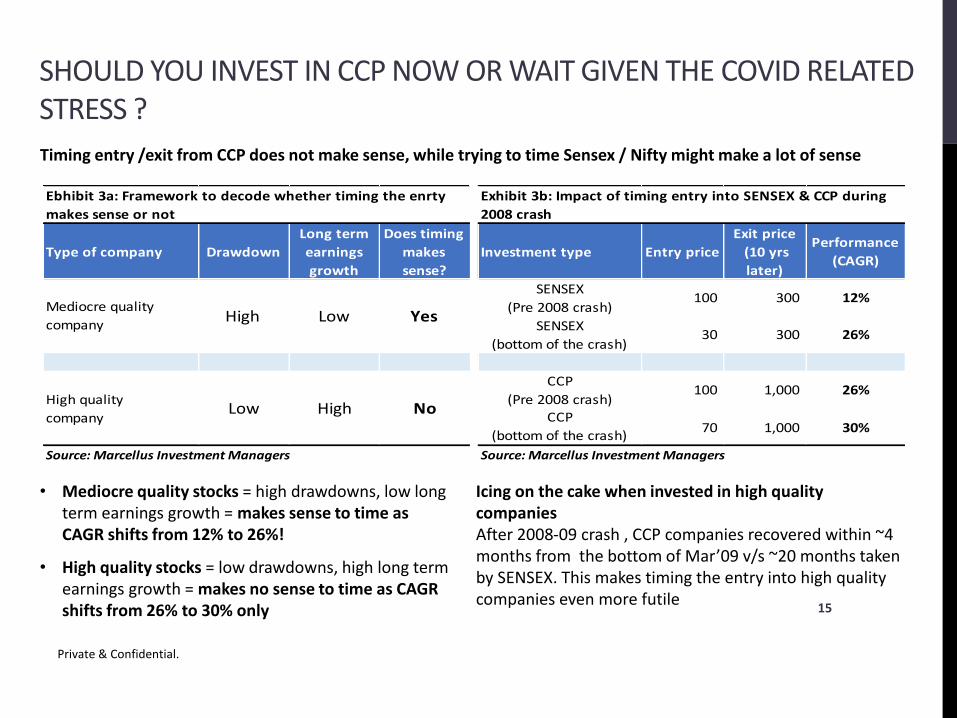
SHOULD YOU INVEST IN CCP NOW OR WAIT GIVEN THE COVID RELATED STRESS ?
Private & Confidential.
15
Timing entry /exit from CCP does not make sense, while trying to time Sensex / Nifty might make a lot of sense
• Mediocre quality stocks = high drawdowns, low long term earnings growth = makes sense to time as CAGR shifts from 12% to 26%!
• High quality stocks = low drawdowns, high long term earnings growth = makes no sense to time as CAGR shifts from 26% to 30% only
Icing on the cake when invested in high quality companiesAfter 2008-09 crash , CCP companies recovered within ~4 months from the bottom of Mar’09 v/s ~20 months taken by SENSEX. This makes timing the entry into high quality companies even more futile
Type of company Drawdown
Long term
earnings
growth
Does timing
makes
sense?
Investment type Entry price
Exit price
(10 yrs
later)
Performance
(CAGR)
SENSEX
(Pre 2008 crash)100 300 12%
SENSEX
(bottom of the crash)30 300 26%
CCP
(Pre 2008 crash) 100 1,000 26%
CCP
(bottom of the crash)70 1,000 30%
Yes
High quality
companyLow High No
Ebhibit 3a: Framework to decode whether timing the enrty
makes sense or not
Exhibit 3b: Impact of timing entry into SENSEX & CCP during
2008 crash
Source: Marcellus Investment Managers Source: Marcellus Investment Managers
Mediocre quality
company High Low
“….a simple strategy is easy for people to follow. When you deviate from the strategy, the in-built simplicity itself ensures that the deviation is spotted early, course corrected, after which the team gets back on track.”*
*Source: ‘The Victory Project: Six Steps to Peak Potential’
16
THE TRILOGY IS COMPLETE
MORE RESOURCES
17Private & Confidential.
Marcellus Investment Managers Pvt Ltd
http://marcellus.in/
Our newsletters are available on:
http://marcellus.in/newsletters/
Our research is available on:
http://marcellus.in/resources/
Marcellus Sales: [email protected]
ANNEXUREPORTFOLIO FUNDAMENTALS
Private & Confidential. 18
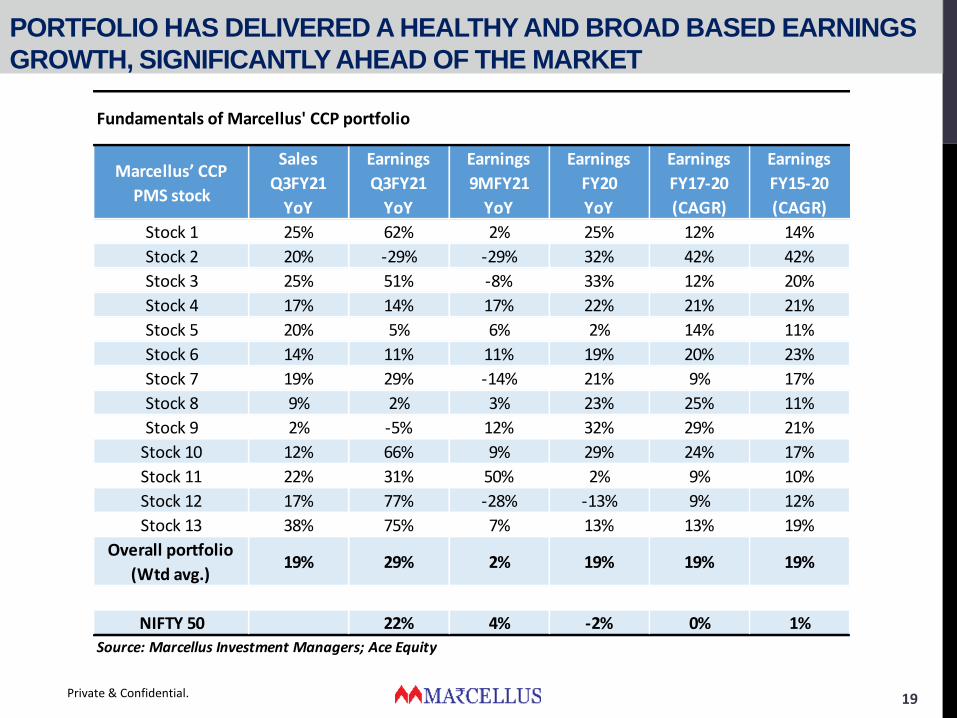
PORTFOLIO HAS DELIVERED A HEALTHY AND BROAD BASED EARNINGS
GROWTH, SIGNIFICANTLY AHEAD OF THE MARKET
Private & Confidential. 19
Marcellus’ CCP
PMS stock
Sales
Q3FY21
YoY
Earnings
Q3FY21
YoY
Earnings
9MFY21
YoY
Earnings
FY20
YoY
Earnings
FY17-20
(CAGR)
Earnings
FY15-20
(CAGR)
Stock 1 25% 62% 2% 25% 12% 14%
Stock 2 20% -29% -29% 32% 42% 42%
Stock 3 25% 51% -8% 33% 12% 20%
Stock 4 17% 14% 17% 22% 21% 21%
Stock 5 20% 5% 6% 2% 14% 11%
Stock 6 14% 11% 11% 19% 20% 23%
Stock 7 19% 29% -14% 21% 9% 17%
Stock 8 9% 2% 3% 23% 25% 11%
Stock 9 2% -5% 12% 32% 29% 21%
Stock 10 12% 66% 9% 29% 24% 17%
Stock 11 22% 31% 50% 2% 9% 10%
Stock 12 17% 77% -28% -13% 9% 12%
Stock 13 38% 75% 7% 13% 13% 19%
Overall portfolio
(Wtd avg.)19% 29% 2% 19% 19% 19%
NIFTY 50 22% 4% -2% 0% 1%
Fundamentals of Marcellus' CCP portfolio
Source: Marcellus Investment Managers; Ace Equity
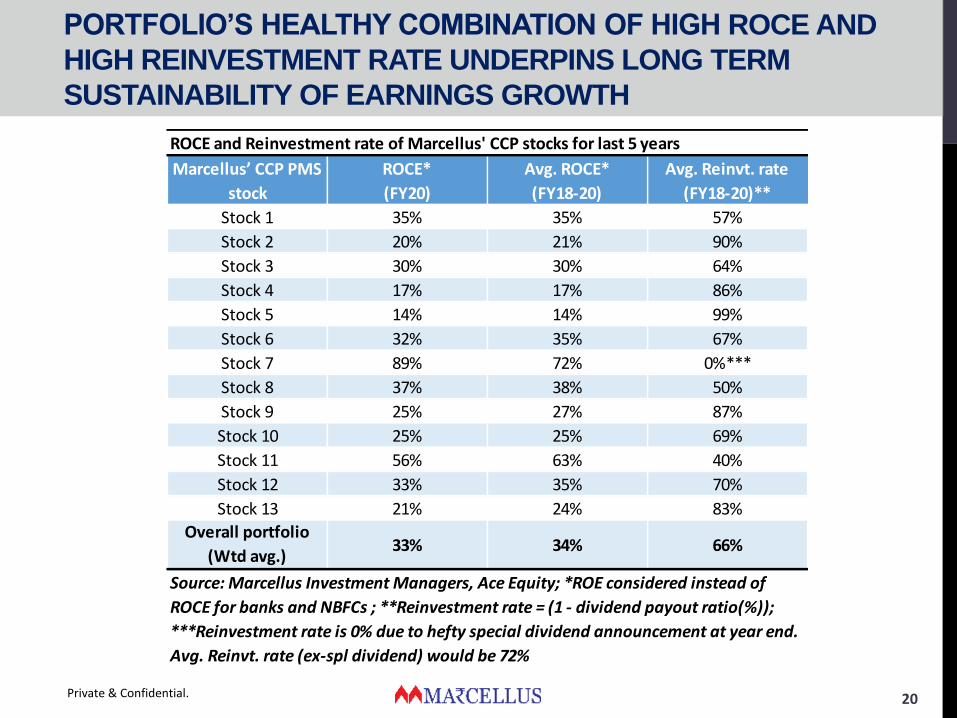
PORTFOLIO’S HEALTHY COMBINATION OF HIGH ROCE AND
HIGH REINVESTMENT RATE UNDERPINS LONG TERM
SUSTAINABILITY OF EARNINGS GROWTH
Private & Confidential. 20
Marcellus’ CCP PMS
stock
ROCE*
(FY20)
Avg. ROCE*
(FY18-20)
Avg. Reinvt. rate
(FY18-20)**
Stock 1 35% 35% 57%
Stock 2 20% 21% 90%
Stock 3 30% 30% 64%
Stock 4 17% 17% 86%
Stock 5 14% 14% 99%
Stock 6 32% 35% 67%
Stock 7 89% 72% 0%***
Stock 8 37% 38% 50%
Stock 9 25% 27% 87%
Stock 10 25% 25% 69%
Stock 11 56% 63% 40%
Stock 12 33% 35% 70%
Stock 13 21% 24% 83%
Overall portfolio
(Wtd avg.)33% 34% 66%
ROCE and Reinvestment rate of Marcellus' CCP stocks for last 5 years
Source: Marcellus Investment Managers, Ace Equity; *ROE considered instead of
ROCE for banks and NBFCs ; **Reinvestment rate = (1 - dividend payout ratio(%));
***Reinvestment rate is 0% due to hefty special dividend announcement at year end.
Avg. Reinvt. rate (ex-spl dividend) would be 72%
Private & Confidential. 21
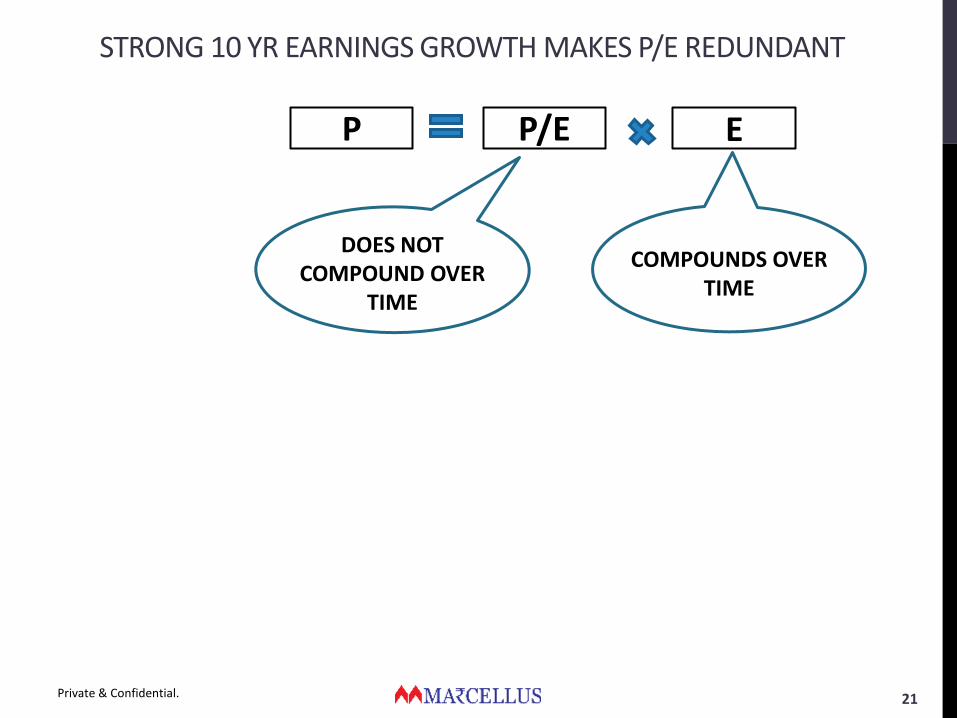
STRONG 10 YR EARNINGS GROWTH MAKES P/E REDUNDANT
P/E EP
DOES NOT COMPOUND OVER
TIME
COMPOUNDS OVER TIME
Private & Confidential. 22
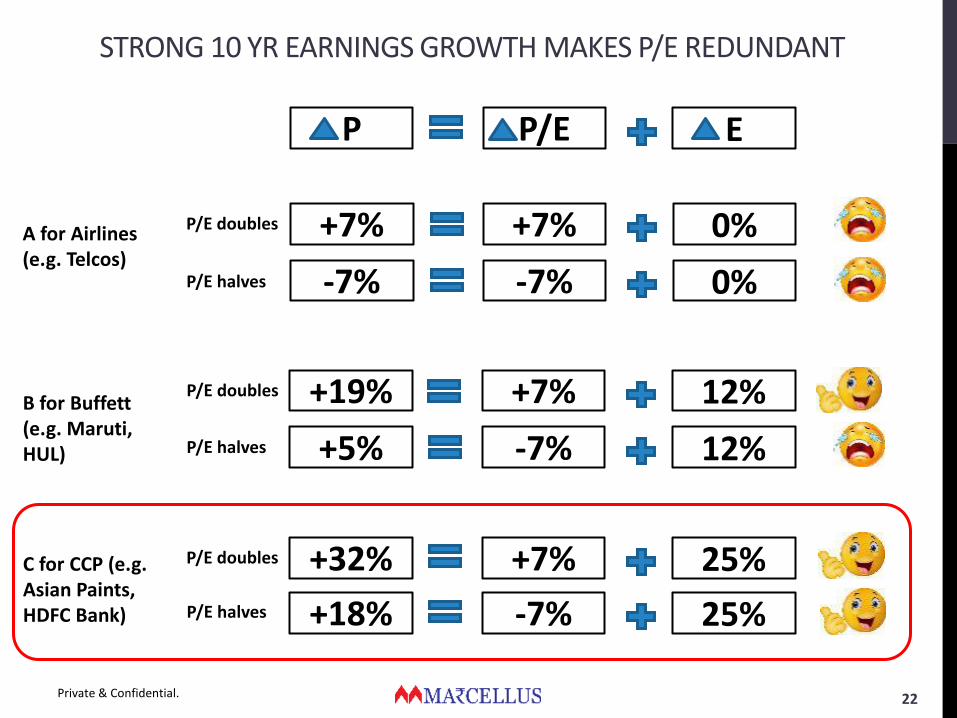
STRONG 10 YR EARNINGS GROWTH MAKES P/E REDUNDANT
P/E EP
+7% 0%+7%
-7% 0%-7%
+7% 12%+19%
-7% 12%+5%
+7% 25%+32%
-7% 25%+18%
P/E doubles
P/E doubles
P/E doubles
P/E halves
P/E halves
P/E halves
A for Airlines (e.g. Telcos)
B for Buffett (e.g. Maruti, HUL)
C for CCP (e.g. Asian Paints, HDFC Bank)
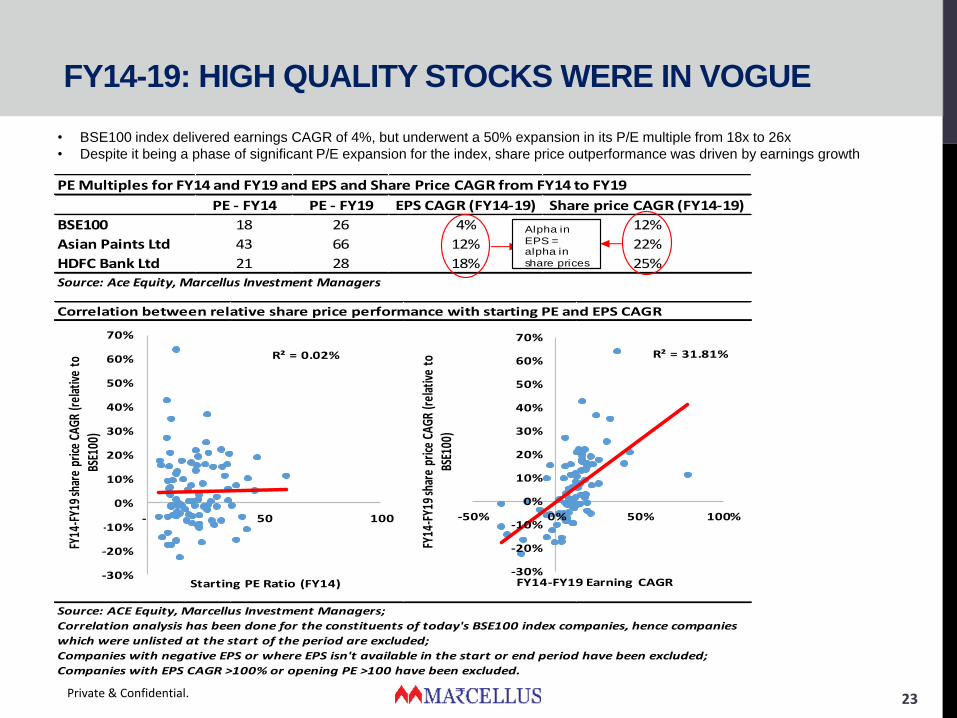
FY14-19: HIGH QUALITY STOCKS WERE IN VOGUE
Private & Confidential. 23
• BSE100 index delivered earnings CAGR of 4%, but underwent a 50% expansion in its P/E multiple from 18x to 26x
• Despite it being a phase of significant P/E expansion for the index, share price outperformance was driven by earnings growth
PE - FY14 PE - FY19 EPS CAGR (FY14-19) Share price CAGR (FY14-19)
BSE100 18 26 4% 12%
Asian Paints Ltd 43 66 12% 22%
HDFC Bank Ltd 21 28 18% 25%
PE Multiples for FY14 and FY19 and EPS and Share Price CAGR from FY14 to FY19
Source: Ace Equity, Marcellus Investment Managers
Alpha in
EPS = alpha in
share prices
Correlation between relative share price performance with starting PE and EPS CAGR
Source: ACE Equity, Marcellus Investment Managers;
Correlation analysis has been done for the constituents of today's BSE100 index companies, hence companies
which were unlisted at the start of the period are excluded;
Companies with negative EPS or where EPS isn't available in the start or end period have been excluded;
Companies with EPS CAGR >100% or opening PE >100 have been excluded.
R² = 0.02%
-30%
-20%
-10%
0%
10%
20%
30%
40%
50%
60%
70%
- 50 100
FY14
-FY1
9 sh
are
price
CAG
R (r
elat
ive
to
BSE1
00)
Starting PE Ratio (FY14)
R² = 31.81%
-30%
-20%
-10%
0%
10%
20%
30%
40%
50%
60%
70%
-50% 0% 50% 100%
FY14
-FY1
9 sh
are
price
CAG
R (r
elat
ive
to
BSE1
00)
FY14-FY19 Earning CAGR
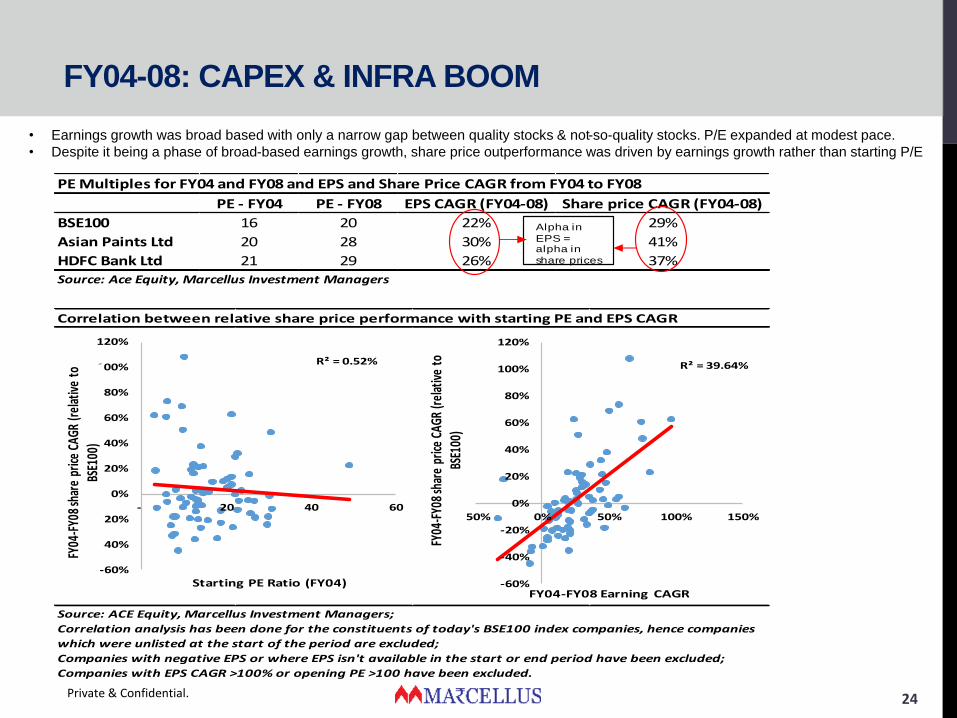
FY04-08: CAPEX & INFRA BOOM
Private & Confidential. 24
• Earnings growth was broad based with only a narrow gap between quality stocks & not-so-quality stocks. P/E expanded at modest pace.
• Despite it being a phase of broad-based earnings growth, share price outperformance was driven by earnings growth rather than starting P/E
PE - FY04 PE - FY08 EPS CAGR (FY04-08) Share price CAGR (FY04-08)
BSE100 16 20 22% 29%
Asian Paints Ltd 20 28 30% 41%
HDFC Bank Ltd 21 29 26% 37%
PE Multiples for FY04 and FY08 and EPS and Share Price CAGR from FY04 to FY08
Source: Ace Equity, Marcellus Investment Managers
Alpha in
EPS = alpha in
share prices
Correlation between relative share price performance with starting PE and EPS CAGR
Source: ACE Equity, Marcellus Investment Managers;
Correlation analysis has been done for the constituents of today's BSE100 index companies, hence companies
which were unlisted at the start of the period are excluded;
Companies with negative EPS or where EPS isn't available in the start or end period have been excluded;
Companies with EPS CAGR >100% or opening PE >100 have been excluded.
R² = 0.52%
-60%
-40%
-20%
0%
20%
40%
60%
80%
100%
120%
- 20 40 60
FY04
-FY0
8 sh
are
price
CAG
R (r
elat
ive
to
BSE1
00)
Starting PE Ratio (FY04)
R² = 39.64%
-60%
-40%
-20%
0%
20%
40%
60%
80%
100%
120%
-50% 0% 50% 100% 150%
FY04
-FY0
8 sh
are
price
CAG
R (r
elat
ive
to
BSE1
00)
FY04-FY08 Earning CAGR
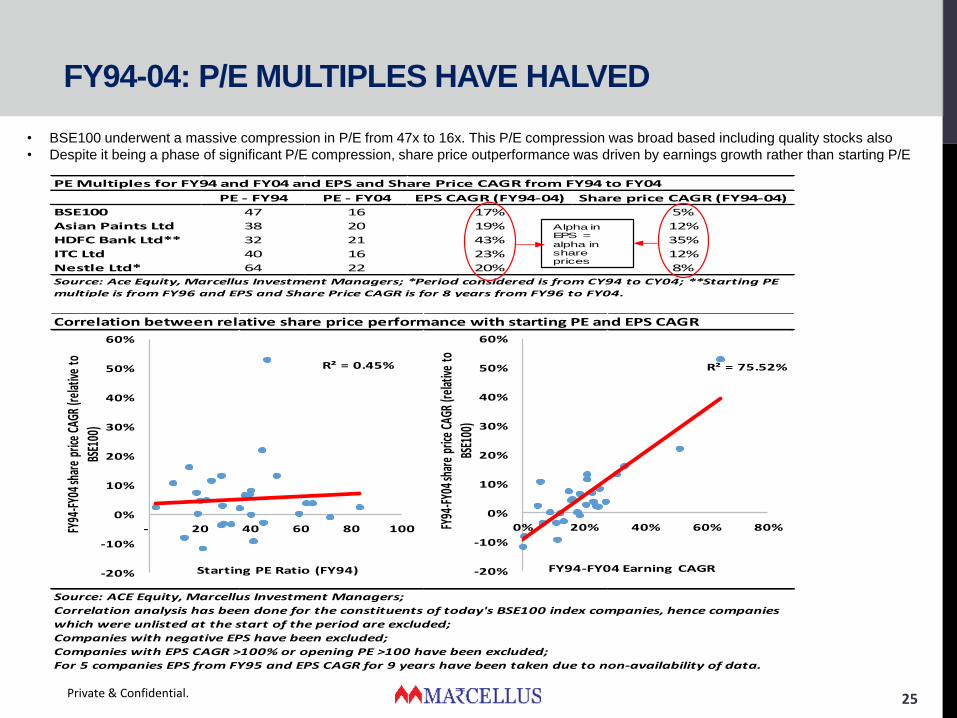
FY94-04: P/E MULTIPLES HAVE HALVED
Private & Confidential. 25
• BSE100 underwent a massive compression in P/E from 47x to 16x. This P/E compression was broad based including quality stocks also
• Despite it being a phase of significant P/E compression, share price outperformance was driven by earnings growth rather than starting P/E
PE - FY94 PE - FY04 EPS CAGR (FY94-04) Share price CAGR (FY94-04)
BSE100 47 16 17% 5%
Asian Paints Ltd 38 20 19% 12%
HDFC Bank Ltd** 32 21 43% 35%
ITC Ltd 40 16 23% 12%
Nestle Ltd* 64 22 20% 8%
PE Multiples for FY94 and FY04 and EPS and Share Price CAGR from FY94 to FY04
Source: Ace Equity, Marcellus Investment Managers; *Period considered is from CY94 to CY04; **Starting PE
multiple is from FY96 and EPS and Share Price CAGR is for 8 years from FY96 to FY04.
Alpha in EPS =
alpha in share prices
Correlation between relative share price performance with starting PE and EPS CAGR
Source: ACE Equity, Marcellus Investment Managers;
Correlation analysis has been done for the constituents of today's BSE100 index companies, hence companies
which were unlisted at the start of the period are excluded;
Companies with negative EPS have been excluded;
Companies with EPS CAGR >100% or opening PE >100 have been excluded;
For 5 companies EPS from FY95 and EPS CAGR for 9 years have been taken due to non-availability of data.
R² = 0.45%
-20%
-10%
0%
10%
20%
30%
40%
50%
60%
- 20 40 60 80 100FY94
-FY0
4 sha
re p
rice
CAGR
(rel
ative
to
BSE1
00)
Starting PE Ratio (FY94)
R² = 75.52%
-20%
-10%
0%
10%
20%
30%
40%
50%
60%
0% 20% 40% 60% 80%FY94
-FY04
shar
e pr
ice CA
GR (r
elativ
e to
BS
E100
)
FY94-FY04 Earning CAGR
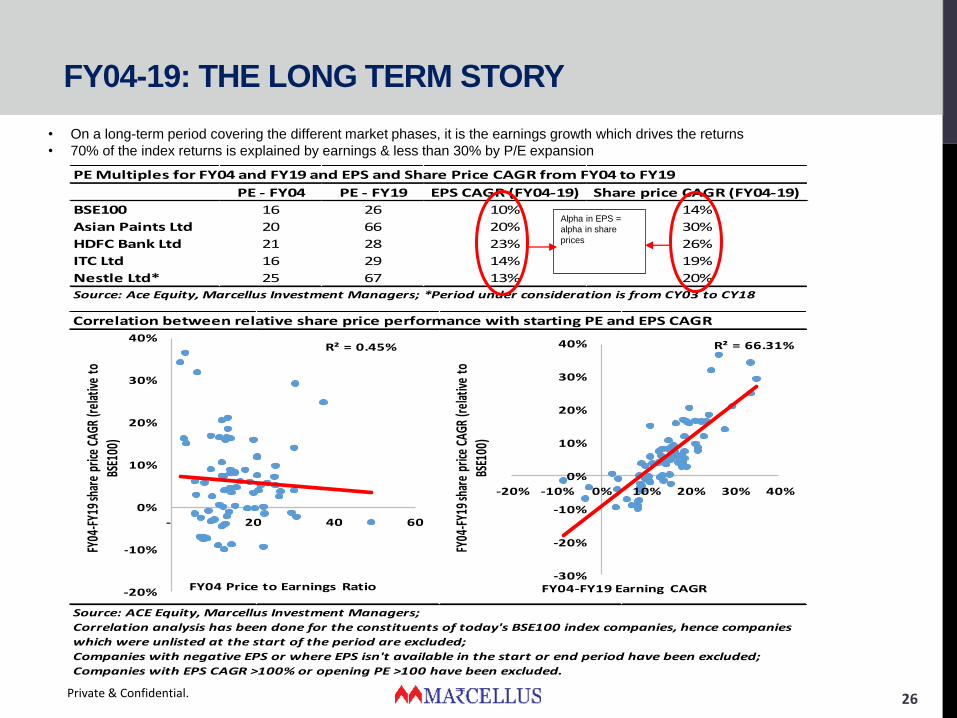
FY04-19: THE LONG TERM STORY
Private & Confidential. 26
• On a long-term period covering the different market phases, it is the earnings growth which drives the returns
• 70% of the index returns is explained by earnings & less than 30% by P/E expansion
PE - FY04 PE - FY19 EPS CAGR (FY04-19) Share price CAGR (FY04-19)
BSE100 16 26 10% 14%
Asian Paints Ltd 20 66 20% 30%
HDFC Bank Ltd 21 28 23% 26%
ITC Ltd 16 29 14% 19%
Nestle Ltd* 25 67 13% 20%
PE Multiples for FY04 and FY19 and EPS and Share Price CAGR from FY04 to FY19
Source: Ace Equity, Marcellus Investment Managers; *Period under consideration is from CY03 to CY18
Alpha in EPS =
alpha in share
prices
Correlation between relative share price performance with starting PE and EPS CAGR
Source: ACE Equity, Marcellus Investment Managers;
Correlation analysis has been done for the constituents of today's BSE100 index companies, hence companies
which were unlisted at the start of the period are excluded;
Companies with negative EPS or where EPS isn't available in the start or end period have been excluded;
Companies with EPS CAGR >100% or opening PE >100 have been excluded.
R² = 0.45%
-20%
-10%
0%
10%
20%
30%
40%
- 20 40 60
FY04
-FY1
9 sha
re p
rice
CAGR
(rel
ative
to
BSE1
00)
FY04 Price to Earnings Ratio
R² = 66.31%
-30%
-20%
-10%
0%
10%
20%
30%
40%
-20% -10% 0% 10% 20% 30% 40%
FY04
-FY1
9 sha
re p
rice
CAGR
(rel
ative
to
BSE1
00)
FY04-FY19 Earning CAGR
DISCLAIMER
"This document has been made available solely for informational purposes
and is for private circulation only. Neither the transmission of this
document nor the transmission of any information contained herein is
intended to create, and receipt hereof, does not constitute formation of any
relationship between Marcellus Investment Managers Private Limited
(“Marcellus”) and the recipient and shall not entitled the recipient to
circulate, share or rely upon the information contained herein for any other
purpose other than the limited intended purpose only. Marcellus disclaims
any and all liability arising from actions taken or omitted to be taken based
on the contents herein."
Private & Confidential. 27