Embed Size (px)
Citation preview
Michael E. Porter, David S. Gee, and Gregory J. Pope
AMERICA’SUNCONVENTIONALENERGY OPPORTUNITY
A WIN-WIN PLAN FOR THE ECONOMY, THE ENVIRONMENT,
AND A LOWER-CARBON, CLEANER-ENERGY FUTURE

2

EXECUTIVE SUMMARY 2
Chapter 1: INTRODUCTION 6
Chapter 2: THE U.S. ECONOMIC AND COMPETITIVENESS CONTEXT 12
Chapter 3: THE IMPACT OF UNCONVENTIONALS ON THE U.S. ECONOMY 16
Chapter 4: MINIMIZING LOCAL ENVIRONMENTAL IMPACTS IN A COST-COMPETITIVE WAY 27
Chapter 5: THE TRANSITION TO A LOWER-CARBON, CLEANER-ENERGY FUTURE 33
Chapter 6: THE WIN-WIN PATH FORWARD 44
Chapter 7: MAKING PROGRESS 49
Appendix I: ESTIMATING ECONOMIC IMPACTS OF UNCONVENTIONAL RESOURCE DEVELOPMENT 53
Appendix II: ANALYSIS OF UNCONVENTIONALS JOB POSTINGS BY BURNING GLASS 56
Appendix III: CALCULATING COSTS OF CSSD STANDARDS COMPLIANCE 56
Appendix IV: ESTIMATING THE LEVELIZED COST OF ELECTRICITY (LCOE), 2015–2050 58
Appendix V: ESTIMATING NATURAL GAS POWER PLANT RETIREMENTS, 2014–2060 58
Conflict of interest disclosure
The Boston Consulting Group, Inc. (“BCG”), has confidentiality obligations with its clients that prohibit it from disclosing client-specific relationships. BCG either may provide or does provide services to, has partnerships with, or has other relationships of a commercial or non-commercial nature with organizations cited in this report, either in the past or the future.
AMERICA'S UNCONVENTIONAL ENERGY OPPORTUNITY 1
2
Unconventional gas and oil resources* are perhaps the single largest opportunity to improve the trajectory of the U.S. economy, at a time when the prospects for the average American are weaker than we have experienced in generations. America’s new energy abundance can not only help restore U.S. competitiveness but can also create geopolitical advantages for America. These benefits can be achieved while substantially mitigating local environmental impact and speeding up the transition to a cleaner-energy future that is both practical and affordable.
However, America is currently caught in an unproductive, divisive, and often misinformed debate about our energy strategy, which threatens our nation’s economic and environmental goals. There is an urgent need for the U.S. to get on a new path. We set forth an overall strategy for unconventional energy development that meets the most important goals of industry, environmental stakeholders, and governments, and allows the U.S. to responsibly achieve the full benefits of this unique and vital opportunity.
THE U.S. COMPETITIVENESS CHALLENGEThe ability of the U.S. economy to improve the standard of living of the average citizen is weaker than it has been in generations. The deterioration began well before the Great Recession and is reflected by slow job growth and stagnating wages, especially for middle- and lower-middle-class Americans. While U.S.-based multinational businesses have outperformed those in other advanced economies, small businesses in the U.S. are registering eroding performance, and business failures have outnumbered new startups from 2009 through 2012—the last year of available data—for the first time since at least the 1970s. U.S. growth has exceeded that of Europe and Japan in recent years, but our growth is still the slowest in many decades.
America’s poor economic performance is not cyclical but structural, and it reflects an erosion of the nation’s fundamental competitiveness. As documented by the U.S. Competitiveness Project at Harvard Business School (HBS), the overall quality of America’s business environment has declined in key areas, including skills, infrastructure, costs of doing business, and corporate tax structure. While the U.S. retains core strengths, partisan political gridlock has meant that little progress has been made on reducing any of America’s emerging weaknesses. This project is motivated by that gridlock, which is also threatening one of America’s emerging strengths: unconventional energy development.
AMERICA’S UNCONVENTIONAL ENERGY ADVANTAGEAmerica’s abundant and low-cost unconventional gas and oil resources are a once-in-a-generation opportunity to change the nation’s economic and energy trajectory. The U.S. now has a global energy advantage, with wholesale natural gas prices averaging about one-third of those in most other industrial countries, and industrial electricity prices 30–50% lower than in other major export nations. That means major benefits for industry, households, governments, and communities, while reducing America’s trade deficit and geopolitical risks. The U.S. has had a 10- to 15-year head start in commercializing unconventional resources versus other countries. Though the recent decline in world oil prices has affected the short-term prospects of U.S. unconventionals, low prices are unlikely to significantly impact the fundamental U.S. competitive advantage over the next several decades.
THE ENERGY OPPORTUNITY AT RISKDespite these major benefits, however, public support for unconventional energy development, and especially hydraulic fracturing, is decidedly mixed and seems to be declining. Further development is increasingly threatened. Opposition reflects both legitimate concerns over local environmental and climate impacts, and widespread confusion over the facts.
In today’s status quo, no stakeholder is achieving its most essential goals. The ability to change America’s economic trajectory is being eroded, industry is facing stiff opposition, local environmental performance is not improving as
EXECUTIVE SUMMARY
*We define unconventional gas and oil resources as shale gas and oil resources as well as tight gas and oil resources. These resources are accessed and extracted through the process of hydraulic fracturing. Unconventionals do not include other forms of oil and gas resources, such as oil sands, extra heavy oil, coal-to-gas conversion, or coal bed methane.

AMERICA'S UNCONVENTIONAL ENERGY OPPORTUNITY 3
rapidly as it can and should, and large-scale progress toward a cleaner-energy and a lower-carbon future remains fiercely contested. There is now a real risk that America will fail to capitalize on this historic opportunity, much less build on it.
CREATING A WIN-WIN STRATEGYThe HBS–Boston Consulting Group (BCG) project was established to develop a shared fact base, engage the key stakeholders, and advance a shared agenda for developing America’s unconventional gas and oil resources in a way that addresses the key objectives of all the stakeholders. This win-win pathway involves 11 action steps across three pillars:
A. Capitalizing on America’s new energy advantage to enhance U.S. competitiveness and the prosperity of the average citizen;
B. Minimizing the local environmental, health, and community impacts of developing the new energy resources at competitive cost;
C. Utilizing unconventionals to accelerate a practical and cost-efficient transition to a lower-carbon, cleaner-energy future.
A. Enhancing the economic opportunity
Unconventionals have already created major economic benefits for the U.S., adding more than $430 billion to annual GDP and supporting more than 2.7 million American jobs that pay, on average, two times the median U.S. salary. Fully 50% of the unconventionals production jobs are middle-skills jobs, accessible to the average citizen. The U.S. is still in the early stages of capitalizing on this economic opportunity, and current activity is concentrated in the upstream energy-production sector. With proper policies and actions by the industry and other stakeholders, this economic opportunity can further spread into downstream industries, such as petrochemicals and energy-intensive industries, and more broadly throughout the economy.
To realize that potential, however, the U.S. must address a number of key challenges:
1. Continuing the timely development of efficient energy infrastructure. Additional pipelines, gathering, and processing infrastructure are needed to safely and efficiently move unconventional gas and oil from producing regions to users across America.
2. Delivering a skilled workforce. The U.S. will need many more trained workers with the right skills across a wide variety of occupations to fill the well-paying middle-skills jobs.
3. Eliminating outdated restrictions on gas and oil exports. With abundant resources, restrictions on exports created in response to the 1970s’ energy crises are no longer needed, and exports would boost U.S. economic and job growth while benefitting friendly nations.
B. Minimizing local environmental impacts
The development of unconventional energy resources creates significant environmental risks to water, air, land, and communities, which must be clearly acknowledged. Our research reveals that real progress is being made in managing these environmental risks at a cost that does not threaten competitiveness. In addition, mitigation technology is rapidly improving. Significant progress has also been made in improving regulatory standards in most energy-producing states, and continuous-improvement bodies have been formed to diffuse leading practices among regulators and industry stakeholders.
There is no inherent trade-off between environmental protection and company profitability. With sound regulation and strong compliance, the cost of good environmental performance is modest and gives companies a level playing field on which to compete. However, poor and uneven compliance by some operators and uneven diffusion of leading practices continue to create significant problems. Improvement is needed in four key areas:
4. Developing transparent and consistent environmental performance data. Transparent environmental performance data creates the foundation for monitoring compliance and stimulating innovation. State governments, industry, and NGOs all have roles to play.
5. Setting robust regulatory standards. Better standards are needed to fill gaps, speed adoption of industry-leading practices, and encourage further innovation.
6. Achieving universal regulatory compliance. Both industry and regulators need to strengthen regulatory enforcement and producer compliance.
4
7. Strengthening bodies driving continuous environmental improvement. Continuous-improvement organizations such as STRONGER and CSSD* have played an important role, but steps are needed to improve collaboration and better disseminate recommendations.
C. Speeding the transition to a cleaner-energy, lower-carbon future
Over the last decade, the U.S. has begun a major transition toward a more-efficient, cleaner, and lower-carbon energy system led by the power sector. Our research finds that that transition will not only continue, but could accelerate over the next 20–30 years and will lead to major economic and environmental benefits.
While many stakeholders still believe that unconventional energy development and America’s energy transition are antithetical, they are actually complementary. Natural gas is the only fuel that can cost-effectively deliver large-scale carbon emissions reductions over the next 20 years while also providing a bridge to achieving even lower low-carbon solutions over the long term.
Our analysis shows that developing unconventional resources today is unlikely to delay the rollout of renewables. Instead, it can actually enable their scale-up. We also find that the use of natural gas today will not lock in greenhouse gas emissions for the indefinite future, and that low-cost natural gas-fired power plants will provide the essential standby power needed to scale up renewables.
However, to achieve this successful transition to a lower-carbon future, the U.S. must address a number of key challenges:
8. Containing methane leakage. Uncontrolled methane leakage can offset the climate benefits of natural gas. Cost-effective methods to contain leakage are available and need to be deployed throughout the natural gas value chain.
9. Setting policies that encourage cost-effective emissions reductions. Climate policies and regulations should be market-based to encourage cost-effective carbon reductions, rather than specifying particular technologies.
10. Fostering clean-energy technologies. The U.S. needs to encourage ongoing private- and public-sector research investments in cost-effective, low-carbon energy technologies and applications, including potentially broader uses of unconventional natural gas.
11. Building out a smart, efficient energy grid. The long-term (by around 2050) transition to a low-carbon energy system will require a robust power grid infrastructure capable of addressing the intermittent nature of renewable power sources. The U.S. and states must invest now in these grid improvements to enable renewables to scale over the long run.
MOVING TO ACTIONThese 11 action steps are a practical, achievable strategic agenda for America to make the most of its energy advantage while delivering on the nation's most important economic, environmental, and climate objectives.
To move these steps to action, we need to change the discussion, move beyond ideology, and break the gridlock. Industry, NGOs, governments, and academics must transcend their traditional positions, let go of the exaggerated rhetoric, and start overcoming historic skepticism and distrust that have led to the current, zero-sum mindsets and halting progress. Every stakeholder will be most effective in meeting its essential goals if it can recognize the benefits of working toward a good overall outcome for America, not just maximizing its narrowly defined historical self-interests.
The U.S. needs to achieve a “rational middle” ground to capitalize on this historic opportunity. The stakes are too high to fail. Long-entrenched opposition and antagonism will not dissipate overnight. But we must get started.
*STRONGER is the State Review of Oil and Natural Gas Environmental Regulations, and CSSD is the Center for Sustainable Shale Development
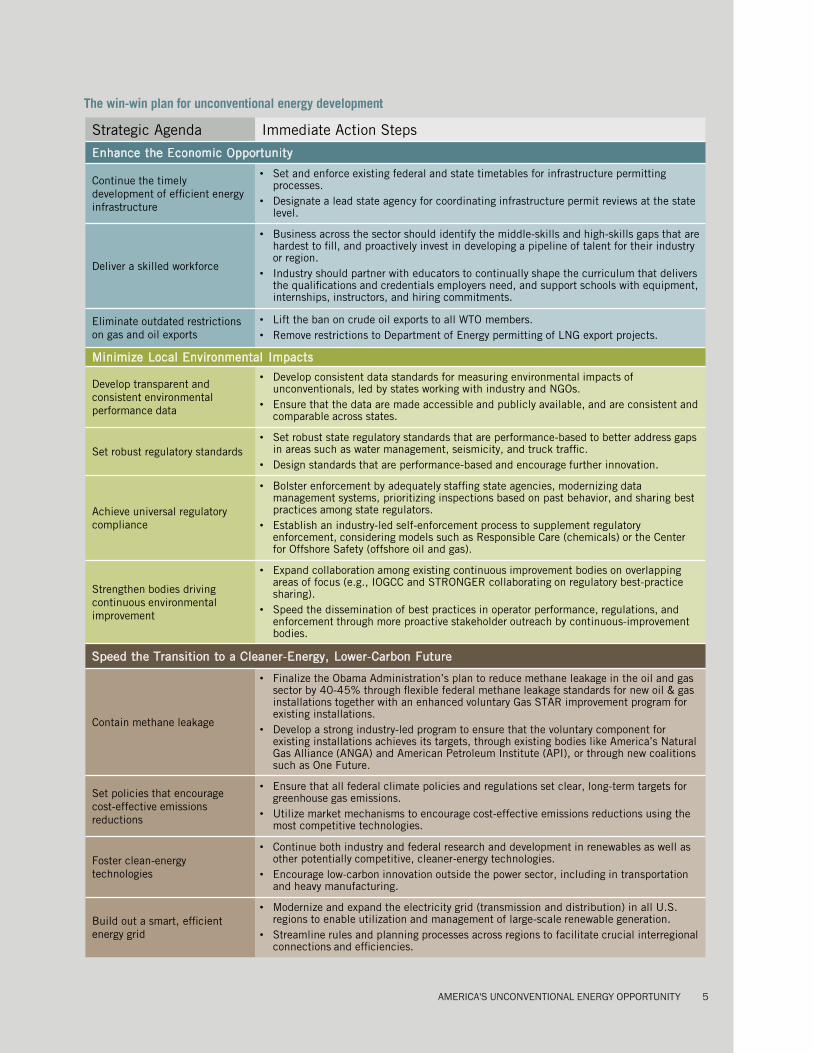
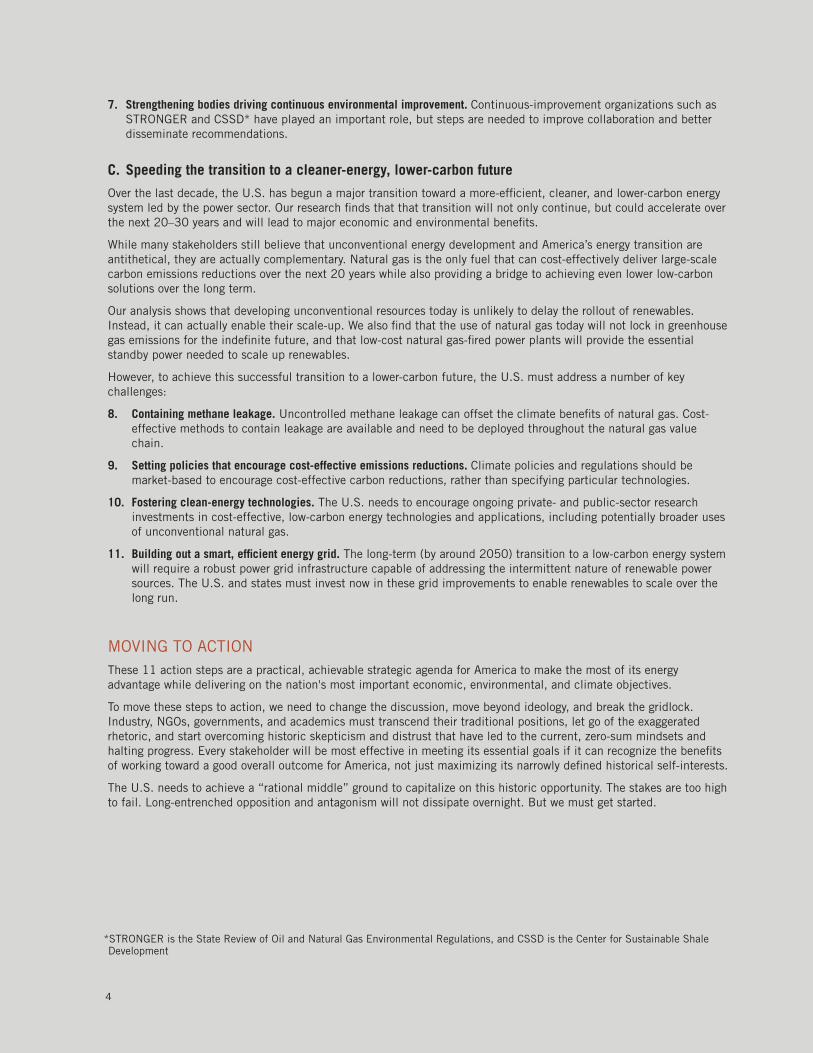
Strategic Agenda Immediate Action Steps
Enhance the Economic Opportunity
Continue the timely development of efficient energy infrastructure
• Set and enforce existing federal and state timetables for infrastructure permitting processes.
• Designate a lead state agency for coordinating infrastructure permit reviews at the state level.
Deliver a skilled workforce
• Business across the sector should identify the middle-skills and high-skills gaps that are hardest to fill, and proactively invest in developing a pipeline of talent for their industry or region.
• Industry should partner with educators to continually shape the curriculum that delivers the qualifications and credentials employers need, and support schools with equipment, internships, instructors, and hiring commitments.
Eliminate outdated restrictions on gas and oil exports
• Lift the ban on crude oil exports to all WTO members.• Remove restrictions to Department of Energy permitting of LNG export projects.
Minimize Local Environmental Impacts
Develop transparent and consistent environmental performance data
• Develop consistent data standards for measuring environmental impacts of unconventionals, led by states working with industry and NGOs.
• Ensure that the data are made accessible and publicly available, and are consistent and comparable across states.
Set robust regulatory standards• Set robust state regulatory standards that are performance-based to better address gaps
in areas such as water management, seismicity, and truck traffic.• Design standards that are performance-based and encourage further innovation.
Achieve universal regulatory compliance
• Bolster enforcement by adequately staffing state agencies, modernizing data management systems, prioritizing inspections based on past behavior, and sharing best practices among state regulators.
• Establish an industry-led self-enforcement process to supplement regulatory enforcement, considering models such as Responsible Care (chemicals) or the Center for Offshore Safety (offshore oil and gas).
Strengthen bodies driving continuous environmental improvement
• Expand collaboration among existing continuous improvement bodies on overlapping areas of focus (e.g., IOGCC and STRONGER collaborating on regulatory best-practice sharing).
• Speed the dissemination of best practices in operator performance, regulations, and enforcement through more proactive stakeholder outreach by continuous-improvement bodies.
Speed the Transition to a Cleaner-Energy, Lower-Carbon Future
Contain methane leakage
• Finalize the Obama Administration’s plan to reduce methane leakage in the oil and gas sector by 40-45% through flexible federal methane leakage standards for new oil & gas installations together with an enhanced voluntary Gas STAR improvement program for existing installations.
• Develop a strong industry-led program to ensure that the voluntary component for existing installations achieves its targets, through existing bodies like America’s Natural Gas Alliance (ANGA) and American Petroleum Institute (API), or through new coalitions such as One Future.
Set policies that encourage cost-effective emissions reductions
• Ensure that all federal climate policies and regulations set clear, long-term targets for greenhouse gas emissions.
• Utilize market mechanisms to encourage cost-effective emissions reductions using the most competitive technologies.
Foster clean-energy technologies
• Continue both industry and federal research and development in renewables as well as other potentially competitive, cleaner-energy technologies.
• Encourage low-carbon innovation outside the power sector, including in transportation and heavy manufacturing.
Build out a smart, efficient energy grid
• Modernize and expand the electricity grid (transmission and distribution) in all U.S. regions to enable utilization and management of large-scale renewable generation.
• Streamline rules and planning processes across regions to facilitate crucial interregional connections and efficiencies.
The win-win plan for unconventional energy development
AMERICA'S UNCONVENTIONAL ENERGY OPPORTUNITY 5
6
Chapter 1:
INTRODUCTION
THE U.S. ENERGY OPPORTUNITYToday, the U.S. economy is doing only half of its job. Starting well before the Great Recession and subsequent slow recovery, U.S. economic performance has eroded. While highly skilled individuals, large international companies, and some high-tech startups are doing well, middle- and lower-middle-class Americans have seen slow job growth and stagnating wages. Small businesses are generating fewer jobs, and more are closing than are opening. Although the U.S. is doing relatively better recently than other advanced nations, such as in Western Europe and Japan, U.S. economic performance by many indicators is worse than we have experienced in generations.
This poor performance is not cyclical but structural. It reflects an erosion of the nation’s fundamental competitiveness. Over the last five years of research, the U.S. Competitiveness Project at Harvard Business School (HBS) has sought to understand why. We have found that, while the U.S. retains core strengths that provide advantages relative to other countries, the overall quality of America’s business environment has eroded in key areas, including skills, infrastructure, costs of doing business, and corporate tax structure.1
HBS has put forward a consensus plan to address key U.S. weaknesses, as have others. However, political gridlock has meant that little progress has been made on any of America’s fundamental weaknesses in a decade.
Despite these challenges, however, an unprecedented opportunity has emerged for the U.S. Vast new reserves of unconventional domestic oil and gas have been opened up over the last five years, using recent advances in hydraulic fracturing and horizontal drilling. These new resources are both abundant and low-cost. U.S. production of natural gas has increased by 35% since 2005,2 eliminating the need for gas imports. Oil production has increased by 45% since 2010,3 restoring the U.S. as the second-largest oil producer in the world for the first time since 1991.4
Unconventional energy is perhaps the largest single opportunity to change America’s competitiveness and economic trajectory, as well as our geopolitical standing.
This energy revolution has created a major energy advantage for the U.S., especially in natural gas. In the U.S., wholesale gas prices average about one-third of those in most other industrial countries.5 Low gas costs are also driving advantages in electricity costs, where U.S. industrial electricity prices are 30-50% lower than those of other major exporters. The American
energy advantage is likely to persist for the foreseeable future. The U.S. has a 10- to 15-year head start in commercializing unconventional resources versus other countries, and efficiency innovations driven by the recent oil price decline may extend the U.S. lead even further.6
Unconventionals generate enormous benefits
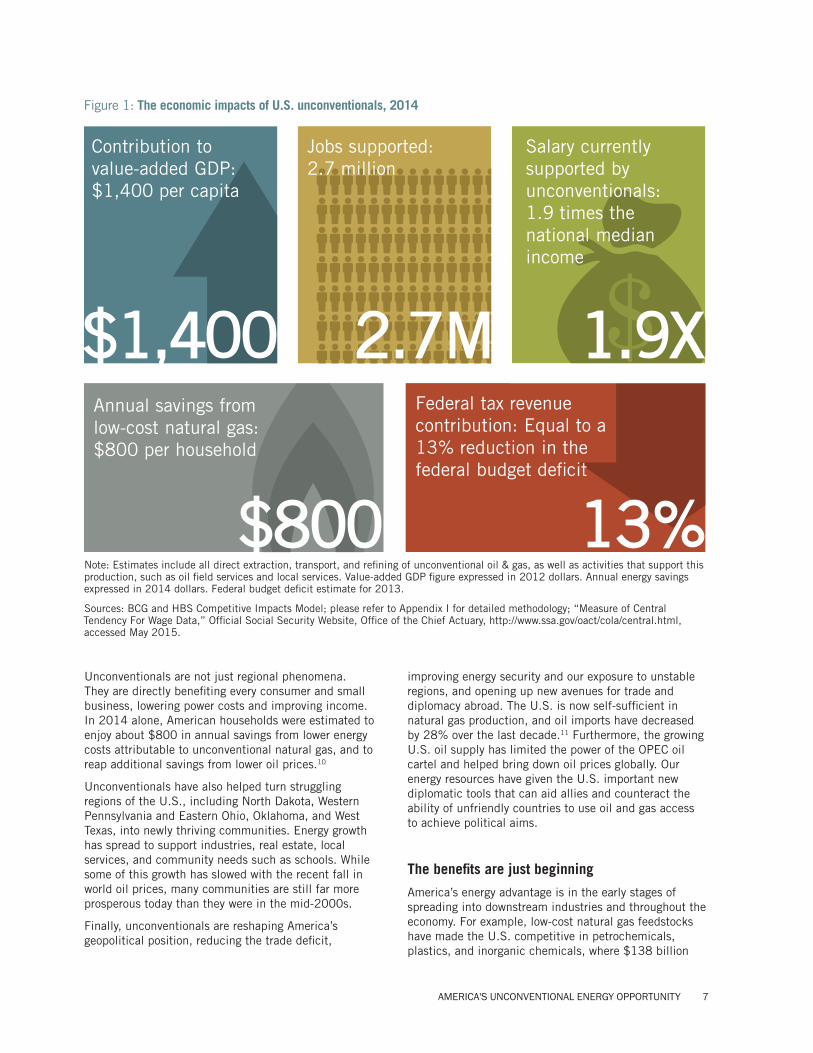
Unconventionals are already driving major benefits in economic growth, job generation, consumer savings, and government revenue. (See Figure 1.) We estimate that unconventional energy development contributes more than $430 billion to annual U.S. GDP, nearly equal to the GDP of the entire state of Ohio. Unconventionals also supported more than 2.7 million American jobs, ranging from those in exploration and production to supporting industries and local services. To put that in perspective, since 2005 the U.S. economy has only added a total of 4.9 million new jobs.8
The types of jobs being created are desperately needed. More than 50% of jobs in unconventional energy development require middle-skills, and the average job generated from the production of unconventionals pays nearly two times the median U.S. salary.9 As BCG’s Made in America, Again series shows, the energy advantage is not only creating new U.S. jobs but is shifting thousands of jobs back to the U.S. from overseas.
Current oil prices and their long-term implications
Worldwide crude oil prices have experienced a more than 50% decline since mid-2014, driven by an expanding oil supply and weaker demand.
Near-term prices will have impacts on oil and gas production, but are unlikely to significantly impact the fundamental U.S. competitive advantage over the next several decades. In fact, price pressure has led to increased innovation in unconventionals technology and lower production cost in the U.S., while deterring efforts in other countries to develop this resource.
The U.S. energy advantage is likely to persist for the foreseeable future. The urgent priority is for the nation to take advantage of this opportunity.
AMERICA'S UNCONVENTIONAL ENERGY OPPORTUNITY 7
Figure 1: The economic impacts of U.S. unconventionals, 2014
Unconventionals are not just regional phenomena. They are directly benefiting every consumer and small business, lowering power costs and improving income. In 2014 alone, American households were estimated to enjoy about $800 in annual savings from lower energy costs attributable to unconventional natural gas, and to reap additional savings from lower oil prices.10
Unconventionals have also helped turn struggling regions of the U.S., including North Dakota, Western Pennsylvania and Eastern Ohio, Oklahoma, and West Texas, into newly thriving communities. Energy growth has spread to support industries, real estate, local services, and community needs such as schools. While some of this growth has slowed with the recent fall in world oil prices, many communities are still far more prosperous today than they were in the mid-2000s.
Finally, unconventionals are reshaping America’s geopolitical position, reducing the trade deficit,
improving energy security and our exposure to unstable regions, and opening up new avenues for trade and diplomacy abroad. The U.S. is now self-sufficient in natural gas production, and oil imports have decreased by 28% over the last decade.11 Furthermore, the growing U.S. oil supply has limited the power of the OPEC oil cartel and helped bring down oil prices globally. Our energy resources have given the U.S. important new diplomatic tools that can aid allies and counteract the ability of unfriendly countries to use oil and gas access to achieve political aims.
The benefits are just beginning
America’s energy advantage is in the early stages of spreading into downstream industries and throughout the economy. For example, low-cost natural gas feedstocks have made the U.S. competitive in petrochemicals, plastics, and inorganic chemicals, where $138 billion
$1,400 2.7M
Jobs supported: 2.7 million
Salary currently supported by unconventionals: 1.9 times the national median income
Annual savings from low-cost natural gas: $800 per household
$800 13%
Federal tax revenue contribution: Equal to a 13% reduction in the federal budget deficit
Contribution to value-added GDP: $1,400 per capita
$1.9X
Note: Estimates include all direct extraction, transport, and refining of unconventional oil & gas, as well as activities that support this production, such as oil field services and local services. Value-added GDP figure expressed in 2012 dollars. Annual energy savings expressed in 2014 dollars. Federal budget deficit estimate for 2013.
Sources: BCG and HBS Competitive Impacts Model; please refer to Appendix I for detailed methodology; “Measure of Central Tendency For Wage Data,” Official Social Security Website, Office of the Chief Actuary, http://www.ssa.gov/oact/cola/central.html, accessed May 2015.

8
in new U.S.-based investments has been announced.12 In energy-intensive industries, lower cost electricity and lower natural gas fuel costs are beginning to drive investments such as new iron and steel plants and plastics processing.13 Moreover, lower prices have catalyzed a renewed interest in the use of natural gas in transportation such as CNG vehicles, fleets, and trucks, which significantly lowers costs, improves emissions, and reduces dependence on oil. Finally, abundant domestic supplies open the opportunity for the U.S. to export both gas and oil, with legislative changes, for the first time in decades.
Coupled with rising wages in emerging markets, low energy costs and abundant supplies promise to stimulate U.S. growth and investment across a wide range of industries. BCG’s Made in America, Again project found that the estimated average manufacturing cost structure for the U.S. in 2015 is within 5% of China’s and 10-20% lower than major European economies’.14
AMERICA RUNS THE RISK OF NOT CAPITALIZING ON THIS OPPORTUNITYDespite these major benefits, however, unconventional energy has become highly controversial in the U.S. Public support for hydraulic fracturing is decidedly mixed and seems to be declining. Expanding development is increasingly threatened. Today, more Americans oppose expanded hydraulic fracturing than support it.15 This opposition has grown both out of legitimate concerns over local environmental impacts and how unconventionals affect climate change and out of widespread confusion over the facts.
The development of unconventionals has created real local environmental, public health, and community risks. Production of unconventionals uses a heavy industrial process, a combination of horizontal drilling and hydraulic fracturing to extract oil and gas from rock formations. This process, along with the growing scale of production, creates significant issues related to freshwater use and wastewater disposal, ground water contamination, air pollution, land degradation, seismic events, and community disturbances such as noise and heavy road use. Though energy producers and U.S. state and federal regulators have made considerable progress in addressing many of these risks and impacts, there is still need for improvement.
Unconventionals also elicit concerns that their use is incompatible with responding to climate change. While natural gas emits 50% less carbon dioxide when burned than coal16 and while the increased use of natural gas power plants contributed significantly to a 15% reduction in carbon emissions in the power sector between 2005 and 2013,17 gas is not carbon-free. Climate stakeholders worry that developing unconventional resources will delay the scale-up of
renewables and other lower-carbon energy sources, and will lock in high levels of greenhouse gas emissions for the indefinite future. There are also concerns that the leakage of methane in the production and processing of natural gas will offset the relative benefits of natural gas versus coal, since methane is itself a potent greenhouse gas.
In addition to these legitimate concerns, much of the debate over unconventionals is driven by polarizing arguments, which are uninformed and reflect the absence of a shared fact base. The "facts" advanced by all sides are sometimes incomplete or taken out of context, and situations are often purposefully distorted. (See below for a recent example.) Some industry actors, for example, push the economic arguments while downplaying or ignoring the negative environmental and other impacts. Some environmental and climate advocates use single, non-representative environmental incidents to generalize about the performance of the whole industry, without putting incidents in context. As a result, there is a lack of trust all around, and the general public is both misled and confused.
Federal hydraulic fracturing rules emblematic of unproductive debateIn late March 2015, the Interior Department announced new regulations for hydraulic fracturing on federal lands. Only a small minority of unconventionals operations occur on federal lands and are largely catching up to rules that states already have in place. However, stakeholder reactions showed just how divisive the unconventionals debate has become:18
• The federal government positioned the rules as a new blueprint for states to follow, when in reality most states are already leading: "There are a number of states where these may be the only regulations they have." – Sally Jewel, Interior Secretary
• The Independent Petroleum Association of America (IPAA) filed suit against the regulations, despite the low estimated compliance costs: "These new federal mandates will add burdensome new costs on our independent producers." – Barry Russell, CEO of IPAA
• Some environmental groups opposed the regulations for using the FracFocus chemical disclosure database as pro-industry, despite it already being mandated in 16 states. "We remain disappointed with some provisions, like continued reliance on the industry-run website FracFocus for disclosure of toxic chemicals." – Madeline Foote, legislative representative for the League of Conservation Voters
AMERICA'S UNCONVENTIONAL ENERGY OPPORTUNITY 9
No one is winning
In today’s status quo, no stakeholder is achieving its most essential goals. Instead of having a constructive dialogue about how to capture the clear economic benefits while minimizing the impacts and risks, the debate has devolved into an "either/or" battle where no one is really winning.
While the oil and gas industry has so far achieved significant unconventionals production levels, continued development and expansion are under threat. State and local bans on hydraulic fracturing, such as the December 2014 decision by New York State, are the most prominent blocks to further development. (See right for more detail.) But there are also other costs. Opposition to critical infrastructure projects has led to protracted delays in the development of efficient pipeline infrastructure. This increases truck traffic, more risky rail shipments, and higher transport costs. The industry’s lack of community support and legitimacy also increases the risk of policy uncertainty, diminished access to public services, and investment delays, especially downstream. Finally, antiquated policies on oil and gas exports, developed during periods of scarcity, remain in place, limiting the total market for U.S. producers.
At the same time, local environmental stakeholders are not yet succeeding in addressing many of the environmental risks. Poor operators cause unnecessary spills, contamination, leaks, and community disruptions. Gaps in regulatory standards across states persist. Intense industry lobbying weakens the regulatory agenda and politicizes environmental protection. Uneven compliance and enforcement lead to more accidents and faulty practices. Furthermore, pipeline infrastructure delays are actually making some environmental and community problems worse.
Climate stakeholders, meanwhile, are far short of where they would like to be in making large-scale progress. While some states have taken limited action, there is no accepted federal or global plan in place to limit carbon dioxide and other greenhouse gas emissions. Absolutist approaches to mitigation at all costs have run into fierce opposition from public, business, and political stakeholders who are wary of high costs and perpetual subsidies. Even worse, climate stakeholders must still spend much of their effort debating the science of climate change itself, instead of building feasible approaches to mitigation.
DEVELOPING A CONSTRUCTIVE PATH FORWARDThe joint HBS-BCG project on America’s energy opportunity arose from our recognition that unconventional energy resources represented one of America’s biggest economic opportunites today and our
concern about the unproductive public and political discourse about the nation’s future energy strategy. Given the lack of shared progress on key challenges, we became concerned that there is now a real risk that American citizens, communities, and companies will fail to capitalize and expand on the historic opportunity that unconventional energy resources represent.
The lack of trust and productive solutions-based dialogue among stakeholders has created gridlock and put America on a path that is not in anyone’s interests. We see many stakeholders talking past each other and too few efforts to synthesize and find common ground. That has created unnecessary risks for our energy development, future U.S. competitiveness, and the trajectory of the overall U.S. economy. The HBS-BCG project was established to create a better way forward. Its purpose is to develop a shared fact base, shift the discourse, and advance a shared policy agenda on unconventionals development.
New York state ban shows dangers for future unconventionals developmentIn late March 2015, the New York Department of Health recommended a ban on hydraulic fracturing19 because of unknown total risk and potential public health effects:20
• Air/climate impacts (methane and volatile organic compounds)
• Water management impacts
• Earthquakes
• Community impacts (noise, odors, overburdened resources)
A ban was recommended until “the science provides sufficient information to determine the level of risk to public health from high-volume hydraulic fracturing to all New Yorkers and whether the risks can be adequately managed.”
However, the report also notes that “absolute scientific certainty is unlikely to ever be attained,” making it unclear what evidence will be sufficient to determine the level of risk.
Other issues with the ban:
• The New York report could not find conclusive evidence that hydraulic fracturing causes excessive health and environmental risks.
• Trajectory of progress on public-health risk-mitigation improvements was not taken into account.
• An assessment of the economic costs of banning hydraulic fracturing was not conducted.
10
Creating the fact base
The team synthesized the large body of existing but sometimes conflicting or misleading research in the field on the nature of the current and future economic opportunity for the U.S., including economic growth, jobs, wages, and benefits for consumers, government revenues, and strengthening America’s position internationally. The project also examined the evidence on the environmental risks of unconventionals and examined the steps and costs required to minimize them. Finally, we examined the energy transition underway toward cleaner energy, the progress on mitigating climate change, and the benefits and issues of using unconventionals to achieve short-term and long-term U.S. carbon emissions reductions. The project involved reviewing hundreds of existing studies, as well as developing primary research and analysis on key areas such as the economic impact of unconventionals, understanding the costs of improving environmental performance, and detailed modeling of the degree to which current investments in natural gas power and infrastructure would impede the development of renewables, among others.
Engaging the key stakeholders
We interviewed numerous experts and leaders across all stakeholders to gather data about on-the-ground performance, understand their thinking, and test assumptions. A smaller steering committee of senior leaders was convened to solicit deeper guidance and stress-test our analyses and recommendations. (See lower left.) Participants in the Steering Committee were not asked to endorse any of the analysis or recommendations, but provided extremely helpful feedback and suggestions.
Developing an overall strategy
Our research and interviews provided the foundation for drafting a practical, constructive, and feasible win-win pathway for capturing the U.S. unconventional energy opportunity. Instead of the hard trade-offs commonly portrayed, the facts reveal an ample middle ground where all stakeholders can benefit from unconventionals development. This plan sets forth the set of steps necessary to move America forward in a way that increases U.S. competitiveness and economic growth while achieving the major goals of industry, government, environment, and climate change stakeholders.
Convening energy leaders at hbs
More than 80 leaders from industry, the environmental community, suppliers, think tanks, state and federal government, and academia convened at HBS in March 2015 for an intensive discussion of the fact base and proposed win-win pathway. The gathering brought together a breadth of leaders who rarely, if ever, are in the same room. It also provided a setting in which active, constructive discussions occurred. The discussions were remarkable.
Steering Committee MembersAnadarko: R.A. Walker, Chairman, President and Chief Executive Officer
BASF Corporation: Hans Engel, Chairman and Chief Executive Officer
CB&I (Chicago Bridge & Iron Company): Philip K. Asherman, President and Chief Executive Officer
Center for Strategic and International Studies (CSIS): Robin West, Senior Adviser, Energy and National Security Program
Entergy: Leo Denault, Chairman and Chief Executive Officer
Environmental Defense Fund: Fred Krupp, President
Environment Defense Fund: Mark Brownstein, Associate Vice President
Harvard Business School: Rebecca Henderson, John and Natty McArthur University Professor
Harvard Business School: Forest Reinhardt, John D. Black Professor
Harvard Business School: Jan W. Rivkin, Bruce V. Rauner Professor of Business Administration
Siemens Corporation: Eric A. Spiegel, President and Chief Executive Officer
The Whitman Strategy Group: The Honorable Christine Todd Whitman, President
AMERICA'S UNCONVENTIONAL ENERGY OPPORTUNITY 11
THE REPORTThis report is a summary of our findings, the win-win pathway, and how America might go about achieving it in practice. The report is structured as follows:
Chapter 2 – Outlines the U.S. economic and competitiveness context
Chapter 3 – Analyzes the economic impact of unconventionals
Chapter 4 – Addresses the local environmental impact
Chapter 5 – Discusses the climate impact
Chapter 6 – Outlines the win-win path forward
Chapter 7 – Sets forth actions needed to realize the opportunity
Appendices – Summarize the methodologies used for key analyses
For additional information on this topic and our process, please see the U.S. Competitiveness Project website at: http://www.hbs.edu/competitiveness/research/Pages/unconventional-energy.aspx
As we assembled the facts and sought input from a wide range of stakeholders, we have become more and more convinced that the U.S. can move unconventionals and America’s energy transformation forward in a way that greatly enhances American competitiveness and drives economic growth while substantially improving environmental performance and accelerating a clean energy future. The key objectives of the stakeholders currently locked in opposition to one another can all be advanced.
The U.S. can enhance its competitiveness based on America’s new energy advantage. The U.S. can minimize local environmental, health, and community impacts at competitive cost. And unconventionals, together with a holistic approach to the issues, can enable a practical and cost-efficient transition to a lower-carbon, cleaner-energy future that will make America a leader and innovator in the energy system of the future.

12
A WEAKENED U.S. ECONOMIC TRAJECTORY Assessing the significance of low-cost unconventional energy resources requires understanding the broader trajectory of the U.S. economy. The U.S. economy’s ability to improve the nation’s standard of living is weaker than it has been in generations, a deterioration that began well before the Great Recession. Between 1950 and 2000, the U.S. economy grew at an average of 3.7% per year. Between 2000 and 2014, growth has averaged just 1.9% per year.21
Job growth has also declined markedly. Since the 1970s, the U.S. economy created jobs at roughly a 2% annual rate. Starting around 2001, job growth rates began declining and averaged only approximately 1% annually from 2001 to 2010.22 As jobs became scarce, the U.S. labor force participation rate, which had climbed for five decades from 1947 to 1997, started falling in 2001. Today it is at levels not seen since the early 1980s.23
The composition of new jobs has also been changing. Between 1990 and 2014, the U.S. economy generated
22.5 million net jobs in local industries, such as retailing, construction, and government, paying an average wage of just $37,000 per annum as of 2014.24 Just 1.7 million new jobs were created in industries exposed to international competition, paying $69,000 in 2014.25 (See Figure 2.)
Slowing economic and job growth has contributed to stagnant incomes, especially in America’s middle- and lower-income households. Between 1999 and 2013, median household earnings actually declined by about 9% in real terms.26 Income growth has been slowest for lower-income households and those without advanced education. However, even those in the upper half of the income distribution have seen slow income growth, with the only exception being those at the very top. Not only have wages stagnated for working Americans, but the number of Americans who are long-term unemployed (those jobless for 27 weeks or more) was 2.6 million in March 2015,27 compared with fewer than 1 million in January 2000.28
The recent trajectory of the U.S. economy reflects a growing divergence.29 Highly skilled individuals are doing
Figure 2: U.S. private employment, by type of industry, 1990-2014
0
20
40
60
80
100
120
140
1990 1992 1994 1996 1998 2000 2002 2004 2006 2008 2010 2012 2014
Em
ploy
men
t (i
n m
illio
ns o
f jo
bs)
Industries exposed to international competition(CAGR = 0.18%)
Industries serving local markets(CAGR = 1.49%)
Chapter 2:
THE U.S. ECONOMIC AND COMPETITIVENESS CONTEXT
Note: The compound annual growth rate (CAGR) is for the period June 1990 through June 2014.
Source: Mercedes Delgado, Michael E. Porter, and Scott Stern, "Defining Clusters of Related Industries," The National Bureau of Economic Research, August 2014, http://www.nber.org/papers/w20375.pdf, accessed May 2015.
AMERICA'S UNCONVENTIONAL ENERGY OPPORTUNITY 13
well, while the average American is struggling. The same divergence applies to businesses. Large multinationals are recording record profits and continuing to grow. Since the largest companies dominate overall corporate profitability in the economy, U.S. corporate profits have risen as a percentage of GDP. Except for a relatively small number of high-tech startups, however, small businesses are languishing. The proportion of jobs created by smaller businesses (with 10–99 employees), which historically, have been the nation’s job-creation engine, has been falling since 1997.30 And in 2008, for the first time since 1978, the number of businesses that failed in the U.S. exceeded the number of new businesses created.31 Based on the data available at the time of writing this report, this trend has not yet reversed itself, despite the last few years of overall economic growth.
THE U.S. COMPETITIVENESS CHALLENGEWhat is causing this poor and diverging performance? While many point to the Great Recession, all of these trends began well before 2008.32 Based on our research conducted by the U.S. Competitiveness Project at HBS, the underlying problem is a structural decline in U.S. competitiveness that has been building for decades.
What do we mean by competitiveness? A nation such as the United States is competitive if firms operating there are able to compete successfully in the global economy while maintaining or improving wages and living standards for the average American. Competitiveness requires that firms and workers succeed simultaneously. If American companies are doing well, but succeeding only through cutting jobs and squeezing wages, that reflects a lack of competitiveness. Conversely, if American workers are earning rising wages but American companies are unable to compete, that is not a sign of competitiveness either.
The only way that both companies and workers can prosper is for an economy to be highly productive. Only if there is a business environment in which workers can produce high-quality products and services with increasing efficiency can companies prosper while supporting rising wages for citizens.
Productivity and productivity growth, then, underlie competitiveness and are the fundamental causes of long-term growth in GDP, jobs, and wages. In the United States, solid labor productivity growth, which had traditionally supported rising wages, has declined since 2000. The annual average rate of labor productivity growth held steady at around 2% from 1986 to 2000,33 but averaged just 1.4% for the period 2000 to 2014.34
Growing weaknesses in the business environment have changed the trajectory of U.S. performance. That reflects both challenges in the U.S., and also the
rising globalization of the economy, putting the U.S. in competition with many other nations who have growing capabilities.
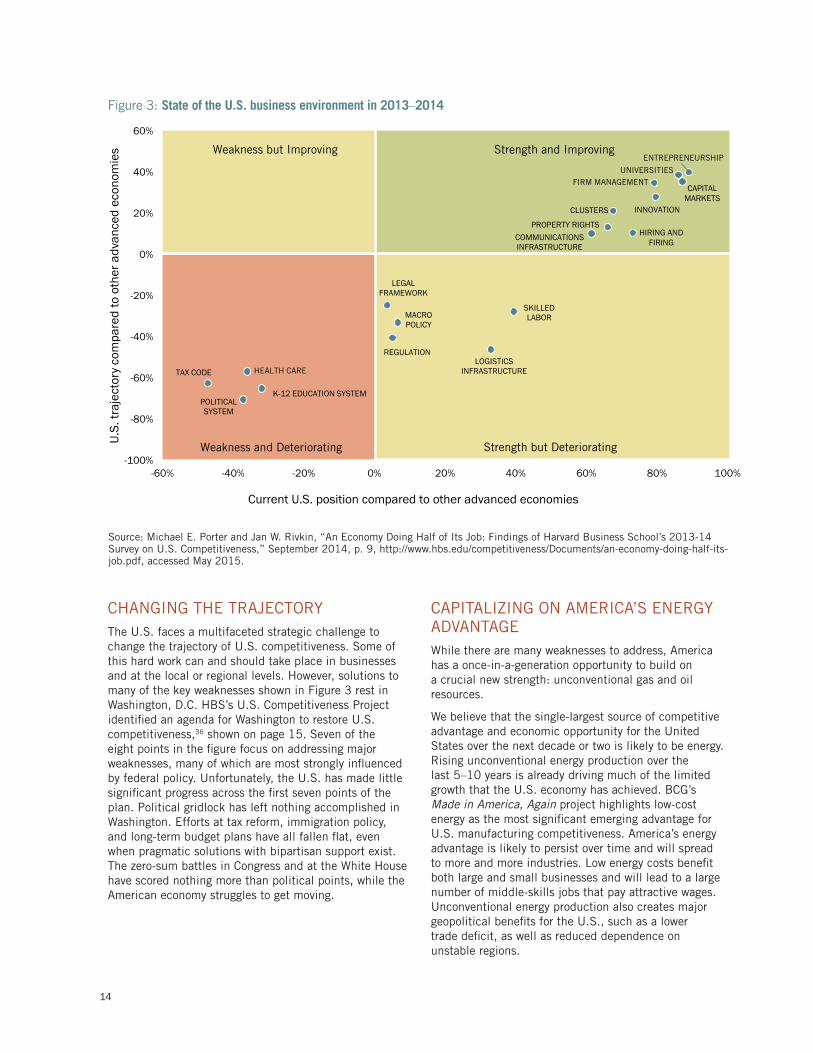
DRIVERS OF COMPETITIVENESSThe HBS U.S. Competitiveness Project, as well as BCG’s Made in America, Again series, set out to understand the drivers of the American competitiveness challenge and the actions required to overcome it. Based on surveys of HBS alumni35 and supported by broader research, Figure 3 on page 14 assesses the position of the U.S. on a series of factors most important to competitiveness.
The U.S. retains some core strengths, shown in the upper right quadrant, in areas like university education, entrepreneurship, quality of management, clusters, innovation, capital markets, and property rights. Those areas are not just strong but even improving.
However, in other crucial areas for competitiveness, the U.S. has allowed its once-strong positions to deteriorate. American workers, who prided themselves on high productivity and formed the backbone of America’s middle class, have seen a decline in skills relative to workers in many other countries. U.S.-based firms face skills shortages, which means that positions are going unfilled even as U.S. workers struggle to find jobs. American airports, ports, roads, and energy infrastructure are inadequate and in need of maintenance and upgrades. The U.S. PK–12 education system has lagged behind improving education systems in other countries. A complicated tax code, a high-cost legal system, growing regulatory complexity, and an unsustainable budget are some of the other key areas in which America’s business environment has been eroding.
That pattern of strengths and weaknesses helps explain diverging U.S. performance. Larger international firms and Americans with advanced education are doing well because they leverage America’s greatest strengths, such as: sophisticated management, access to capital, world-class universities, and a climate for entrepreneurship. But the average worker and most small businesses are captives of America’s biggest weaknesses: declining elementary education, eroding skills, the burdensome tax code and regulatory environment, and the high cost of health care. Larger companies can neutralize these weaknesses through offshoring and global operations.
A nation such as the United States is competitive if firms operating there are able to compete successfully in the global economy while maintaining or improving wages and living standards for the average American.
14
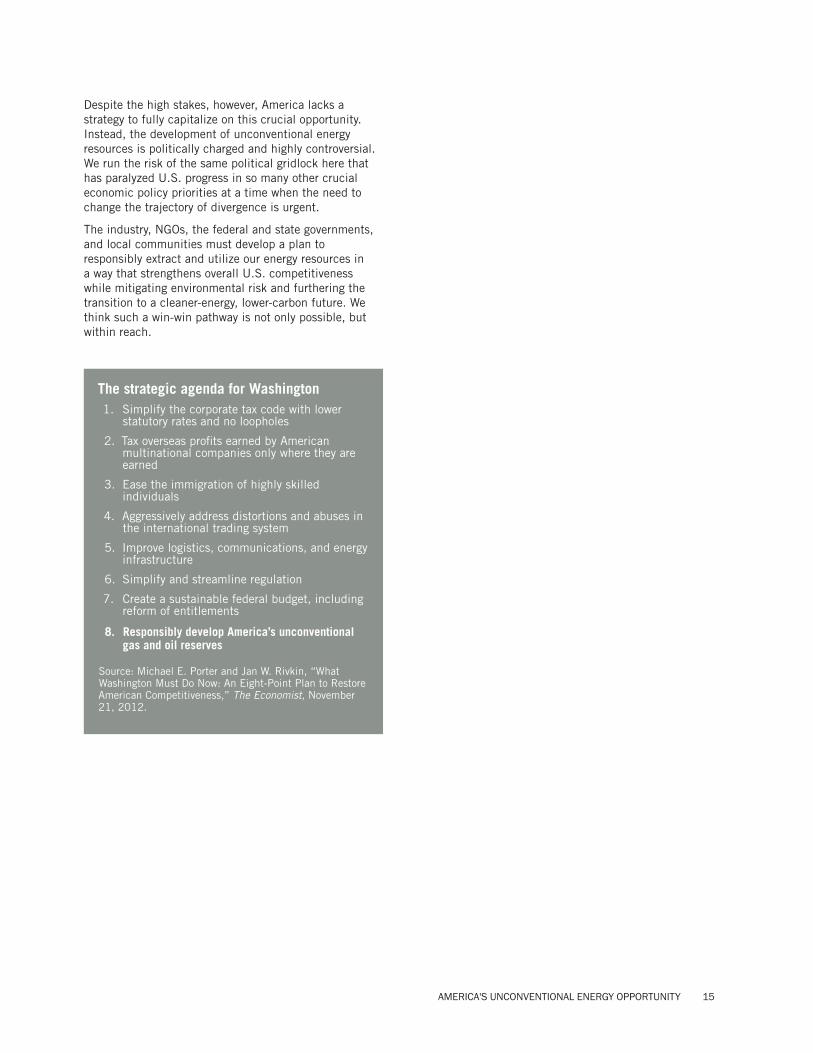
CHANGING THE TRAJECTORYThe U.S. faces a multifaceted strategic challenge to change the trajectory of U.S. competitiveness. Some of this hard work can and should take place in businesses and at the local or regional levels. However, solutions to many of the key weaknesses shown in Figure 3 rest in Washington, D.C. HBS’s U.S. Competitiveness Project identified an agenda for Washington to restore U.S. competitiveness,36 shown on page 15. Seven of the eight points in the figure focus on addressing major weaknesses, many of which are most strongly influenced by federal policy. Unfortunately, the U.S. has made little significant progress across the first seven points of the plan. Political gridlock has left nothing accomplished in Washington. Efforts at tax reform, immigration policy, and long-term budget plans have all fallen flat, even when pragmatic solutions with bipartisan support exist. The zero-sum battles in Congress and at the White House have scored nothing more than political points, while the American economy struggles to get moving.
CAPITALIZING ON AMERICA’S ENERGY ADVANTAGEWhile there are many weaknesses to address, America has a once-in-a-generation opportunity to build on a crucial new strength: unconventional gas and oil resources.
We believe that the single-largest source of competitive advantage and economic opportunity for the United States over the next decade or two is likely to be energy. Rising unconventional energy production over the last 5–10 years is already driving much of the limited growth that the U.S. economy has achieved. BCG’s Made in America, Again project highlights low-cost energy as the most significant emerging advantage for U.S. manufacturing competitiveness. America’s energy advantage is likely to persist over time and will spread to more and more industries. Low energy costs benefit both large and small businesses and will lead to a large number of middle-skills jobs that pay attractive wages. Unconventional energy production also creates major geopolitical benefits for the U.S., such as a lower trade deficit, as well as reduced dependence on unstable regions.
Figure 3: State of the U.S. business environment in 2013–2014
LOGISTICSINFRASTRUCTURE
COMMUNICATIONS INFRASTRUCTURE
TAX CODE
K-12 EDUCATION SYSTEM
SKILLEDLABOR
HIRING AND FIRING
INNOVATION
REGULATION
CLUSTERS
CAPITALMARKETS
MACRO POLICY
POLITICAL SYSTEM
PROPERTY RIGHTS
LEGAL FRAMEWORK
-100%
-80%
-60%
-40%
-20%
0%
20%
40%
60%
-60% -40% -20% 0% 20% 40% 60% 80% 100%
U.S.
traj
ecto
ry c
ompa
red
to o
ther
adv
ance
d ec
onom
ies
Current U.S. position compared to other advanced economies
Strength and Improving
Weakness and Deteriorating Strength but Deteriorating
Weakness but Improving
UNIVERSITIES
ENTREPRENEURSHIP
FIRM MANAGEMENT
HEALTH CARE
Source: Michael E. Porter and Jan W. Rivkin, “An Economy Doing Half of Its Job: Findings of Harvard Business School’s 2013-14 Survey on U.S. Competitiveness,” September 2014, p. 9, http://www.hbs.edu/competitiveness/Documents/an-economy-doing-half-its-job.pdf, accessed May 2015.
AMERICA'S UNCONVENTIONAL ENERGY OPPORTUNITY 15
Despite the high stakes, however, America lacks a strategy to fully capitalize on this crucial opportunity. Instead, the development of unconventional energy resources is politically charged and highly controversial. We run the risk of the same political gridlock here that has paralyzed U.S. progress in so many other crucial economic policy priorities at a time when the need to change the trajectory of divergence is urgent.
The industry, NGOs, the federal and state governments, and local communities must develop a plan to responsibly extract and utilize our energy resources in a way that strengthens overall U.S. competitiveness while mitigating environmental risk and furthering the transition to a cleaner-energy, lower-carbon future. We think such a win-win pathway is not only possible, but within reach.
The strategic agenda for Washington1. Simplify the corporate tax code with lower
statutory rates and no loopholes
2. Tax overseas profits earned by American multinational companies only where they are earned
3. Ease the immigration of highly skilled individuals
4. Aggressively address distortions and abuses in the international trading system
5. Improve logistics, communications, and energy infrastructure
6. Simplify and streamline regulation
7. Create a sustainable federal budget, including reform of entitlements
8. Responsibly develop America’s unconventional gas and oil reserves
Source: Michael E. Porter and Jan W. Rivkin, “What Washington Must Do Now: An Eight-Point Plan to Restore American Competitiveness,” The Economist, November 21, 2012.
16
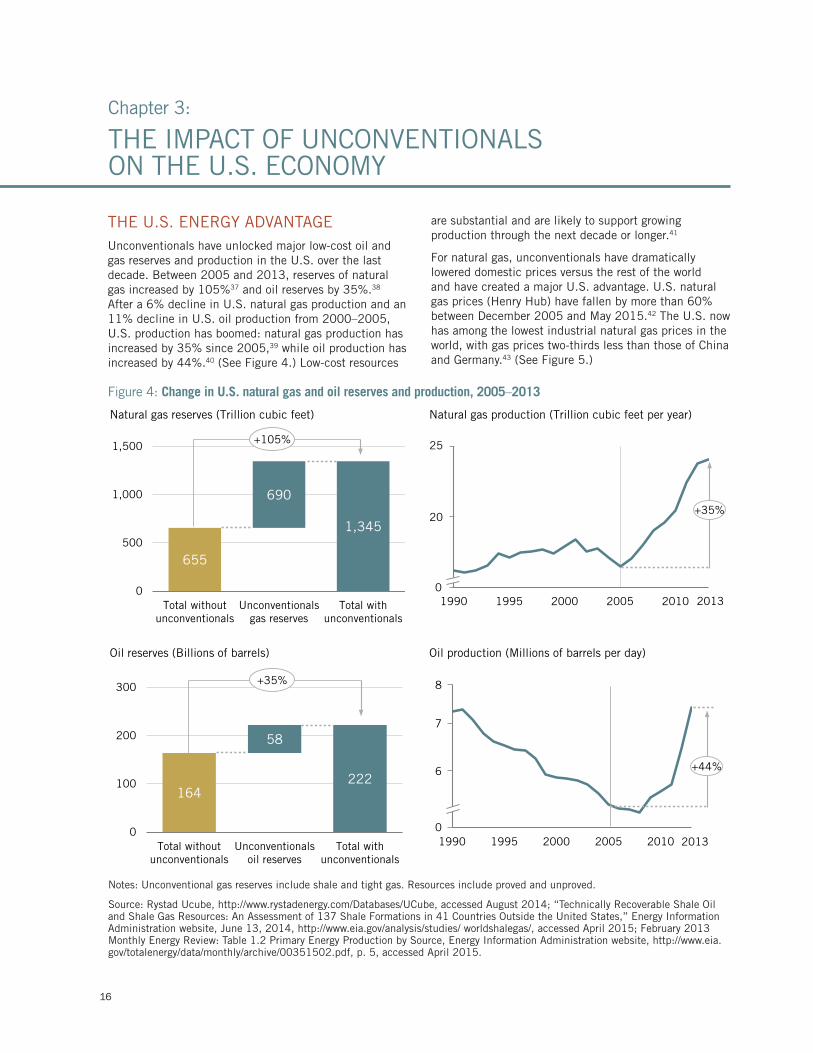
THE U.S. ENERGY ADVANTAGE Unconventionals have unlocked major low-cost oil and gas reserves and production in the U.S. over the last decade. Between 2005 and 2013, reserves of natural gas increased by 105%37 and oil reserves by 35%.38 After a 6% decline in U.S. natural gas production and an 11% decline in U.S. oil production from 2000–2005, U.S. production has boomed: natural gas production has increased by 35% since 2005,39 while oil production has increased by 44%.40 (See Figure 4.) Low-cost resources
are substantial and are likely to support growing production through the next decade or longer.41
For natural gas, unconventionals have dramatically lowered domestic prices versus the rest of the world and have created a major U.S. advantage. U.S. natural gas prices (Henry Hub) have fallen by more than 60% between December 2005 and May 2015.42 The U.S. now has among the lowest industrial natural gas prices in the world, with gas prices two-thirds less than those of China and Germany.43 (See Figure 5.)
Figure 4: Change in U.S. natural gas and oil reserves and production, 2005–2013
Natural gas production (Trillion cubic feet per year)
1990 1995 2000 2005 2010
655
690
1,345
0
500
1,000
1,500
Total withoutunconventionals
Unconventionalsgas reserves
Total withunconventionals
Natural gas reserves (Trillion cubic feet)
+105%
164
58
222
0
100
200
300
Total withoutunconventionals
Unconventionalsoil reserves
Total withunconventionals
Oil reserves (Billions of barrels)
+35%
1990 1995 2000 2005 2010
Oil production (Millions of barrels per day)
+35%
+44%
25
20
0
0
6
7
8
2013
2013
Chapter 3:
THE IMPACT OF UNCONVENTIONALS ON THE U.S. ECONOMY
Notes: Unconventional gas reserves include shale and tight gas. Resources include proved and unproved.
Source: Rystad Ucube, http://www.rystadenergy.com/Databases/UCube, accessed August 2014; “Technically Recoverable Shale Oil and Shale Gas Resources: An Assessment of 137 Shale Formations in 41 Countries Outside the United States,” Energy Information Administration website, June 13, 2014, http://www.eia.gov/analysis/studies/ worldshalegas/, accessed April 2015; February 2013 Monthly Energy Review: Table 1.2 Primary Energy Production by Source, Energy Information Administration website, http://www.eia.gov/totalenergy/data/monthly/archive/00351502.pdf, p. 5, accessed April 2015.

AMERICA'S UNCONVENTIONAL ENERGY OPPORTUNITY 17
Since the U.S. currently has no operational gas export terminals (although several are under construction), the U.S. supply boom has not affected world gas markets. Even when those export terminals are completed over the next few years, however, high natural gas shipping costs will maintain the favorable spread between U.S. and world prices.44
Oil, unlike gas, trades largely as a global commodity, with similar prices around the world, since crude oil, gasoline, and other refined products can be efficiently transported by tanker. Booming U.S. unconventional oil production, particularly in 2014, was one of several factors that contributed to a global oversupply of oil, which has driven down global oil prices substantially since mid-2014. That has benefited all oil users, including Americans. However, the U.S. oil users have not gained a relative competitive advantage, since all countries have experienced similar price declines. For producers, on the other hand, the U.S. crude oil market has been distorted by the ban on oil exports dating back to the 1970s, which we will discuss further in following sections.
THE U.S. LEAD In addition to large reserves, the U.S. has a significant head start in unconventionals technology and production versus other countries. That has resulted from a combination of factors: attractive geology, world-leading technology, well-developed infrastructure, talent, strong private-property rights, intense competition, and access to financing. The U.S. advantage is likely to persist for the foreseeable future, and the recent price declines have likely reinforced that advantage by reducing incentives for investment in countries where production is still nascent. To date, Argentina, Canada,
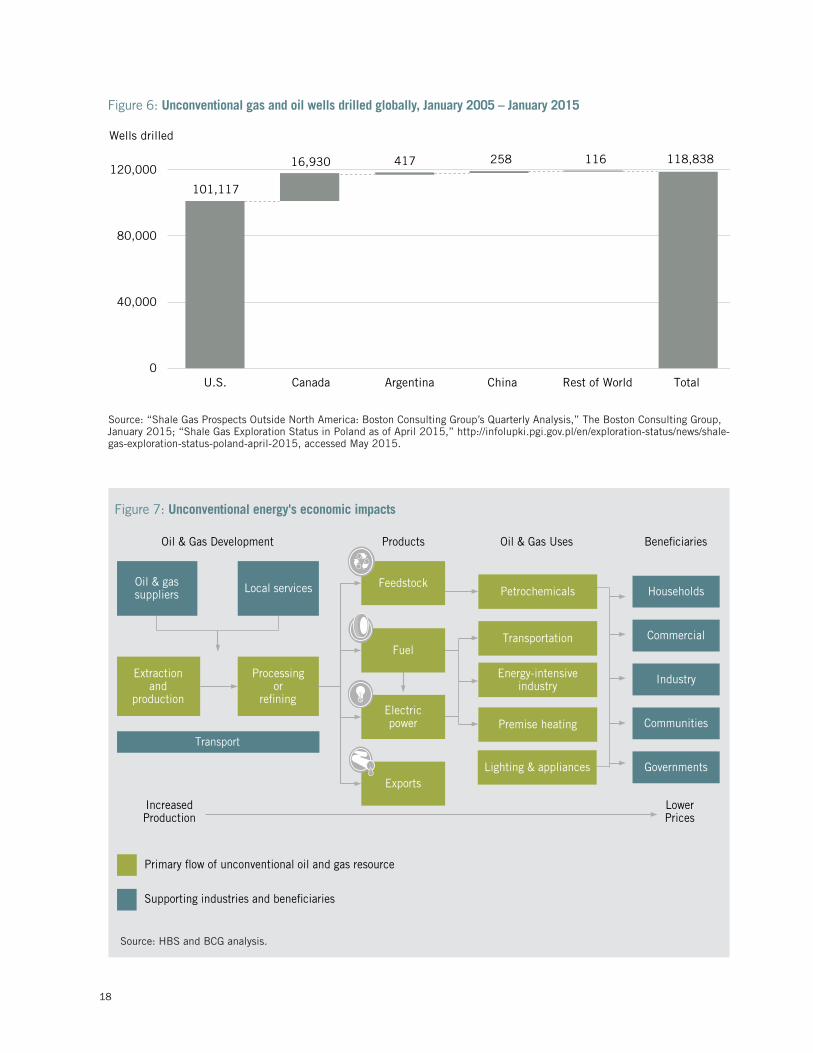
and China are the only other countries that have even begun commercial unconventionals production, but at far smaller levels. (See Figure 6 on page 18.) Some countries other than the U.S. also have significant levels of unconventional gas and oil resources and are investing in their development,45 but they often lack critical U.S. strengths. China, for example, has more difficult geology than the U.S., little natural-gas infrastructure, reserves that are distant from major markets, and limited water supplies required for large-scale production. China produced just 1.2 billion cubic meters (bcm) of unconventional natural gas in 2014, less than 20% of what was targeted in its original development plan created in 2012.46
THE ECONOMIC BENEFITS Oil and gas have a broad and multifaceted impact on the U.S. economy. (See Figure 7 on page 18.) The production and processing of oil and gas involves multiple industries, including producers, oil field service contractors, transportation companies, and refiners. Oil and gas can then be exported or converted into feedstocks, fuel, or power for use in downstream industries. In 2014, 32% of natural gas went to industrial uses, 31% to power generation, 18% to residential heating and cooking, 12% to heating commercial buildings, 3% to petrochemicals, and 3% to transportation.47 Many of those uses will grow substantially as natural gas continues to be more competitive than its alternatives.
Oil’s use is far more concentrated: 70% is used for transportation, 24% for industrial purposes, and 6% for residential and commercial purposes, mainly heating and cooking.48
Figure 5: Indexed average industrial natural gas prices (2013) for top manufactured goods exporters (U.S.=100)
100
286317 318
413
286 273242
78 69100 110
191
276
441
334
197
88
261
332
233
100
Cze
chR
epub
lic
Pol
and
Thai
land
Sw
itze
rlan
d
Spa
in
Can
ada
Uni
ted
Kin
gdomItal
y
Fran
ce
Sou
th K
orea
Japa
n
U.S
.
Ger
man
y
Chi
na
Rus
sia
Mex
ico
Indi
a
Aus
tral
ia
Indo
nesi
a
Sw
eden
Bra
zil
69
Source: Harold L. Sirkin, Michael Zinser, and Justin Rose, “The U.S. as One of the Developed World’s Lowest-Cost Manufacturers: Behind the American Export Surge,” The Boston Consulting Group, August 20, 2013, p. 6, https://www.bcgperspectives.com/content/articles/lean_manufacturing_sourcing_procurement_behind_american_export_surge, accessed May 2015.
18
Figure 7: Unconventional energy's economic impacts
Feedstock
Extractionand
production
Processingor
refining
Oil & gas suppliers
Transport
Exports
Petrochemicals
Fuel
Oil & Gas Development
IncreasedProduction
LowerPrices
Local services
Energy-intensive industry
Transportation
Premise heating
Households
Commercial
Industry
Products Oil & Gas Uses Beneficiaries
Electricpower
Lighting & appliances
Communities
Governments
Primary flow of unconventional oil and gas resource
Supporting industries and beneficiaries
Figure 6: Unconventional gas and oil wells drilled globally, January 2005 – January 2015
101,117
16,930 417 258 116 118,838
0
40,000
80,000
120,000
Rest of WorldChinaArgentinaCanadaU.S.
Wells drilled
Total
Source: “Shale Gas Prospects Outside North America: Boston Consulting Group’s Quarterly Analysis,” The Boston Consulting Group, January 2015; “Shale Gas Exploration Status in Poland as of April 2015,” http://infolupki.pgi.gov.pl/en/exploration-status/news/shale-gas-exploration-status-poland-april-2015, accessed May 2015.
Source: HBS and BCG analysis.
AMERICA'S UNCONVENTIONAL ENERGY OPPORTUNITY 19
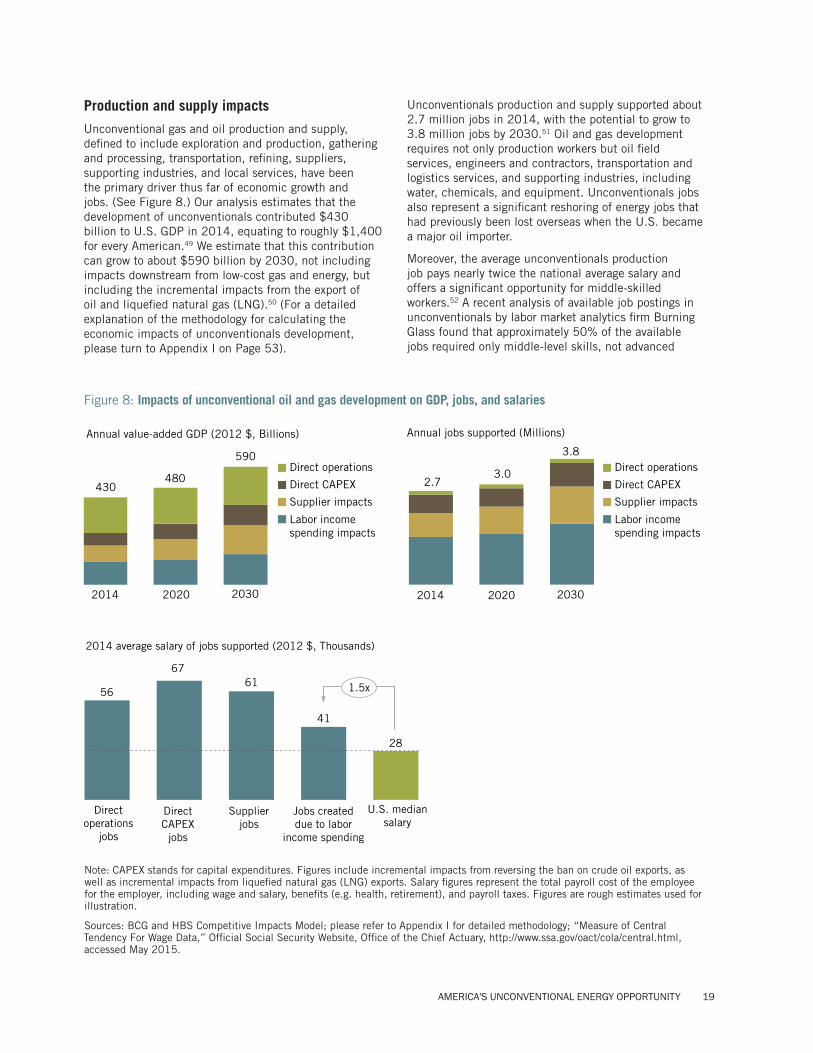
Production and supply impacts
Unconventional gas and oil production and supply, defined to include exploration and production, gathering and processing, transportation, refining, suppliers, supporting industries, and local services, have been the primary driver thus far of economic growth and jobs. (See Figure 8.) Our analysis estimates that the development of unconventionals contributed $430 billion to U.S. GDP in 2014, equating to roughly $1,400 for every American.49 We estimate that this contribution can grow to about $590 billion by 2030, not including impacts downstream from low-cost gas and energy, but including the incremental impacts from the export of oil and liquefied natural gas (LNG).50 (For a detailed explanation of the methodology for calculating the economic impacts of unconventionals development, please turn to Appendix I on Page 53).
Unconventionals production and supply supported about 2.7 million jobs in 2014, with the potential to grow to 3.8 million jobs by 2030.51 Oil and gas development requires not only production workers but oil field services, engineers and contractors, transportation and logistics services, and supporting industries, including water, chemicals, and equipment. Unconventionals jobs also represent a significant reshoring of energy jobs that had previously been lost overseas when the U.S. became a major oil importer.
Moreover, the average unconventionals production job pays nearly twice the national average salary and offers a significant opportunity for middle-skilled
workers.52 A recent analysis of available job postings in unconventionals by labor market analytics firm Burning Glass found that approximately 50% of the available jobs required only middle-level skills, not advanced
Figure 8: Impacts of unconventional oil and gas development on GDP, jobs, and salaries
U.S. median salary
28
Jobs created due to labor
income spending
41
Supplierjobs
61
Direct CAPEX
jobs
67
Direct operations
jobs
56
2014 average salary of jobs supported (2012 $, Thousands)
1.5x
2030
590
2020
480
2014
430
Labor income spending impacts
Supplier impacts
Direct CAPEX
Direct operations
Annual value-added GDP (2012 $, Billions) Annual jobs supported (Millions)
2030
3.8
2020
3.0
2014
2.7
Labor income spending impacts
Supplier impacts
Direct CAPEX
Direct operations
Note: CAPEX stands for capital expenditures. Figures include incremental impacts from reversing the ban on crude oil exports, as well as incremental impacts from liquefied natural gas (LNG) exports. Salary figures represent the total payroll cost of the employee for the employer, including wage and salary, benefits (e.g. health, retirement), and payroll taxes. Figures are rough estimates used for illustration.
Sources: BCG and HBS Competitive Impacts Model; please refer to Appendix I for detailed methodology; “Measure of Central Tendency For Wage Data,” Official Social Security Website, Office of the Chief Actuary, http://www.ssa.gov/oact/cola/central.html, accessed May 2015.
20
education and training.53 As discussed in Chapter 2, the lack of enough middle-skills jobs paying a good wage and supporting a middle-class income has been a critical weakness in the U.S. Energy jobs, then, are vital for reversing the decline in middle-class opportunity. (For a detailed explanation of the methodology used to analyze the unconventionals job market, please turn to Appendix II on Page 56).
Upstream unconventionals development is also an important catalyst for broader community development, including local services such as restaurants, financial services, housing, and entertainment. Each direct production job supports about two other jobs in the rest of the economy.54
User impacts
Unconventionals also create significant energy-cost and input-cost advantages for many users of oil and gas products. Those benefits are particularly large in petrochemicals and energy-intensive industries, though these low-energy cost benefits also flow to virtually all industries at some level. Such downstream advantages created by unconventionals are only just beginning to be realized.
Petrochemicals. Oil and gas are the main feedstocks for the petrochemical industry, an $80 billion sector in the U.S.55 and $560 billion globally.56 Petrochemical companies convert gas and oil into the base chemicals used in plastics, fertilizers, and a wide array of other products. Low-cost natural gas is a major competitive advantage for U.S. petrochemical producers, especially in producing natural gas-derived ethylene. BCG’s Made in America, Again research estimates that low-cost gas reduces total manufacturing costs for U.S. chemicals players by 8%, relative to their costs prior to unconventionals.57
Prior to the development of unconventionals, investment in the U.S. petrochemical industry had virtually dried up.58 Over the last five years, however, more than 220 new petrochemicals, chemicals, and plastics plants, as well as plants for other derivative products, have been announced in the U.S., representing approximately $138 billion in planned investment.59 Of that, estimates show that planned investment in petrochemicals and
chemicals accounts for more than $40 billion.60 Those investments are especially transforming the Gulf Coast, where many new plants from the initial wave will be located.61 For example, Sasol broke ground on an $8.1 billion world-scale ethane cracker facility at Lake Charles, Louisiana, in March 2015.62 Over time, growth in petrochemicals will likely also extend to Pennsylvania and other sites near the Marcellus Shale in the Appalachian Basin.63 While the recent drop in oil prices has slowed some of that growth, we believe that the huge U.S. cost advantage will drive significant petrochemicals expansion over the coming decade.
Plastics. Low feedstock costs are making the U.S. a far more attractive location for plastics producers. Since 2010, the American Chemistry Council estimates that nearly $47 billion will be invested in resin, compounding and ancillary chemicals (such as additives and colorants), and products over the next decade.64
Power. Natural gas now makes up more than 27% of U.S. power generation, up from 19% in 2005.65 Natural gas-fired power has substituted for coal-fired power, driven primarily by favorable economics, and has created a significant electricity cost advantage versus other industrialized nations.
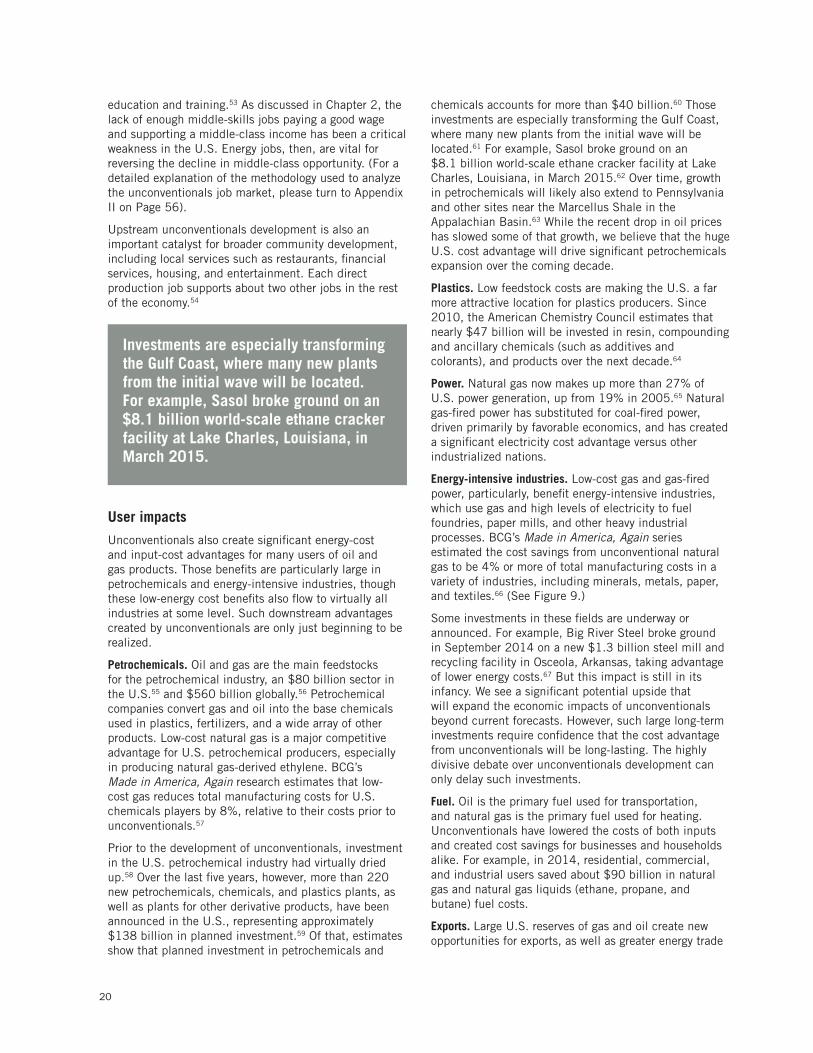
Energy-intensive industries. Low-cost gas and gas-fired power, particularly, benefit energy-intensive industries, which use gas and high levels of electricity to fuel foundries, paper mills, and other heavy industrial processes. BCG’s Made in America, Again series estimated the cost savings from unconventional natural gas to be 4% or more of total manufacturing costs in a variety of industries, including minerals, metals, paper, and textiles.66 (See Figure 9.)
Some investments in these fields are underway or announced. For example, Big River Steel broke ground in September 2014 on a new $1.3 billion steel mill and recycling facility in Osceola, Arkansas, taking advantage of lower energy costs.67 But this impact is still in its infancy. We see a significant potential upside that will expand the economic impacts of unconventionals beyond current forecasts. However, such large long-term investments require confidence that the cost advantage from unconventionals will be long-lasting. The highly divisive debate over unconventionals development can only delay such investments.
Fuel. Oil is the primary fuel used for transportation, and natural gas is the primary fuel used for heating. Unconventionals have lowered the costs of both inputs and created cost savings for businesses and households alike. For example, in 2014, residential, commercial, and industrial users saved about $90 billion in natural gas and natural gas liquids (ethane, propane, and butane) fuel costs.
Exports. Large U.S. reserves of gas and oil create new opportunities for exports, as well as greater energy trade
Investments are especially transforming the Gulf Coast, where many new plants from the initial wave will be located. For example, Sasol broke ground on an $8.1 billion world-scale ethane cracker facility at Lake Charles, Louisiana, in March 2015.
AMERICA'S UNCONVENTIONAL ENERGY OPPORTUNITY 21
among states. U.S. exports of crude oil and liquefied natural gas currently are very limited due to out-of-date policies but represent a major new opportunity for economic growth.
Natural Gas Exports: For the first time in decades, the U.S. produces more low-cost natural gas than it can consume and also enjoys large reserves for future production. That has created the opportunity for LNG exports to European and Asian markets. Such exports will require multibillion-dollar investments in export terminals, as the U.S. currently only has LNG import terminals and a slate of U.S. LNG export terminals are currently being planned or under construction in 2015. Cheniere Energy’s LNG export terminal in Louisiana is the first one, and is nearing completion. Sempra Energy has a terminal under construction in Louisiana as well. Eighteen companies have filed LNG export proposals with the Federal Energy Regulatory Commission (FERC), while 40 companies have applied for Department of Energy (DOE) export permits, both of which are required steps for any export activity.68
The potential size of the LNG export market is uncertain, but we estimate that in a favorable price environment, it could reach 3.1 trillion cubic feet (Tcf) by 2030, or 14% of total U.S. production, and contribute an additional $18 billion in GDP.69 That potential may be dampened somewhat if low world oil prices persist. While U.S. export contracts are priced based on U.S. domestic prices (Henry Hub), most LNG export contracts outside the U.S. peg their pricing to world oil pricing.
Low current oil prices have, therefore, made U.S. LNG exports relatively less economical in the short term.70
Oil Exports: There is a sizable market abroad for the light-grade crude oil produced in U.S. unconventional basins. Today, the U.S. has a domestic mismatch in the types of crude produced from U.S. basins and the crude types required by U.S. refiners. Unconventionals skew U.S. supply toward light grades, but U.S. refineries have been built to operate with a mix of light and heavy crude oils. Currently, however, exports of crude oil are restricted by federal law, which forces U.S. refineries to adjust away from their optimal mix of crude grades in order to accommodate the overabundance of U.S. light-grade oil. That has created an artificial discount for light grades that reduces U.S. income.
Opening up exports would allow a better U.S. balance in crude grades and would bring domestic oil prices in line with world market prices, which would increase the value of oil produced in the U.S. Exports will also create an incentive for increased U.S. production, which will be especially important if low oil prices persist. There are also opportunities to better trade oil among U.S. states if ocean shipping costs, now artificially inflated, are reduced. We will discuss the legal and regulatory barriers to LNG and crude oil exports in a later section.
Figure 9: Downstream cost advantages from unconventionals in selected industries
97 6 5 5
3 3 2
17
1210 10
86 6
4
Natural gas and electricity costs as a % of total pre-unconventionals manufacturing costs
-8%
-5%-5% -4%
-4%
-3% -3%-2%
Post-unconventionals
Pre-unconventionals
Chemicals Non-metalminerals
Metals Paper Textiles Wood Plastics Food
Percentage point reduction
Note: Manufacturing costs include all raw materials through all production processes with overhead included.
Source: Harold L. Sirkin, Michael Zinser, and Justin Rose, “The U.S. as One of the Developed World’s Lowest-Cost Manufacturers: Behind the American Export Surge,” The Boston Consulting Group, August 20, 2013, https://www.bcgperspectives.com/content/articles/lean_manufacturing_sourcing_procurement_behind_american_export_surge, accessed May 2015.
22
Other beneficiaries
Unconventionals also benefit households, local governments, the federal government, and communities due to lower costs, increased tax revenues, and spillover benefits to other local businesses.
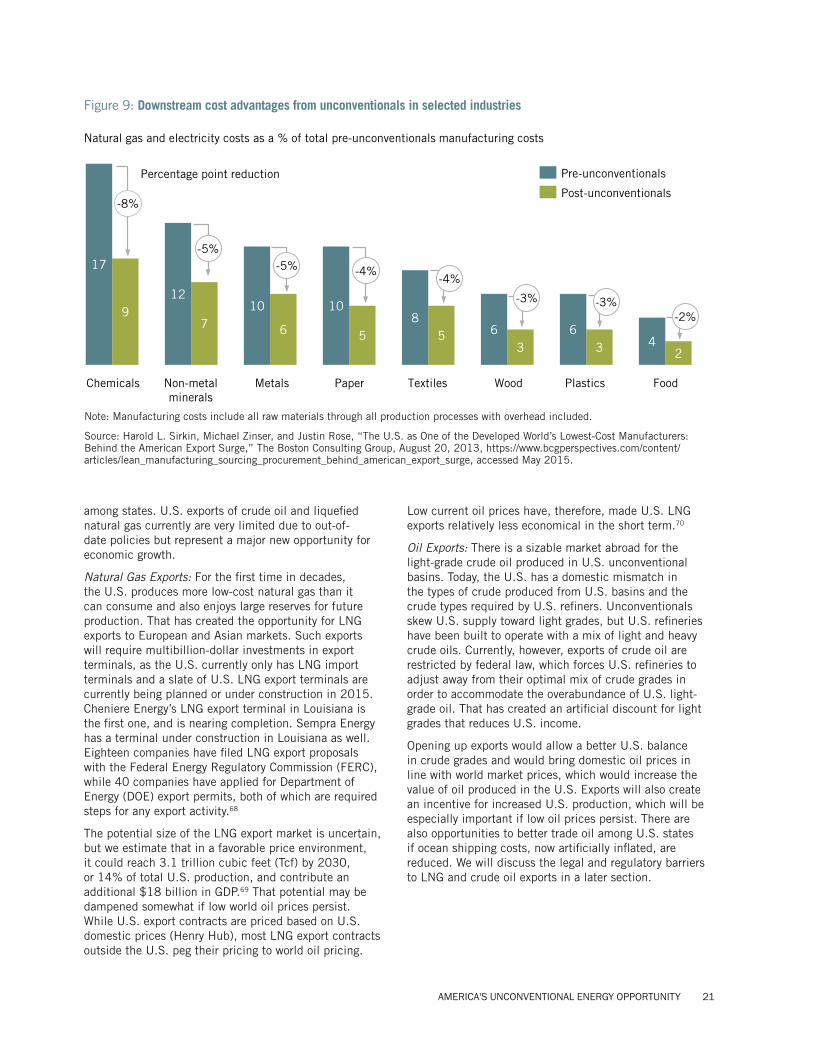
Households. Consumers across America are major beneficiaries of unconventionals, extending well beyond just the regions where significant production or conversion of gas and oil is occurring. BCG’S Made in America, Again series estimated that the average U.S. residential household has enjoyed nearly $800 in annual savings from the availability of low-priced unconventional natural gas. (See Figure 10.) That includes direct savings on household utility bills for electricity and heating, as well as savings from lower-cost goods and transport. Those estimates do not factor in the recent decline in oil prices that are also due in part to U.S. unconventional oil production. The DOE estimates that the fall in oil prices will save the average household an additional $750 in gasoline bills in 2015, compared with 2014.71
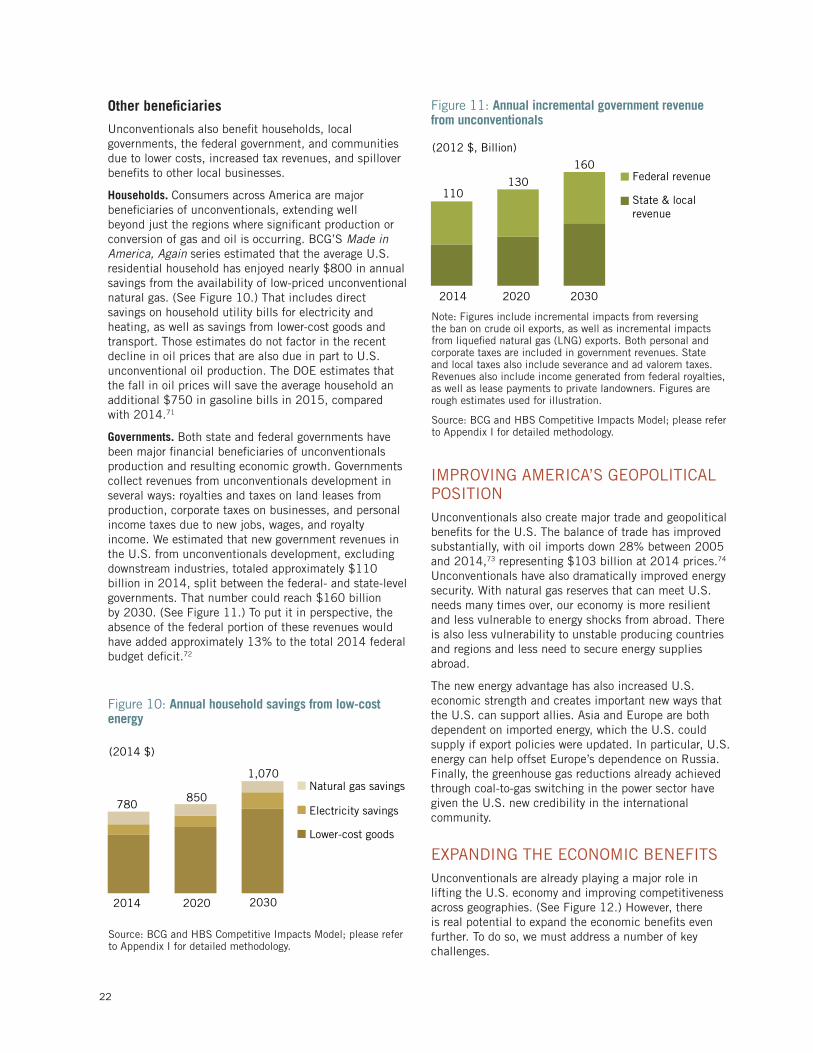
Governments. Both state and federal governments have been major financial beneficiaries of unconventionals production and resulting economic growth. Governments collect revenues from unconventionals development in several ways: royalties and taxes on land leases from production, corporate taxes on businesses, and personal income taxes due to new jobs, wages, and royalty income. We estimated that new government revenues in the U.S. from unconventionals development, excluding downstream industries, totaled approximately $110 billion in 2014, split between the federal- and state-level governments. That number could reach $160 billion by 2030. (See Figure 11.) To put it in perspective, the absence of the federal portion of these revenues would have added approximately 13% to the total 2014 federal budget deficit.72
IMPROVING AMERICA’S GEOPOLITICAL POSITIONUnconventionals also create major trade and geopolitical benefits for the U.S. The balance of trade has improved substantially, with oil imports down 28% between 2005 and 2014,73 representing $103 billion at 2014 prices.74 Unconventionals have also dramatically improved energy security. With natural gas reserves that can meet U.S. needs many times over, our economy is more resilient and less vulnerable to energy shocks from abroad. There is also less vulnerability to unstable producing countries and regions and less need to secure energy supplies abroad.
The new energy advantage has also increased U.S. economic strength and creates important new ways that the U.S. can support allies. Asia and Europe are both dependent on imported energy, which the U.S. could supply if export policies were updated. In particular, U.S. energy can help offset Europe’s dependence on Russia. Finally, the greenhouse gas reductions already achieved through coal-to-gas switching in the power sector have given the U.S. new credibility in the international community.
EXPANDING THE ECONOMIC BENEFITSUnconventionals are already playing a major role in lifting the U.S. economy and improving competitiveness across geographies. (See Figure 12.) However, there is real potential to expand the economic benefits even further. To do so, we must address a number of key challenges.
(2014 $)
1,070
850780
Lower-cost goods
Electricity savings
Natural gas savings
203020202014
(2012 $, Billion)
203020202014
160
130110 State & local
revenue
Federal revenue
Figure 10: Annual household savings from low-cost energy
Figure 11: Annual incremental government revenue from unconventionals
Note: Figures include incremental impacts from reversing the ban on crude oil exports, as well as incremental impacts from liquefied natural gas (LNG) exports. Both personal and corporate taxes are included in government revenues. State and local taxes also include severance and ad valorem taxes. Revenues also include income generated from federal royalties, as well as lease payments to private landowners. Figures are rough estimates used for illustration.
Source: BCG and HBS Competitive Impacts Model; please refer to Appendix I for detailed methodology.
Source: BCG and HBS Competitive Impacts Model; please refer to Appendix I for detailed methodology.
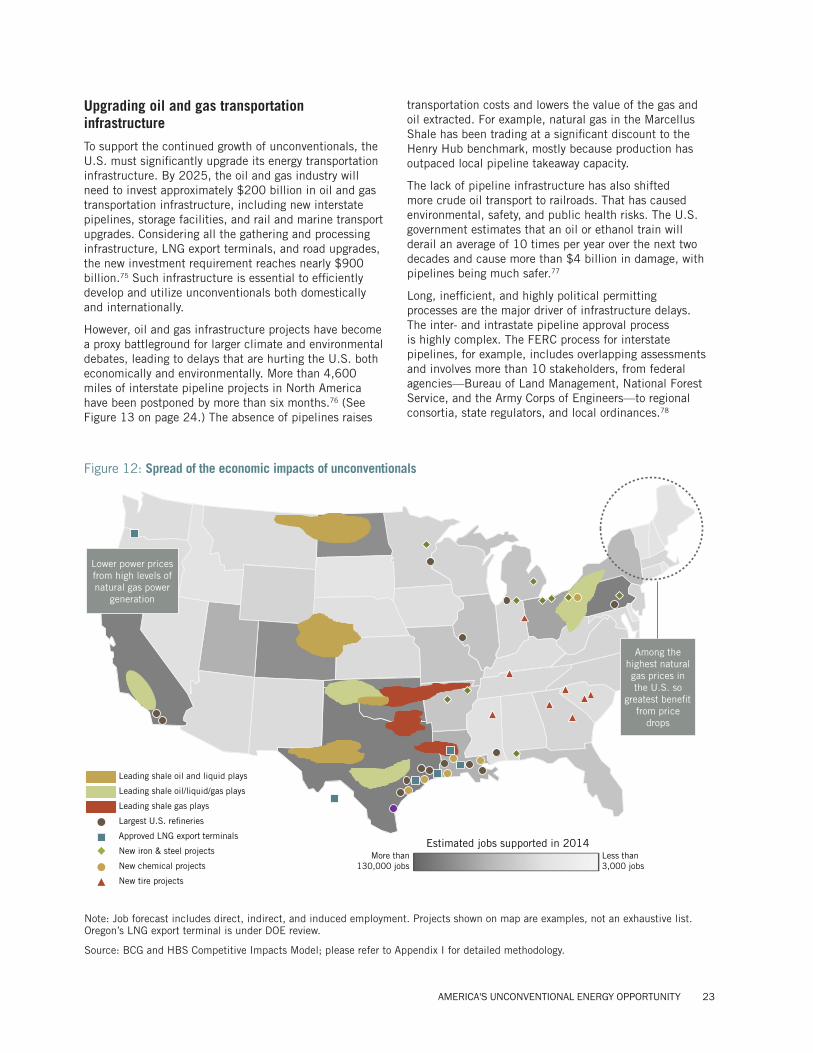
AMERICA'S UNCONVENTIONAL ENERGY OPPORTUNITY 23
Upgrading oil and gas transportation infrastructure
To support the continued growth of unconventionals, the U.S. must significantly upgrade its energy transportation infrastructure. By 2025, the oil and gas industry will need to invest approximately $200 billion in oil and gas transportation infrastructure, including new interstate pipelines, storage facilities, and rail and marine transport upgrades. Considering all the gathering and processing infrastructure, LNG export terminals, and road upgrades, the new investment requirement reaches nearly $900 billion.75 Such infrastructure is essential to efficiently develop and utilize unconventionals both domestically and internationally.
However, oil and gas infrastructure projects have become a proxy battleground for larger climate and environmental debates, leading to delays that are hurting the U.S. both economically and environmentally. More than 4,600 miles of interstate pipeline projects in North America have been postponed by more than six months.76 (See Figure 13 on page 24.) The absence of pipelines raises
transportation costs and lowers the value of the gas and oil extracted. For example, natural gas in the Marcellus Shale has been trading at a significant discount to the Henry Hub benchmark, mostly because production has outpaced local pipeline takeaway capacity.
The lack of pipeline infrastructure has also shifted more crude oil transport to railroads. That has caused environmental, safety, and public health risks. The U.S. government estimates that an oil or ethanol train will derail an average of 10 times per year over the next two decades and cause more than $4 billion in damage, with pipelines being much safer.77
Long, inefficient, and highly political permitting processes are the major driver of infrastructure delays. The inter- and intrastate pipeline approval process is highly complex. The FERC process for interstate pipelines, for example, includes overlapping assessments and involves more than 10 stakeholders, from federal agencies—Bureau of Land Management, National Forest Service, and the Army Corps of Engineers—to regional consortia, state regulators, and local ordinances.78
Figure 12: Spread of the economic impacts of unconventionals
Among the highest natural gas prices in the U.S. so
greatest benefit from price
drops
Less than 3,000 jobs
More than 130,000 jobs
Lower power prices from high levels of natural gas power
generation
New tire projects
New chemical projects
New iron & steel projects
Largest U.S. refineries
Leading shale gas plays
Leading shale oil/liquid/gas plays
Leading shale oil and liquid plays
Approved LNG export terminalsEstimated jobs supported in 2014
Note: Job forecast includes direct, indirect, and induced employment. Projects shown on map are examples, not an exhaustive list. Oregon’s LNG export terminal is under DOE review.
Source: BCG and HBS Competitive Impacts Model; please refer to Appendix I for detailed methodology.
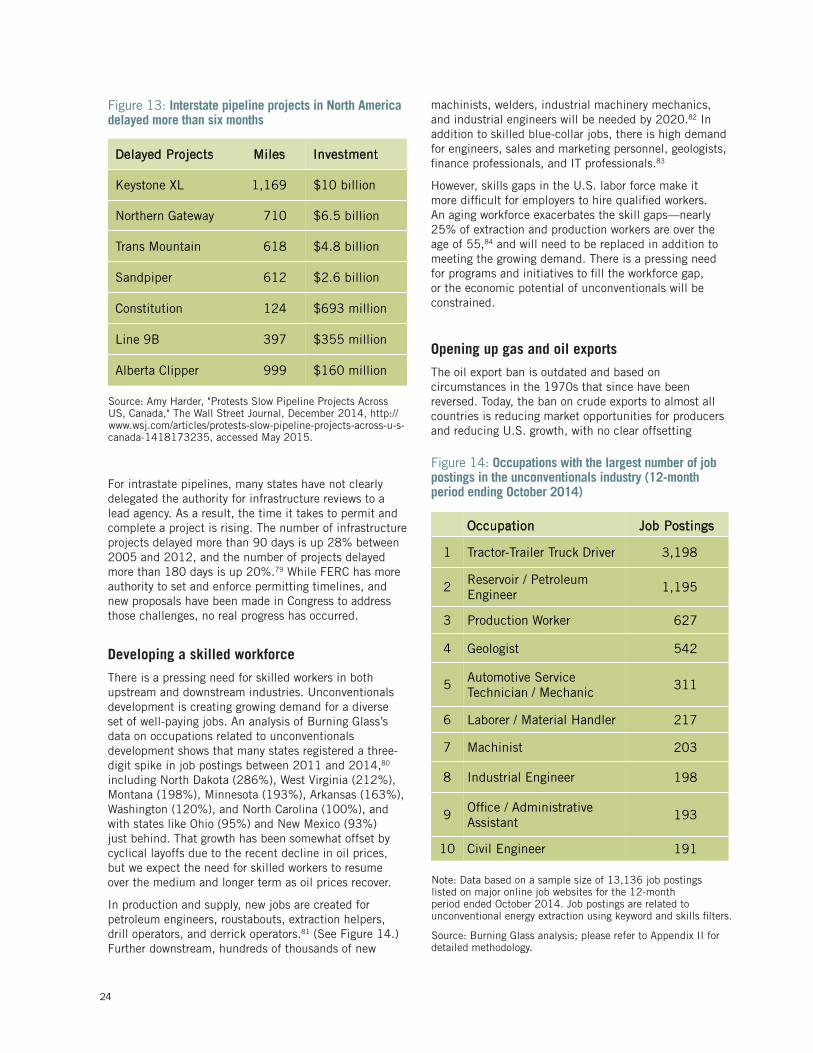
24
For intrastate pipelines, many states have not clearly delegated the authority for infrastructure reviews to a lead agency. As a result, the time it takes to permit and complete a project is rising. The number of infrastructure projects delayed more than 90 days is up 28% between 2005 and 2012, and the number of projects delayed more than 180 days is up 20%.79 While FERC has more authority to set and enforce permitting timelines, and new proposals have been made in Congress to address those challenges, no real progress has occurred.
Developing a skilled workforce
There is a pressing need for skilled workers in both upstream and downstream industries. Unconventionals development is creating growing demand for a diverse set of well-paying jobs. An analysis of Burning Glass’s data on occupations related to unconventionals development shows that many states registered a three-digit spike in job postings between 2011 and 2014,80 including North Dakota (286%), West Virginia (212%), Montana (198%), Minnesota (193%), Arkansas (163%), Washington (120%), and North Carolina (100%), and with states like Ohio (95%) and New Mexico (93%) just behind. That growth has been somewhat offset by cyclical layoffs due to the recent decline in oil prices, but we expect the need for skilled workers to resume over the medium and longer term as oil prices recover.
In production and supply, new jobs are created for petroleum engineers, roustabouts, extraction helpers, drill operators, and derrick operators.81 (See Figure 14.) Further downstream, hundreds of thousands of new
machinists, welders, industrial machinery mechanics, and industrial engineers will be needed by 2020.82 In addition to skilled blue-collar jobs, there is high demand for engineers, sales and marketing personnel, geologists, finance professionals, and IT professionals.83
However, skills gaps in the U.S. labor force make it more difficult for employers to hire qualified workers. An aging workforce exacerbates the skill gaps—nearly 25% of extraction and production workers are over the age of 55,84 and will need to be replaced in addition to meeting the growing demand. There is a pressing need for programs and initiatives to fill the workforce gap, or the economic potential of unconventionals will be constrained.
Opening up gas and oil exports
The oil export ban is outdated and based on circumstances in the 1970s that since have been reversed. Today, the ban on crude exports to almost all countries is reducing market opportunities for producers and reducing U.S. growth, with no clear offsetting
Figure 13: Interstate pipeline projects in North America delayed more than six months
Delayed Projects Miles Investment
Keystone XL 1,169 $10 billion
Northern Gateway 710 $6.5 billion
Trans Mountain 618 $4.8 billion
Sandpiper 612 $2.6 billion
Constitution 124 $693 million
Line 9B 397 $355 million
Alberta Clipper 999 $160 million
Figure 14: Occupations with the largest number of job postings in the unconventionals industry (12-month period ending October 2014)
Occupation Job Postings
1 Tractor-Trailer Truck Driver 3,198
2 Reservoir / Petroleum Engineer 1,195
3 Production Worker 627
4 Geologist 542
5 Automotive Service Technician / Mechanic 311
6 Laborer / Material Handler 217
7 Machinist 203
8 Industrial Engineer 198
9 Office / Administrative Assistant 193
10 Civil Engineer 191
Source: Amy Harder, "Protests Slow Pipeline Projects Across US, Canada," The Wall Street Journal, December 2014, http://www.wsj.com/articles/protests-slow-pipeline-projects-across-u-s-canada-1418173235, accessed May 2015.
Note: Data based on a sample size of 13,136 job postings listed on major online job websites for the 12-month period ended October 2014. Job postings are related to unconventional energy extraction using keyword and skills filters.
Source: Burning Glass analysis; please refer to Appendix II for detailed methodology.
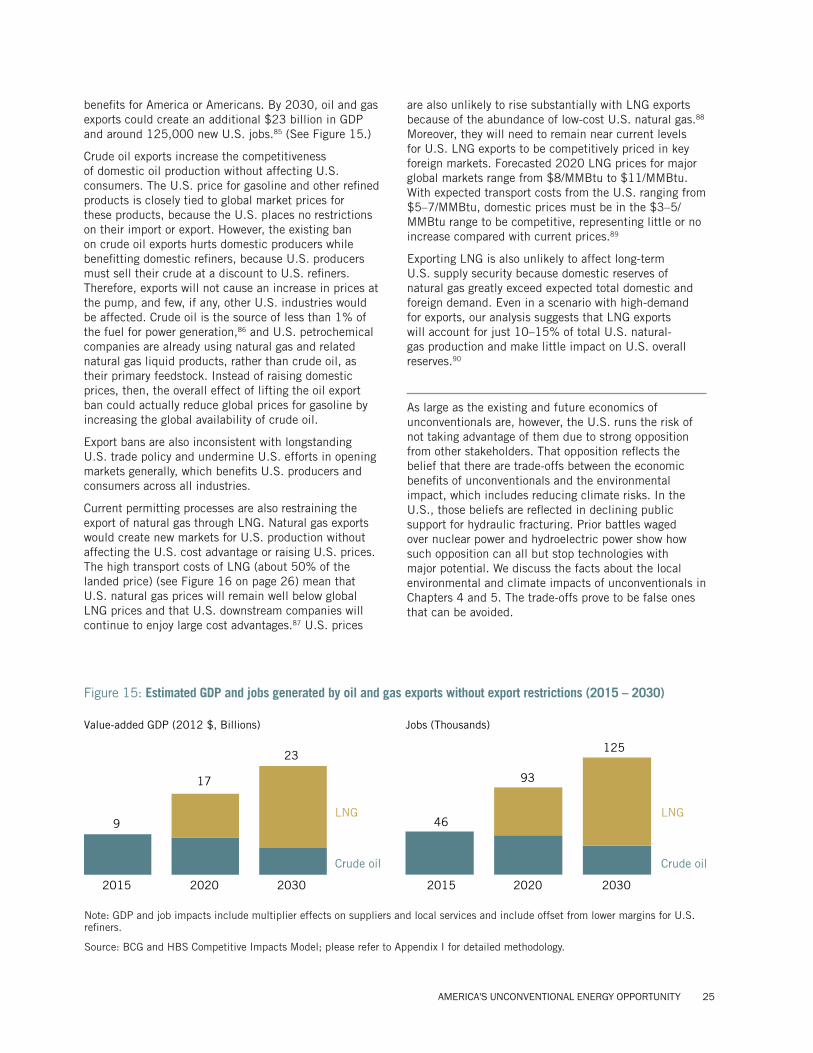
AMERICA'S UNCONVENTIONAL ENERGY OPPORTUNITY 25
benefits for America or Americans. By 2030, oil and gas exports could create an additional $23 billion in GDP and around 125,000 new U.S. jobs.85 (See Figure 15.)
Crude oil exports increase the competitiveness of domestic oil production without affecting U.S. consumers. The U.S. price for gasoline and other refined products is closely tied to global market prices for these products, because the U.S. places no restrictions on their import or export. However, the existing ban on crude oil exports hurts domestic producers while benefitting domestic refiners, because U.S. producers must sell their crude at a discount to U.S. refiners. Therefore, exports will not cause an increase in prices at the pump, and few, if any, other U.S. industries would be affected. Crude oil is the source of less than 1% of the fuel for power generation,86 and U.S. petrochemical companies are already using natural gas and related natural gas liquid products, rather than crude oil, as their primary feedstock. Instead of raising domestic prices, then, the overall effect of lifting the oil export ban could actually reduce global prices for gasoline by increasing the global availability of crude oil.
Export bans are also inconsistent with longstanding U.S. trade policy and undermine U.S. efforts in opening markets generally, which benefits U.S. producers and consumers across all industries.
Current permitting processes are also restraining the export of natural gas through LNG. Natural gas exports would create new markets for U.S. production without affecting the U.S. cost advantage or raising U.S. prices. The high transport costs of LNG (about 50% of the landed price) (see Figure 16 on page 26) mean that U.S. natural gas prices will remain well below global LNG prices and that U.S. downstream companies will continue to enjoy large cost advantages.87 U.S. prices
are also unlikely to rise substantially with LNG exports because of the abundance of low-cost U.S. natural gas.88 Moreover, they will need to remain near current levels for U.S. LNG exports to be competitively priced in key foreign markets. Forecasted 2020 LNG prices for major global markets range from $8/MMBtu to $11/MMBtu. With expected transport costs from the U.S. ranging from $5–7/MMBtu, domestic prices must be in the $3–5/MMBtu range to be competitive, representing little or no increase compared with current prices.89
Exporting LNG is also unlikely to affect long-term U.S. supply security because domestic reserves of natural gas greatly exceed expected total domestic and foreign demand. Even in a scenario with high-demand for exports, our analysis suggests that LNG exports will account for just 10–15% of total U.S. natural-gas production and make little impact on U.S. overall reserves.90
As large as the existing and future economics of unconventionals are, however, the U.S. runs the risk of not taking advantage of them due to strong opposition from other stakeholders. That opposition reflects the belief that there are trade-offs between the economic benefits of unconventionals and the environmental impact, which includes reducing climate risks. In the U.S., those beliefs are reflected in declining public support for hydraulic fracturing. Prior battles waged over nuclear power and hydroelectric power show how such opposition can all but stop technologies with major potential. We discuss the facts about the local environmental and climate impacts of unconventionals in Chapters 4 and 5. The trade-offs prove to be false ones that can be avoided.
Note: GDP and job impacts include multiplier effects on suppliers and local services and include offset from lower margins for U.S. refiners.
Source: BCG and HBS Competitive Impacts Model; please refer to Appendix I for detailed methodology.
Figure 15: Estimated GDP and jobs generated by oil and gas exports without export restrictions (2015 – 2030)
203020202015
23
17
9
Crude oil
LNG
203020202015
125
93
46
Crude oil
LNG
Value-added GDP (2012 $, Billions) Jobs (Thousands)
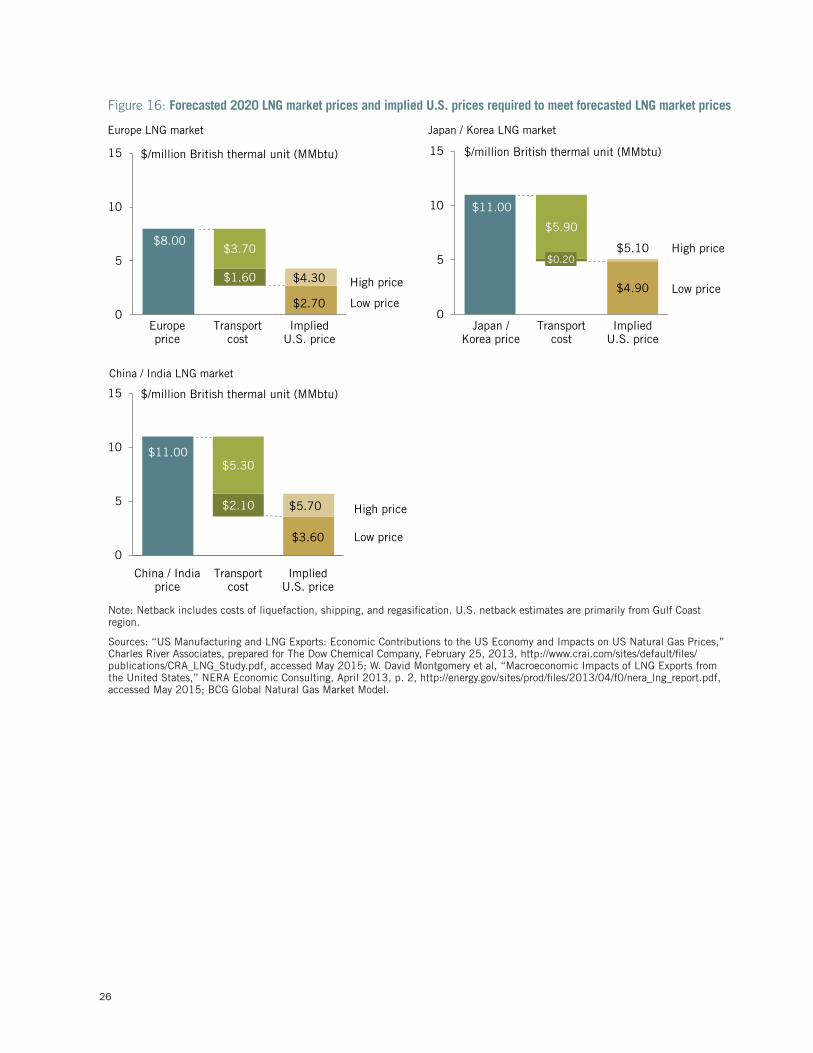
26
Figure 16: Forecasted 2020 LNG market prices and implied U.S. prices required to meet forecasted LNG market prices
$8.00
$1.60
$3.70
0
5
10
15
$4.90
$5.90
0
5
10
15 $/million British thermal unit (MMbtu)
Implied U.S. price
$5.10
Transport cost
$0.20
Japan / Korea price
$11.00
$4.30
$2.70
$2.10
$5.30
0
5
10
15
$5.70
$3.60
$11.00
High price
Low price
Japan / Korea LNG market
ImpliedU.S. price
Transport cost
Europe price
ImpliedU.S. price
Transport cost
China / India price
High price
Low price
$/million British thermal unit (MMbtu)
High price
Low price
$/million British thermal unit (MMbtu)
Europe LNG market
China / India LNG market
Note: Netback includes costs of liquefaction, shipping, and regasification. U.S. netback estimates are primarily from Gulf Coast region.
Sources: “US Manufacturing and LNG Exports: Economic Contributions to the US Economy and Impacts on US Natural Gas Prices,” Charles River Associates, prepared for The Dow Chemical Company, February 25, 2013, http://www.crai.com/sites/default/files/publications/CRA_LNG_Study.pdf, accessed May 2015; W. David Montgomery et al, “Macroeconomic Impacts of LNG Exports from the United States,” NERA Economic Consulting, April 2013, p. 2, http://energy.gov/sites/prod/files/2013/04/f0/nera_lng_report.pdf, accessed May 2015; BCG Global Natural Gas Market Model.

AMERICA'S UNCONVENTIONAL ENERGY OPPORTUNITY 27
Chapter 4:
MINIMIZING LOCAL ENVIRONMENTAL IMPACTS IN A COST-COMPETITIVE WAY
Despite its major positive economic impacts for business, government, consumers, and America’s geopolitical position, the development of unconventionals faces determined opposition. Recent polling shows a 7% decline (from 48% to 41%) in the percentage of Americans favoring “fracking” from March 2014 to November 2014, while those opposing it increased by 9% (from 38% to 47%). That 16-point swing has coincided with public action to curtail extraction of unconventionals: In Colorado, Governor John Hickenlooper brokered an agreement to remove a November 2014 ballot initiative on hydraulic fracturing, at least temporarily;92 voters in Denton, Texas, approved a ban on hydraulic fracturing in November 2014;93 New York Governor Andrew Cuomo banned fracking throughout the State of New York in December 2014;94 and the Maryland legislature voted to place a 30-month statewide ban on hydraulic fracturing in April 2015.
Such opposition is due in large part to the environmental, health, and community impacts of unconventionals development (there are also concerns driven by climate change, which will be discussed in Chapter 5). These community concerns are justified and are especially present in areas with no history of oil and gas industry development. Unconventionals do raise significant risks in multiple areas, and industry performance in addressing these risks has been highly uneven.
SIGNIFICANT ENVIRONMENTAL IMPACTSThe development of unconventionals creates significant risks in a variety of areas:
• Water issues: Well construction, chemical injections, freshwater use, and wastewater disposal create risks of freshwater depletion, groundwater contamination, radioactive contamination, and surface water pollution.
• Air pollution: Onsite diesel engines, truck traffic, wastewater storage vessels, and gas flaring create potential emissions of volatile organic chemicals (VOCs), sulfur dioxide, nitrogen oxides, and other local air pollutants.
• Seismic: Wastewater disposal wells have been associated with increased seismic events in some regions, such as Oklahoma95 and Texas.96 Disposal
wells sited near fault lines create the greatest earthquake risks.
• Land and community impacts: The rapid expansion of drilling operations and well sites can create despoiled landscapes, significant truck traffic, and visual and noise pollution in sensitive areas and near populated areas.
These environmental, public health, and community impacts vary significantly by region. Geologic conditions, the degree of water stress,* and population density, among other things, affect the techniques with which unconventionals are produced, as well as the nature and severity of the environmental and health risks. For example, the Marcellus Shale in Pennsylvania has ample availability of fresh water,97 but wastewater disposal is difficult. In contrast, the Permian Basin in Texas is located in a water-stressed region98 but has more readily available sites for water disposal.99 Best practices to address local environmental risk are not one-size-fits-all and must be tailored to circumstances. That increases the complexity of regulation and compliance, which means that states must play the leading role in regulation and enforcement.
Furthermore, the risks of unconventionals development are exacerbated by uneven industry regulatory compliance and uneven regulatory enforcement. Many of the environmental incidents most associated with unconventionals, like drinking water contamination and chemical spills, are the result of operator noncompliance, rather than insufficient regulations.
The risks of unconventionals development are exacerbated by uneven industry regulatory compliance and uneven regulatory enforcement. Many of the environmental incidents most associated with unconventionals, like drinking water contamination and chemical spills, are the result of operator noncompliance, rather than insufficient regulations.
*Water stress measures total annual withdrawals (municipal, industrial, and agricultural) expressed as a percentage of water available. (Ceres, Hydraulic Fracturing & Water Stress: Water Demand By The Numbers, p.15, February 2014.)
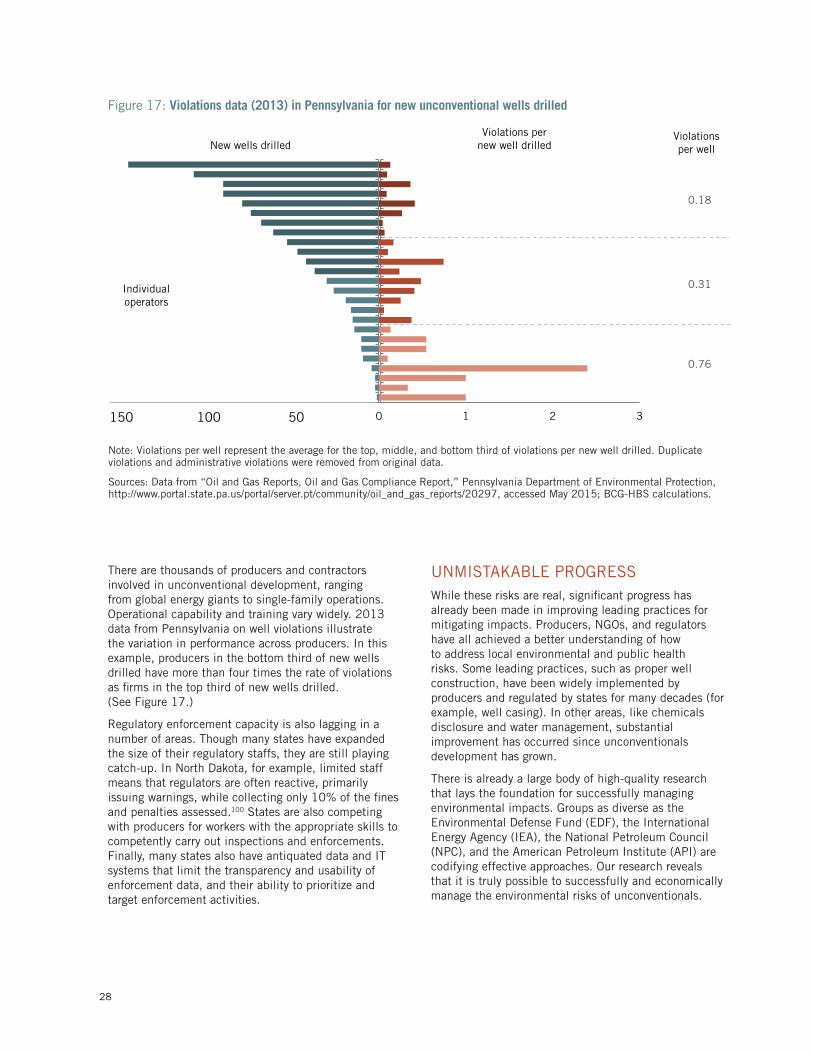
28
Figure 17: Violations data (2013) in Pennsylvania for new unconventional wells drilled
0 1 2 3
Violationsper well
0.18
0.31
0.76
Violations pernew well drilledNew wells drilled
Individual operators
150 100 50
There are thousands of producers and contractors involved in unconventional development, ranging from global energy giants to single-family operations. Operational capability and training vary widely. 2013 data from Pennsylvania on well violations illustrate the variation in performance across producers. In this example, producers in the bottom third of new wells drilled have more than four times the rate of violations as firms in the top third of new wells drilled. (See Figure 17.)
Regulatory enforcement capacity is also lagging in a number of areas. Though many states have expanded the size of their regulatory staffs, they are still playing catch-up. In North Dakota, for example, limited staff means that regulators are often reactive, primarily issuing warnings, while collecting only 10% of the fines and penalties assessed.100 States are also competing with producers for workers with the appropriate skills to competently carry out inspections and enforcements. Finally, many states also have antiquated data and IT systems that limit the transparency and usability of enforcement data, and their ability to prioritize and target enforcement activities.
UNMISTAKABLE PROGRESSWhile these risks are real, significant progress has already been made in improving leading practices for mitigating impacts. Producers, NGOs, and regulators have all achieved a better understanding of how to address local environmental and public health risks. Some leading practices, such as proper well construction, have been widely implemented by producers and regulated by states for many decades (for example, well casing). In other areas, like chemicals disclosure and water management, substantial improvement has occurred since unconventionals development has grown.
There is already a large body of high-quality research that lays the foundation for successfully managing environmental impacts. Groups as diverse as the Environmental Defense Fund (EDF), the International Energy Agency (IEA), the National Petroleum Council (NPC), and the American Petroleum Institute (API) are codifying effective approaches. Our research reveals that it is truly possible to successfully and economically manage the environmental risks of unconventionals.
Note: Violations per well represent the average for the top, middle, and bottom third of violations per new well drilled. Duplicate violations and administrative violations were removed from original data.
Sources: Data from “Oil and Gas Reports, Oil and Gas Compliance Report,” Pennsylvania Department of Environmental Protection, http://www.portal.state.pa.us/portal/server.pt/community/oil_and_gas_reports/20297, accessed May 2015; BCG-HBS calculations.
AMERICA'S UNCONVENTIONAL ENERGY OPPORTUNITY 29
Industry innovation
The API standards process, accredited by the American National Standards Institute (ANSI), is the definitive process for developing technical standards for the oil and gas industry. Since 2009, API has added six hydraulic-fracturing standards: in well construction, water management, mitigating surface impacts, environmental protection, isolating flow zones, and community engagement.101 These standards are disseminated across the industry and serve as a benchmark for improving performance.
The more sophisticated producers have already adopted these and other leading practices, and the state of the art is rapidly advancing. Leaders have pioneered and adopted many of the cutting-edge environmental mitigation techniques and see it as good business in order to reduce costs, capture lost production, and build productive relationships in the communities in which they operate. In response to concerns in Colorado about the community impacts of unconventionals development, for example, Noble Energy and Anadarko are rolling out remote well pad servicing. Anadarko estimates that its efforts alone have reduced well pad sizes by 40% and eliminated approximately 300,000 truck-trips annually.102 Water recycling has also become a big point of emphasis for operators to improve environmental performance while reducing costs. Range Resources, for example, pioneered flowback water recycling in 2009 and by 2013 used recycled water for most of its well completions, accounting for 30–40% of its water usage in Pennsylvania.103
Improving regulation
Regulators are also learning rapidly and taking steps to address many of the risks of unconventionals development. They have significantly improved rules since 2010. Prior to 2010, regulators in many states, especially those without a history of conventional oil and gas activities, were not prepared to deal with the rapid growth of drilling and hydraulic fracturing activity for unconventionals. Over the last five years, however, most states have put better regulatory frameworks in place. Even states with little to no prior drilling activity have enacted broad regulatory oversight that addresses water issues, well location requirements, and other drilling aspects (for example Ohio, West Virginia, and Pennsylvania).104 Established oil states have also improved the regulatory framework for hydraulic fracturing (for example., Texas, Colorado, Arkansas, and Montana).105 Now, 27 states have rules in place to regulate the use and disclosure of hydraulic fracturing chemicals. Ten of the 12 states catalogued by LawAtlas’ Policy Surveillance Portal have air quality regulations governing well site setbacks from other activity and rules mandating leak detection and repair (LDAR) programs.106
A successful example of producers and regulators working together to improve water recycling rates is in the Eagle Ford Shale, Texas, basin, a water-scarce region. Water recycling rates in the region have increased from less than 1% five years ago to 30% today and are expected to reach 50% or more in the next five years. The increase is attributable to new approaches and technologies by producers, as well as changes to regulations by the Texas Railroad Commission, to make it easier to recycle.107
Leading states have even made progress in addressing emerging risks like induced seismicity. For example, the Texas Railroad Commission introduced new regulations in October 2014 that require applicants for injection well permits to determine the seismic history within 100 square miles of the proposed well and to disclose water disposal volumes.108 Ohio regulators tightened permitting rules for drilling near fault lines or in areas with a history of seismic activity.109
Continuous improvement efforts
A number of organizations dedicated to continuous improvement in practices and regulation have been formed or strengthened to support innovation in unconventionals. Those include longstanding industry bodies, such as the API, which updates its industry technical standards on a regular basis through a process that includes both industry participants and other individuals or organizations that have a direct and material interest in the development of oil and gas resources, including government, academia, and NGOs. The Interstate Oil and Gas Compact Commission (IOGCC), led by the governors of 30 member states, and the State Review of Oil and Natural Gas Environmental Regulations (STRONGER), consisting of government, industry, and NGO representatives, are bodies designed to share best practices and review and compare regulations across jurisdictions.110
FracFocus, a national hydraulic fracturing chemical registry managed by the Ground Water Protection Council (GWPC) and the IOGCC, was created to encourage the disclosure of the chemicals used in hydraulic fracturing. That effort has achieved remarkable success, with 18 states now mandating the use of the FracFocus database and more than 94,000 wells listed on the site.111 The Center for Sustainable Shale Development (CSSD) is dedicated to setting performance standards for the Appalachian Basin, primarily in Pennsylvania, West Virginia, and Ohio, and now has accredited its first three operators—Chevron, Shell, and CONSOL Energy—for meeting its standards.112 The Colorado Oil & Gas Task Force, formed by the Governor and consisting of 19 local government, industry, agriculture, NGO, and community representatives, formulates recommendations to balance Colorado land-use issues in ways that minimize conflicts, allow access to private mineral rights, and protect communities.113

30
ENVIRONMENTAL PROTECTION WHILE PRESERVING COMPETITIVENESSDespite the progress made, there is a common perception that environmental protection can only be achieved at high and potentially prohibitive costs to producers. As a consequence, there has been strong resistance in the industry to regulation, with opponents arguing that such standards are too costly and will make U.S. unconventionals uncompetitive.
Our research reveals that, in fact, there is not an inherent trade-off between environmental protection and profitability. We find that some techniques to mitigate the environmental impacts of unconventionals are actually cost saving. That is because they reduce producers’ use of costly inputs (for example, water recycling) or allow producers to capture more gas or oil (for example, reduced flaring). In other areas,
environmental standards do involve cost, especially in the short run. However, our research shows that the net costs are a small portion of the lifetime revenues and costs of operating a well.
To understand the cost of robust environmental protection, we examined Pennsylvania’s Marcellus Shale as a case study. We analyzed the environmental performance standards developed by the Center for Sustainable Shale Development (CSSD), which consist of 15 standards designed to be clear, consensus-driven, and performance-based.114 The standards were developed in a joint effort by industry members, the NGO community, and policy makers in the Appalachian Basin, and they cover wastewater, pits and impounds, ground water, and air pollution. The CSSD’s standards go beyond current Pennsylvania laws and are meant to be leading-edge performance benchmarks for robust environmental protection.
Figure 18: Estimated incremental costs to meet CSSD standards
85
150
25045
120
185
0
100
200
300
400
500
~435
Air
~270
Ground water
~130
Pits / Impounds
~35
1520
Wastewater
0
Cost per well ($, Thousands)
Total
Low cost estimate
High cost estimate
No incremental cost due to reduction in transportation & disposal costs from water recycling/re-use (unique to Marcellus Basin, which has very few water disposal wells)
Total well lifetime production (median)* ~8,000,000 MMbtu
Additional cost of CSSD per lifetime MMbtu* ~$0.05
Additional cost as % of expected lifetime revenue** 1-2%
*Assumes a well expected ultimate recovery (EUR) of 7,938,451,950 MMbtu, cost of meeting standards at $435k. Well EUR is a median value of a Marcellus operator and is variable; 25th to 75th percentile EURs range from 6,200,000 MMbtu to 9,700,000 MMbtu.
**Assumes a Henry Hub spot price of $3.78/MMbtu as of October 2014. Though some areas of the Marcellus Shale are experiencing prices discounted from Henry Hub due to infrastructure constraints, this discount should ease as the constraints are addressed.
Source: BCG and HBS analysis; please refer to Appendix III for detailed methodology.
AMERICA'S UNCONVENTIONAL ENERGY OPPORTUNITY 31
To test the effect of meeting these standards on economic competitiveness, we used the best available public sources to estimate the costs of meeting each standard, drawing on BCG’s Unconventionals Operations Database, as well as BCG’s Energy Practice’s upstream operations experts. We developed a conservative estimate by assuming that producers were not currently meeting any of the 15 standards and reviewed this with industry experts. (See Appendix III on page 56 for more detail.) Our analysis probably overstates the actual costs for the average midsize producer, however, as many producers are already meeting multiple CSSD standards in their current operations.
We found that CSSD standards can be met without materially affecting a producer’s drilling economics. Compliance costs range from $250,000 to $435,000 per well, representing less than 2% of the expected lifetime revenues from the well.115 (See Figure 18.) While that is a meaningful cost, particularly in the current low-price environment, it will not have a material impact on the competitive advantage of U.S. unconventionals versus other locations, or on the U.S. cost advantage in power generation and other downstream industries. In fact, the cost of meeting these standards is less than the daily fluctuations of the Henry Hub price of natural gas, which has averaged 2.2% over the last five years.116 With a level playing field of sound regulation and strong enforcement of compliance, individual producers are unlikely to face a significant competitive disadvantage from complying unless they are inefficient in their deployment of proven mitigation techniques.
ACCELERATING LOCAL ENVIRONMENTAL IMPROVEMENTThe U.S. can substantially reduce virtually all the major impacts of unconventionals at a modest cost. In order to do so, we need to make improvements in four main areas. First, there is a lack of sufficient environmental performance data by area. Second, there are gaps in current regulatory standards that need to be filled. Third, steps are needed to improve enforcement and achieve universal compliance, to level the playing field across producers. Finally, more coordination is needed among continuous-improvement bodies to accelerate learning and innovation.
Developing transparent and rigorous performance data
There is a lack of high-quality systematic data measuring actual environmental performance by region on the key risk areas. Without a common and transparent fact base, compliance improvement and innovation is set back. Over the course of this study, we found it difficult to establish an environmental performance fact base and
had to rely on case studies. Very few companies publish clear data on their environmental impact, leaving it to state regulators.117 However, an April 2015 report by the Natural Resources Defense Council (NRDC) and the FracTracker Alliance (FTA) found that only three of the 36 states with significant oil and gas development have publicly accessible databases on violations and spills.118 In other states, regulatory IT systems are outdated, and data sets are often unreliable.
These data gaps make it easy for both industry and environmental stakeholders to dispute and distort actual performance, rather than progress from a common starting point. NGOs and media outlets produce some data and investigative reports in an attempt to fill the gaps, but they are often focused on advocacy of a particular group or risk and lack appropriate context. Moreover, many advocacy articles use the data quite selectively.
Closing regulatory gaps
While regulations have substantially improved, gaps remain in the current regulatory framework across states. Many local and state governments can further improve some standards, especially for water life cycle management, road use and maintenance, and VOCs. Regulations also need to keep pace with new mitigation techniques and approaches.
In water management, for example, the proper treatment and disposal of wastewater continues to be an issue requiring attention. One currently debated impact is the potential for earthquakes caused by wastewater disposal wells. While some states like Texas and Ohio have taken early steps to address that issue, most states are only starting to set concrete rules and regulations. Oklahoma, the state most affected by induced seismicity, has only recently even recognized that there is a link between the wastewater injection wells and the state’s dramatic uptick in earthquakes since the early 2000s.119
An emerging issue in water management is the disposal of naturally occurring radioactive materials (NORM), primarily radium-226 and radium-228, which can be drawn up to the surface by the drilling and fracturing process.120 The Groundwater Protection Council reports that state regulations are only in the early stages of managing this potential public health risk, especially in the Appalachian Basin.121 These issues and others need to be fully understood and appropriately incorporated into the regulatory framework, reflecting the true level of risk posed.
It is also important that regulatory standards be based on performance outcomes wherever possible. Producers should have the flexibility to tailor solutions to their particular geologic and environmental circumstances, to utilize new technologies, and to be motivated to deliver continuous improvement. The best broad
32
example of such environmental regulations is the SO2 and NOx trading systems introduced by the Clean Air Act Amendments of 1990. Within oil and gas, regulators have also improved the use of performance-based standards, such as the EPA’s 2012 New Source Performance Standards and National Emission Standards for Hazardous Air Pollutants. These standards reduce VOCs from oil and gas drilling by setting key technology performance requirements.122 Such performance-based methodologies must be used to address water management and other issues.
Moving to universal compliance
Today’s uneven compliance by producers and uneven enforcement by regulators means that too many adverse environmental impacts result from operator violations. The steps required for regulators to achieve stronger enforcement and universal compliance vary by state. In some cases, inadequate staffing is the problem. Though many states have expanded the size of their regulatory staffs, they are still playing catch-up.
In other cases, regulators can use new technologies to make inspections more effective. For example, the Texas Commission on Environmental Quality (TCEQ) has started using aerial infrared cameras in the Eagle Ford Shale to detect major methane leaks and to prioritize where to send field inspection personnel.123
Modern data analytics are also a powerful tool to target the most likely violators. Colorado has taken the lead here, using a risk-based inspection strategy to prioritize inspections of equipment types with the highest spill rates versus inspecting all equipment with the same frequency.124 That allows state regulators to address the most common causes of spills with fewer resources.
The industry can also expand its role in self-enforcement. Today, compliance with API standards is voluntary, and API has no mechanism to enforce adoption. However, precedents inside and outside the oil and gas industry provide instructive examples for how producers can take a more proactive role. In chemicals, Responsible Care is a global voluntary initiative formed by the chemical industry to improve occupational health and safety, plant safety, product stewardship and logistics, environmental performance, and dialogue with neighbors and the public. From 1988–2012, Responsible Care companies have reduced Hazardous Air Pollutants (HAPs) by more than 77%.125 In oil and gas, the Center for Offshore Safety (COS) was initiated by the API after the Deepwater Horizon oil spill in the Gulf of Mexico.126 It is an industry-wide body whose activities include sharing best practices, providing a forum to discuss methods for continuous improvement, and overseeing third-party audits of drilling facilities. During the first full year of reporting (2013), not a single COS member suffered a fatality or loss of well control during
more than 42 million work hours.127 Such efforts not only spread strong compliance but also build industry legitimacy and help ensure that industry retains the license to operate.
Strengthening continuous improvement
There is a diverse set of continuous improvement bodies that are playing an important role in advancing environmental performance, as practices and technologies rapidly evolve in this still-new sector. However, coordination among them is uneven, which limits their effectiveness.
IOGCC and STRONGER are each multi-state, multi-stakeholder groups focused on regulatory and legislative best practices. IOGCC “tracks, evaluates, and disseminates information on state innovations and best practices.”128 STRONGER, now a non-profit organization, was originally initiated by the IOGCC and EPA in the late 1980s to “review state oil and gas waste management programs against a set of guidelines developed and agreed to by all the participating parties.”129 However, the IOGCC no longer works with STRONGER, because it was unable to reach an agreement to continue sponsoring STRONGER in the late 1990s.130 This political disagreement is counterproductive to the common mission of state regulatory improvement and creates overlapping mandates.
Such a lack of coordination also occurs at the state and local level, where there are organizations focused on important regional topics (like the CSSD and the Colorado Oil and Gas Task Force). Their role with state agencies and regulations is not always clear. For example, the CSSD has set out its 15 performance standards for unconventionals development, but there is no clear plan for how these higher standards will eventually link up with state laws in Pennsylvania, Ohio, and West Virginia. Such gaps in coordination and political associations leave the average American confused as to whether progress is truly being made on key environmental topics.
With progress in these four areas, unconventionals development can win the support of the public, and the process of innovation and improvement in environmental performance will accelerate.
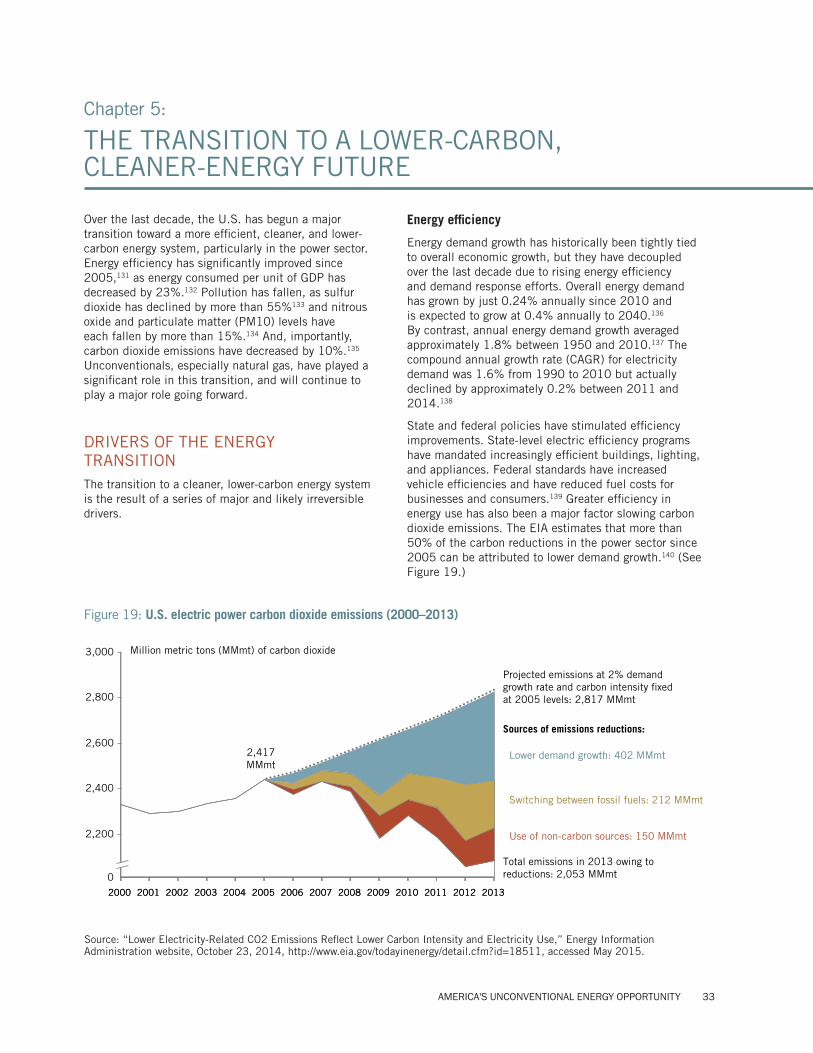
AMERICA'S UNCONVENTIONAL ENERGY OPPORTUNITY 33
Chapter 5:
THE TRANSITION TO A LOWER-CARBON, CLEANER-ENERGY FUTURE
Over the last decade, the U.S. has begun a major transition toward a more efficient, cleaner, and lower-carbon energy system, particularly in the power sector. Energy efficiency has significantly improved since 2005,131 as energy consumed per unit of GDP has decreased by 23%.132 Pollution has fallen, as sulfur dioxide has declined by more than 55%133 and nitrous oxide and particulate matter (PM10) levels have each fallen by more than 15%.134 And, importantly, carbon dioxide emissions have decreased by 10%.135 Unconventionals, especially natural gas, have played a significant role in this transition, and will continue to play a major role going forward.
DRIVERS OF THE ENERGY TRANSITION The transition to a cleaner, lower-carbon energy system is the result of a series of major and likely irreversible drivers.
Energy efficiency
Energy demand growth has historically been tightly tied to overall economic growth, but they have decoupled over the last decade due to rising energy efficiency and demand response efforts. Overall energy demand has grown by just 0.24% annually since 2010 and is expected to grow at 0.4% annually to 2040.136 By contrast, annual energy demand growth averaged approximately 1.8% between 1950 and 2010.137 The compound annual growth rate (CAGR) for electricity demand was 1.6% from 1990 to 2010 but actually declined by approximately 0.2% between 2011 and 2014.138
State and federal policies have stimulated efficiency improvements. State-level electric efficiency programs have mandated increasingly efficient buildings, lighting, and appliances. Federal standards have increased vehicle efficiencies and have reduced fuel costs for businesses and consumers.139 Greater efficiency in energy use has also been a major factor slowing carbon dioxide emissions. The EIA estimates that more than 50% of the carbon reductions in the power sector since 2005 can be attributed to lower demand growth.140 (See Figure 19.)
Figure 19: U.S. electric power carbon dioxide emissions (2000–2013)
20072006200520042003200220012000 2010 20122008 2011 2013200920072006200520042003200220012000 2010 20122008 2011 20132009
Million metric tons (MMmt) of carbon dioxide
2,417 MMmt
Projected emissions at 2% demand growth rate and carbon intensity fixed at 2005 levels: 2,817 MMmt
Sources of emissions reductions:
Lower demand growth: 402 MMmt
Switching between fossil fuels: 212 MMmt
Use of non-carbon sources: 150 MMmt
Total emissions in 2013 owing to reductions: 2,053 MMmt0
2,800
2,200
2,400
2,600
3,000
Source: “Lower Electricity-Related CO2 Emissions Reflect Lower Carbon Intensity and Electricity Use,” Energy Information Administration website, October 23, 2014, http://www.eia.gov/todayinenergy/detail.cfm?id=18511, accessed May 2015.
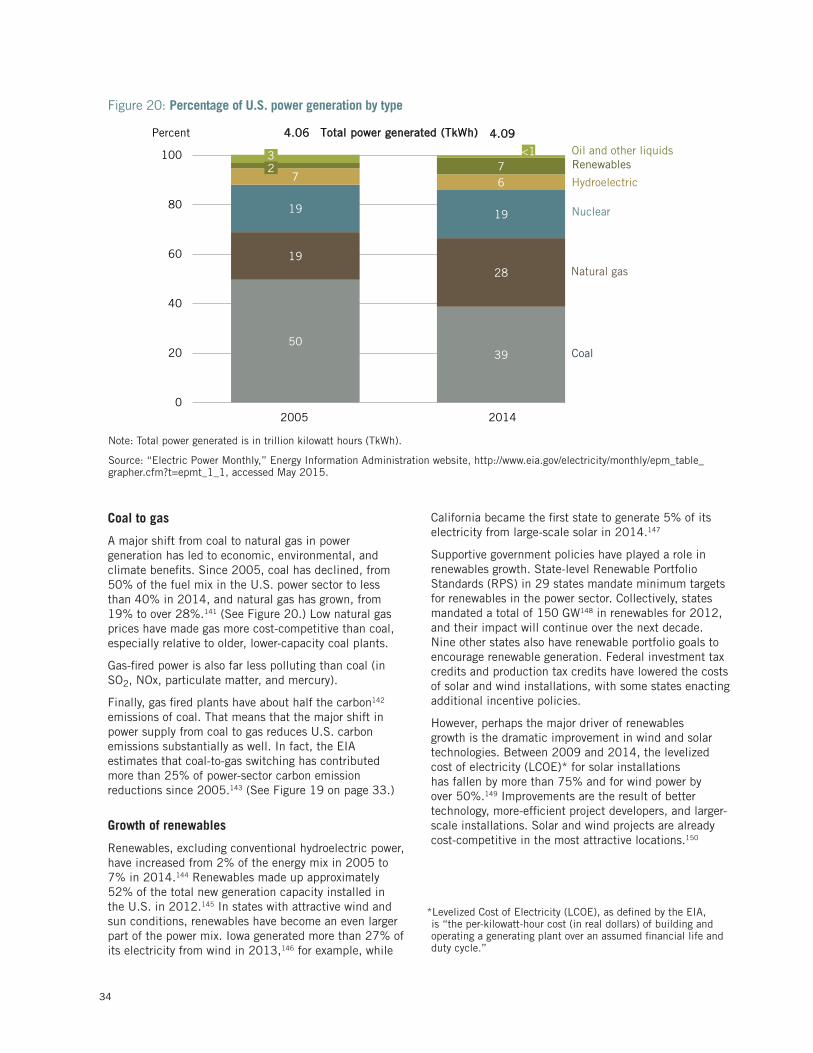
34
Coal to gas
A major shift from coal to natural gas in power generation has led to economic, environmental, and climate benefits. Since 2005, coal has declined, from 50% of the fuel mix in the U.S. power sector to less than 40% in 2014, and natural gas has grown, from 19% to over 28%.141 (See Figure 20.) Low natural gas prices have made gas more cost-competitive than coal, especially relative to older, lower-capacity coal plants.
Gas-fired power is also far less polluting than coal (in SO2, NOx, particulate matter, and mercury).
Finally, gas fired plants have about half the carbon142 emissions of coal. That means that the major shift in power supply from coal to gas reduces U.S. carbon emissions substantially as well. In fact, the EIA estimates that coal-to-gas switching has contributed more than 25% of power-sector carbon emission reductions since 2005.143 (See Figure 19 on page 33.)
Growth of renewables
Renewables, excluding conventional hydroelectric power, have increased from 2% of the energy mix in 2005 to 7% in 2014.144 Renewables made up approximately 52% of the total new generation capacity installed in the U.S. in 2012.145 In states with attractive wind and sun conditions, renewables have become an even larger part of the power mix. Iowa generated more than 27% of its electricity from wind in 2013,146 for example, while
California became the first state to generate 5% of its electricity from large-scale solar in 2014.147
Supportive government policies have played a role in renewables growth. State-level Renewable Portfolio Standards (RPS) in 29 states mandate minimum targets for renewables in the power sector. Collectively, states mandated a total of 150 GW148 in renewables for 2012, and their impact will continue over the next decade. Nine other states also have renewable portfolio goals to encourage renewable generation. Federal investment tax credits and production tax credits have lowered the costs of solar and wind installations, with some states enacting additional incentive policies.
However, perhaps the major driver of renewables growth is the dramatic improvement in wind and solar technologies. Between 2009 and 2014, the levelized cost of electricity (LCOE)* for solar installations has fallen by more than 75% and for wind power by over 50%.149 Improvements are the result of better technology, more-efficient project developers, and larger-scale installations. Solar and wind projects are already cost-competitive in the most attractive locations.150
Figure 20: Percentage of U.S. power generation by type
Percent
5039
1928
19 19
7 67
0
20
40
60
80
100
20142005
4.094.06
<13 Oil and other liquids
Coal
Natural gas
Nuclear
Hydroelectric
Total power generated (TkWh)
Renewables2
Note: Total power generated is in trillion kilowatt hours (TkWh).
Source: “Electric Power Monthly,” Energy Information Administration website, http://www.eia.gov/electricity/monthly/epm_table_grapher.cfm?t=epmt_1_1, accessed May 2015.
*Levelized Cost of Electricity (LCOE), as defined by the EIA, is “the per-kilowatt-hour cost (in real dollars) of building and operating a generating plant over an assumed financial life and duty cycle.”

AMERICA'S UNCONVENTIONAL ENERGY OPPORTUNITY 35
FUTURE TRAJECTORYThe transition to cleaner energy will continue, and potentially accelerate, over the next 20–30 years. Economics, public support, and policy actions will all play a role in driving these changes.
Renewables are becoming increasingly competitive
The cost of renewables, particularly solar, is likely to continue to fall dramatically over the next 10–15 years. Our estimates show that the average utility-scale solar installation is likely to reach cost-parity with natural gas-fired power within 10–30 years, varying by state circumstances.152 And these averaged figures understate the future competitiveness of renewables in some cases. (See Figure 21 on page 36.) (For a detailed explanation of the methodology for estimating LCOE for onshore wind and solar energy, please turn to the Appendix IV on page 58.)
Renewables, then, are likely to become both the cleanest and the most cost-competitive power generation source by 2050, even without legislation that limits carbon emissions.
Other technological trends will improve the economic viability of renewables even further. Distributed energy resources, like rooftop solar, are already economic for some homeowners and businesses. That opens up a direct consumer market for renewables. Smart homes
allow homeowners and businesses to better manage their electricity use and operate appliances in sync with renewables generation. Cost-effective energy storage technologies will combine with renewables and other emergent technologies to create microgrids and off-grid solutions. Finally, the penetration of electric vehicles is expected to grow and create a natural storage place for solar and wind power, especially in peak daylight hours. As companies and households begin to generate, store, and manage their own power, this will further reduce the demand for traditional power sources.
Taking renewables to scale will also face some challenges. Renewables are intermittent and only provide power to the grid when the wind is blowing or the sun is shining. On average, wind turbines generate only 30–35% of their potential installed capacity, while solar panels achieve just 20–25%.153 Therefore, storage capacity or a backup power source is required to meet the peaks and valleys of renewables generation. At large scale, renewables also require a more sophisticated electric grid than the one in place today. Whereas today’s grid is built to send power in one direction from a small number of centralized generation sources to a large number of distributed users, the future grid must be able to manage large volumes of intermittent and distributed flows of supply as well as demand.
Coal will continue to lose ground
Coal generation is expected to decline further over the next several decades. Coal is becoming more and more uncompetitive, even without any further carbon emissions restrictions or incentives. While many coal plants are still marginally viable versus natural gas today, our modeling shows that most will lose economic viability when the next major capital project is required to deal with obsolescence and already existing pollution regulations. We expect approximately half of the current coal generating capacity to be retired by 2022, across a range of potential gas price and policy scenarios.154 Only the largest, most efficient, multi-generating-unit coal plants with existing back-end pollution controls are likely to survive.
Further declines in coal-fired generation in the near term are already occurring. According to the EIA, 81% of electricity-generation capacity retirements in 2015 will be coal (12.9 GW), and coal will account for no new capacity additions. Wind (9.8 GW), natural gas-fired (6.3 GW) and solar power (2.2 GW) are expected to account for 91% of the new additions, with the remainder made up by nuclear (1.1 GW) and other renewables (0.5 GW).155
Continuing with coal is no longer just an environmental problem. Increasingly, gas is more economical than coal.
Major solar power project more competitive than coal or gas in TexasIn May 2014, Austin Energy signed a 20-year power purchase agreement (PPA) for 150 MW of solar power, priced at less than $50/MWh.151 The agreement is the lowest-priced solar PPA in the U.S. and the first to be priced under $50/MWh. At this price, solar power is more economically competitive in Texas than gas and coal.
The low price is a harbinger of the future. Texas has some of the most favorable wind and solar resources in the U.S., and the state already generates nearly 10% of its power from wind. Texas has also improved its grid infrastructure to support renewables, completing the Competitive Renewable Energy Zone (CREZ) project to bolster transmission lines to West Texas.

36
Figure 21: Estimated levelized cost of electricity (LCOE) for onshore wind and solar photovoltaics (PV), 2015–2050
Average unsubsidized solar PV LCOE ($/Megawatt hour)
Average unsubsidized onshore wind LCOE ($/Megawatt hour)
20502045204020352030202520202015
20502045204020352030202520202015
Texas
New England
140
126
112
98
84
70
56
28
MA:120
DE:70
TX:61
TX:28
2012-14 Sample power purchase agreementswith tax credits ($/Megawatt hour)
140
126
112
98
84
70
56
28
MA:84
TX:80
TX:45
2012-14 Sample power purchase agreementswith tax credits ($/Megawatt hour)
Texas
New England
Onshore wind
Combined cycle gas turbine
Combined cycle gas turbine
Solar PV
Note: Levelized cost of electricity (LCOE) is a utility industry metric for calculating the total cost of electricity produced by a generator.
Assumptions: Capacity factors of 34% and 20% for Texas wind and solar, 24% and 17% for New England wind and solar, and 6% WACC. Learning rates of 13% for solar modules, 12% for inverters, 7.5% for labor/balance of system, and 7% for onshore wind technology assumed.
Combined cycle gas turbine (CCGT) curves reflect +/- 25% of forecasted Henry Hub prices.
Source: BCG and HBS analysis; please refer to Appendix IV for detailed methodology.

AMERICA'S UNCONVENTIONAL ENERGY OPPORTUNITY 37
American public supports carbon reductions
While political and business communities remain fiercely split on the need to take steps to address climate change, the broader American public strongly supports actions to curb greenhouse gas emissions. Multiple surveys reveal that a large majority of Americans are worried about climate change and believe that the U.S. should take action. Support for change has held steady or increased over time. A January 2015 poll conducted by Resources for the Future and Stanford University,156 for example, found that 83% of Americans believed that global warming will be somewhat of or a very serious problem if nothing is done to reduce greenhouse gas emissions, and 74% believed that the federal government should be doing a substantial amount to combat climate change. These poll results cut across party affiliation. Concerning coal, a 2014 Yale study found that 63% of Americans support setting strict carbon dioxide limits on existing coal plants, with majority public support even in states with large coal industries. The study also found that 77% of the public supports research and development on renewables.157
While some in the energy industry continue to lobby for the status quo on carbon reductions, this stance is increasingly at odds with American public opinion.
Public policies will continue to push carbon reductions
Policies at both the state and federal level will continue to encourage lower-carbon energy solutions. State Renewable Portfolio Standards will cumulatively require a minimum of 60 GW of new renewable generation by 2030, 40% higher than is mandated today.158 In addition, 13 states have introduced greenhouse gas emissions limits that will require further shifts to lower-carbon power.159 Federal standards will also ensure that vehicles and appliances continue to improve their energy efficiency.
There are also a growing number of other proposals that would encourage carbon reductions over the next 10–15 years and longer. The Obama Administration, for example, has recently introduced the proposed Clean Power Plan (CPP)160 that covers carbon reductions in the power sector, signed a greenhouse gas emissions accord with China,161 and made U.S. greenhouse gas reduction pledges to the Paris round of international climate negotiations.162 Each proposal targets a 25–30% reduction in carbon emissions by 2030 compared with 2005 levels. These proposals face stiff political and legal challenges, but the reality is that numerous factors are likely to encourage additional reductions, particularly as the economics increasingly favor cleaner energy.
Addressing climate change is not just a U.S. trend, but increasingly a global one. (See Figure 22 on page 38.) The European Union, long a leader in climate
action, has extended emissions reductions targets to 2050.163 Mexico has announced an unconditional 25% emissions reduction from its business-as-usual scenario by 2030, which would increase to 40% with a global climate deal.164 Even China, a traditional opponent to any restrictions on its carbon emissions, has agreed to carbon targets for the first time, pledging to begin reducing emissions by 2030 in its recent accord with the U.S.165 Political debates over climate change will continue, as in Australia, which enacted carbon limits and then repealed them.166 Some countries have also missed their Kyoto Protocol commitments.167 However, while the right targets and the best policies are still being debated, the general trend and current momentum for carbon reductions are greater than at any time over the last 15 years.
NATURAL GAS AND THE U.S. ENERGY TRANSITIONThe U.S. position in natural gas is a crucial asset in making America’s energy transition both feasible and at a competitive cost across a range of carbon reduction scenarios, at least through 2030. Natural gas can replace up to 50% of the existing coal capacity by 2022 at lower cost,168 providing significant economic and carbon benefits, regardless of other climate policies.
EPA Administrator Gina McCarthy put it well in April 2015 when she said, “[Fracking] has changed the game for me in terms of how the energy system is working. The inexpensive gas that’s being produced has allowed us to make leaps and bounds in progress on the air pollution side and, frankly, to make the Clean Power Plan.”169
Natural gas essential for near-term carbon reductions
Natural gas is the only fuel that can cost-effectively deliver large-scale carbon emissions reductions in the near term, including the 30% carbon emissions reduction targeted by the proposed Clean Power Plan. A 2014 CSIS/Rhodium Group study170 shows that increasing natural gas’s share of power generation from 28% today171 to 43% by 2030 allows the U.S. to meet the 30% reduction target of the Clean Power Plan without significantly increasing the cost of electricity in the U.S.172 The study estimates that power rates would rise by around 4%, while overall energy expenditures would remain nearly flat, assuming that states coordinate their implementation.173 (See Figure 23 on page 39.)
Unconventional natural gas also gives the U.S. a competitive advantage in moving to a low-carbon energy system over other countries that lack abundant natural gas resources. Without a supply of low-cost gas, Germany, for example, set aggressive renewables goals and then spent $400 billion in direct government subsidies to support renewable growth.174 The price of
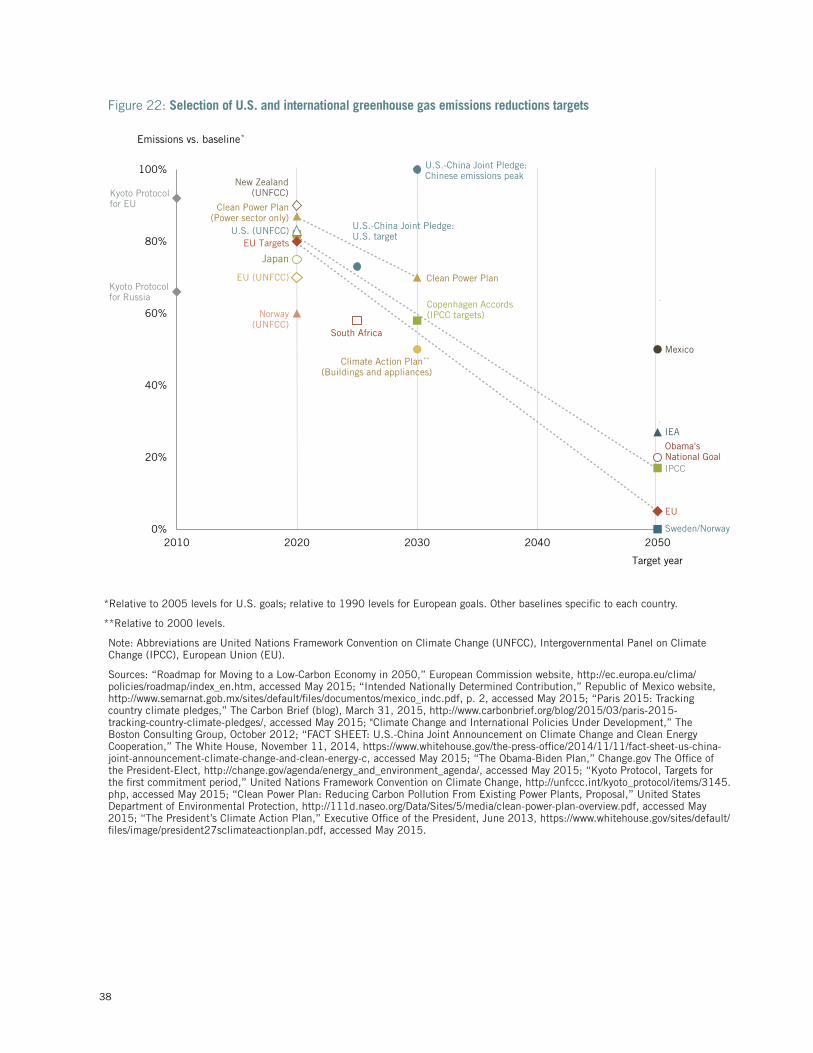
38
Figure 22: Selection of U.S. and international greenhouse gas emissions reductions targets
0%
20%
40%
60%
80%
100%
2010 2020 2030 2040 2050
Kyoto Protocolfor Russia
Kyoto Protocolfor EU
IEA
Sweden/Norway
Target year
EU
EU Targets
Obama'sNational GoalIPCC
Emissions vs. baseline*
U.S. (UNFCC)
South Africa
Japan
New Zealand(UNFCC)
Mexico
U.S.-China Joint Pledge: U.S. target
Norway(UNFCC)
U.S.-China Joint Pledge:Chinese emissions peak
Clean Power Plan
Clean Power Plan(Power sector only)
Climate Action Plan**
(Buildings and appliances)
EU (UNFCC)
Copenhagen Accords(IPCC targets)
*Relative to 2005 levels for U.S. goals; relative to 1990 levels for European goals. Other baselines specific to each country.
**Relative to 2000 levels.
Note: Abbreviations are United Nations Framework Convention on Climate Change (UNFCC), Intergovernmental Panel on Climate Change (IPCC), European Union (EU).
Sources: “Roadmap for Moving to a Low-Carbon Economy in 2050,” European Commission website, http://ec.europa.eu/clima/policies/roadmap/index_en.htm, accessed May 2015; “Intended Nationally Determined Contribution,” Republic of Mexico website, http://www.semarnat.gob.mx/sites/default/files/documentos/mexico_indc.pdf, p. 2, accessed May 2015; “Paris 2015: Tracking country climate pledges,” The Carbon Brief (blog), March 31, 2015, http://www.carbonbrief.org/blog/2015/03/paris-2015-tracking-country-climate-pledges/, accessed May 2015; "Climate Change and International Policies Under Development,” The Boston Consulting Group, October 2012; “FACT SHEET: U.S.-China Joint Announcement on Climate Change and Clean Energy Cooperation,” The White House, November 11, 2014, https://www.whitehouse.gov/the-press-office/2014/11/11/fact-sheet-us-china-joint-announcement-climate-change-and-clean-energy-c, accessed May 2015; “The Obama-Biden Plan,” Change.gov The Office of the President-Elect, http://change.gov/agenda/energy_and_environment_agenda/, accessed May 2015; “Kyoto Protocol, Targets for the first commitment period,” United Nations Framework Convention on Climate Change, http://unfccc.int/kyoto_protocol/items/3145.php, accessed May 2015; “Clean Power Plan: Reducing Carbon Pollution From Existing Power Plants, Proposal,” United States Department of Environmental Protection, http://111d.naseo.org/Data/Sites/5/media/clean-power-plan-overview.pdf, accessed May 2015; “The President’s Climate Action Plan,” Executive Office of the President, June 2013, https://www.whitehouse.gov/sites/default/files/image/president27sclimateactionplan.pdf, accessed May 2015.
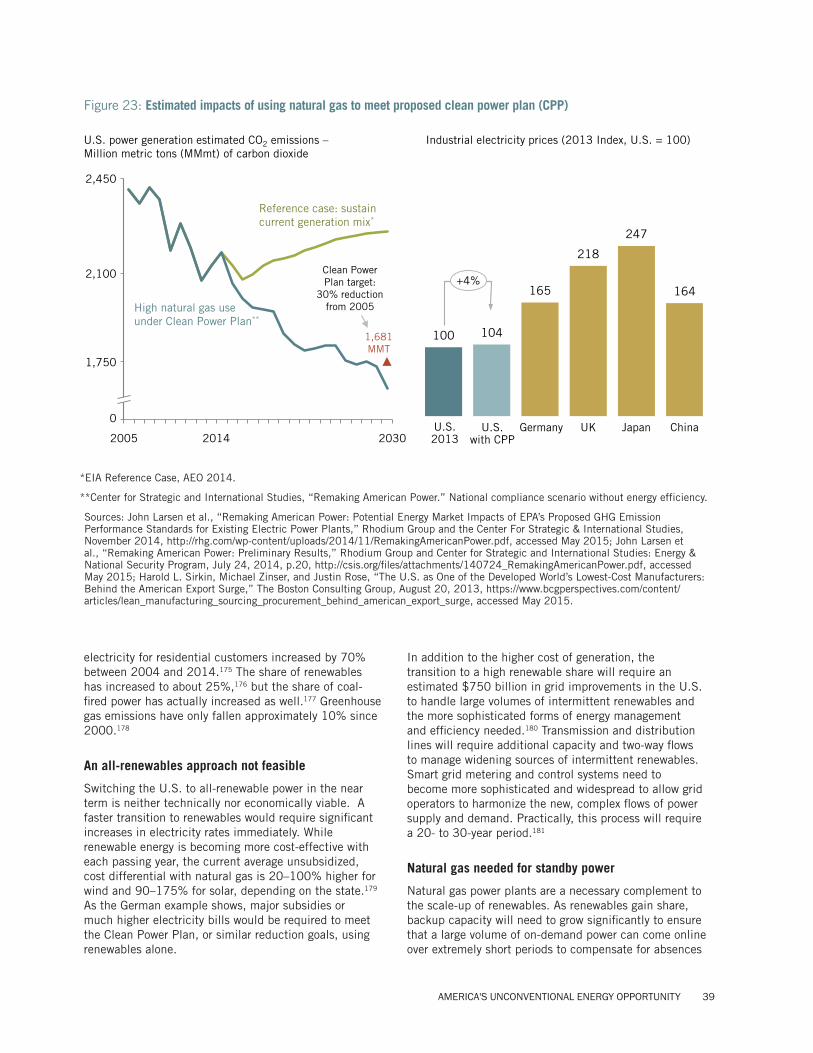
AMERICA'S UNCONVENTIONAL ENERGY OPPORTUNITY 39
Figure 23: Estimated impacts of using natural gas to meet proposed clean power plan (CPP)
U.S. power generation estimated CO2 emissions –Million metric tons (MMmt) of carbon dioxide
2,100
1,750
0
20142005
High natural gas use under Clean Power Plan**
Reference case: sustain current generation mix*
1,681MMT
Clean Power Plan target:
30% reduction from 2005
Industrial electricity prices (2013 Index, U.S. = 100)
2,450
100 104
165
218
247
164
JapanUKGermanyU.S.with CPP
U.S.2013
+4%
China2030
electricity for residential customers increased by 70% between 2004 and 2014.175 The share of renewables has increased to about 25%,176 but the share of coal-fired power has actually increased as well.177 Greenhouse gas emissions have only fallen approximately 10% since 2000.178
An all-renewables approach not feasible
Switching the U.S. to all-renewable power in the near term is neither technically nor economically viable. A faster transition to renewables would require significant increases in electricity rates immediately. While renewable energy is becoming more cost-effective with each passing year, the current average unsubsidized, cost differential with natural gas is 20–100% higher for wind and 90–175% for solar, depending on the state.179 As the German example shows, major subsidies or much higher electricity bills would be required to meet the Clean Power Plan, or similar reduction goals, using renewables alone.
In addition to the higher cost of generation, the transition to a high renewable share will require an estimated $750 billion in grid improvements in the U.S. to handle large volumes of intermittent renewables and the more sophisticated forms of energy management and efficiency needed.180 Transmission and distribution lines will require additional capacity and two-way flows to manage widening sources of intermittent renewables. Smart grid metering and control systems need to become more sophisticated and widespread to allow grid operators to harmonize the new, complex flows of power supply and demand. Practically, this process will require a 20- to 30-year period.181
Natural gas needed for standby power
Natural gas power plants are a necessary complement to the scale-up of renewables. As renewables gain share, backup capacity will need to grow significantly to ensure that a large volume of on-demand power can come online over extremely short periods to compensate for absences
*EIA Reference Case, AEO 2014.
**Center for Strategic and International Studies, “Remaking American Power.” National compliance scenario without energy efficiency.
Sources: John Larsen et al., “Remaking American Power: Potential Energy Market Impacts of EPA’s Proposed GHG Emission Performance Standards for Existing Electric Power Plants,” Rhodium Group and the Center For Strategic & International Studies, November 2014, http://rhg.com/wp-content/uploads/2014/11/RemakingAmericanPower.pdf, accessed May 2015; John Larsen et al., “Remaking American Power: Preliminary Results,” Rhodium Group and Center for Strategic and International Studies: Energy & National Security Program, July 24, 2014, p.20, http://csis.org/files/attachments/140724_RemakingAmericanPower.pdf, accessed May 2015; Harold L. Sirkin, Michael Zinser, and Justin Rose, “The U.S. as One of the Developed World’s Lowest-Cost Manufacturers: Behind the American Export Surge,” The Boston Consulting Group, August 20, 2013, https://www.bcgperspectives.com/content/articles/lean_manufacturing_sourcing_procurement_behind_american_export_surge, accessed May 2015.

40
of wind or sun. (See Figure 24.) The particular levels of backup capacity required will depend on the percentage and distribution of intermittent renewables, as well as the ability of the grid to utilize demand response and storage, but they will amount to a significant portion of the total installed renewables capacity.
Natural gas power plants are by far the most efficient source of backup power, at least over the medium term. Natural gas plants can be brought online in under an hour, in some cases as rapidly as 15 minutes,182 compared with eight to 48 hours to start up a coal-fired plant.183 Natural gas plants can also operate more efficiently across a variety of load factors, allowing them to meet varying needs throughout the day. While energy storage solutions, such as large-scale batteries, may eventually become economic to provide backup power, they are years away from being competitive with gas- fired plants.184
Gas drives carbon reductions in other sectors
Natural gas is also beginning to contribute cost-competitive carbon reductions outside the power sector. Natural-gas-powered vehicles, trains, ships, and other transportation modes are one prime opportunity, where current battery technology limits the feasibility
of electric-powered alternatives. For trucking, marine transport, rail, and aviation, natural-gas–based fuels are 10–20% less carbon-intensive and 30–50% less expensive than petroleum-based counterparts on average. (See Figure 25.) Though the near-term expansion of natural gas transport will be greatest in trucking, natural gas should spread to other segments over time.
REALIZING AMERICA’S ENERGY TRANSITION ADVANTAGE There are three primary issues raised that stand in the way of the U.S. taking advantage of the opportunity to more competitively bridge the transition to a cleaner, low-carbon energy system by utilizing natural gas: methane leakage, fears that natural gas will slow renewable development, and concerns that investment in natural gas will “lock in” the use of fossil fuels in the longer term.
Containing methane leakage
Methane is a potent greenhouse gas, and it has a more powerful warming effect than CO2 when released directly into the atmosphere. According to the IPCC’s 2013 report on climate change,185 one pound of methane (CH4) released into the atmosphere has the same effect
Figure 24: California ISO estimated electric load, net of renewables through 2020
Hour
Net load–March 31 (Megawatts)
8,000
10,000
12,000
14,000
16,000
18,000
20,000
22,000
24,000
26,000
28,000
12am 3am 6am 9am 12pm 3pm 6pm 9pm
2012
2014
2016
2020
Note: The California ISO (independent system operator) provides open and non-discriminatory access to the bulk of the state’s wholesale transmission grid, supported by a competitive energy market and comprehensive infrastructure planning efforts.
Source: “Fast Facts, What the duck curve tells us about managing a green grid,” California ISO, http://www.caiso.com/Documents/FlexibleResourcesHelpRenewables_FastFacts.pdf, accessed May 2015.
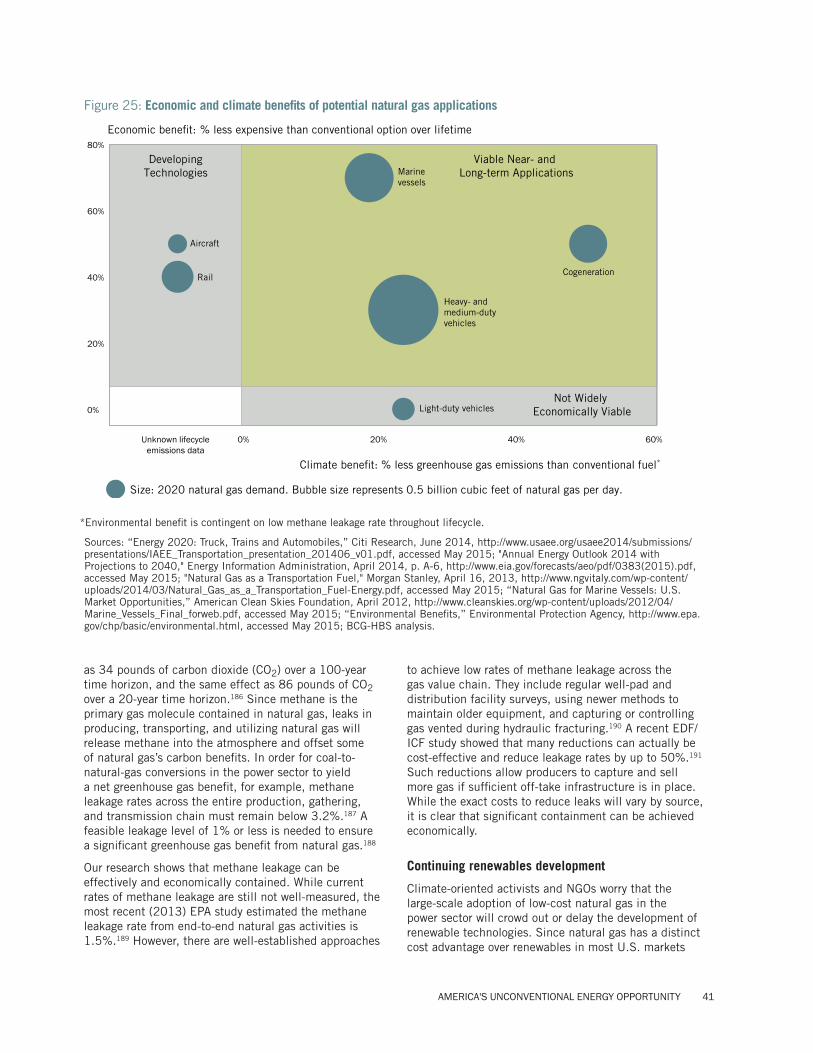
AMERICA'S UNCONVENTIONAL ENERGY OPPORTUNITY 41
as 34 pounds of carbon dioxide (CO2) over a 100-year time horizon, and the same effect as 86 pounds of CO2 over a 20-year time horizon.186 Since methane is the primary gas molecule contained in natural gas, leaks in producing, transporting, and utilizing natural gas will release methane into the atmosphere and offset some of natural gas’s carbon benefits. In order for coal-to-natural-gas conversions in the power sector to yield a net greenhouse gas benefit, for example, methane leakage rates across the entire production, gathering, and transmission chain must remain below 3.2%.187 A feasible leakage level of 1% or less is needed to ensure a significant greenhouse gas benefit from natural gas.188
Our research shows that methane leakage can be effectively and economically contained. While current rates of methane leakage are still not well-measured, the most recent (2013) EPA study estimated the methane leakage rate from end-to-end natural gas activities is 1.5%.189 However, there are well-established approaches
to achieve low rates of methane leakage across the gas value chain. They include regular well-pad and distribution facility surveys, using newer methods to maintain older equipment, and capturing or controlling gas vented during hydraulic fracturing.190 A recent EDF/ICF study showed that many reductions can actually be cost-effective and reduce leakage rates by up to 50%.191 Such reductions allow producers to capture and sell more gas if sufficient off-take infrastructure is in place. While the exact costs to reduce leaks will vary by source, it is clear that significant containment can be achieved economically.
Continuing renewables development
Climate-oriented activists and NGOs worry that the large-scale adoption of low-cost natural gas in the power sector will crowd out or delay the development of renewable technologies. Since natural gas has a distinct cost advantage over renewables in most U.S. markets
Figure 25: Economic and climate benefits of potential natural gas applications
80%
Aircraft
60%
40%
20%
0%
0% 20% 40% 60%
Rail
Heavy- and medium-duty vehicles
Marinevessels
Cogeneration
Light-duty vehicles
Unknown lifecycleemissions data
DevelopingTechnologies
Viable Near- and Long-term Applications
Not WidelyEconomically Viable
Economic benefit: % less expensive than conventional option over lifetime
Climate benefit: % less greenhouse gas emissions than conventional fuel*
Size: 2020 natural gas demand. Bubble size represents 0.5 billion cubic feet of natural gas per day.
*Environmental benefit is contingent on low methane leakage rate throughout lifecycle.
Sources: “Energy 2020: Truck, Trains and Automobiles,” Citi Research, June 2014, http://www.usaee.org/usaee2014/submissions/presentations/IAEE_Transportation_presentation_201406_v01.pdf, accessed May 2015; "Annual Energy Outlook 2014 with Projections to 2040," Energy Information Administration, April 2014, p. A-6, http://www.eia.gov/forecasts/aeo/pdf/0383(2015).pdf, accessed May 2015; "Natural Gas as a Transportation Fuel," Morgan Stanley, April 16, 2013, http://www.ngvitaly.com/wp-content/uploads/2014/03/Natural_Gas_as_a_Transportation_Fuel-Energy.pdf, accessed May 2015; “Natural Gas for Marine Vessels: U.S. Market Opportunities,” American Clean Skies Foundation, April 2012, http://www.cleanskies.org/wp-content/uploads/2012/04/Marine_Vessels_Final_forweb.pdf, accessed May 2015; “Environmental Benefits,” Environmental Protection Agency, http://www.epa.gov/chp/basic/environmental.html, accessed May 2015; BCG-HBS analysis.
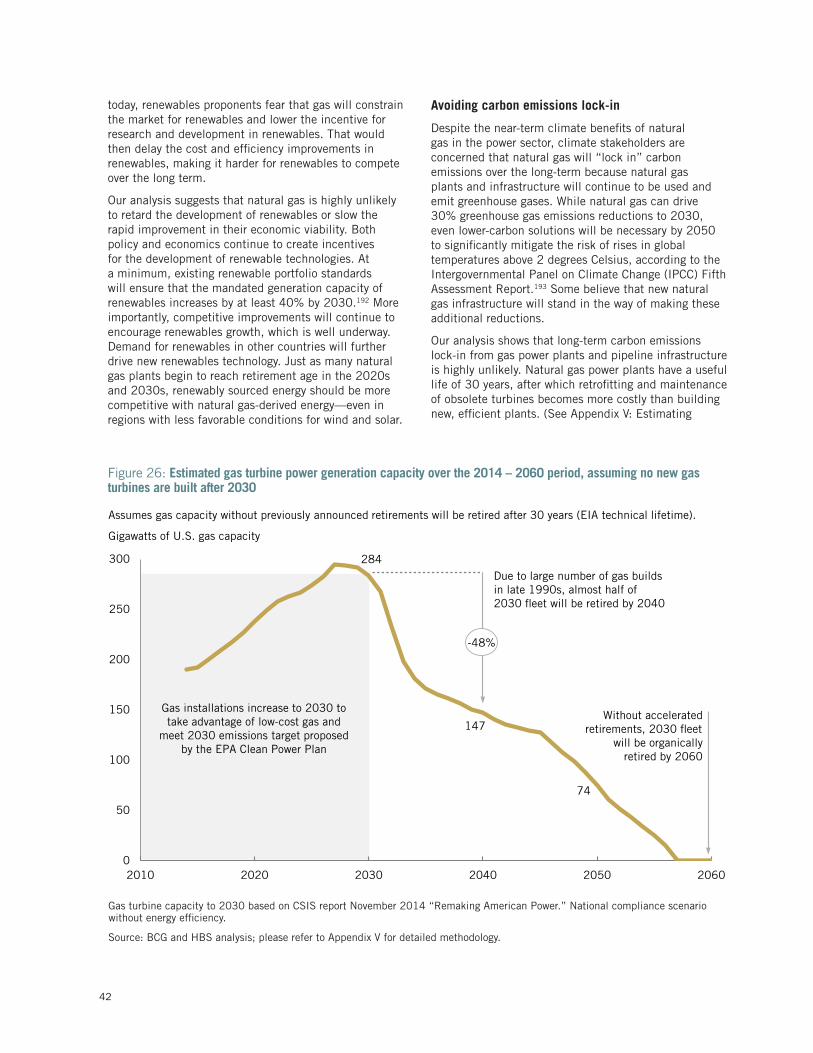
42
today, renewables proponents fear that gas will constrain the market for renewables and lower the incentive for research and development in renewables. That would then delay the cost and efficiency improvements in renewables, making it harder for renewables to compete over the long term.
Our analysis suggests that natural gas is highly unlikely to retard the development of renewables or slow the rapid improvement in their economic viability. Both policy and economics continue to create incentives for the development of renewable technologies. At a minimum, existing renewable portfolio standards will ensure that the mandated generation capacity of renewables increases by at least 40% by 2030.192 More importantly, competitive improvements will continue to encourage renewables growth, which is well underway. Demand for renewables in other countries will further drive new renewables technology. Just as many natural gas plants begin to reach retirement age in the 2020s and 2030s, renewably sourced energy should be more competitive with natural gas-derived energy—even in regions with less favorable conditions for wind and solar.
Avoiding carbon emissions lock-in
Despite the near-term climate benefits of natural gas in the power sector, climate stakeholders are concerned that natural gas will “lock in” carbon emissions over the long-term because natural gas plants and infrastructure will continue to be used and emit greenhouse gases. While natural gas can drive 30% greenhouse gas emissions reductions to 2030, even lower-carbon solutions will be necessary by 2050 to significantly mitigate the risk of rises in global temperatures above 2 degrees Celsius, according to the Intergovernmental Panel on Climate Change (IPCC) Fifth Assessment Report.193 Some believe that new natural gas infrastructure will stand in the way of making these additional reductions.
Our analysis shows that long-term carbon emissions lock-in from gas power plants and pipeline infrastructure is highly unlikely. Natural gas power plants have a useful life of 30 years, after which retrofitting and maintenance of obsolete turbines becomes more costly than building new, efficient plants. (See Appendix V: Estimating
Figure 26: Estimated gas turbine power generation capacity over the 2014 – 2060 period, assuming no new gas turbines are built after 2030
0
50
100
150
200
250
300
2010 2020 2030 2040 2050 2060
284
74
147
-48%
Gigawatts of U.S. gas capacity
Due to large number of gas builds in late 1990s, almost half of 2030 fleet will be retired by 2040
Without accelerated retirements, 2030 fleet
will be organically retired by 2060
Gas installations increase to 2030 to take advantage of low-cost gas and
meet 2030 emissions target proposed by the EPA Clean Power Plan
Assumes gas capacity without previously announced retirements will be retired after 30 years (EIA technical lifetime).
Gas turbine capacity to 2030 based on CSIS report November 2014 “Remaking American Power.” National compliance scenario without energy efficiency.
Source: BCG and HBS analysis; please refer to Appendix V for detailed methodology.

AMERICA'S UNCONVENTIONAL ENERGY OPPORTUNITY 43
natural gas power plant retirements, 2014-2060.) While new natural gas power plants will be required to meet the 30% reductions in the power sector by 2030, the vast majority of gas plants needed in 2030 are already in operation today. A large portion of them were built in the early 2000s, and our analysis shows that half of the natural-gas capacity in use in 2030 would be naturally retired by 2040, and 100% would be retired by 2060.194 (See Figure 26.) Thus, the U.S. will actually have substantial flexibility post-2030 to utilize the most competitive power investments then available and achieve ambitious climate goals by 2050.
Moreover, there will be substantial long-term requirements for natural gas in sectors outside of power, including residential and commercial uses, as well as petrochemical feedstocks and fuel. By 2040, the EIA projects that nearly 60% of U.S. natural gas demand will originate outside the power sector.195 Even if there is a decline in natural gas use for power generation after 2030, to meet further carbon emissions reduction targets significant demand for natural gas will remain, and pipeline and distribution infrastructure are highly unlikely to become stranded assets.196
While many stakeholders on both sides of the debate see unconventionals and mitigating climate change as antithetical, they are actually complementary. The industry benefits from progress on climate change because it will enlarge demand for natural gas and reduce opposition to critical infrastructure and expanded development. Climate advocates benefit from unconventionals because they enable cost-effective progress on climate change in the near term and support investments critical to lower-carbon solutions over the longer term.
44
Our research makes it clear that America can take advantage of the huge economic opportunity created by unconventionals while minimizing environmental impact and supporting the transition to a lower-carbon energy system. We call this the win-win pathway. It is a strategy for the U.S. where all the key stakeholders can benefit.
Here, we outline eleven key steps along the win-win pathway. These, taken together, can deliver substantial environmental, climate, and economic benefits. Getting on this path will require a different dialogue and interaction. It requires actions from policy makers, industry leaders, and NGOs alike, both independently and collaboratively, to ensure America fully capitalizes on the unconventionals opportunity.
ENHANCING THE ECONOMIC OPPORTUNITYWhile there have already been major economic benefits, the advantages of unconventionals can be amplified and spread more broadly throughout the economy. They will flow to every state, even states that are not involved in production.
Continue the timely development of efficient energy infrastructure
Pipeline, gathering, and processing infrastructure forms the backbone of safe and efficient unconventional resource development. But we need to ensure the timely development of these key assets, which are being slowed down by delays and politics in the permitting process. These delays cause increases in oil and gas prices for consumers and decreases in prices for producers (for example, customer gas prices in some places increased more than three times during the 2014 “Polar Vortex” due primarily to infrastructure gaps197), and they create supply uncertainty for downstream industries, slowing down investment in other industries that are advantaged.
At the federal level, FERC and DOE should reestablish
and enforce their existing authority as the lead federal agencies to set deadlines on the interstate pipeline permitting process.198 At the state level, each state should establish a lead agency to coordinate the permitting process both statewide and locally. On both the federal and state levels, collaboration between agencies, such as FERC, the Bureau of Land Management, the Army Corps of Engineers, state environmental protection agencies (EPAs), and state transportation agencies, should be enhanced to reduce redundant assessments. The permitting process should be made transparent with clear steps. It should incorporate public review and comment, but be structured to address infrastructure, rather than be abused for ideological battles over larger environmental and climate issues (for example, the Northeast Energy Direct199 and Constitution interstate natural gas pipelines in the Northeast U.S.200).
Immediate actions:
• Set and enforce existing federal and state timetables for infrastructure-permitting processes.
• Designate a lead state agency for coordinating infrastructure permit reviews at the state level.
Deliver a skilled workforce
In order to support the growth of unconventionals and the next wave of downstream development, the U.S. has a critical need to qualify more workers with the right skills across a variety of occupations. An analysis of Burning Glass’s data on occupations related to unconventionals shows that, while approximately 12% of unconventionals jobs relate directly to manufacturing and production, more than 50% of the new job growth related to unconventionals was in occupations such as transportation, logistics and distribution, maintenance, repair and installation, construction, and sales and marketing.201
While the recent oil price decline has led to layoffs over the last six months, that is likely a cyclical phenomenon. When prices rise again to reinvestment levels, the need for skilled workers will reemerge. That is particularly true for “middle skills” jobs—those that require more education and training than a high-school diploma but less than a four-year college degree. Job postings between November 2013 and October 2014 show that a majority of unconventionals jobs, 52%, required middle skills, including tractor-trailer truck drivers, production workers, automotive service technicians, mechanics,
Chapter 6:
THE WIN-WIN PATH FORWARD
Here, we outline eleven key steps along the win-win pathway. These, taken together, can deliver substantial environmental, climate, and economic benefits. Getting on this path will require a different dialogue and interaction.
AMERICA'S UNCONVENTIONAL ENERGY OPPORTUNITY 45
material handlers, and machinists.
It is important for business, education, and policy leaders to work together to invest in developing skills and trained worker pipelines that can support the growth of unconventionals over time. Business can and must play a key role in leading such collaborations across regions, and many already are.202 For example, Southwestern Energy has invested heavily in skill development in Arkansas, where it partnered with the University of Arkansas Community College at Morrilton (UACCM) to establish the state’s first two-year petroleum technology program in 2006, and to endow a scholarship fund for the program.203 More recently, workforce development efforts have also been extended to training regulators, as both states and industry players have realized the need for qualified, capable inspectors and policy makers. In 2012, GE and ExxonMobil partnered with three universities, Colorado School of Mines, Penn State University, and The University of Texas at Austin, to develop programs aimed at giving regulators and policy makers training on the latest unconventionals technologies, as well as operational and enforcement best practices.204
Immediate actions:
• Business across the sector should identify the middle-skills and high-skills gaps that are hardest to fill, and proactively invest in developing a pipeline of talent for their industry or region.
• Industry should partner with educators to continually shape the curriculum that delivers the qualifications and credentials employers need, and support schools with equipment, internships, instructors, and hiring commitments.
Eliminate outdated restrictions on gas and oil exports
Natural-gas and crude-oil exports leverage America’s strengths, increase economic growth, and benefit partner nations, without compromising our competitiveness, environmental standards, or domestic prices. Current U.S. restrictions on natural gas and oil exports are antiquated and based on historical circumstances that no longer apply. The Natural Gas Act of 1938 was created to curb the monopolistic tendencies of pipeline owners in the early 20th century, a concern no longer relevant. Oil exports were restricted by the Energy Policy and Conservation Act of 1975, passed in response to the oil scarcity caused by the 1973–1974 international oil embargo. Restrictions were later expanded in the 1979 Export Administration Act. Today, ample new domestic resources mean that removing these antiquated restrictions will both reduce the U.S. trade deficit and bolster the value of unconventionals to the U.S. economy, while having little if any impact on consumer prices. (See Chapter 3 for more details.)
Congress should pass legislation that amends the
Energy Policy and Conservation Act and the Export Administration Act, allowing for the export of unrefined crude to all WTO members, not just to Canada. Likewise, Congress should amend the Natural Gas Act to formally allow exports of natural gas to all WTO member countries, without the need for the current project-by-project approval from the Department of Energy.
Immediate actions:
• Lift the ban on crude oil exports to all WTO members.
• Remove restrictions to Department of Energy permitting of LNG export projects.
MINIMIZING LOCAL ENVIRONMENTAL IMPACTSAs we discussed earlier, local environmental risks can be effectively mitigated without nullifying economic competitiveness. Technology and best practices are rapidly improving, and the cost of meeting high standards is modest and can be profitable. Achieving this improvement will be made possible from a number of steps.
Develop transparent and consistent environmental performance data
Measuring and providing disclosure on key environmental performance data creates the foundation for improving environmental performance and compliance. It is also one critical step to building public understanding and trust for unconventionals technology and operators. The current lack of consistent data leaves too many gaps that can be exploited counterproductively by all sides (for example, selectively using data to support one side of the debate). That only exacerbates the current unproductive dialogue and introduces unnecessary uncertainty that retards improvement and slows investment.
State governments, industry, and NGOs all need to play important roles in building better data sources. States should create clear, structured databases for various types of performance data that include not only the quantity of violations but also information on severity and causes. They must also make data easily accessible and digestible. To do so, many states will also need to upgrade their current antiquated user interfaces and IT systems.
Industry participants should work together, and with states, to establish consistent measures, thresholds, and methods for reporting data and to proactively report their performance. Environmental and community stakeholders must ensure that useful and accurate data are being reported, but they must also hold each other accountable that the data are being used properly and fairly.
46
Immediate actions:
• Develop consistent data standards for measuring environmental impacts of unconventionals, led by states working with industry and NGOs.
• Ensure that the data are made accessible and publicly available, and are consistent and comparable across states.
Set robust regulatory standards
States require a full set of regulatory standards that address the local environmental risks of unconventionals development. Standards should be designed to be cost-effective, encourage adoption of industry-leading practices, and encourage further innovation.
Sound state standards are essential to underpinning strong local environmental and public health performance. Given regional variations (for example, plentiful water in the Marcellus Shale, an arid climate in the Permian Basin), regulatory standards need to be mostly state-driven. While many states have made significant progress over the last five years to create appropriate regulations, standards need to continue to improve to address emerging issues like wastewater management, induced seismicity, air pollution from VOCs, and community impacts from truck traffic. Different states have started to put needed regulations in place—Pennsylvania on water use and recycling, Texas and Ohio on seismicity, Colorado on truck traffic—but all states must ensure their standards appropriately mitigate environmental and public health risks.
Regulators must also create standards that ensure that regulations are cost-effective and do not unnecessarily undermine competitiveness. Where possible, states should mandate performance levels versus requiring specific technologies. For example, rules on water recycling and flaring should set standards for the outcomes—the percentage of water recycled or gas flared—rather than prescribing specific techniques or technologies. Industry and NGOs can also play a proactive role, using forums like API to help codify and disseminate leading practices (for example, API’s July 2014 “Community Engagement Guidelines”205).
Immediate actions:
• Set robust state regulatory standards that are performance-based to better address gaps in areas such as water management, seismicity, and truck traffic.
• Design standards that are performance-based and encourage further innovation.
Achieve universal regulatory compliance
Uneven compliance is unnecessarily lowering environmental performance and slowing down the adoption of leading practices. Both industry and regulators have a stake in strengthening regulatory enforcement, complemented by stronger industry self-enforcement efforts.
Regulators must improve enforcement efforts. As production grows in a state, leaders must ensure that regulatory agencies are sufficiently funded and resourced with adequate talent. Furthermore, states should make inspections more effective by using better inspection technologies, such as infrared cameras to detect leaks, and by prioritizing inspection approaches, such as Colorado’s data-based reviews focused on the least reliable equipment.206
Industry must also take a leading role in encouraging compliance across producers and contractors. Unconventionals players can draw on the experiences of the chemicals industry or even the offshore oil sector to develop a pragmatic and proactive approach to self-enforcement. That not only benefits the American public, but also benefits the many producers who already have strong environmental compliance records.
Immediate actions:
• Bolster enforcement by adequately staffing state agencies, modernizing data management systems, prioritizing inspections based on past behavior, and sharing best practices among state regulators.
• Establish an industry-led self-enforcement process to supplement regulatory enforcement, considering models such as Responsible Care (chemicals) or the Center for Offshore Safety (offshore oil and gas).
Strengthen bodies driving continuous environmental improvement
Collaborative organizations are a powerful tool to raise the bar on environmental performance on an ongoing basis. As technologies and approaches to hydraulic fracturing and unconventionals development continue to progress, regulations and compliance practices need to keep pace. As outlined in Chapter 4, a group of continuous improvement bodies already exists to address operational, regulatory, and community topics (for example, IOGCC, STRONGER, CSSD, and API).
Such bodies can do much more to collaborate and ensure that their recommendations are widely adopted and understood by their constituents and the general public. They can proactively work with one another to achieve meaningful changes and then create communication forums to reach affected communities and raise general public awareness. One highly successful example of such collaborative continuous improvement has been the work by FracFocus to

AMERICA'S UNCONVENTIONAL ENERGY OPPORTUNITY 47
encourage chemical disclosures. The Groundwater Protection Council (GWPC) and IOGCC joined together to launch FracFocus.org in 2011, supported with funding from oil and gas trade groups and the U.S. DOE. The GWPC then worked with industry and regulators to spread the use of the database and widen the disclosure of chemicals. As of May 2015, 29 states have chemical disclosure rules in place, and 23 states use the FracFocus database.207 The database is well-known to the public and provides assurance to communities that producers are accountable for the chemicals they use. By working together, the GWPC, IOGCC, government agencies, and industry players were much more effective in mitigating chemicals risks than they would have been independently.
Immediate actions:
• Expand collaboration among existing continuous improvement bodies on overlapping areas of focus (e.g., IOGCC and STRONGER collaborating on regulatory best-practice sharing).
• Speed the dissemination of best practices in operator performance, regulations, and enforcement through more proactive stakeholder outreach by continuous-improvement bodies.
SPEEDING THE TRANSITION TO A CLEAN-ENERGY, LOWER-CARBON FUTUREUnconventional natural gas is a powerful mechanism to achieve substantial, low-cost carbon reductions while enabling a long-term, cleaner-energy, and lower-carbon transition. To achieve that, a series of steps is needed.
Contain methane leakage
Containing methane leaks throughout the natural gas production and transportation process secures the climate benefits of natural gas. The current extent of methane leakage is becoming better understood, and there are economical methods available today to contain leakage throughout the natural gas value chain. The EPA, the oil and gas industry, and NGOs must work together to develop both regulatory standards and best practices to ensure that all operators sufficiently mitigate leakage risks. While voluntary efforts and economic incentives have already led many producers to reduce methane emissions, sufficient regulations are also needed to curtail the emissions of outliers.
The Obama Administration’s recently proposed fugitive methane emissions reductions goals provide a constructive blueprint for balancing methane emission regulations with industry-led voluntary efforts.* The plan calls for a 40–45% reduction in fugitive methane emissions from oil and gas activity by 2025. For new oil and gas assets, including wells, gathering stations,
processing plants, and transmission compressor stations, the EPA will establish rules to regulate methane emissions. For existing assets, the EPA will encourage voluntary reductions, utilizing the existing EPA Natural Gas STAR program, which encourages oil and gas companies to adopt cost-effective methods of methane containment. If the Administration’s plan is implemented through performance-based regulations and active industry leadership, it can move the U.S. forward by developing some regulations to encourage higher performance, while also giving industry players the opportunity to proactively reduce methane in their current operations.
Immediate actions:
• Finalize the Obama Administration’s plan to reduce methane leakage in the oil and gas sector by 40–45% through flexible federal methane leakage standards for new oil and gas installations together with an enhanced voluntary Gas STAR improvement program for existing installations.
• Develop a strong industry-led program to ensure that the voluntary component for existing installations achieves its targets through existing bodies like America's Natural Gas Alliance (ANGA) and American Petroleum Institute (API), or through new coalitions such as One Future.
Set policies that encourage cost-effective emissions reductions
Natural gas is an essential tool for making cost-competitive carbon reductions in the power sector through 2030. Natural gas is the only fuel that is low-carbon, economically competitive, and highly scalable in the near term. And natural gas expansion does not lock in gas-fired power over the long term, as discussed in Chapter 5.
To speed up natural gas-based carbon reductions through 2030, climate policies and regulations should be market-based, so that cost-effective reductions are encouraged independent of specific technologies. Market-based policies, such as a carbon charge or cap-and-trade, are the most economically efficient ways of achieving emissions-reduction goals. They provide policy certainty for companies, reward the lowest-cost reductions, and encourage businesses to innovate and choose the most-effective emissions reduction options.
For example, if the proposed Clean Power Plan (CPP) or a similar policy is implemented, it should employ well-structured market mechanisms to achieve the most cost-effective reductions. Our estimates suggest that natural gas will be relied on heavily to implement
*The Administration’s plan to reduce methane emissions from the oil and gas sector, announced January 14, 2015, is separate from the EPA’s proposed Clean Power Plan. The methane emissions plan is focused on the oil and gas sector, whereas the Clean Power Plan is focused on the power sector.

48
a market-based carbon policy and that natural gas will drive large-scale reductions competitively.
Immediate actions:
• Ensure that all federal climate policies and regulations set clear, long-term targets for greenhouse gas emissions.
• Utilize market mechanisms to encourage cost-effective emissions reductions using the most competitive technologies.
Foster clean-energy technologies
While the transition to lower-carbon energy is already underway, the U.S. needs to make ongoing research investments in low-carbon energy technologies and applications, including potential future uses of unconventional natural gas. Since more than 60% of current carbon emissions come from sources outside of the power sector,208 low-carbon innovation will be needed in transportation and broader industry as well.
To get there, continued investment in research and development by both the private sector and government is needed. Venture capitalists and energy companies are already investing heavily in a range of low-carbon technologies, not only for energy production but also for how products can conserve energy. The U.S. must continue to lead the world in those areas. Private investments in energy research and development topped nearly $115 billion in 2009.209 Industry-funded non-profit research efforts, like the Electric Power Research Institute (EPRI), also contribute to technology development.
The U.S. government spends approximately $2 billion annually on energy R&D across all fuel types and technologies.210 By comparison, however, the U.S. spends more than $30 billion annually on health R&D and nearly $70 billion on R&D for national defense.211 Federal policy must provide for competitively sourced and broad-based energy R&D that explores a wide range of technologies, including renewables, carbon capture and storage, and natural gas for transportation.
Immediate actions:
• Continue both industry and federal research and development in renewables as well as other potentially competitive, cleaner-energy technologies.
• Encourage low-carbon innovation outside the power sector, including in transportation and heavy manufacturing.
Build out a smart, efficient energy grid
Beyond near-term carbon reduction from natural gas, a long-term (by approximately 2050) transition to an even lower lower-carbon energy system requires
a robust, dynamic power-grid infrastructure for both transmission and distribution. That grid will need to manage intermittent and distributed renewables generation and distributed generation, provide storage capacity, and process and react to real-time data to balance the electricity load. The U.S. and states must invest in improvements to grid infrastructure and smart, efficient-energy management systems that are essential to enabling lower-carbon technologies.
Building out the grid is estimated to require more than $750 billion in investment and several decades.212 In the near term (the next 10–15 years), low-cost natural gas can enable these investments. Natural gas plants will hold down power-generation costs, while large capital spending on the grid is required and will provide standby power to enable the greater introduction of more intermittent renewable sources.
States and regional electricity reliability councils must both take the lead to ensure that these needed grid improvements occur as quickly as possible. Today, the development of a smart, efficient grid across state lines is often slow and costly, due to inconsistent state and regional planning processes and rules. Several U.S. regions, including the Western Electricity Coordinating Council (WECC)213 and the Electricity Reliability Council of Texas (ERCOT),214 have ambitious plans and are making grid improvements to accommodate high levels of intermittent renewables (for instance, Texas’ ambitious CREZ system215). Other regions however, such as the Southeast Regional Transmission Planning (SERTP) process, still have no concrete plans in place for grids that can manage large-scale renewables. All states and regions need plans and must speed up the necessary investments to ensure that the future transmission and distribution grids are in place to economically and efficiently handle low-carbon sources.
Immediate actions:
• Modernize and expand the electricity grid (transmission and distribution) in all U.S. regions to enable utilization and management of large-scale renewable generation.
• Streamline rules and planning processes across regions to facilitate crucial interregional connections and efficiencies.
These eleven steps represent a viable, practical strategy for the U.S. They will be most effective if acted on collaboratively, with stakeholders supporting the combination of measures needed to minimize trade-offs and achieve the best overall outcome.
In the final chapter, we discuss how each stakeholder group can contribute to ending the current cycle of distrust and gridlock and begin to take actions that will put America on this win-win path.
AMERICA'S UNCONVENTIONAL ENERGY OPPORTUNITY 49
We believe that unconventional energy is one of the single-largest opportunities to change the trajectory of the U.S. economy and the prospects for the average American in the coming decades at a time when it is urgently needed. We also believe that America’s new energy advantage is key to reversing the faltering influence of the U.S. in the world and to making the transition to a cleaner-energy future practical and achievable. Only a thoughtful, coordinated approach by industry, environmental stakeholders, and governments can put the U.S. on the path to responsibly achieving the full benefits.
The win-win pathway allows the U.S. to take full advantage of the unconventionals opportunity, while delivering on the most important economic, environmental, and climate objectives. To put these steps into action, however, industry, NGOs, governments, and academics will need to move beyond their traditional postures and begin to break down the historic rivalries and distrust that have led to the current discord, zero-sum mindsets, and slow progress. Stakeholders, who doubt the motives of other actors, wait on others to move first. A lack of common understanding of the facts compounds the problem, especially when stakeholders continue to echo established ideology, rather than engaging in constructive dialogue based on up-to-date understanding of the opportunity, risks, and choices at hand.
Amid the rancor, however, there are signs of change. Leading companies are working with communities to minimize local environmental impact. Efforts like FracFocus and CSSD have begun to bring industry, NGOs, and policy makers together on particular regulatory issues, or in particular geographies. NGOs, producers, and academic institutions have collaborated to study methane leakage intensively. Upstream and downstream industries, together with local governments, are developing worker training programs to make sure key skill gaps are addressed.
We need to achieve a “rational” middle ground that allows us to meet our collective goals. Long-entrenched opposition and antagonism will not dissipate overnight. But we must get started.
THE WAY FORWARDThe starting point in making real progress is to acknowledge that achieving our economic, environmental, and climate goals is important to all stakeholders, including the American public. We must increase economic growth, competitiveness, and prosperity. We
must protect the environment and health of our local communities and open spaces. And we must move to preserve the planet for future generations by taking pragmatic steps to mitigate the risks of climate change.
While acknowledging the legitimate concerns of stakeholders committed to each of these objectives, America must transition to a solutions mindset. Our work has amply demonstrated that there are barriers to the successful development of unconventionals, but also practical solutions. If we can approach this opportunity from the perspective of the national interest, all the work needed to be done becomes possible.
Gain a shared understanding of the facts
The first step toward changing the current rancor and debate is to establish common ground on the major economic, environmental, and climate facts about unconventionals. Time and again, our work has highlighted the reality that each stakeholder group is often operating from different versions of the truth. Stakeholders often choose to make arguments based on a siloed perspective or an unrealistic starting point, without consideration for the larger objectives and realities. And we are not alone in this view.
Even a recent U.S. Congress hearing highlighted the negative effects of biased research on hydraulic fracturing. (See page 50.) This lack of common understanding stymies nearly any discussion before it starts. By achieving common understanding, stakeholders can begin to debate real trade-offs and start to take positive actions that advance their own real interests.
Chapter 7:
MAKING PROGRESS
A lack of common understanding of the facts compounds the problem, especially when stakeholders continue to echo established ideology, rather than engaging in constructive dialogue based on an up-to-date understanding of the opportunity, risks, and choices at hand.

50
Highlight the distortions of obstructionists
Bad actors, who oppose making things better, not only hurt the chances of achieving a win-win pathway but also undermine the interests of all constructive companies and organizations across the stakeholder groups. For example, non-compliant producers make it harder for compliant producers to operate. Misinformation from one environmental NGO makes the legitimate research of other NGOs less credible. And hard-line obstructionist climate advocates close political doors for other climate groups that are trying to enact balanced agreements. The leaders in each stakeholder group must have the courage to highlight counterproductive behavior and draw distinctions between themselves and those who are not truly interested in progress.
Moderate rhetoric and inflammatory behavior
In addition to highlighting the distortions of the most extreme actors, it is important that companies and other organizations take steps to change their tone, moderate rhetoric, and temper disrespectful and combative behaviors. Industry leaders should use forums like the API, ANGA, and IPAA to encourage others within the industry to support the fundamental elements of a win-win path, and to move beyond the stance of constant opposition that many in the industry take. Environmental and climate groups should work within their coalitions to promote constructive views and actions built on making actual environmental and climate progress, rather than holding out for unrealistic ideals and absolutist solutions. Even governments and politicians need to moderate their stances, by proactively depoliticizing energy and climate battles.
By showing a willingness to seek solutions, and to put the American public and its broad interests first, stakeholders will lay the foundation for collaboration and progress.
Expand cross-stakeholder groups and forums
Finally, all the stakeholders need to start working together in earnest. That starts with building on already successful collaborations, and by talking regularly with one another. Cross-stakeholder forums on key topics pull together the legitimate interests and best thinking from each sector, which is where practical actions and solutions come from. The API technical standards process, STRONGER, CSSD, and the Colorado Oil and Gas Task Force are all good examples of what productive collaboration looks like.
In these, as well as in new partnerships, stakeholders need to focus on concrete actions to further the win-win pathway. For example, a coordinated cross-stakeholder advocacy campaign could help expedite elements of the action plan, especially those requiring political actions, such as export laws and climate legislation. Collaborative groups could even draft specific legislative and regulatory proposals, such as how to improve regulator IT systems and databases, or how to streamline infrastructure permitting. Collaborative efforts could also develop and put forward implementation plans for meeting specific regulations, like the EPA’s proposed methane rules.
GETTING STARTEDEach stakeholder group needs to get started. In Table 1 we have laid out concrete steps for industry, NGOs, and government stakeholders to begin moving forward. These steps are all actions that stakeholders can take on their own, even before the need to work across groups. They will lay the foundation for broader progress.
Industry
The first crucial step for industry stakeholders is to recognize the legitimate interests of environmental and climate stakeholders. While the economic benefits of unconventionals development are important, industry rhetoric can too often come across as focusing on economics at the expense of all other interests. Industry can also stop its often intense lobbying campaigns against any environmental or climate objectives. In doing so, industry would demonstrate that it is committed to a productive dialogue and not a zero-sum battle. Finally, industry stakeholders, especially producers, can start taking actions to recognize the risks and be more transparent. Examples include disclosing environmental performance data and working within the industry to proactively improve environmental compliance.
Distorted Data Undermine the Legislative ProcessOn April 23, 2015, The House of Representatives Committee on Science, Space, and Technology held a hearing that highlighted its concern that biased research was driving state and local decision-making on hydraulic fracturing. Representatives from both sides of the aisle lamented the misuse of data to support specific agendas.216
“We get so much diverse information disseminated … it’s hard to tell who is telling the truth and who might not be telling the whole truth and nothing but the truth.” – Rep. Bill Posey, R-Florida
The array of conflicting information “not only does a disservice to members of this committee [but also] does nothing to increase the trust of the fracking industry in … communities.” – Rep. Eddie Bernice Johnson, D-Texas

AMERICA'S UNCONVENTIONAL ENERGY OPPORTUNITY 51
Environmental and climate NGOs
For NGOs, their actions in many ways should mirror those of industry. They can start by recognizing the value and urgent need for economic growth and its fundamental role in driving American prosperity. While minimizing environmental impacts, protecting health, and mitigating climate change are crucial, NGOs must also be realistic that economic opportunity and an improving standard of living will inevitably require some impacts on the natural world. NGOs also need to make sure to portray the facts around hydraulic fracturing and unconventionals fairly and in full context, rather than using isolated incidents or biased studies to oppose development. In doing so, NGOs will show they are serious about making real environmental progress and provide incentives for industry players to come to the table. Finally, NGOs can work within their communities to reign in some of the most radical and least constructive actors. While difficult, this also shows commitment to achieving progress and building positive momentum.
Policy makers and governments
While policy makers and regulators are obligated to balance the various stakeholder interests and put the American public first, they need to do more to make this a reality. First, across both sides of the aisle, they need to recognize that, to truly achieve American prosperity and serve the community, economic, environmental, and climate objectives are all important. Policies and regulations need to reflect that balance. Next, government actors need to reduce the partisanship associated with every aspect of unconventionals development. Unconventionals development should not just be a Republican platform plank, nor should environmental and climate protection just be a Democratic platform plank.
Finally, policy makers can start to take constructive and needed actions as well, such as enforcing infrastructure permitting timelines, bolstering environmental enforcement capacity, and finalizing methane leakage rules.
Table 1: Immediate steps stakeholders can take on their own to move toward a win-win path
IndustryLocal environmental groups
and climate change advocatesPolicy makers and
governments
Recognize that battling with the communities in which industry does business is not good strategy
Acknowledge the importance of acting on environmental protection and climate change
Acknowledge the economic and competitiveness benefits of unconventionals, and their importance to communities across America
Acknowledge the legitimate interests of the economic, environmental, and climate stakeholders
Publicly recognize the legitimate environmental risks created by unconventionals development
Publicly recognize the progress made by industry and governments in reducing environmental impacts and risks
Publicly support the need for better policies and regulations to support responsible development, rather than posturing for unrealistic ideals
Recognize and acknowledge the long-term energy transition that is well underway. Stop aggressive lobbying against all environmental and climate regulations
Stop aggressive protests and legal battles towards all unconventionalsproduction or infrastructure
Stop the partisan gridlock that prevents progress on even no-regret moves and harms both parties core constituencies
Disclose environmental performance data
Support and actively participate in continuous improvement efforts such as API standards, STRONGER, and local efforts
Enforce existing policies including regulatory compliance and permitting timelines
Take proactive steps to improve environmental practices across all industry participants
Take proactive steps to bring more combative groups into the collaborative discussion
Take proactive steps to establish public roadmaps for resolving key economic, environmental, and climate topics at the federal and state levels

52
OUR COMMITMENTAs stakeholders in the future of the U.S. and authors of this work, the HBS-BCG team is committed to determining and sharing the facts on unconventionals, working across stakeholder groups to further productive actions going forward, and playing other roles in turning the win-win pathway into reality. In particular, we commit to taking the following steps:
• We will pursue a public education campaign on America’s energy opportunity, the facts, and the path forward
• We will convene more cross-stakeholder forums to discuss solutions and tangible action steps
• We will respond to and cooperate with thoughtful efforts to improve the fact base, analysis and policy steps needed
• We will call out groups and individuals who distort the truth, and take self-serving actions that are not in the interest of the U.S. or the public.
• We will publicize what’s working and share best practices across all stakeholders
AMERICA'S UNCONVENTIONAL ENERGY OPPORTUNITY 53
GDP CONTRIBUTION, JOBS SUPPORTED, SALARIES, AND GOVERNMENT REVENUES
Summary of the approach
To estimate the GDP, jobs, salary, and government revenue impacts of unconventional oil and gas resource extraction in the U.S. economy, The Boston Consulting Group and Harvard Business School utilized software from the IMPLAN Group LLC.217 The IMPLAN software uses a set of linear multipliers derived from an input-output analysis to estimate the value-added output, employment, employee compensation (also referred to as salary), and government tax revenue effects of an increase in final demand in an industry. Specifically, final demand, the value of goods and services sold to final users, is estimated for an industry. This final demand figure is then multiplied by a set of GDP, employment, and labor income multipliers to estimate the direct, supplier, and labor income spending impacts of that industry. Definitions of direct impacts, supplier impacts, and labor income spending impacts are provided below:
• Direct impacts – The economic impacts generated from the industries engaged directly in unconventionals operations and capital expenditure (CAPEX) activities (for example, oil and gas extraction, oil field services).
• Supplier impacts – The additional economic impacts generated from other industries expanding in order to supply those industries engaged directly in unconventionals operations and CAPEX activities.
• Labor income spending impacts – The additional economic impacts generated by labor income spending from households who work in or are suppliers for industries engaged in unconventionals operations and CAPEX activities. Labor income includes employee compensation (wages and benefits) and proprietor income. Employee compensation is defined as the total payroll cost of the employee for the employer, including wage and salary, all benefits (such as health or retirement) and payroll taxes (both sides of social security, unemployment taxes).
BCG and HBS utilized the 2013 IMPLAN parameters and multipliers for this study, which are available for purchase online from the IMPLAN Group (http://www.implan.com).
For a detailed explanation of the IMPLAN methodology and software, please refer to the IMPLAN guide “Principles of Impact Analysis and IMPLAN Application.”218
Inputs used in the IMPLAN software
In the BCG and HBS model, the economic impact estimates of unconventional oil and gas resource extraction are based on the level of industry demand for two categories of activities related to unconventional resource extraction. The first category of demand is CAPEX activities, which is the demand generated from initial investments in property, plants, and equipment required to enable production of the unconventional oil and gas and downstream processes. CAPEX spending is measured for oil, gas, and natural gas liquids (NGLs) extraction, transportation and storage logistics, LNG export facilities, petroleum refining, and petrochemical manufacturing. The second category of demand results from operational activities (in other words, production) along the unconventional oil and gas value chain. Production final demand is measured for oil, gas and NGLs extraction, petroleum refining, and petrochemical manufacturing.
Final demand figures are estimated for all of the activities in each category. For example, final demand figures for unconventional oil extraction was obtained by multiplying estimates of resource production level and prices. Forecasts of resource production levels were obtained from the Energy Information Administration (EIA).219 Forecasts of CAPEX spending were obtained from IHS.220 Refining final demand is calculated as a percentage of unconventional oil production. Forecasts of petrochemical production from unconventionals were obtained from the American Chemistry Council.221
After final demand figures for each industry are estimated, they are provided as an input to the software, which multiplies them with the set of GDP, employment, and labor income multipliers for each industry to arrive at the direct, supplier, and labor income spending impacts to value-added output, employment, employee compensation, and government tax revenues for all industries in the economy.
Appendix I:
ESTIMATING ECONOMIC IMPACTS OF UNCONVENTIONAL ENERGY DEVELOPMENT
54
Other calculations
Employment: The IMPLAN estimates of employment in oil and gas extraction include proprietors—individuals who do not receive a wage or salary but receive income from an oil or gas extraction business (such as revenues from an ownership stake in a well). Because these individuals are not involved in day-to-day operations related to oil and gas extraction, BCG and HBS subtracted these individuals from the IMPLAN estimates of direct employment from unconventional oil and gas extraction. The proportion of proprietors in oil and gas extraction employment figures provided by the Bureau of Economic Analysis222 was used to estimate the percentage of proprietors in the IMPLAN figures.
Salaries: Salaries are estimated by dividing the employee compensation estimates by the estimates of employment, net of proprietors.
Federal, state, and local revenues: The IMPLAN software provides an estimate of the federal, and state, and local taxes generated by the final demand input using another set of multipliers. However, these figures do not include other sources of revenue specific to oil and gas resource development, such as royalty and bonus payments. To the IMPLAN software output, BCG and HBS added estimates of federal royalty and bonus payments, severance taxes, ad valorem taxes, and state bonus and royalty payments from oil and gas production. These estimates were obtained from IHS.223
Impacts from oil and gas exports: To estimate the potential impacts of lifting the ban on U.S. crude oil exports and the potential effects of LNG exports, BCG and HBS first estimated alternative price and production figures for unconventional oil and gas resources in a scenario where oil exports were permitted and a domestic LNG export market was developed.
If the ban on U.S. crude oil exports were lifted, BCG and HBS estimates that spot crude oil prices received by oil extraction companies would experience a moderate increase as domestic prices converged with international spot prices, while production would remain unchanged (a conservative assumption). In addition, as a result of higher crude oil prices, refiners would enjoy smaller margins,224 impacting the value of final demand generated by the industry, and therefore the economic impacts predicted by the IMPLAN approach.
BCG and HBS also modeled the impact of the development of an LNG export market, projecting that this market would develop by 2020 and would lead to up to 3.07 TCF of additional unconventional natural gas production by 2030. BCG and HBS estimated that spot prices would rise moderately.225
The price and production estimates in the oil and gas export scenarios were then used to calculate an alternative set of GDP, employment, employee compensation, and government revenue impacts. The
difference in the value of the impacts between the export scenarios and the scenario without exports were used to estimate the incremental contribution of exports to the economic impacts of unconventional resource development.
SAVINGS FOR HOUSEHOLDS FROM LOW-COST NATURAL GAS AND NATURAL GAS LIQUIDS (NGLS) Forecasts of household savings from cheaper lower-cost natural gas and NGLs as a result of unconventionals extraction were obtained for three categories: 1) natural gas bill savings; 2) electric-bill savings; and 3) lower-cost goods and services. The forecasts were derived by first estimating the prices of natural gas and NGLs (ethane, propane, and butane) in the absence of unconventional resource extraction. Future natural gas prices were estimated to remain at the 2005 level.226 Historical ratios of NGL prices to crude oil prices were used to estimate future NGL prices.227 These prices were then multiplied by BCG and HBS forecasts of consumption. The difference between the expenditures in the absence of and presence of unconventional resource extraction yielded the aggregate annual savings for the U.S. economy. To apportion these savings to households, BCG and HBS followed the methodology set out in BCG’s Made in America, Again series publication on household energy savings.228

AMERICA'S UNCONVENTIONAL ENERGY OPPORTUNITY 55
2014 2020 2030
Value-added (2012 $, millions) $433,613 $482,433 $586,345
Direct 238,929 255,175 291,370
Operation activities 177,015 179,171 189,248
Capital investment activities (CAPEX) 61,913 76,004 102,122
Supplier impacts 78,909 101,459 143,185
Labor income spending impacts 115,776 125,798 151,791
Jobs supported 2,697,541 3,014,920 3,787,877
Direct 627,645 668,057 833,509
Operation activities 116,892 117,895 124,712
Capital investment activities (CAPEX) 510,753 550,163 708,797
Supplier impacts 667,644 823,421 1,116,510
Labor income spending impacts 1,402,252 1,523,442 1,837,859
Average compensation per employee (2012 $) $51,672 $52,156 $52,795
Direct 61,928 63,335 65,313
Operation activities 55,850 56,155 57,393
Capital investment activities (CAPEX) 66,584 68,322 69,637
Supplier impacts 61,067 60,826 60,491
Labor income spending impacts 40,539 40,541 40,544
Government revenues (2012 $, millions) $111,371 $127,921 $159,090
Federal taxes and other revenues 56,524 63,045 76,395
State and local taxes and other revenues 54,847 64,875 82,695
Household savings from low-cost energy (2014 $) $776 $848 $1,067
Natural gas bill savings 120 109 106
Electric bill savings 102 109 159
Cheaper goods & services 554 630 802
Table 2: Summary table of the economic impacts from unconventional gas and oil development
Note: CAPEX stands for capital expenditures. Figures include incremental impacts from reversing the ban on crude oil exports, as well as incremental impacts from liquefied natural gas (LNG) exports. Salary figures represent the total payroll cost of the employee for the employer, including wage and salary, benefits (e.g. health, retirement), and payroll taxes. Figures are rough estimates used for illustration.
56
Appendix II:
ANALYSIS OF UNCONVENTIONALS JOB POSTINGS BY BURNING GLASS
Appendix III:
CALCULATING COSTS OF CSSD STANDARDS COMPLIANCE
All job posting data in this report are drawn from Burning Glass’s database of online job postings, which includes nearly 100 million worldwide postings collected since 2007. Burning Glass collects these job postings from more than 38,000 online job boards and sites, and uses advanced text analytics to extract more than 70 data fields from each posting, such as job title, occupation, employer, industry, required skills, and credentials and salary. Postings are then edited for duplications and placed in a database for further analysis.
The jobs in this analysis are for the period of October 2013 to November 2014.
For the purposes of this analysis, unconventional energy jobs were defined as those supporting the extraction, distribution, and refinement of oil and gas resources obtained through hydraulic fracturing-related technologies. Unconventional energy job postings were identified using a combination of skills, keywords, and industries mentioned in postings. Keywords were broken into three categories: technological terms associated with fracking (such as “hydraulic fracturing”), terms associated with fracking geology (“shale”), and names of prominent shale plays (geographic areas) that featured in postings (for example, “Marcellus”).
To estimate the costs of complying with CSSD standards for new wells drilled in the Marcellus Shale, BCG and HBS calculated the incremental costs required to meet each of the 15 CSSD performance standards. Though many operators are already complying with a number, and some with all, of the CSSD’s performance standards, we estimated the average cost for an operator in the Marcellus Shale who is not currently complying with any of the performance standards.
To estimate the additional cost of meeting each standard, we utilized primarily public sources. (See Table 3.) Where public sources were unavailable, we utilized BCG’s Unconventionals Operational Database, as well as BCG’s Energy Practice upstream operations experts, and we cross-referenced estimates with industry operators and environmental groups. We discovered that a range of additional costs can be expected, depending on the existing operational setup, regional geography and geology, and compliance methodologies utilized. The costs of meeting the overall standards were compiled by adding up the individual estimates. The overall low-cost estimate is the sum of the low-cost estimates for each individual standard (where a range was estimated). The overall high-cost estimate is the sum of the high-cost estimate for each individual standard.
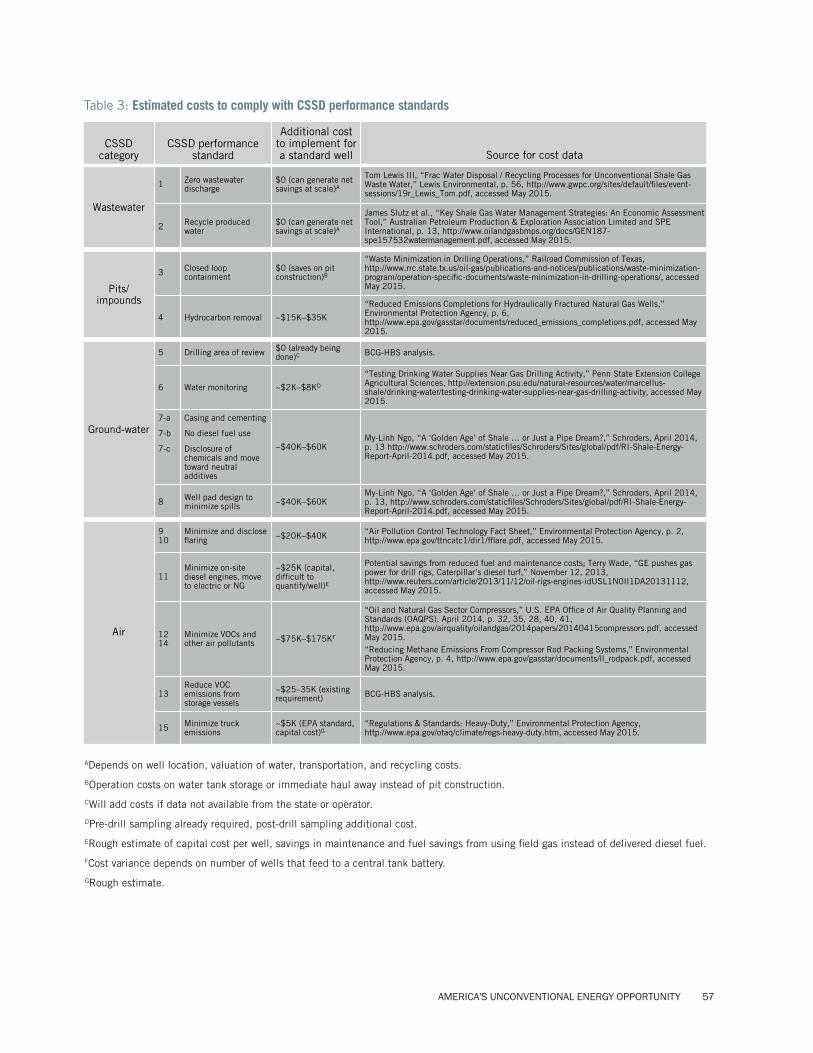
AMERICA'S UNCONVENTIONAL ENERGY OPPORTUNITY 57
Table 3: Estimated costs to comply with CSSD performance standards
CSSD category
CSSD performance standard
Additional cost to implement for a standard well Source for cost data
Wastewater
1 Zero wastewater discharge
$0 (can generate net savings at scale)A
Tom Lewis III, “Frac Water Disposal / Recycling Processes for Unconventional Shale Gas Waste Water,” Lewis Environmental, p. 56, http://www.gwpc.org/sites/default/files/event-sessions/19r_Lewis_Tom.pdf, accessed May 2015.
2 Recycle produced water
$0 (can generate net savings at scale)A
James Slutz et al., “Key Shale Gas Water Management Strategies: An Economic Assessment Tool,” Australian Petroleum Production & Exploration Association Limited and SPE International, p. 13, http://www.oilandgasbmps.org/docs/GEN187-spe157532watermanagement.pdf, accessed May 2015.
Pits/ impounds
3 Closed loop containment
$0 (saves on pit construction)B
“Waste Minimization in Drilling Operations,” Railroad Commission of Texas, http://www.rrc.state.tx.us/oil-gas/publications-and-notices/publications/waste-minimization-program/operation-specific-documents/waste-minimization-in-drilling-operations/, accessed May 2015.
4 Hydrocarbon removal ~$15K–$35K
“Reduced Emissions Completions for Hydraulically Fractured Natural Gas Wells,” Environmental Protection Agency, p. 6, http://www.epa.gov/gasstar/documents/reduced_emissions_completions.pdf, accessed May 2015.
Ground-water
5 Drilling area of review $0 (already being done)C BCG-HBS analysis.
6 Water monitoring ~$2K–$8KD
“Testing Drinking Water Supplies Near Gas Drilling Activity,” Penn State Extension College Agricultural Sciences, http://extension.psu.edu/natural-resources/water/marcellus-shale/drinking-water/testing-drinking-water-supplies-near-gas-drilling-activity, accessed May 2015.
7-a
7-b
7-c
Casing and cementing
No diesel fuel use
Disclosure of chemicals and move toward neutral additives
~$40K–$60KMy-Linh Ngo, “A ‘Golden Age’ of Shale … or Just a Pipe Dream?,” Schroders, April 2014, p. 13 http://www.schroders.com/staticfiles/Schroders/Sites/global/pdf/RI-Shale-Energy-Report-April-2014.pdf, accessed May 2015.
8 Well pad design to minimize spills ~$40K–$60K
My-Linh Ngo, “A ‘Golden Age’ of Shale … or Just a Pipe Dream?,” Schroders, April 2014, p. 13, http://www.schroders.com/staticfiles/Schroders/Sites/global/pdf/RI-Shale-Energy-Report-April-2014.pdf, accessed May 2015.
Air
910
Minimize and disclose flaring ~$20K–$40K “Air Pollution Control Technology Fact Sheet,” Environmental Protection Agency, p. 2,
http://www.epa.gov/ttncatc1/dir1/fflare.pdf, accessed May 2015.
11Minimize on-site diesel engines, move to electric or NG
~$25K (capital, difficult to quantify/well)E
Potential savings from reduced fuel and maintenance costs; Terry Wade, “GE pushes gas power for drill rigs, Caterpillar’s diesel turf,” November 12, 2013, http://www.reuters.com/article/2013/11/12/oil-rigs-engines-idUSL1N0II1DA20131112, accessed May 2015.
1214
Minimize VOCs and other air pollutants ~$75K–$175KF
“Oil and Natural Gas Sector Compressors,” U.S. EPA Office of Air Quality Planning and Standards (OAQPS), April 2014, p. 32, 35, 28, 40, 41, http://www.epa.gov/airquality/oilandgas/2014papers/20140415compressors.pdf, accessed May 2015. “Reducing Methane Emissions From Compressor Rod Packing Systems,” Environmental Protection Agency, p. 4, http://www.epa.gov/gasstar/documents/ll_rodpack.pdf, accessed May 2015.
13 Reduce VOC emissions from storage vessels
~$25–35K (existing requirement) BCG-HBS analysis.
15 Minimize truck emissions
~$5K (EPA standard, capital cost)G
“Regulations & Standards: Heavy-Duty,” Environmental Protection Agency,http://www.epa.gov/otaq/climate/regs-heavy-duty.htm, accessed May 2015.
ADepends on well location, valuation of water, transportation, and recycling costs.
BOperation costs on water tank storage or immediate haul away instead of pit construction.
CWill add costs if data not available from the state or operator.
DPre-drill sampling already required, post-drill sampling additional cost.
ERough estimate of capital cost per well, savings in maintenance and fuel savings from using field gas instead of delivered diesel fuel.
FCost variance depends on number of wells that feed to a central tank battery.
GRough estimate.
58
To model solar power’s levelized cost per unit of energy output through 2050, we adapted average industry costs for the module,229 inverter,230 and other labor/balance of system costs.231 We then applied different learning curves to each component to model the change in cost over time using rates established by BCG232 and Heliotronics.233 A learning curve rate is the proportion by which unit costs fall for each doubling of volume produced. We also assumed that the growth in solar would slowly diminish over time using projections from ACORE,234 such that the year-over-year rate of decline in costs would also slow. Our aggressive cost estimate assumes full learning curve rates; our conservative estimate assumes halved learning curve rates. In addition, the aggressive curve assumes an average capacity factor characteristic of Texas; the conservative curve assumes a factor characteristic of New England.235
As wind power is a more mature technology than solar, we estimated its costs using a single learning curve rate (established by IEA Wind236 and Bloomberg237) that we applied to its overall 2014 levelized cost as analyzed by the DOE.238 The model also assumes that the growth of the wind industry steadily slows, according to projections
from the American Wind Energy Association,239 such that the rate of cost decline also slows over time. Our aggressive cost estimate assumes full learning curve rates; our conservative estimate assumes halved learning curve rates. Like the solar curves, the aggressive curve reflects a capacity factor characteristic of Texas, while the conservative curve assumes a capacity factor characteristic of New England.240
We modeled the cost of energy output for a combined cycle gas turbine (CCGT) by examining the projected lifetime costs of a plant, factoring in a plant’s declining heat rate (volume of energy delivered per kilowatt-hour) and the projected cost of natural gas fuel. Installation, operating, and maintenance costs were adapted from EIA.241 The base heat rate and rate of heat rate decline for an aging plant were adapted from historical EIA data,242 and a 30-year lifetime was assumed.243 Aggressive cost estimates were developed by decreasing forecasted Henry Hub natural gas prices by 25%, and conservative cost estimates were developed by increasing forecasted Henry Hub natural gas prices by 25%.244
We estimated the evolution of U.S. natural gas power plant capacity from 2014 through 2060 for the following scenario: Natural gas power plant capacity follows the capacities needed to achieve the proposed Clean Power Plan at lowest cost by 2030, but then no new natural gas power plant capacity is installed past 2030. As a starting point to model capacity growth from 2014 through 2030, we used natural gas capacity projections from EIA’s 2014 AEO Reference Case. However, these projections do not factor in the impacts of the EPA’s Clean Power Plan, so we modified the AEO Reference Case projections using capacity projections developed in the report “Remaking American Power” by CSIS and Rhodium Group.245
To model retirements of natural gas plants beginning in 2014, we assumed that every year, power plants installed 30 years prior would be retired. This assumption is widely employed in natural gas power
plant life-cycle analysis by industry, as well as organizations such as the NREL246 and IEA.247 Although gas plants can be utilized for more than 30 years with significant refurbishments, as a plant’s efficiency declines and the efficiency of newer models improves, investing in continued refurbishments for a 30-year-old plant will yield lesser returns than investing in a new plant altogether. Therefore, the 30-year assumed lifetime is an accurate reflection of the expected economic lifetime for an average gas power plant.
Historical installation data from the Energy Velocity248
database was used to project the number of gigawatts retired from 2014 through 2044. Beyond 2044 and through 2060, we used our own growth projections of capacity additions from 2014 to 2030 to model the remainder of the retirements.
Appendix IV:
ESTIMATING THE LEVELIZED COST OF ELECTRICITY (LCOE), 2015–2050
Appendix V:
ESTIMATING NATURAL GAS POWER PLANT RETIREMENTS, 2014–2060

AMERICA'S UNCONVENTIONAL ENERGY OPPORTUNITY 59
ENDNOTES
1 Michael E. Porter and Jan W. Rivkin et al., “An Economy Doing Half Its Job,” September, 2014, p. 2, http://www.hbs.edu/competitiveness/Documents/an-economy-doing-half-its-job.pdf, accessed May 2015.
2 “Natural Gas Gross Withdrawals and Production,” Energy Information Administration website, March 31, 2015, http://www.eia.gov/dnav/ng/ng_prod_sum_dcu_NUS_m.htm, accessed April 2015.
3 “Crude Oil Production,” Energy Information Administration website, http://www.eia.gov/dnav/pet/pet_crd_crpdn_adc_mbbl_m.htm, accessed May 2015.
4 “International Energy Statistics,” Energy Information Administration website, http://www.eia.gov/cfapps/ipdbproject/iedindex3.cfm?tid=5&pid=55&aid=1&cid=RS,SA,US,&syid=1980&eyid=2014&unit=TBPD, accessed April 2015.
5 Harold L. Sirkin, Michael Zinser, and Justin Rose, “The U.S. as One of the Developed World’s Lowest-Cost Manufacturers, Behind the American Export Surge,” The Boston Consulting Group, August 20, 2013, https://www.bcgperspectives.com/content/articles/lean_manufacturing_sourcing_procurement_behind_american_export_surge, accessed May 2015.
6 “Shale Gas Prospects Outside North America: Boston Consulting Group’s Quarterly Analysis,” BCG January, 2015. See also, Clifford Krauss, “Drillers Answer Low Oil Prices with Cost-Saving Innovations,” The New York Times, May 11, 2015, http://www.nytimes.com/2015/05/12/business/energy-environment/drillers-answer-low-oil-prices-with-cost-saving-innovations.html?mabReward=A4&action=click&pgtype=Homepage®ion=CColumn&module=Recommendation&src=rechp&WT.nav=RecEngine&_r=2 accessed on May 2015.
7 BCG and HBS Competitive Impacts Model; please refer to Appendix I for detailed methodology.
8 “Current Employment Statistics,” Bureau of Labor Statistics website, http://www.bls.gov/data/, accessed May 2015.
9 Burning Glass analysis; please refer to Appendix II for detailed methodology.
10 The Boston Consulting Group analysis.
11 “U.S. Imports of Crude Oil and Petroleum Products,” Energy Information Administration website, http://www.eia.gov/dnav/pet/hist/LeafHandler.ashx?n=pet&s=mttimus2&f=a, accessed May 2015.
12 American Chemistry Council Infographic, http://www.americanchemistry.com/Policy/Energy/Shale-Gas/Shale-Investment-Infographic.pdf, accessed May 2015.
13 “Shale Gas, Competitiveness and New U.S. Investment: A Case Study of Eight Manufacturing Industries,” Economics & Statistics Department, American Chemistry Council, May 2012, p. 17, http://chemistrytoenergy.com/sites/chemistrytoenergy.com/files/downstream-study_final.pdf, accessed May 2015.
14 Harold L. Sirkin, Michael Zinser, and Justin Rose, “The U.S. as One of the Developed World’s Lowest-Cost Manufacturers, Behind the American Export Surge,” The Boston Consulting Group, August 20, 2013, https://www.bcgperspectives.com/content/articles/lean_manufacturing_sourcing_procurement_behind_american_export_surge, accessed May 2015.
15 Cary Funk and Lee Rainie, “Chapter 3: Attitudes and Beliefs on Science and Technology Topics,” PewResearchCenter, January 29, 2015, http://www.pewinternet.org/2015/01/29/chapter-3-attitudes-and-beliefs-on-science-and-technology-topics/, accessed May 2015.
16 “How does electricity affect the environment? Natural gas,” Energy Information Administration website, http://www.epa.gov/cleanenergy/energy-and-you/affect/natural-gas.html, accessed May 2015.
17 “Table 9.1 Emissions from Energy Consumption at Conventional Power Plants and Combined-Head-and-Power Plants,” Energy Information Administration website, http://www.eia.gov/electricity/annual/html/epa_09_01.html, accessed April 2015.
18 Coral Davenport, “New Federal Rules Are Set for Fracking,” The New York Times, March 20, 2015, http://www.nytimes.com/2015/03/21/us/politics/obama-administration-unveils-federal-fracking-regulations.html, accessed May 2015.
19 “Cuomo Bans Fracking,” The Wall Street Journal, http://www.wsj.com/articles/cuomo-bans-fracking-1418947374, accessed May 2015.
20 New York Department of Health, “A Public Health Review of High Volume Hydraulic Fracturing for Shale Gas Development.” December 2014, http://www.health.ny.gov/press/reports/docs/high_volume_hydraulic_fracturing.pdf, accessed May 2015.
21 National Income and Product Accounts Tables, Bureau of Economic Analysis, http://www.bea.gov/iTable/iTable.cfm?ReqID=9&step=1#reqid=9&step=1&isuri=1, accessed May 2015.
22 Inflation and Prices, Bureau of Labor Statistics website, http://www.bls.gov/data/#employment, accessed May 2015.
23 Labor Force Statistics from the Current Population Survey, Bureau of Labor Statistics website, http://www.bls.gov/data/#employment, accessed May 2015.

60
24 Mercedes Delgado, Michael E. Porter, and Scott Stern, “Defining Clusters of Related Industries,” The National Bureau of Economic Research, August 2014, http://www.nber.org/papers/w20375.pdf, accessed May 2015.
25 Ibid.
26 Carmen DeNavas-Walt and Bernadette D. Proctor, “Income and Poverty in the United States: 2013,” U.S. Census Bureau, Current Population Survey Annual Social and Economic Supplement, p. 6, https://www.census.gov/content/dam/Census/library/publications/2014/demo/p60-249.pdf, accessed May 2015.
27 “The Employment Situation: March 2015,” Bureau of Labor Statistics website, http://www.bls.gov/news.release/archives/empsit_04032015.htm, accessed May 2015.
28 “Employment Situation: January 2000,” Bureau of Labor Statistics website, http://www.bls.gov/schedule/archives/empsit_nr.htm#2015, accessed May 2015.
29 Michael E. Porter and Jan W. Rivkin, et al, “An Economy Doing Half Its Job,” September 2014, http://www.hbs.edu/competitiveness/Documents/an-economy-doing-half-its-job.pdf, p. 2, accessed May 2015.
30 “Firm Characteristics Data Tables,” U.S. Census Bureau website, http://www.census.gov/ces/dataproducts/bds/data_firm.html, accessed May 2015.
31 Ian Hathaway and Robert E. Litan, “Declining Business Dynamism in the United States: A Look at States and Metros,” Economic Studies at Brookings, May 2014.
32 Michael E. Porter and Jan W. Rivkin, “The Looming Challenge to U.S. Competitiveness,” Harvard Business Review, March 2012, https://hbr.org/2012/03/the-looming-challenge-to-us-competitiveness, accessed May 2015.
33 Databases, Tables & Calculators, Bureau of Labor Statistics website, http://www.bls.gov/data/, accessed May 2015.
34 National Income and Product Accounts Tables, Bureau of Economic Analysis website, http://www.bea.gov/iTable/iTable.cfm?ReqID=9&step=1#reqid=9&step=1&isuri=1, accessed May 2015.
35 For past Harvard Business School alumni surveys on U.S. competitiveness (years 2011, 2012, 2013-14,) visit http://www.hbs.edu/competitiveness/research/Pages/default.aspx?type=Survey.
36 Michael Porter and Jan Rivkin, “What Washington Must Do Now: An Eight-Point Plan to Restore American Competitiveness,” The Economist, November 21, 2012, http://www.economist.com/news/21566902-eight-point-plan-restore-american-competitiveness-what-washington-must-do-now?zid=293&ah=e50f636873b42369614615ba3c16df4a, accessed May 2015.
37 Rystad Ucube, http://www.rystadenergy.com/Databases/UCube, accessed August 2014.
38 “Technically Recoverable Shale Oil and Shale Gas Resources: An Assessment of 137 Shale Formations in 41 Countries Outside the United States,” Energy Information Administration website, June 13, 2014, http://www.eia.gov/analysis/studies/worldshalegas/, accessed April 2015.
39 February 2013 Monthly Energy Review: Table 1.2 Primary Energy Production by Source, Energy Information Administration website, http://www.eia.gov/totalenergy/data/monthly/archive/00351502.pdf, p. 5, accessed April 2015.
40 Ibid.
41 Annual Energy Outlook 2015: Table 1 Total Energy Supply, Disposition, and Price Summary, Energy Information Administration website, http://www.eia.gov/forecasts/aeo/excel/aeotab_1.xlsx accessed on May 2015.
42 Henry Hub Natural Gas Spot Price, Energy Information Administration website, http://www.eia.gov/dnav/ng/hist/rngwhhdd.htm, accessed May 2015.
43 Harold L. Sirkin, Michael Zinser, and Justin Rose, “The U.S. as One of the Developed World’s Lowest-Cost Manufacturers: Behind the American Export Surge,” The Boston Consulting Group, August 20, 2013, p. 6, https://www.bcgperspectives.com/content/articles/lean_manufacturing_sourcing_procurement_behind_american_export_surge, accessed May 2015.
44 Charles River Associates, “U.S. Manufacturing and LNG Exports,” http://www.crai.com/sites/default/files/publications/CRA_LNG_Study.pdf, accessed May 2015.
45 “Shale Gas Prospects Outside North America: Boston Consulting Group’s Quarterly Analysis,” BCG January 2015.
46 Ibid.
47 “Overview, Natural Gas Consumption by End Use Sector and Census Division, Table 135,” Energy Information Agency website, http://www.eia.gov/forecasts/aeo/er/tables_ref.cfm, accessed May 2015.
48 “Oil Crude and Petroleum Products Explained,” Energy Information Administration website, http://www.eia.gov/energyexplained/index.cfm?page=oil_use, accessed April 2015.
49 BCG and HBS Competitive Impacts Model; please refer to Appendix I for detailed methodology.
50 2020 and 2030 figures include the additional impacts from LNG exports and crude oil exports.
AMERICA'S UNCONVENTIONAL ENERGY OPPORTUNITY 61
51 BCG and HBS Competitive Impacts Model; please refer to Appendix I for detailed methodology.
52 Analysis conducted by Burning Glass Technologies based on a sample size of 13,136 postings listed on major online job websites between November 2013 and October 2014. Job postings are related to unconventional energy extraction and job skills filters.
53 Ibid.
54 BCG and HBS Competitive Impacts Model; please refer to Appendix I for detailed methodology.
55 “Industry Snapshot, Petrochemical Manufacturing,” U.S. Census Bureau website, http://thedataweb.rm.census.gov/TheDataWeb_HotReport2/econsnapshot/2012/snapshot.hrml?NAICS=325110, accessed May 2015.
56 “Petrochemicals Market is Expected to Reach US $885.07 billion by 2020,” Transparency Market Research, February 23, 2015, http://globenewswire.com/news-release/2015/02/23/708713/10121368/en/Petrochemicals-Market-is-Expected-to-Reach-US-885-07-Bn-by-2020-Transparency-Market-Research.html, accessed May 2015.
57 The Boston Consulting Group analysis. See also Harold L. Sirkin, Michael Zinser, and Justin Rose, “The U.S. as One of the Developed World’s Lowest-Cost Manufacturers: Behind the American Export Surge,” The Boston Consulting Group, August 20, 2013, and Harold L. Sirkin, Michael Zinser, and Justin Rose, “The Shifting Economics of Global Manufacturing,” The Boston Consulting Group, August 20, 2013.
58 Cynthia M Werneth et al., “Low-Cost Shale Gas Gives North American Petrochemical Producers Advantages Over Europe,” Standard&Poor’s Rating Services, RatingsDirect, April 23, 2013, p. 2, http://marcelluscoalition.org/wp-content/uploads/2013/04/Low-Cost-Shale-Gas-Gives-North-American-Petrochemical-Producers-Advantages-Over-Europe.pdf, accessed May 2015.
59 “Shale Gas and New U.S. Chemical Industry Investment: $138 Billion and Counting,” American Chemistry website, http://www.americanchemistry.com/Policy/Energy/Shale-Gas/Slides-Shale-Gas-and-New-US-Chemical-Industry-Investment138-Billion-and-Counting.pdf, accessed May 2015.
60 “Shale Gas and New Petrochemicals Investment: Benefits for the Economy, Jobs, and U.S. Manufacturing,” American Chemistry Council, May 2013, p. 25, http://chemistrytoenergy.com/sites/chemistrytoenergy.com/files/shale-gas-full-study.pdf, accessed April 2015.
61 Ibid.62 Jennifer Larino, “Sasol breaks ground on $8 billion phase of petrochemical complex near Lake Charles,” The Times Picayune,
March 27, 2015, http://www.nola.com/business/index.ssf/2015/03/sasol_ethane_cracker_lake_char.html, accessed May 2015.63 “Shale Gas, Competitiveness and New U.S. Chemical Industry Investment: An Analysis Based on Announced Projects,” American
Chemistry Council, Economics & Statistics Department, May 2013, p. 26, http://chemistrytoenergy.com/sites/chemistrytoenergy.com/files/shale-gas-full-study.pdf, accessed May 2015.
64 “The Rising Competitive Advantage of U.S. Plastics,” American Chemistry Council, May 2015, p. 6, http://plastics.americanchemistry.com/Education-Resources/Publications/The-Rising-Competitive-Advantage-of-US-Plastics.pdf, accessed May 2015.
65 “Natural Gas, Renewables Projected to Provide Larger Shares of Electricity Generation,” Energy Information Administration website, http://www.eia.gov/todayinenergy/detail.cfm?id=21072, accessed May 2015.
66 Harold L. Sirkin, Michael Zinser, and Justin Rose, “The U.S. as One of the Developed World’s Lowest-Cost Manufacturers: Behind the American Export Surge,” The Boston Consulting Group, August 20, 2013, https://www.bcgperspectives.com/content/articles/lean_manufacturing_sourcing_procurement_behind_american_export_surge, accessed May 2015.
67 Ashley Nervobig, “Big River Steel mill breaks ground,” ArkansasOnline, September 22, 2014, http://www.arkansasonline.com/news/2014/sep/22/groundbreaking-planned-big-river-steel-mill/, accessed May 2015.
68 “Long Term Applications Received by DOE/FE to Export Domestically Produced LNG from the Lower-48 States (as of March 26, 2015),” U.S. Department of Energy website, http://energy.gov/sites/prod/files/2015/03/f20/Summary%20of%20LNG%20Export%20Applications_0.pdf, accessed May 2015.
69 BCG and HBS Competitive Impacts Model; please refer to Appendix I for detailed methodology.70 Ivan Marten and Daniel Jimenez, “Low Prices Are Challenging Natural-Gas Markets,” Boston Consulting Group, March 30, 2015,
https://www.bcgperspectives.com/content/articles/energy_environment_low_oil_prices_challenging_natural_gas_markets/, accessed May 2015.
71 Lawrence Ulrich, “With Gas Prices Less of a Worry, Buyers Pass Hybrid Cars By,” The New York Times, May 14, 2015, http://www.nytimes.com/2015/05/15/automobiles/wheels/with-gas-prices-less-of-a-worry-buyers-pass-hybrids-cars-by.html?action=click&pgtype=Homepage&version=Moth-Visible&module=inside-nyt-region®ion=inside-nyt-region&WT.nav=inside-nyt-region, accessed May 2015.
72 “Updated Budget Projections: 2014–2024,” Congressional Budget Office website, April 14, 2014, http://www.cbo.gov/publication/45229, accessed April 2015.
73 “U.S. Imports by Country of Origin,” Energy Information Administration website, http://www.eia.gov/dnav/pet/pet_move_impcus_a2_nus_ep00_im0_mbbl_m.htm, accessed April 2015.
74 “Annual Energy Outlook 2014, Table: Petroleum and Other Liquids Prices,” Energy Information Administration website, http://www.eia.gov/beta/aeo/#/?id=12-AEO2014&cases=ref2015, accessed April 2015.
62
75 “Oil & Natural Gas Transportation & Storage Infrastructure: Status, Trends & Economic Benefits,” IHS Global Inc., December 2013, p. 33, http://www.api.org/~/media/Files/Policy/SOAE-2014/API-Infrastructure-Investment-Study.pdf
76 Amy Harder, “Protests Slow Pipeline Projects Across US, Canada,” The Wall Street Journal, December 9, 2014, http://www.wsj.com/articles/protests-slow-pipeline-projects-across-u-s-canada-1418173235, accessed May 2015.
77 Mathew Brown, “US Safety Board: Rail Tank Cars Hauling Fuel Need Urgent Upgrades to Protect Against Fires,” US News, April 7, 2015, http://www.usnews.com/news/us/articles/2015/04/07/us-safety-board-oil-train-tank-cars-need-urgent-upgrades, accessed May 2015.
78 “Pipeline Permitting: Interstate and Intrastate Natural Gas Permitting Processes Include Multiple Steps, and Time Frames Vary,” United States Government Accountability Office, February 2013, http://www.gao.gov/assets/660/652225.pdf, accessed May 2015.
79 Paul Parfomak, “Interstate Natural Gas Pipelines: Process and Timing of FERC Permit Application Review,” Congressional Research Service, November 19, 2013, p. 7, https://www.fas.org/sgp/crs/misc/R43138.pdf, accessed May 2015.
80 Burning Glass compared growth in job postings for the 12-month period ended October 2014 and compared it with the 12-month period ended December 2011.
81 Harold L. Sirkin, Michael Zinser, and Justin Rose, “Made in America, Again: The U.S. Skills Gap: Could It Threaten a Manufacturing Renaissance,” BCG Perspectives by The Boston Consulting Group, August 28, 2013, https://www.bcgperspectives.com/content/articles/lean_manufacturing_us_skills_gap_could_threaten_manufacturing_renaissance/#chapter1, accessed May 2015.
82 Burning Glass analysis; please refer to Appendix II for detailed methodology.83 Note: Data based on a sample size of 13,136 job postings listed on major online job websites between November 2013 and
October 2014. Job postings are related to unconventional energy extraction using keyword and skills filters.84 Labor Force Statistics from the Current Population Survey, Bureau of Labor Statistics website, http://www.bls.gov/cps/industry_
age.htm, accessed May 2015.85 BCG and HBS Competitive Impacts Model.86 “Electric Power Monthly,” Energy Information Administration website, http://www.eia.gov/electricity/monthly/epm_table_grapher.
cfm?t=epmt_1_1, accessed May 2015.87 “US Manufacturing and LNG Exports: Economic Contributions to the US Economy and Impacts on US Natural Gas Prices,”
Charles River Associates, prepared for The Dow Chemical Company, February 25, 2013, p. 34, http://www.crai.com/sites/default/files/publications/CRA_LNG_Study.pdf, accessed May 2015; W. David Montgomery et al, “Macroeconomic Impacts of LNG Exports from the United States,” NERA Economic Consulting, April 2013, p. 2, http://energy.gov/sites/prod/files/2013/04/f0/nera_lng_report.pdf, accessed May 2015.
88 “Effect of Increased Levels of Liquefied Natural Gas Exports on U.S. Energy Markets,” U.S. Energy Information Administration, October 2014, p. 12, http://www.eia.gov/analysis/requests/fe/pdf/lng.pdf, accessed May 2015.
89 BCG Global Natural Gas Market Model.90 BCG and HBS Competitive Impacts Model; please refer to Appendix I for detailed methodology.91 “How Americans View the Top Energy and Environmental Issues,” PewResearchCenter, January 15, 2015, http://www.
pewresearch.org/key-data-points/environment-energy-2/, accessed May 2015.92 Lynn Bartels, “Let’s Make a Deal: How Colorado Came to a Fracking Compromise,” The Denver Post, August 23, 2014, http://
www.denverpost.com/election2014/ci_26394883/lets-make-deal-how-colorado-came-fracking-compromise, accessed May 2015.93 Krishnadev Calamur, “Voters in Texas City Approve Ban on Fracking,” NPR, November 5, 2014, http://www.npr.org/blogs/thetwo-
way/2014/11/05/361732151/voters-in-texas-city-approve-ban-on-fracking, accessed May 2015.94 Thomas Kaplan, “Citing Health Risks, Cuomo Bans Fracking in New York State,” The New York Times, December 17, 2014,
http://www.nytimes.com/2014/12/18/nyregion/cuomo-to-ban-fracking-in-new-york-state-citing-health-risks.html?_r=2, accessed May 2015.
95 Michael Wines, “Oklahoma Recognizes Role of Drilling in Earthquakes,” The New York Times, April 21, 2015, http://www.nytimes.com/2015/04/22/us/oklahoma-acknowledges-wastewater-from-oil-and-gas-wells-as-major-cause-of-quakes.html?_r=0, accessed May 2015.
96 “Preliminary Report – Irving, Texas, Earthquake Sequence,” Southern Methodist University, February 6, 2015, p. 1, http://www.smu.edu/~/media/Images/News/PDFs/Irving%20Quake%20Interim%20Report%2006feb2015.ashx?la=en, accessed May 2015.
97 Charles W. Abdalla et al., “Marcellus Shale Wastewater Issues in Pennsylvania—Current and Emerging Treatment and Disposal Technologies,” Penn State Extension College of Agricultural Sciences, March 2011, http://extension.psu.edu/natural-resources/water/marcellus-shale/waste-water/current-and-emerging-treatment-and-disposal-technologies, accessed May 2015.
98 Monika Freyman and Ryan Salmon, “Hydraulic Fracturing & Water Stress: Growing Competitive Pressures for Water,” Ceres, May 2013, p. 8, http://www.ceres.org/resources/reports/hydraulic-fracturing-water-stress-growing-competitive-pressures-for-water/at_download/file, accessed May 2015.
99 Jim Malewitz and Neena Satija, “In Oil and Gas Country, Water Recycling Can Be an Extremely Hard Sell,” The New York Times, November 21, 2013, http://www.nytimes.com/2013/11/22/us/in-oil-and-gas-country-water-recycling-can-be-an-extremely-hard-sell.html?pagewanted=1&_r=2, accessed May 2015.
AMERICA'S UNCONVENTIONAL ENERGY OPPORTUNITY 63
100 Deborah Sontag and Robert Gebeloff, “The Downside of the Boom,” The New York Times, November 22, 2014, http://www.nytimes.com/interactive/2014/11/23/us/north-dakota-oil-boom-downside.html?_r=3, accessed May 2015.
101 “Overview of Industry: Guidance/Best Practices Supporting Hydraulic Fracturing,” American Petroleum Institute, http://www.api.org/~/media/Files/Policy/Hydraulic_Fracturing/Hydraulic-Fracturing-Best-Practices.pdf, accessed May 2015.
102 Mark Jaffe, “Colorado’s Biggest Drillers Try New Techniques to Cut Oil, Gas Impact,” The Denver Post, October 5, 2014, http://www.denverpost.com/business/ci_26660219/colorados-biggest-drillers-try-new-techniques-cut-oil, accessed May 2015.
103 Kari Johnson, “Operators Turn to Reuse, Recycling,”The American Oil & Gas Reporter, May 2013, http://www.aogr.com/magazine/editors-choice/operators-turn-to-reuse-recycling, accessed April 2015.
104 “Shale & Fracking Tracker,” Vinson & Elkins website, http://fracking.velaw.com/publications-resources/u-s-state-resources/, accessed May 2015.
105 Ibid.106 “Oil & Gas—Water Quality, Water Quantity, and Air Quality,” Law Atlas, http://www.lawatlas.org/oilandgas, accessed May 2015.107 Justin Scott, “Eagle Ford water recycling thrives following change in Texas Railroad Commission rules,” Oil and Gas Journal,
August 13, 2014, http://www.ogj.com/articles/uogr/print/volume-2/issue-4/eagle-ford-water-recycling-thrives-following-change-in-texas-railroad-commission-rules.html, accessed April 2015.
108 “Railroad Commission Adopts Disposal Well Rule Amendments Today,” Railroad Commission of Texas, October 18, 2014, http://www.rrc.state.tx.us/all-news/102814b/, accessed May 2015.
109 “Ohio Announces Tougher Permit Conditions for Drilling Activities Near Faults and Areas of Seismic Activity,” Ohio Department of Natural Resources, April 11, 2014, http://www2.ohiodnr.gov/news/post/ohio-announces-tougher-permit-conditions-for-drilling-activities-near-faults-and-areas-of-seismic-activity, accessed May 2015.
110 “What We Do,” Interstate Oil & Gas Compact Commission website, http://iogcc.publishpath.com/what-we-do, accessed May 2015.111 “About Us,” FracFocus website, https://fracfocus.org/welcome, accessed May 2015.112 “About the Center for Sustainable Shale Development (CSSD),” Sustainable Shale website, https://www.sustainableshale.org/
about/, accessed May 2015.113 “Oil and Gas Task Force,” Colorado Department of Natural Resources, http://dnr.state.co.us/ogtaskforce/Pages/home.aspx,
accessed May 2015.114 “Center for Sustainable Shale Development: Performance Standards,” Center for Sustainable Development, p. 3, https://www.
sustainableshale.org/wp-content/uploads/2015/03/CSSD-Performance-Standards.pdf, accessed May 2015.115 BCG and HBS analysis; please refer to Appendix III for detailed methodology.116 Henry Hub Natural Gas Spot Price, Energy Information Administration website, http://www.eia.gov/dnav/ng/hist/rngwhhdd.htm,
accessed May 2015.117 “Fracking’s Most Wanted: Lifting the Veil on Oil and Gas Company Spills and Violations,” National Resources Defense Council,
Issue Paper, April 2015, p. 5, http://www.nrdc.org/land/drilling/files/fracking-company-violations-IP.pdf, accessed May 2015.118 “Fracking’s Most Wanted: Lifting the Veil on Oil and Gas Company Spills and Violations,” National Resources Defense Council,
Issue Paper, April 2015, p. 4, http://www.nrdc.org/land/drilling/files/fracking-company-violations-IP.pdf, accessed May 2015.119 Evan Simon, “Oklahoma Admits Oil and Gas Industry Responsible for Dramatic Rise in Earthquakes,” ABC News, April 22, 2015,
http://abcnews.go.com/US/oklahoma-admits-oil-gas-industry-responsible-dramatic-rise/story?id=30502267, accessed May 2015.120 Michael Wines, “Oklahoma Recognizes Role of Drilling in Earthquakes,” The New York Times, April 21, 2015, http://www.
nytimes.com/2015/04/22/us/oklahoma-acknowledges-wastewater-from-oil-and-gas-wells-as-major-cause-of-quakes.html?_r=0, accessed May 2015.
121 “State Oil & Gas Regulations Designed to Protect Water Resources: Reflecting the Continuing Progress of the States,” Groundwater Protection Council, February 11, 2015, p. 30, http://www.gwpc.org/sites/default/files/event-sessions/Nickolaus_Mike_2.pdf, accessed May 2015.
122 “Reducing Air Pollution from the Oil and Natural Gas Industry: EPA’s Final New Source Performance Standards and National Emission Standards for Hazardous Air Pollutants,” Environmental Protection Agency, April 17, 2012, p. 3, http://www.epa.gov/airquality/oilandgas/pdfs/20120417presentation.pdf, accessed May 2015.
123 “Maintaining Air Quality in the Eagle Ford Shale: Developing Natural Resources While Protecting Health and the Environment,” Texas Commission on Environmental Quality, Natural Outlook, November 2013, https://www.tceq.texas.gov/publications/pd/020/2013-NaturalOutlook/maintaining-air-quality-in-the-eagle-ford-shale, accessed May 2015.
124 Matthew Lepore, “Risk-Based Inspections: Strategies to Address Environmental Risk Associated with Oil and Gas Operations,” Colorado Department of Natural Resources, Oil and Gas Conservation Commission, February 2014, p. 1, http://cogcc.state.co.us/Announcements/RiskBasedInspection/RiskBasedInspectionStrategy.pdf, accessed May 2015.
125 “Responsible Care,” American Chemistry Council website, http://responsiblecare.americanchemistry.com/Performance-Results/Environment, accessed April 2015.
126 Charlie Williams, “Four Years After Deepwater Horizon Explosion, Offshore Drilling Is Safer,” Center for Offshore Safety, http://www.centerforoffshoresafety.org/after-deepwater-horizon.html, accessed May 2015.
64
127 “Center for Offshore Safety Report Highlights Industry’s Safety Performance,” Center for Offshore Safety, April 8, 2015, http://www.centerforoffshoresafety.org/annual-performance-report.html, accessed May 2015.
128 “What Is the State Review Process?” State Review for Oil & Natural Gas Environmental Regulations website, http://www.strongerinc.org/, accessed May 2015.
129 Ibid.130 State Review of Oil and Natural Gas Environmental Regulations (STRONGER) website, “Our History: Formation of STRONGER,”
http://www.strongerinc.org/content/formation-stronger, accessed May 2015.131 Industry Data, Bureau of Economic Analysis website, http://bea.gov/iTable/index_industry_gdpIndy.cfm, accessed April 2015.132 Annual Energy Review, Energy Information Administration website, http://www.eia.gov/totalenergy/data/annual/index.
cfm#consumption, accessed April 2015.133 “Sulfur Dioxide,” Environmental Protection Agency website, http://www.epa.gov/airtrends/sulfur.html, accessed May 2015.134 “Particulate Matter,” Environmental Protection Agency website, http://www.epa.gov/airtrends/pm.html, accessed May 2015.135 “U.S. Greenhouse Gas Inventory Report: 1990-2013,” Environmental Protection Agency, April 15, 2015, http://www.epa.gov/
climatechange/emissions/usinventoryreport.html, p. ES-5, accessed June 2015.136 “Energy Consumption by Sector and Source,” Energy Information Agency website, May 2014, http://www.eia.gov/forecasts/
archive/aeo14/excel/aeotab_2.xlsx, accessed May 2015.137 “Table 1.3 Primary Energy Consumption Estimates by Source,” Energy Information Administration website, http://www.eia.gov/
totalenergy/data/browser/xls.cfm?tbl=T01.02&freq=a, accessed May 2015.138 Form EIA-826, Energy Information Administration, http://www.eia.gov/electricity/data/eia826/xls/sales_revenue.xls, accessed April
2015.139 “Summary of Fuel Economy Performance,” U.S. Department of Transportation, December 15, 2014, p. 4, http://www.nhtsa.gov/
staticfiles/rulemaking/pdf/cafe/Performance-summary-report-12152014-v2.pdf, accessed May 2015.140 “Lower Electricity-Related CO2 Emissions Reflect Lower Carbon Intensity and Electricity Use,” Energy Information Administration
website, October 23, 2014, http://www.eia.gov/todayinenergy/detail.cfm?id=18511, accessed May 2015.141 “Electric Power Monthly,” Energy Information Administration website, http://www.eia.gov/electricity/monthly/epm_table_grapher.
cfm?t=epmt_1_1, accessed May 2015.142 “Clean Energy,” Energy Information Agency website, http://www.epa.gov/cleanenergy/energy-and-you/affect/air-emissions.
html#footnotes, accessed May 2015.143 “Lower Electricity-Related CO2 Emissions Reflect Lower Carbon Intensity and Electricity Use,” Energy Information Administration
website, October 23, 2014, http://www.eia.gov/todayinenergy/detail.cfm?id=18511, accessed May 2015.144 “Electric Power Monthly,” Energy Information Administration website, http://www.eia.gov/electricity/monthly/epm_table_grapher.
cfm?t=epmt_1_1, accessed May 2015.145 “AEP2-14 Early Release Overview,” Energy Information Administration website, http://www.eia.gov/forecasts/AEO/MT_electric.
cfm, accessed April 2015.146 “State Historic Tables for 2013,” Energy Information Administration website, http://www.eia.gov/electricity/data/state/annual_
generation_state.xls, accessed April 2015.147 Tom Huddleston, Jr., “California is first state with 5% of its electricity from solar,” Fortune, March 24, 2015, http://fortune.
com/2015/03/24/california-solar-energy/, accessed May 2015.148 “A More Diverse, Secure, and Sustainable US Power Supply—the Role of State RPS Programs,” US Partnership for Renewables
Energy Finance, June 2012.149 “Lazard’s Levelized Cost of Energy Analysis—Version 8.0,” Lazard, September 2014, p. 9, http://www.lazard.com/PDF/
Levelized%20Cost%20of%20Energy%20-%20Version%208.0.pdf, accessed April 2015.150 Diane Cardwell, “Solar and Wind Energy Start to Win on Price vs. Conventional Fuels,” The New York Times, November 23, 2014,
http://www.nytimes.com/2014/11/24/business/energy-environment/solar-and-wind-energy-start-to-win-on-price-vs-conventional-fuels.html?_r=1, accessed May 2015.
151 Nora Ankrum, “AE’s Solar Deal: Game Changer,” The Austin Chronicle, July 4, 2014, http://www.austinchronicle.com/news/2014-07-04/aes-solar-deal-game-changer/, accessed May 2015.
152 BCG and HBS analysis; please refer to Appendix IV for detailed methodology. 153 “Levelized Cost and Levelized Avoided Cost of New Generation Resources in the Annual Energy Outlook 2014,” Energy
Information Administration website, April 2014, http://www.eia.gov/forecasts/aeo/electricity_generation.cfm, accessed May 2014. 154 BCG North American Power Generation Capacity Model.155 “Today in Energy,” Energy Information Agency website, March 10, 2015, http://www.eia.gov/todayinenergy/detail.cfm?id=20292,
accessed May 2015.156 “Global Warming: What Should Be Done?,” The New York Times, January 29, 2015, http://www.nytimes.com/
interactive/2015/01/29/us/global-warming-poll.html, accessed May 2015.
AMERICA'S UNCONVENTIONAL ENERGY OPPORTUNITY 65
157 “Estimated % of Adults Who Think Global Warming Is Happening,” Yale Project on Climate Communication, http://environment.yale.edu/poe/v2014, accessed May 2015.
158 IREC, IEA Electricity Information 2011, LBNL, NREL database, BCG-HBS analysis. Increased demand for natural gas will increase its cost over time, and new investments in technology will be made to allow the 38 states with Renewable Portfolio Standards to meet their mandated minimum of a 41% increase in total U.S. renewable capacity between 2014 and 2030.
159 “Standards and Caps for Electricity GHG Emissions,” Center for Climate and Energy Solutions website, http://www.c2es.org/us-states-regions/policy-maps/electricity-emissions-caps, accessed May 2015.
160 “Clean Power Plan Proposed Rule,” Environmental Protection Agency website, http://www2.epa.gov/carbon-pollution-standards/clean-power-plan-proposed-rule, accessed May 2015.
161 “Fact Sheet: U.S.-China Joint Announcement on Climate Change and Clean Energy Cooperation,” White House press release, November 11, 2014, White House website, https://www.whitehouse.gov/the-press-office/2014/11/11/fact-sheet-us-china-joint-announcement-climate-change-and-clean-energy-c, accessed May 2015.
162 “US Pledges Emissions Cuts of Up to 28% Ahead of Global Climate Treaty,” The Guardian, March 31, 2015, http://www.theguardian.com/environment/2015/mar/31/us-set-to-propose-emissions-cuts-of-28-ahead-of-global-climate-treaty, accessed May 2015.
163 “Roadmap for Moving to a Low-Carbon Economy in 2050,” European Commission website, http://ec.europa.eu/clima/policies/roadmap/index_en.htm, accessed May 2015.
164 “Intended Nationally Determined Contribution,” Republic of Mexico website, http://www.semarnat.gob.mx/sites/default/files/documentos/mexico_indc.pdf, p. 2, accessed May 2015.
165 “Paris 2015: Tracking country climate pledges,” The Carbon Brief (blog), March 31, 2015, http://www.carbonbrief.org/blog/2015/03/paris-2015-tracking-country-climate-pledges/, accessed May 2015.
166 Lenore Taylor, “Australia kills off carbon tax,” The Guardian, July 16, 2014, http://www.theguardian.com/environment/2014/jul/17/australia-kills-off-carbon-tax, accessed May 2015.
167 Duncan Clark, “Has the Kyoto protocol made any difference to carbon emissions?” The Guardian, November 26, 2012, http://www.theguardian.com/environment/blog/2012/nov/26/kyoto-protocol-carbon-emissions, accessed May 2015.
168 BCG North American Power Generation Capacity Model.169 Eric Wolff, “EPA chief: Cheap natural gas enabled clean air rules,” SNL Energy Power Daily, April 29, 2015, via ProQuest,
accessed May 2015.170 John Larsen et al., “Remaking American Power: Potential Energy Market Impacts of EPA’s Proposed GHG Emission Performance
Standards for Existing Electric Power Plants,” Rhodium Group and the Center For Strategic & International Studies, November 2014, http://rhg.com/wp-content/uploads/2014/11/RemakingAmericanPower.pdf, accessed May 2015.
171 U.S. Energy Information Administration, “Electric Power Monthly with Data for February 2015,” April 27, 2015, http://www.eia.gov/electricity/monthly/epm_table_grapher.cfm?t=epmt_1_1, accessed May 2015.
172 John Larsen et al., “Remaking American Power: Preliminary Results,” Rhodium Group and Center for Strategic and International Studies: Energy & National Security Program, July 24, 2014, pp. 17 & 19, http://csis.org/files/attachments/140724_RemakingAmericanPower.pdf, accessed May 2015.
173 John Larsen et al., “Remaking American Power: Preliminary Results,” Rhodium Group and Center for Strategic and International Studies: Energy & National Security Program, July 24, 2014, p. 20, http://csis.org/files/attachments/140724_RemakingAmericanPower.pdf, accessed May 2015.
174 Hans Poser, Jeffrey Altman, Felix ab Egg, Andreas Granata, and Ross Board, “Development and Integration of Renewable Energy: Lessons Learned From Germany,” Finadvice, July 2014, http://www.finadvice.ch/files/germany_lessonslearned_final_071014.pdf, accessed April 2015.
175 “Electricity prices by type of user,” Eurostat, March 3, 2015, http://ec.europa.eu/eurostat/tgm/table.do?tab=table&plugin=1&language=en&pcode=ten00117, accessed May 2015.
176 Stefan Nicola, “Renewables Takes Top Share of Germany Power Supply in First,” Bloomberg Business, October 1, 2014, http://www.bloomberg.com/news/articles/2014-10-01/german-renewables-output-tops-lignite-for-first-time-agora-says, accessed May 2015.
177 Hans Poser et al., “Development And Integration Of Renewable Energy: Lessons Learned From Germany,” Finadvice, July 2014, p. 41, http://www.finadvice.ch/files/germany_lessonslearned_final_071014.pdf, accessed May 2015.
178 Umwelt Bundesamt, “Greenhouse gas emissions rise again slightly in 2013, by 1.2 per cent: Coal-generated electricity boosts emissions—jeopardizes national climate protection goal,” press release, March 10, 2014, http://www.umweltbundesamt.de/en/press/pressinformation/greenhouse-gas-emissions-rise-again-slightly-in, accessed May 2015.
179 Average wind LCOEs still range from $55 to $90/MWh, versus LCOEs of about $45/MWh for new natural gas combined cycle plants, while average solar LCOEs range from $85 to $125/MWh. Source: BCG and HBS calculations. Please refer to Appendix IV for detailed methodology.
180 Kristina M. Johnson, “Strategic Technology Energy Plan,” U.S. Department of Energy, Office of the Undersecretary, September 30, 2010.
181 Ibid.

66
182 Steven Macmillan, Alexander Antonyuk and Hannah Schwind, “Coal to Gas Competition in the U.S. Power Sector,” International Energy Agency Insights Series 2013, p. 14, http://www.iea.org/publications/insights/coalvsgas_final_web.pdf, accessed May 2015.
183 Peter Kokopeli, Jeremy Schriefels, and Reynaldo Forte, “Assessment of startup period at coal-fired electric generating units,” U.S. Environmental Protection Agency, Office of Air and Radiation, July 17, 2013, http://www.epa.gov/mats/pdfs/matsstartstsd.pdf, accessed May 2015.
184 Brendan Kirby, Ookie Ma and Mark O’Malley, “The Value of Energy Storage for Grid Applications,” National Renewable Energy Laboratory, March 2013, p. 5, http://www.nrel.gov/docs/fy13osti/58465.pdf, accessed April 2015.
185 Working Group I Contribution to the IPCC Fifth Assessment Report, “Climate Change 2013: The Physical Science Basis, Final Draft Underlying Scientific-Technical Assessment,” Intergovernmental Panel on Climate Change, September 30, 2013, p. 58, http://www.climatechange2013.org/images/uploads/WGIAR5_WGI-12Doc2b_FinalDraft_Chapter08.pdf, accessed May 2015.
186 Ibid.187 Ramon Alvarez et al., “Greater focus needed on methane leakage from natural gas infrastructure,” Proceedings of the National
Academy of Science of the United States of America, April 24, 2012, vol. 109, no. 17, p. 6437, p. 3, http://www.pnas.org/content/109/17/6435.full, accessed May 2015.
188 Environment Defense Fund website, Frequently Asked Questions: UT Methane Study http://www.edf.org/climate/methane-studies/UT-study-faq#9, accessed May 2015.
189 Eric D. Larson, “Natural Gas & Climate Change,” Climate Central, May 2013, p. 1, http://assets.climatecentral.org/pdfs/NaturalGas-and-ClimateChange.pdf, accessed May 2015.
190 David Allen et al., “Measurements of methane emissions at natural gas production sites in the United States,” Proceedings of the National Academy of Sciences of the United States of America, vol. 110, no. 44 (2013), http://www.pnas.org/content/110/44/17768.full.pdf, accessed May 2015.
191 “Economic Analysis of Methane Emission Reduction Opportunities in the U.S. Onshore Oil and Natural Gas Industries,” ICF International Report prepared for Environmental Defense Fund, March 2014, p. 11, https://www.edf.org/sites/default/files/methane_cost_curve_report.pdf, accessed May 2015.
192 “A More Diverse, Secure, and Sustainable US Power Supply—the Role of State RPS Programs.” US Partnership for Renewables Energy Finance, June 2012.
193 IPCC, 2014: Summary for Policymakers. In: Climate Change 2014: Mitigation of Climate Change. Contribution of Working Group III to the Fifth Assessment Report of the Intergovernmental Panel on Climate Change [Edenhofer, O., R. Pichs-Madruga, Y. Sokona, E. Farahani, S. Kadner, K. Seyboth, A. Adler, I. Baum, S. Brunner, P. Eickemeier, B. Kriemann, J. Savolainen, S. Schlömer, C. von Stechow, T. Zwickel and J.C. Minx (eds.)], p. 12, Cambridge University Press, Cambridge, United Kingdom and New York, NY, USA. (https://www.ipcc.ch/pdf/assessment-report/ar5/wg3/ipcc_wg3_ar5_summary-for-policymakers.pdf), accessed May 2015.
194 BCG and HBS analysis; please refer to Appendix V for detailed methodology.195 Natural Gas Consumption by End Use Sector and Census Division, Table 135, Energy Information Agency website, http://www.eia.
gov/forecasts/aeo/er/tables_ref.cfm, accessed May 2015.196 American Gas Association, “Distribution and Transmission Miles of Pipeline,” https://www.aga.org/sites/default/files/
section5divider.pdf; U.S. Energy Information Administration, “Table 8: Natural Gas Supply, Disposition, and Prices” and "Natural Gas Storage Capacity," Annual energy Outlook 2015, http://www.eia.gov/forecasts/aeo/tables_ref.cfm; The INGAA Foundation, “Natural Gas Pipeline and Storage Infrastructure Projections through 2030,” October 20, 2009, http://www.ingaa.org/File.aspx?id=10509; BCG-HBS analysis; all accessed May 2015.
197 Denver Nicks, “Polar Vortex Sends Natural Gas Prices on Roller-Coaster,” Time, January 7, 2014, http://science.time.com/2014/01/07/polar-vortex-sends-natural-gas-prices-on-rollercoaster/, accessed May 2015.
198 The National Environmental Protection Act (NEPA) gives the lead federal agency authority to set time limits for the development and review of the Environmental Impact Statements that are required by NEPA. Council on Environmental Quality Executive Office of the President, “Regulations For Implementing The Procedural Provisions of The National Environmental Policy Act, 2005, p. 6, http://energy.gov/sites/prod/files/NEPA-40CFR1500_1508.pdf, accessed May 2015.
199 Megan Rogers, “Laborers, business groups support controversial natural gas pipelines,” Albany Business Review, April 14, 2015, http://www.bizjournals.com/albany/news/2015/04/14/laborers-business-groups-support-controversial.html?page=all, accessed May 2015.
200 Robin K. Cooper, “Hundreds turn out for hearing on controversial gas line project,” Albany Business Review, January 15, 2015, http://www.bizjournals.com/albany/morning_call/2015/01/hundreds-turn-out-for-hearing-on-controversial-gas.html?page=all, accessed May 2015.
201 Burning Glass analysis; please refer to Appendix II for detailed methodology. 202 Accenture, Burning Glass Technologies, and Harvard Business School, “Bridge the Gap: Rebuilding America’s Middle Skills,”
Harvard Business School U.S. Competitiveness Project, November 2014, http://www.hbs.edu/competitiveness/research/Pages/research-details.aspx?rid=66, accessed May 2015.
203 America’s Natural Gas Alliance, “Workforce Development for the Natural Gas Industry,” http://anga.us/issues-and-policy/jobs/workforce-development#.VTAFEvnF9nc, accessed April 2015.
AMERICA'S UNCONVENTIONAL ENERGY OPPORTUNITY 67
204 Colorado School of Mines, “ExxonMobil and GE Join University Initiative to Help Bring Latest Natural Gas Best Practices to Shale Development,” news release, March 8, 2012, http://www.mines.edu/ExxonMobil-and-GE-join-university-initiative-to-help-bring-latest-natural-gas-best-practices-to-shale-development, accessed April 2015.
205 “Community Engagement Guidelines,” American Petroleum Institute, July 2014, http://www.api.org/~/media/files/policy/exploration/100-3_e1.pdf, accessed May 2015.
206 Matthew Lepore, “Risk-Based Inspections: Strategies to Address Environmental Risk Associated with Oil and Gas Operations,” Colorado Department of Natural Resources, Oil and Gas Conservation Commission, February 2014, http://cogcc.state.co.us/Announcements/RiskBasedInspection/RiskBasedInspectionStrategy.pdf, accessed May 2015.
207 FracFocus.org, “About Us,” https://fracfocus.org/welcome, accessed May 2015.208 “Natural Gas Consumption by End Use Sector and Census Division, Table 135,” Energy Information Agency website, http://www.
eia.gov/forecasts/aeo/er/tables_ref.cfm, accessed May 2015.209 Jeffrey Rissman and Maxine Savitz, “Unleashing Private-Sector Energy R&D, Insights from Interviews with 17 R&D Leaders,”
American Energy Council, January 2013, p. 30, http://americanenergyinnovation.org/wp-content/uploads/2013/01/Unleashing-Private-RD-Jan2013.pdf, accessed May 2015.
210 American Association for the Advancement of Science, “R&D Budget and Policy Program,” May 2014, http://www.aaas.org/page/historical-trends-federal-rd, accessed May 2015.
211 Ibid.212 Kristina M. Johnson, “Strategic Technology Energy Plan,” U.S. Department of Energy, Office of the Undersecretary, September
30, 2010.213 “Peak Reliability (formerly part of the Western Electricity Coordinating Council), Western Interconnection Synchrophasor
Program,” U.S. Department of Energy, October 2014, p. 1, https://www.smartgrid.gov/sites/default/files/pdfs/project_desc/Peak-Reliability-%28WECC%29-Final-Project-Description.pdf, accessed May 2015.
214 Public Utility Commission of Texas CREZ Transmission Program Information Center, PUCT–CREZ home page, http://www.texascrezprojects.com/, accessed May 2015.
215 Ibid.216 Sarah Smith, “Conflicting studies on fracking safety ‘stoking mistrust,’ legislator says,” SNL, April 23, 2015, https://www.snl.
com/InteractiveX/ArticleAbstract.aspx?id=32309433, accessed May 2015.217 IMPLAN Group, LLC, IMPLAN System (data and software), www.IMPLAN.com218 Frances Day, “Principles of Impact Analysis & IMPLAN Applications,” www.IMPLAN.com219 “Table 14: Oil and Gas Supply, Reference, U.S. Energy Information Administration,” Annual Energy Outlook 2014 with
projections to 2040, U.S. Energy Information Administration, May 2014, http://www.eia.gov/oiaf/aeo/tablebrowser/#release=AEO2014&subject=0-AEO2014&table=14-AEO2014®ion=0-0&cases=full2013full-d102312a,ref2014-d102413a, accessed April 2015.
220 “Supplying the Unconventional Revolution: Sizing the Unconventional Oil and Gas Supply Chain, Appendix A. Methodology and Approach,” IHS Economics, September 2014.
221 “Shale Gas, Competitiveness and New U.S. Chemical Industry Investment: An Analysis Based on Announced Projects,” American Chemistry Council, Economics & Statistics Department, May 2013, http://chemistrytoenergy.com/sites/chemistrytoenergy.com/files/shale-gas-full-study.pdf, accessed May 2015.
222 National Income and Product Accounts Tables, Bureau of Economic Analysis website, http://www.bea.gov/iTable/iTable.cfm?ReqID=9&step=1#reqid=9&step=1&isuri=1, accessed April 2015.
223 “America’s New Energy Future: The Unconventional Oil and Gas Revolution and the US Economy, Volume 3: A Manufacturing Renaissance—Main Report,” IHS Economics, September 2013, p. 51.
224 “Economic Benefits of Lifting the Crude Oil Export Ban,” NERA Economic Consulting, September 9, 2014, p. 143, http://www.nera.com/content/dam/nera/publications/2014/NERA_Crude_Oil_Export_Study_Sept_2014_FINAL.pdf, accessed April 2015.
225 “Updated Macroeconomic Impacts of LNG Exports from the United States,” NERA Economic Consulting, March 24, 2014, p. 104, http://www.nera.com/content/dam/nera/publications/archive2/PUB_LNG_Update_0214_FINAL.pdf, accessed April 2015.
226 “U.S. Natural Gas Wellhead Price,” Energy Information Administration website, http://www.eia.gov/dnav/ng/hist/n9190us3A.htm, accessed May 2015.
227 Historical NGL to crude oil price ratios from Wells Fargo Securities, Equity Research Department; prices as of May 31, 2014. 228 Harold L. Sirkin, Michael Zinser, and Justin Rose, “Made in America, Again: How Cheap Natural Gas Benefits the Budgets of U.S.
Households,” BCG Perspectives by The Boston Consulting Group, January February 3, 2014, https://www.bcgperspectives.com/content/articles/lean_manufacturing_energy_environment_how_cheap_natural_gas_benefits_budgets_us_households/, accessed May 2015.
229 Mike Munsell, “Global PV Module Pricing to Stay Flat in 2014, Polysilicon Pricing to Increase 25%,” Green Tech Media, November 14, 2013, http://www.greentechmedia.com/articles/read/global-pv-prices-will-increase-nine-percent-in-2014, accessed May 2015.
68
230 Ash Sharma, “The Future Development of the Solar Inverter Power Optimizer & Microinverter Market,” Power Sources Manufacturers Association, February 9, 2012, p. 5, http://www.psma.com/sites/default/files/uploads/tech-forums-alternative-energy/presentations/2012-apec-252-future-development-solar-inverter-power-optimizer-microinverter-markets.pdf, accessed May 2015.
231 Stephen Smith and MJ Shiao, “Solar PV Balance of System (BOS) Markets: Technologies, Costs and Leading Companies, 2013–2016,” Green Tech Media, November 15, 2012, http://www.greentechmedia.com/research/report/solar-pv-bos-2013, accessed May 2015.
232 “Price Decline of PV Inverters,” The Boston Consulting Group, November 2013.233 Clayton Handleman, John Bower, and Paul Williams, “Conditions for PV Relevance in the Global Energy Future,” Heliotronics,
March 25, 2002, p. 2, http://www.heliotronics.com/papers/Relevance_of_PV_2002_03_25.pdf, accessed May 2015.234 “The Outlook for Renewable Energy in America,” American Council on Renewable Energy, 2014, p. 16, http://www.acore.org/files/
pdfs/ACORE_Outlook_for_RE_2014.pdf, accessed May 2015.235 “Updated Capital Cost Estimates for Utility Scale Electricity Generating Plants,” Energy Information Administration, April 2013,
p. 10, http://www.eia.gov/forecasts/capitalcost/pdf/updated_capcost.pdf, accessed May 2015.236 Eric Lantz, Ryan Wiser, and Maureen Hand, “IEA Wind Task 26: Past and Future Cost of Wind Energy,” International Energy
Agency, May 2012, p. 18, https://www.ieawind.org/index_page_postings/WP2_task26.pdf, accessed May 2015.237 Tom Randall, “Wind’s ‘Learning Curve,’” Bloomberg News, March 14, 2012, http://go.bloomberg.com/multimedia/wind-
innovations-drive-down-costs-stock-prices/, accessed May 2015.238 “STEP 2050 Energy Scenarios,” The Boston Consulting Group, prepared for the Department of Energy, November 2010.239 “Wind Generation Records & Turbine Productivity,” American Wind Energy Association website, 2013, http://www.awea.org/
generationrecords, accessed May 2015.240 “Updated Capital Cost Estimates for Utility Scale Electricity Generating Plants,” Energy Information Administration, April 2013,
p. 10, http://www.eia.gov/forecasts/capitalcost/pdf/updated_capcost.pdf, accessed May 2015.241 Ibid.242 “Table 8.1: Average Operating Heat Rate for Selected Energy Sources," Energy Information Administration website, 2013, http://
www.eia.gov/electricity/annual/html/epa_08_01.html, accessed May 2015.243 “Generation Technology Assessment & Production Cost Analysis,” Entergy, July 31, 2012, p. 3, http://entergy-arkansas.com/
content/transition_plan/gen_tech_assessment.pdf, accessed May 2015.244 “Annual Energy Outlook 2014 with Projections to 2040,” Energy Information Administration, April 2014, p. A-6, http://www.eia.
gov/forecasts/aeo/pdf/0383(2015).pdf, accessed May 2015.245 Sarah Ladislaw, John Larsen, Whitney Ketchum, Michelle Melton, Shashank Mohan, and Trevor Houser, “Remaking American
Power,” Center for Strategic & International Studies, November 18, 2014.246 Pamela Spath and Margaret Mann, “Life Cycle Assessment of a Natural Gas Combined-Cycle Power Generation System,” National
Renewables Energy Laboratory, September 2000, p. 4, http://library.umac.mo/ebooks/b28020261.pdf, accessed May 2015.247 “Gas-Fired Power,” International Energy Association Energy Technology Systems Analysis Programme, April 2010, http://www.
iea-etsap.org/web/e-techds/pdf/e02-gas_fired_power-gs-ad-gct.pdf, accessed May 2015.248 Energy Velocity Power database, Ventyx.

About the authors:
Michael E. Porter is an economist, scholar, author, and teacher. He is a leading authority on competition, strategy, and the relationship between environmental performance and company growth and profitability.
David S. Gee is a Partner at BCG and leads BCG’s North American Energy Practice Area, consulting with clients across the energy sector. He has over 36 years’ experience in the energy industry and previously held senior operating roles at AES Corporation, PG&E Corporation, and Baker Hughes.
Gregory J. Pope is a Principal in BCG’s Energy and Strategy and Sustainability Practice Areas. He leads client engagements in power, oil and gas, renewables, and economic development, and has experience across the U.S. and Middle East.
About the research teams:
BCG: Alan G. Thomson, Senior Partner, and Justin R. Rose, Partner also played leadership roles. This research was informed by the key contributions of: Thomas P. Gerrity (III), Ida B. Hempel, Evan A. Hindman, B. Charles Klene, David W. Matthews, Erin C. Potocki, and Christopher W. Seewald.
HBS: Manjari Raman, Program Director and Senior Researcher, U.S. Competitiveness Project, played a leadership role. This research was informed by the key contribution of Ilyes Kamoun, Research Associate. This research and conference effort was supported by: Gabriel P. Ellsworth, Alexandra Houghtalin, Ann B. Lombard, and Marie V. Mekosh.
This report is an independent research effort by HBS and BCG, with no outside funding support. BCG provided pro-bono, in-kind support and expertise to take on this complex topic with HBS. The authors would like to gratefully acknowledge that this research effort would not be possible without the support of:
BCG: Richard I. Lesser, President & Chief Executive Officer, and Iván Martén, Global Energy Practice Area Leader.
HBS: Nitin Nohria, Dean of the Faculty. The faculty team members of the HBS U.S. Competitiveness Project, who helped lay the foundation of this important research topic.
The authors are very grateful for:
• The generous support from Burning Glass on job postings analytics.
• The time and effort of the Steering Committee members and their teams.
• The participation of more than 80 business leaders, not-for-profit leaders, policy leaders, academics and thought leaders who convened at HBS on March 11–12, 2015, to review and critique the research.
Published: June 2015.
Report design: Terberg Design, LLC.
Please direct inquires to Gregory Pope at BCG ([email protected]) or Manjari Raman at Harvard Business School ([email protected]).